❌

Normal view

'Freakish' discovery of 9 million-year-old capybara tooth supports idea that Atacama wasn't always a desert

8 October 2026 at 22:19

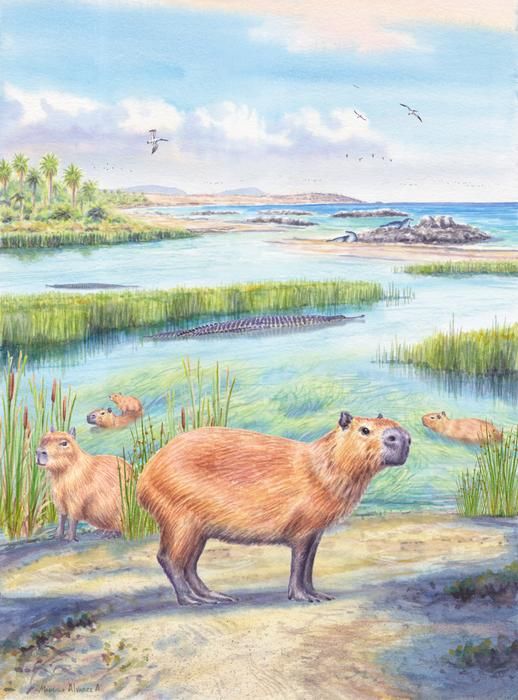
An illustration of several small four-legged mammals next to a river.

An illustration of ancient capybaras enjoying coastal wetlands, which may have looked somewhat like the Atacama Desert around 9 million years ago. (Image credit: Mauricio Alvarez)

Researchers have discovered a roughly 9 million year old tooth belonging to a large, water-loving relative of modern day capybaras in the Atacama Desert of northern Chile. The fossilized molar adds to previous evidence suggesting that it's unlikely the Atacama, one of the driest places on Earth, was continuously dry for the last 40 million years.

The Atacama Desert, possibly the oldest desert on Earth, takes up the northern third of Chile. It's bounded by the Chilean Coast Range to the west, which blocks rain from the Pacific Ocean, and the enormous Andes to the east, which obstruct rain from the Atlantic Ocean. The driest part of the desert's hyperarid region gets less than 0.08 inches (2 mm) of rainfall a month.

Recent research estimates the Atacama's hyperarid core started forming between 47.8 million and 33.9 million years ago, in the Mid- to Late-Eocene, 20 million years before the Andes formed. It suggests the mountain ranges weren't the cause for the desert's aridification, and may have only intensified it.

Capybaras (Hydrochoerus hydrochaeris) β€ͺ—‬ the world's largest rodent β€ͺ—‬ exclusively live close to stable freshwater sources and feed on plants that also require water to grow, so the discovery of an extinct capybara relative (Hydrochoerus Cardiatherium) tooth in the Atacama Desert is very strange.

"Finding a capybara tooth in a marine deposit in what today is one of the driest regions on Earth is just freakish," Priscilla Martinez, a geoscientist at the University of Arizona and co-author of a new paper describing the discovery, said in a statement.

Capybaras are native to South America, although today, they are not found in Chile, where the tooth was unearthed, according to the International Union for Conservation of Nature (IUCN).

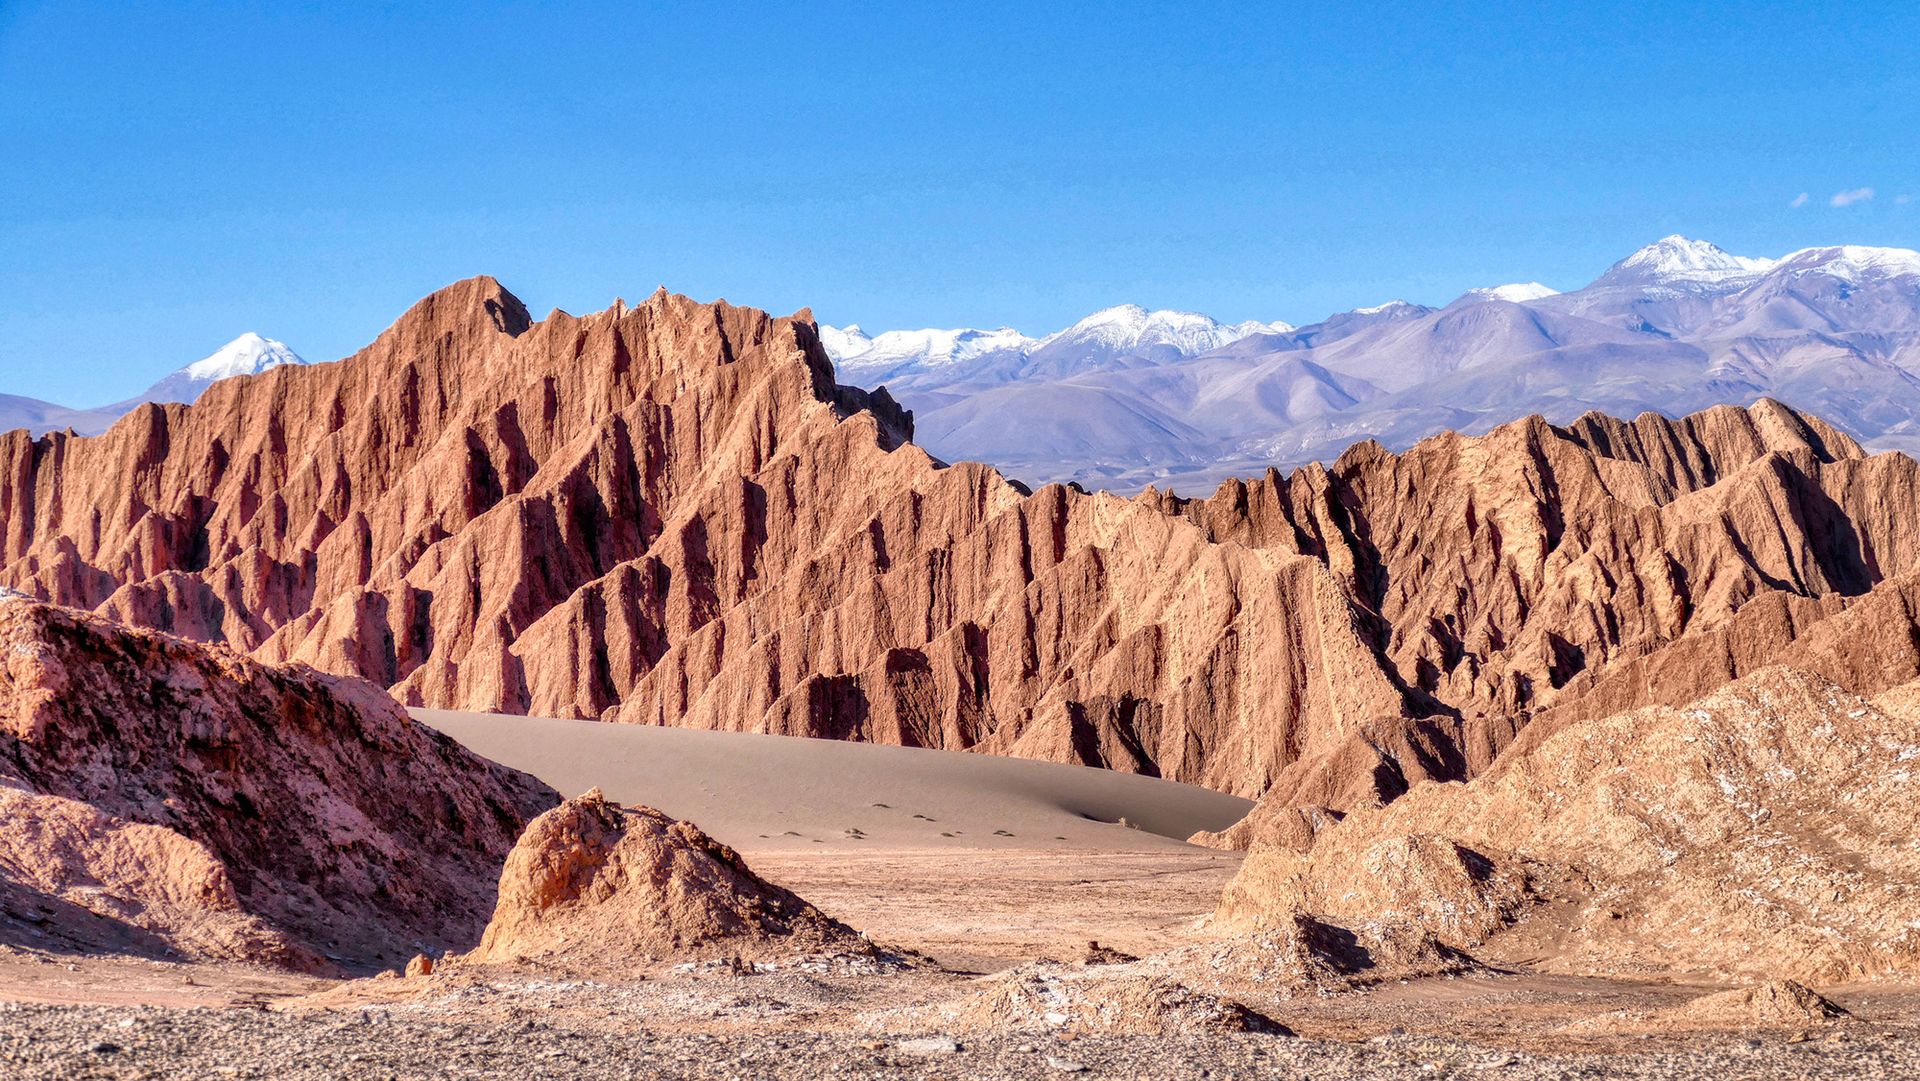
A series of jagged cliffs seen in the desert

Part of the Atacama Desert called Valle de La Luna, named because of the region's resemblance to the moon. (Image credit: Piero Damiani via Getty Images)

The tooth isn't the only clue that the Atacama was a wetter place in the late Miocene. Researchers found it in a layer holding the remains of a shallow marine environment that existed between 7 million and 10 million years ago, according to the statement. And they've also found microscopic pieces of plants, known as phytoliths, revealing that palm trees, grasses, gingers and other flowering plants grew there in what may have been a subtropical forest.

These findings and others are part of a growing body of evidence that the Atacama Desert was once wet enough for crocodiles and freshwater fish to thrive and palms to grow. The new study, published Sept. 5 in the journal Scientific Reports, shows that capybara relatives lived there as well during the late Miocene, which, because they are semiaquatic animals, is further evidence to support the hypothesis of a sporadically moist Atacama.

The researchers aren't sure how exactly capybaras moved into the Atacama Desert. Although there were capybaras in South America at the time, the Andes created an 18,000-foot-high (5,500 meters) barrier between their current habitats and the site where the tooth was found. The researchers theorized that, instead of traversing the mountains, the ancient capybaras migrated along the western coast of South America, following wetlands, rivers and other water sources.

According to Samantha Hopkins, an Earth sciences professor at the University of Oregon who was not involved in the study, it's unlikely the tooth found its way to the site without capybaras living there.

"If you wanted to find a way that this capybara could be here while the Atacama was still as dry as it is today, you'd have a hard row to hoe," she told Live Science in an email, because the size of the tooth makes it hard to transport it long distances. The desert wind couldn't have blown it such a long way, and while large carcasses can float down waterways for miles, "if you're going to invoke a large enough waterway to do this, you've demonstrated that the Atacama wasn't as dry as it is today anyway."

The central Pacific Ocean just broke a temperature record. Experts say it might signal a new kind of El NiΓ±o.

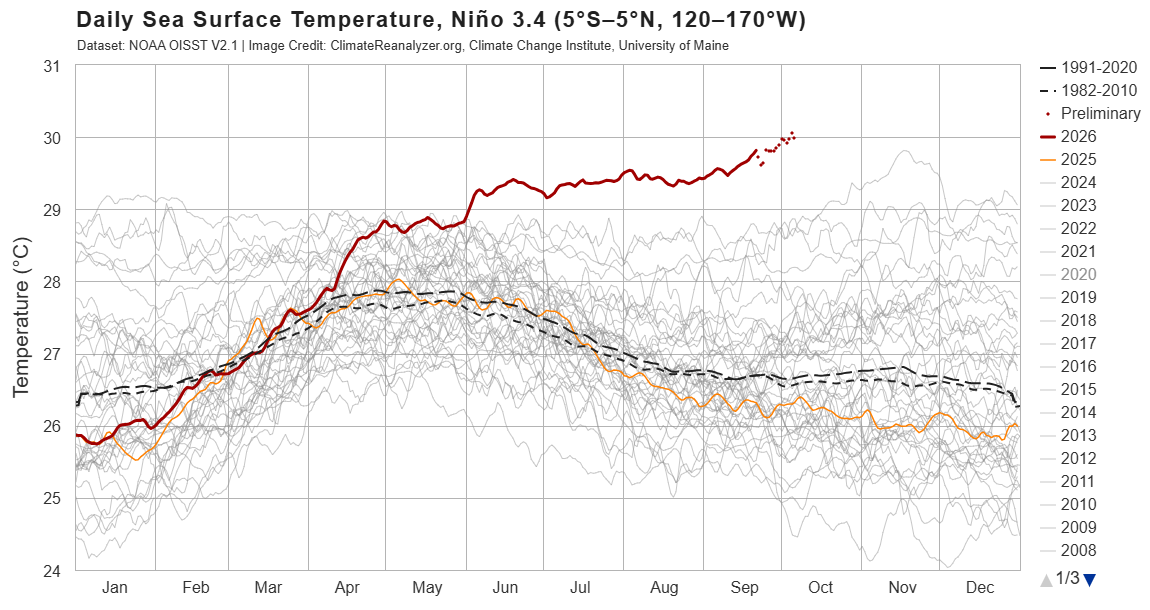
The sea surface temperature in a key section of the central equatorial Pacific Ocean has now surpassed all previous temperatures on record for this region, exceeding 86 degrees Fahrenheit (30 degrees Celsius) for the first time, according to preliminary data released Monday (Oct. 5).

Specifically, these temperatures occurred in the NiΓ±o 3.4 region, located between 5 degrees north and 5 degrees south latitude, and 120 degrees west and 170 degrees west longitude. Researchers use this region to monitor the progression of El NiΓ±o, the warm phase of a multiyear natural climate pattern that's currently in full swing and steadily intensifying. But how significant is this new record, and could it be a harbinger of increasingly extreme El NiΓ±o events in the future?

At this time of the year, sea surface temperatures above 86 F are common in the western Pacific warm pool, a mass of water located northeast of Australia. But the NiΓ±o 3.4 region is nowhere near the warm pool and usually has much cooler temperatures. This latest data indicates "an exceptionally warm state for this part of the tropical Pacific," said Jin-Yi Yu, a professor of Earth system science at the University of California, Irvine.

"If the reported daily El NiΓ±o 3.4 temperature above 30Β°C is verified in the observational dataset, it would be an extraordinary record," Yu told Live Science in an email.

Other experts agreed. A NiΓ±o 3.4 sea surface temperature above 86 F is a "very significant" new record, Timothy Osborn, a professor of climate science and the director of the Climatic Research Unit at the University of East Anglia in the U.K., told Live Science in an email. Mat Collins, a professor of climate systems and the head of mathematics and statistics at the University of Exeter in the U.K., also called the temperature "very significant" in an email to Live Science.

But it's important to note that absolute temperature is not the standard way of measuring the strength of El NiΓ±o, Osborn said. Researchers usually assess El NiΓ±o intensity by comparing sea surface temperatures in the NiΓ±o 3.4 region with the average conditions there or with sea surface temperatures across the rest of the tropics, with the latter method removing a skew in the data caused by the climate-change-induced heating of oceans globally.

"On those measures, the current event is already close to being the strongest [El NiΓ±o] on record and will likely soon exceed previous records given that the event is forecast to strengthen further," Osborn said. "For some measures, it is already record-breaking for the time of year."

"Super" El NiΓ±o

El NiΓ±o events happen when warm water in the western tropical Pacific Ocean migrates eastward along the equator, toward South America. This boosts global temperatures, triggering heavy rainfall and floods in regions like East Africa, southern China, the southern U.S. and the Pacific coast of equatorial South America, while places such as Indonesia, the Philippines, southern Africa and northern South America experience drought.

"El Nino impacts are greatest across the tropics and in the lands around the Pacific Ocean," Osborn said. "An El Nino with record strength is very significant because it greatly disrupts the atmospheric circulation which controls the weather patterns including patterns of rainfall."

As of Oct. 6, the temperature anomaly in the NiΓ±o 3.4 region is 6 F (3.34 C) above average and rising. A typical El NiΓ±o increases NiΓ±o 3.4 temperatures by a maximum of 1.8 to 3.6 F (1 to 2 C) above average, so the current condition is "exceptionally large," Yu said. "This indicates that a very strong, or what is sometimes called a 'super,' El NiΓ±o is developing."

Graph showing sea surface temperature in a key region of the central Pacific over time in 2026 and other years.

Sea surface temperatures in the NiΓ±o 3,4 region exceeded 86 degrees F (30 C) on Oct. 5. (Image credit: ClimateReanalyzer.org (CC BY 4.0))

This year's El NiΓ±o is being amplified by human-driven global warming, which has increased background ocean temperatures. As a result, it's likely that sea surface temperatures in the NiΓ±o 3.4 region will keep rising over the coming weeks and peak in November or December, before declining again in 2027, Collins said.

"The NiΓ±o 3.4 anomaly is very likely to remain extremely large and may increase further," Yu said, echoing forecasters' suggestions that it could reach 7.2 F (4 C) by November.

A new kind of El NiΓ±o?

The world is on the brink of crossing a critical warming threshold, raising the question of whether the current conditions can be considered a new normal for future El NiΓ±os.

While it's likely that future El NiΓ±os will be more extreme than past ones, on average, not every El NiΓ±o will be record-breaking and as dramatic as the one unfolding now, because these events tend to be very variable, Collins said.

As climate change intensifies, the big worry is that certain regions will be primed for extreme conditions even before an El NiΓ±o strikes, Osborn said. For example, regions that are getting drier due to global warming could see catastrophic droughts if they overlap with areas that experience dryness during El NiΓ±o events. Likewise, places that are getting wetter could see worse deluges of rain and flooding if they coincide with areas with higher precipitation during El NiΓ±os. But that doesn't necessarily mean extreme El NiΓ±os are the new normal, he said.

Instead, the location and duration of El NiΓ±o events may be transforming, Yu suggested. "In research by my group and collaborators, we have documented changes not only in El NiΓ±o intensity, but also in where the warming occurs and how long events persist," he said.

Yu and his colleagues helped to introduce the idea that we are seeing the emergence of two distinct types of El NiΓ±o: the eastern Pacific El NiΓ±o and the central Pacific El NiΓ±o. "Many El NiΓ±o events in the earlier observational record were dominated by warming in the eastern tropical Pacific, whereas Central Pacific El NiΓ±o events became much more prominent in recent decades," he explained, adding that El NiΓ±os have also been lasting longer.

Global warming may be creating a new kind of El NiΓ±o by strengthening atmosphere-ocean interactions in the subtropical Pacific, Yu said. If these interactions combine with processes in the equatorial Pacific, where eastern Pacific El NiΓ±os emerge, they might trigger unusually strong events with extreme heating in the central Pacific.

"That provides a physical reason to take the possibility of more frequent extreme El NiΓ±o events in a warmer climate seriously," Yu said. "But I would distinguish that from saying that every El NiΓ±o will become progressively stronger."

'We stocked an RV as an emergency bugout vehicle': Readers share how prepared they are for a disaster

7 October 2026 at 17:23

As the "super" El NiΓ±o is predicted to bring heavier storms and flooding to the U.S., experts recommend stocking up on food and other supplies. Floods and other disasters, like wildfires, are on the rise due to climate change, making disaster preparedness essential.

But how prepared are people for a disaster?

Preparedness levels vary; some people keep an emergency kit full of food and first-aid supplies, while others have a planned meeting place designated as a safe space. Having a plan can help people feel better about unpredictable events. But not everyone has thought this far ahead.

Live Science recently asked readers how prepared they are for a natural disaster and what sort of plans or supplies they have on hand. Over 130 people responded to the poll, with 51% of readers choosing "I've got an emergency kit ready for when the unexpected happens."

The comments reflected this majority, as one reader wrote, "We're on the edge of an area at risk for grass fires, so we bought/stocked an RV as an emergency bugout vehicle. Felt extreme initially, less so as time goes by. Gives us 3-5 days of margin before we need to resupply, with food, water and first aid for people and dogs."

Another commenter responded to the rest of the comments, writing, "This is just the begining [sic]. Get a greenhouse, plant food, learn to harvest water, build an outside toilet (for later), learn to be self sufficient. trade with your neighbors. Plant fruit trees, get solar panels and an electric transporation (bike, car whatever). Keep a de humidifier in your home. it's back to the 1930ie[s]."

Do you agree with these readers? Let us know in the comments section.

Lost 'heart' of the Colorado River shines like a silver serpent in Utah

6 October 2026 at 11:30
QUICK FACTS

Where is it? Lake Powell, Utah [37.47537121, -110.70474226]

What's in the photo? A "sunglint" transforming a reservoir into a giant silver river

Who took the photo? An unnamed astronaut on board the International Space Station

When was it taken? 2016

This eye-catching astronaut photo mosaic shows a rare "sunglint" transforming a snaking reservoir into a giant silver river.

The winding waterway at the heart of this image is a section of Lake Powell in southern Utah. The artifical reservoir starts around 70 miles (110 kilometers) southwest of the town of Moab and ends roughly 60 miles (100 km) northeast of the Grand Canyon in Arizona. When full, Lake Powell holds up to 1.2 billion cubic feet (33.3 million cubic meters) of water, making it the second-largest reservoir in the U.S. β€” close behind the nearby Lake Mead, which stretches across the Arizona-Nevada border.

Lake Powell is located on the Colorado River, inside a steep ravine known as Glen Canyon. The reservoir emerged in the 1960s, following the construction of the Glen Canyon Dam, which caused water levels to rise by around 200 feet (60 meters) over the next two decades. In addition to generating hydroelectric power, the artificial lake has become a popular tourist destination. (Lake Mead is also located along the Colorado River and was created by the construction of the Hoover Dam.)

This image mosaic, which stitches together several astronaut photos into a single image, was captured during a sunglint, according to NASA's Earth Observatory. This phenomenon occurs when sunlight bounces off a reflective surface directly into the line of sight of an observer in orbit, such as a satellite or an astronaut, giving the object a metallic, mirror-like gleam.

Normally, this effect would be visible only across a small section of the lake. But by combining photos taken as the sunglint moved along the reservoir's length, the entire body of water was illuminated.

A photo of the Glen Canyon Dam

Lake Powell was created by the Glen Canyon Dam in northern Arizona. It took around 17 years for the reservoir to fully fill after the barrier's construction was completed in 1966. (Image credit: Adbar via Wikimedia)

The reservoir is named after John Wesley Powell, an explorer and former director of the U.S. Geological Survey, who mapped out Glen Canyon and other parts of the Colorado River in the late 1860s. Powell was particularly captivated by Glen Canyon, which contained a "labyrinth of overhanging cliffs, hanging gardens, sweeping river bends, and natural arches set amidst a backdrop of colorful buttes and mesas," Earth Observatory representatives wrote.

Powell later described his recollections of the canyon. "Past these towering monuments, past these mounded billows of orange sandstone, past these oak-set glens, past these fern-decked alcoves, past these mural curves, we glide hour after hour, stopping now and then, as our attention is arrested by some new wonder," Powell wrote in his 1875 book "Canyons of the Colorado."

Some of the sights that Powell marveled over still exist, including many smaller canyons that branch off the reservoir and are cast in deep shadow. A similar effect is seen in sections of Utah's Green River, a tributary of the Colorado River that has long perplexed geologists due to its ability to flow "uphill."

From above, one of the canyon's most striking geological features β€ͺ—‬ a large, doughnut-shaped depression known as The Rincon β€ͺ—‬ is visible as a dark ring surrounding a bend along one of the widest sections of the lake. This rusty doughnut, which is up to 3 miles (5 km) across, is a former section of the Colorado River that dried out thousands of years ago when part of the canyon collapsed, enabling water to bypass the rocky loop.

A photo of the Colorado River in the Glen Canyon

Glen Canyon is home to many geological features that have since been submerged by Lake Powell. This photo shows a section of the canyon downstream from the dam, where these features are still mostly exposed. (Image credit: Vicki Jauron, Babylon and Beyond Photography via Getty Images)

However, many of the other wonders that Powell described have been lost beneath the reservoir's elevated water level. These include a side canyon dubbed the Music Temple, which was shaped in a way that gave it remarkable acoustic properties, according to the Earth Observatory.

During periods of drought, when the reservoir's water levels temporarily drop, other lost geological treasures can be exposed. For example, in 2023, researchers found rare fossils from a mammal-like Jurassic creature lurking beneath the lake's high-water line.

In recent years, some environmental groups have petitioned to drain Lake Powell and return Glen Canyon to its former glory as the "heart of the Colorado River," according to Newsweek. Such a change may help to alleviate pressure on the rest of the river, which has lost a significant amount of water in recent decades. But experts told Newsweek that this is unlikely to happen.

See more Earth from space

An astronaut photo showing two lakes separated by a narrow strip of land

Pair of Patagonian lakes meet

A 2020 astronaut photo shows the unusual point where two contrastingly colored Patagonian lakes meet. The duo was originally a single body of water but was split by a narrow land bridge.

An astronaut photo of a section of a lake half covered in fracturing ice

World's highest frozen lake shatters

A 2024 astronaut photo shows the icy surface of Pangong Lake breaking apart in the lofty Tibetan Plateau. The point where the ice meets the water almost perfectly matches a disputed border between China and India.

A satellite photo showing a massive green lake in the Australian outback

Ghostly lakes merge in Australia

A 2024 satellite photo shows a series of ephemeral lakes that merged into a single emerald structure in Australia's Northern Territory following two years of extreme rainfall.

The ozone layer was supposed to be healing. So why is this year's Antarctic ozone hole so big?

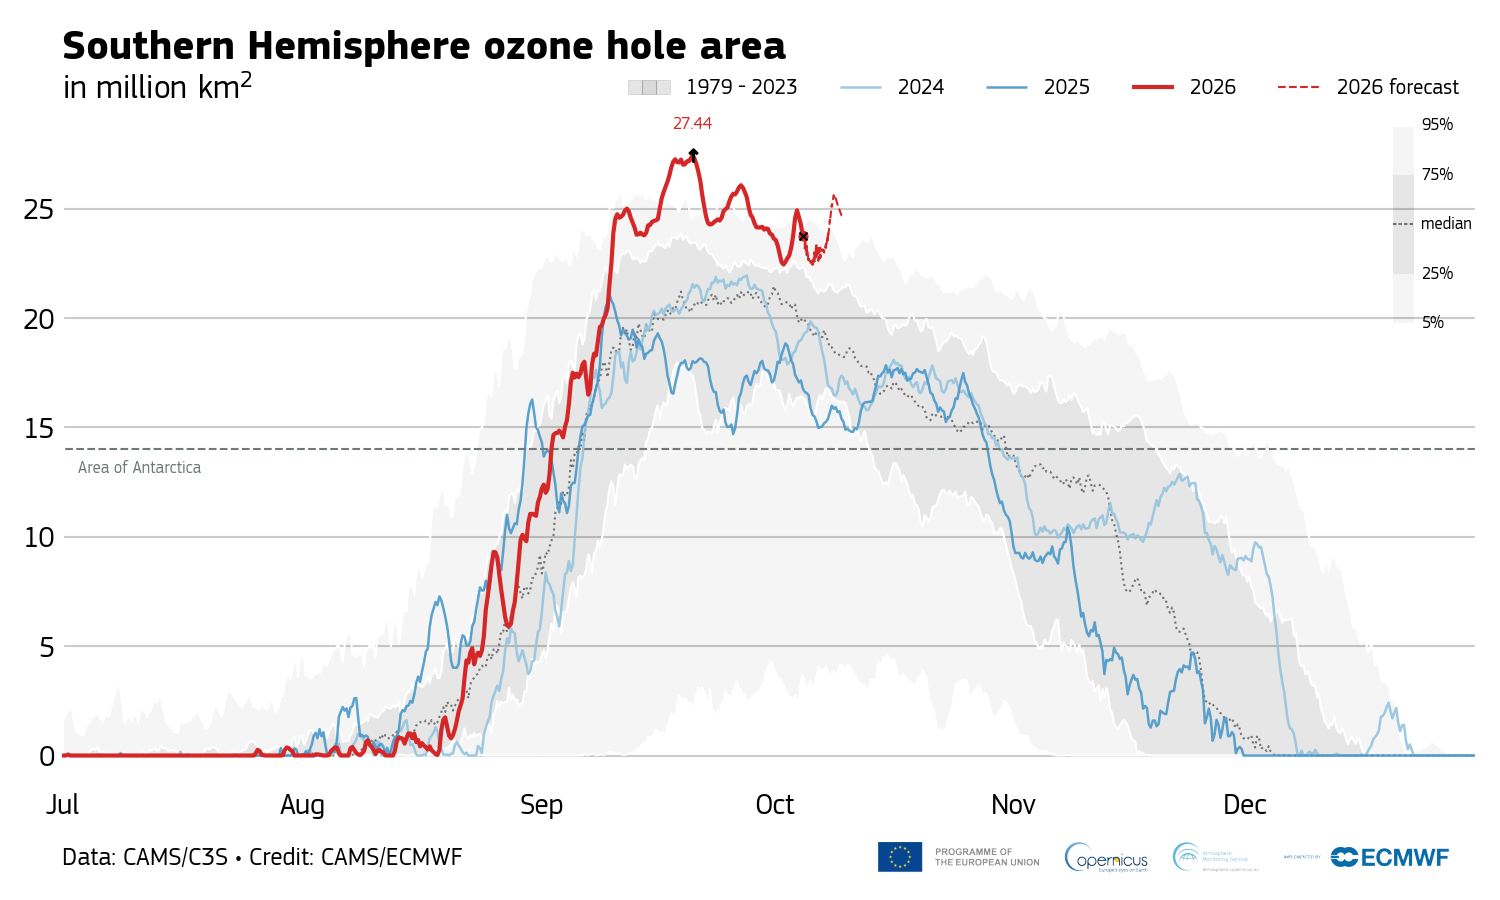
On Sept. 20, the Antarctic ozone hole peaked at 10.6 million square miles (27.4 million square kilometers), the second-largest size ever observed for this time of the year.

The last time the ozone hole was this big was in October 2015, when it reached a whopping 10.8 million square miles (27.9 million square km), records from the Copernicus Atmosphere Monitoring Service show. So why is the hole in the ozone layer β€” the shield that protects life on Earth from harmful ultraviolet solar radiation β€” so big this year, despite other clues telling scientists that it is recovering as expected from the damage human-made chemicals did in the 20th century?

The ozone hole's extent is due to extremely low temperatures in the stratosphere, but it's also possible that we could be seeing a new long-term trend of large, persistent holes, experts told Live Science.

"This year's ozone hole shouldn't be a cause for alarm," Hannah Kessenich, a postdoctoral physicist at the University of Otago in New Zealand who predicted the 2026 ozone hole's extent using satellite data and a computer model, told Live Science in an email. "However, there are still many unanswered questions. It's something we need to keep a close eye on."

Accurate predictions

The latest figures from the Copernicus Atmosphere Monitoring Service indicate that the size of Antarctica's ozone hole has dropped to around 8.9 million square miles (23 million square km) since Sept. 20, making it unlikely that this year will break the 2015 record. However, scientists think the hole will remain large and fluctuate over the next few weeks, Kessenich said.

Graph showing the extend of the 2026 Antarctic ozone hole over time compared with other years.

Antarctica's 2026 ozone hole peaked Sept. 20 and has been shrinking since. (Image credit: Copernicus Atmosphere Monitoring Service)

Antarctica's ozone hole expands every year during the Southern Hemisphere's winter and spring. It typically reaches its maximum size between mid-September and early October, when temperatures are still freezing in the stratosphere and sunlight illuminates the frozen continent for the first time after months of darkness. The hole then shrinks again until late January as surrounding ozone-rich air mixes into the depleted region.

Antarctica's ozone hole was caused by emissions of ozone-destroying chlorofluorocarbons (CFCs) between the 1930s and late 1980s. These chemicals increased concentrations of chlorine in the stratosphere, thereby promoting a reaction that depletes the ozone layer. While countries signed the Montreal Protocol to phase out CFC use beginning in 1989, major CFCs have atmospheric lifetimes of 50 to 100 years, so the hole's recovery could take six decades, researchers estimate.

The ozone layer is particularly vulnerable above Antarctica due to the frigid conditions in the polar stratosphere. Temperatures below minus 108 degrees Fahrenheit (minus 78 degrees Celsius) trigger the formation of high-altitude clouds, whose icy surfaces turn inactive chlorine into its ozone-destroying form in the presence of sunlight. These conditions don't exist to the same extent in the Arctic, because warmer air from the midlatitudes mixes more readily with cold Arctic air than with Antarctic air, thereby blocking the formation of high-altitude clouds.

Changes in the polar vortex

This year's large ozone hole is caused by a very strong polar vortex, a wall of wind that encircles Antarctica and the Southern Ocean in the winter, trapping cold air above the continent. The polar vortex created colder-than-usual conditions in the stratosphere over Antarctica, accelerating the growth of the ozone hole.

We have to look at the longer term trends, and those metrics continue to tell us that the ozone hole is slowly recovering as expected.

Susan Solomon, professor of chemistry and environmental studies at MIT

Researchers haven't detected an increase in reactive chlorine, but the colder polar vortex has triggered more ozone depletion than usual, said Susan Solomon, a professor of chemistry and environmental studies at MIT who pioneered the study of Antarctica's ozone hole in the 1980s.

This size of this year's ozone hole is most likely a product of natural variability in atmospheric dynamics, Kessenich said.

"We expect ups and downs in the size of the hole from year to year," Solomon told Live Science in an email. "A year or a few years of bigger or smaller holes doesn't tell us anything about ozone loss or recovery; it is just variability. We have to look at the longer term trends, and those metrics continue to tell us that the ozone hole is slowly recovering as expected."

It's also reassuring that the ozone hole, while large, isn't as "thin" as in years past. The hole's extent is calculated based on the area above the continent with ozone values below 220 Dobson units, a measure of how many ozone molecules occur in a vertical column through Earth's atmosphere. Although the area of this year's ozone hole is huge, ozone values haven't dropped as low as in previous big-ozone-hole years, suggesting that there is less ozone "missing" from the hole compared with those years, Kessenich and her colleagues wrote in The Conversation.

But there's also the possibility that we've shifted to a new long-term trend of big ozone holes persisting until late spring, Kessenich said. Changes in global atmospheric dynamics unrelated to CFCs could be making longer-lived holes more likely, she and her colleagues wrote in the article.

There is also some evidence that climate change will strengthen the Antarctic polar vortex over time, which could lead to colder temperatures in the stratosphere and greater ozone losses in the spring, Kessenich said. If this year's polar vortex stays robust, the ozone hole could remain large well into November, she noted.

"It's too soon to tell what has been driving dynamical variability in recent years, but more research is needed," she added.

Help us improve Live Science Pro: We're always trying to make our content better. Leave us feedback about Pro here.

Colorful wildflowers bloom across Chile's Atacama Desert in wake of 'super' El NiΓ±o

2 October 2026 at 21:34

This year's exceptionally strong El NiΓ±o has brought a rare gift to Chile's Atacama Desert: rain. In one of the driest places on Earth, that rare moisture has awakened millions of seeds and bulbs that can remain dormant underground for years, transforming the landscape into a spectacular carpet of color.

Known locally as "desierto florido," or "flowering desert," the phenomenon is one of nature's most remarkable transformations. Patches of purple, pink, white, red and yellow now spread across hillsides and plains that for much of the year appear almost completely lifeless.

"It is a unique phenomenon; there are more than 200 plant species," Jorge Carabantes, head of the Protected Areas Department at the National Forest Corp. (CONAF) in Chile, told The Associated Press. "This is a flowering event that is obviously extraordinary and unusual, very different from other blooms that occur elsewhere on the globe."

Typically, the Atacama gets just 0.6 inches (15 mm) of rain a year. But thanks to the super El NiΓ±o, record levels of rain fell between July and August in several Chilean regions, including levels not seen since the 1950s, with some areas receiving more than 7 inches (190 millimeters), Carabantes told the AP.

While this unprecedented precipitation has caused flooding in some areas of Chile, it's created a 6,560-square-mile (17,000 square kilometers) swath of flowering blooms across the Atacama Desert. This is the most extensive desert bloom since 1997, CONAF representatives told the AP.

For photographers and tourists, the landscape is breathtaking, with bright colors contrasted against the dark Atacama mountains and Chile's cloudless skies. But the bloom is fleeting; by the end of the Southern Hemisphere's spring, many of the flowers will disappear, leaving behind seeds and bulbs waiting for the next extraordinary rains.

Here are five photos from Getty Images photographer Javier Torres that showcase the beauty of this rare event.

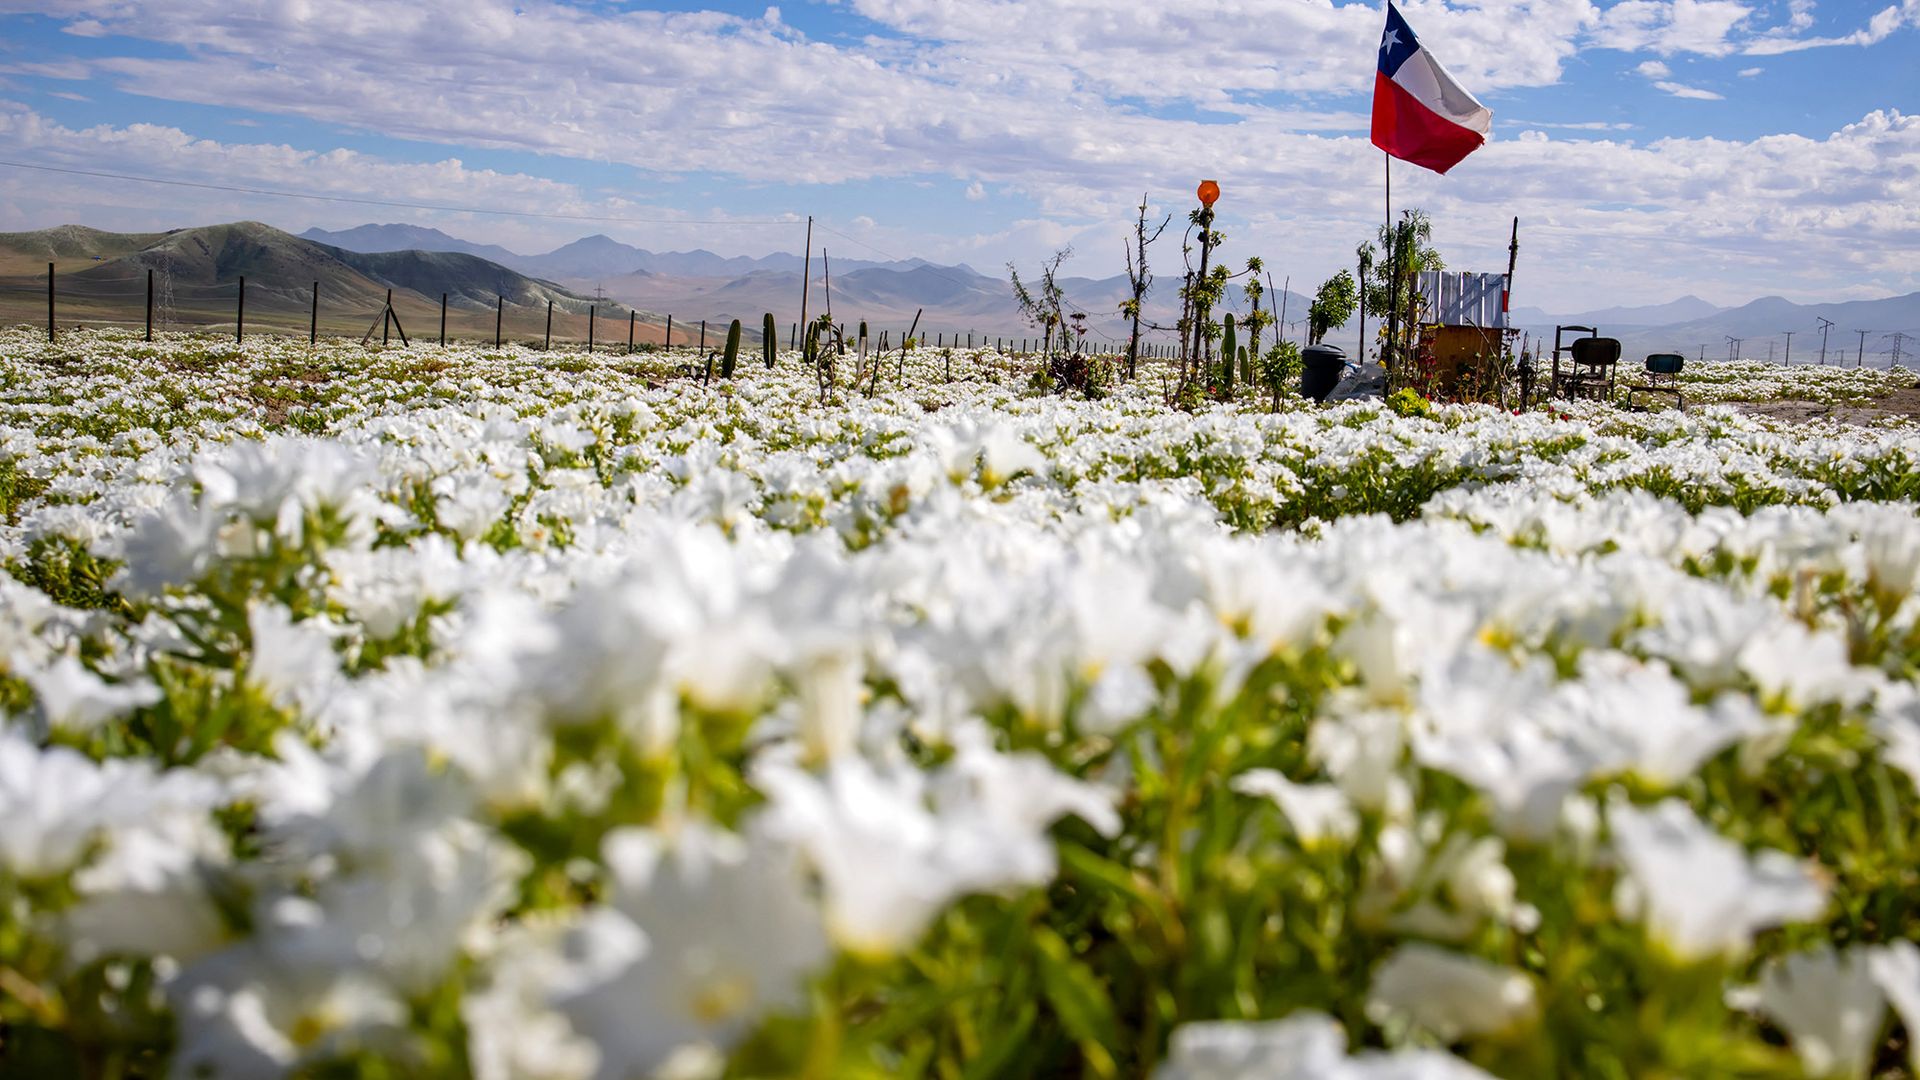
A patch of white blooms is seen with a red, white and blue flag in the background.

Flowers bloom on the plains near the Atacama Desert near CopiapΓ³, Chile, with the Chilean flag in the background. (Image credit: JAVIER TORRES via Getty Images )

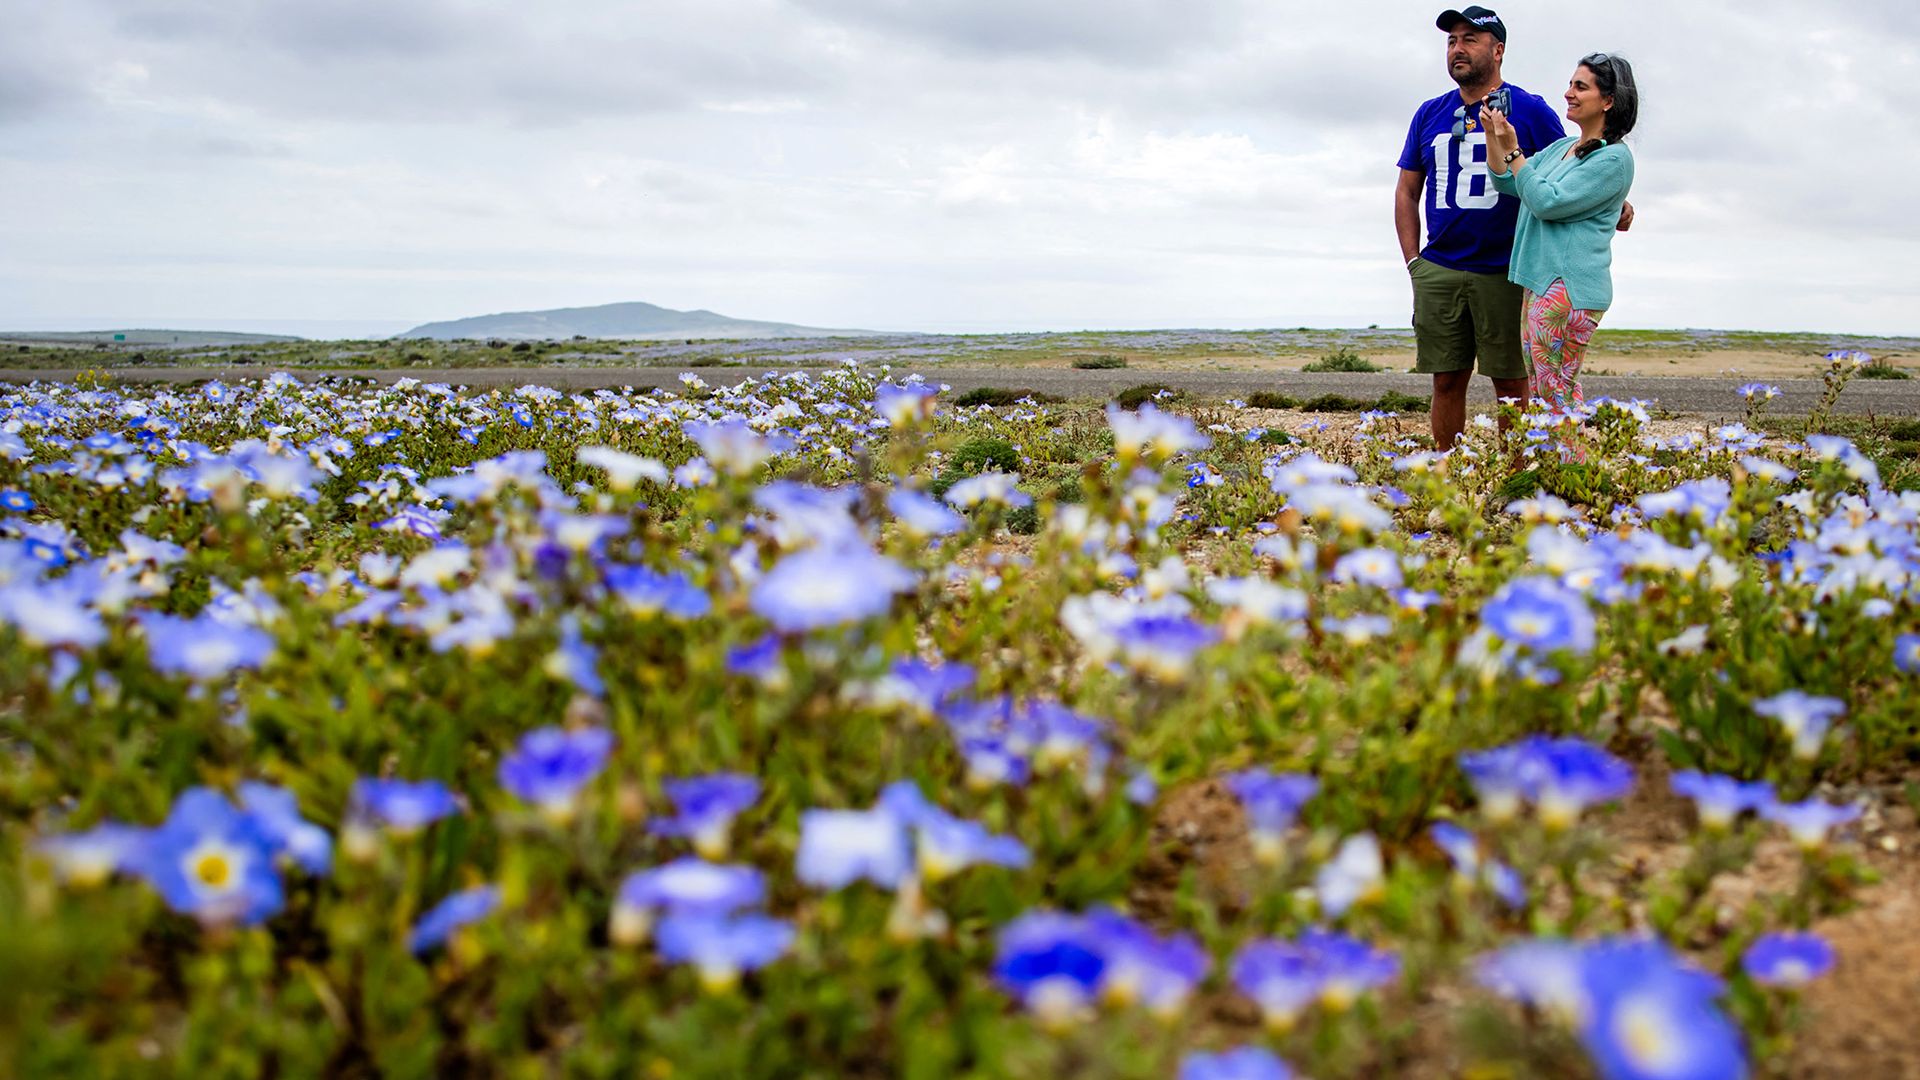
Two people stand in a patch of purple flowers.

Tourists admire the purple blossoms of the desert flowers. (Image credit: JAVIER TORRES via Getty Images)

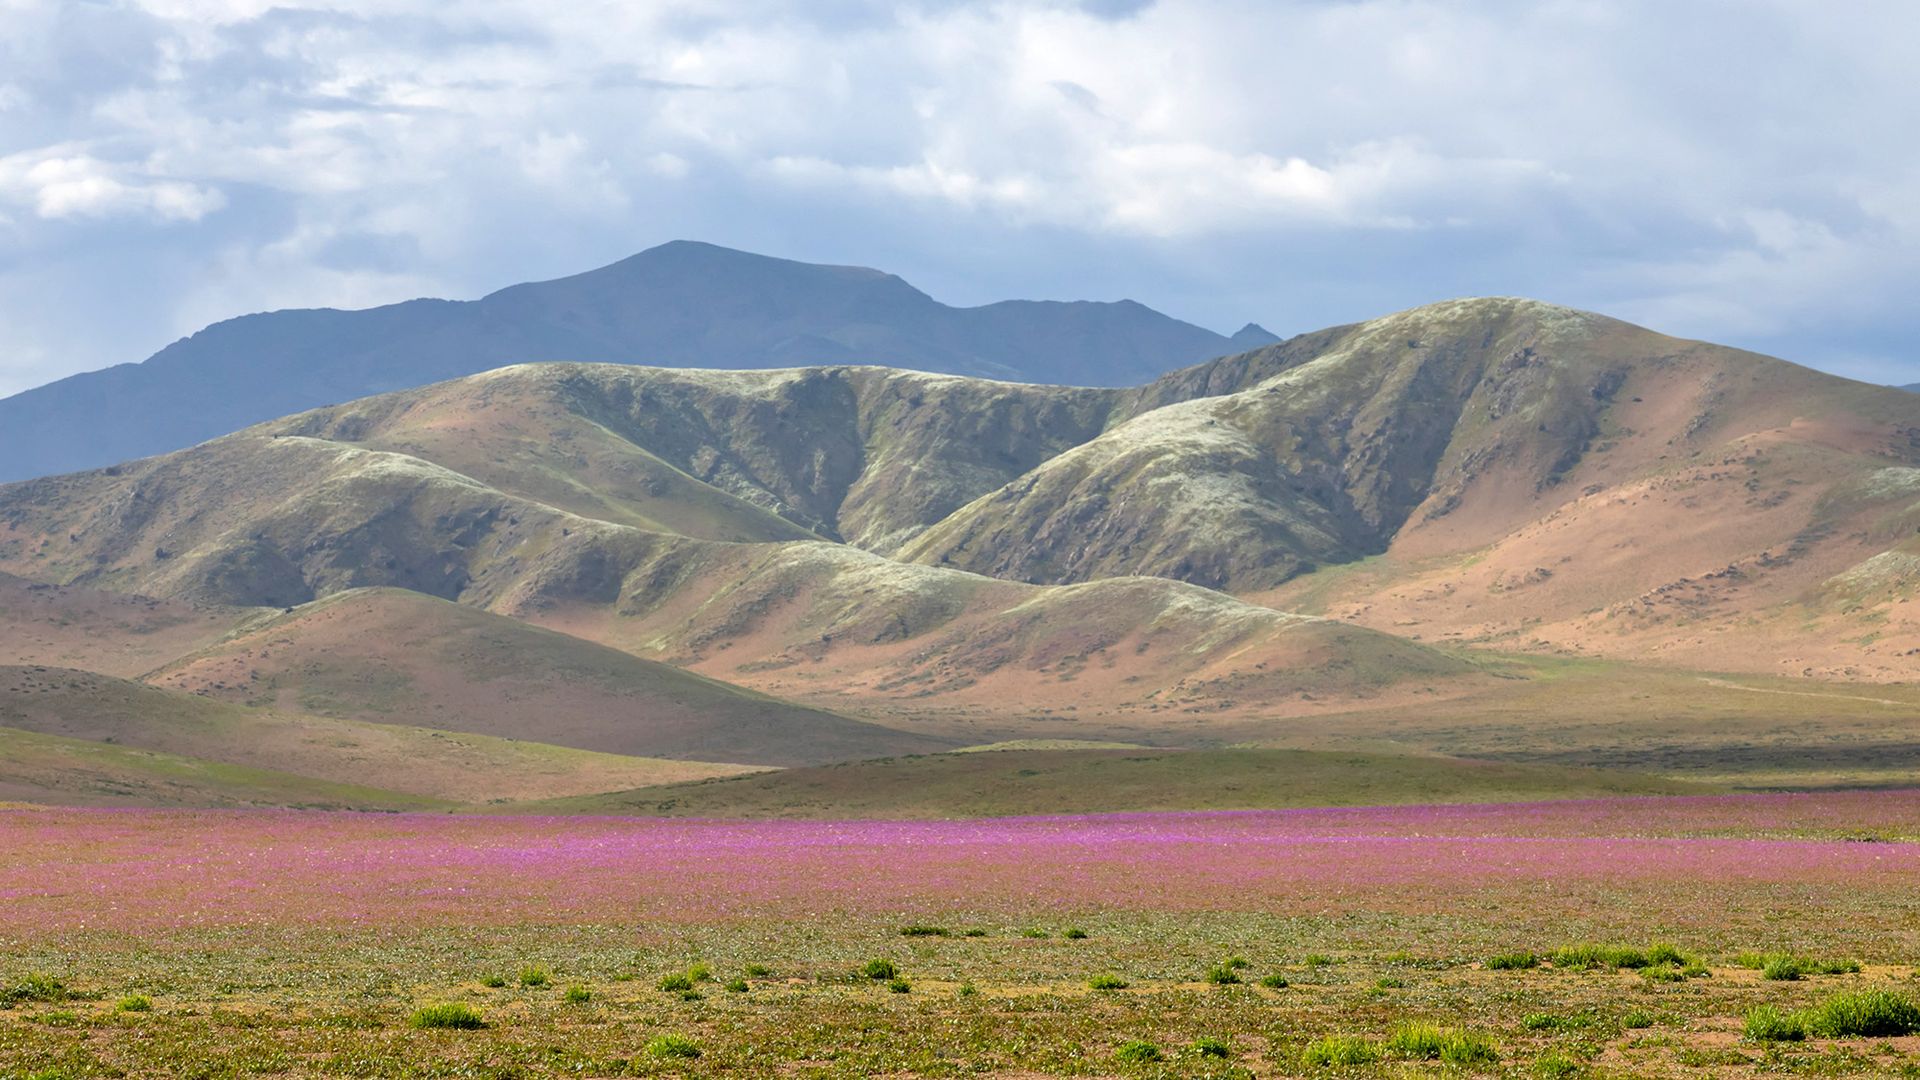
A patch of pink flowers is seen in front of a mountain range.

The plains of the Atacama Desert are carpeted by brilliant blooms, with the mountains in the distance. (Image credit: JAVIER TORRES via Getty Images)

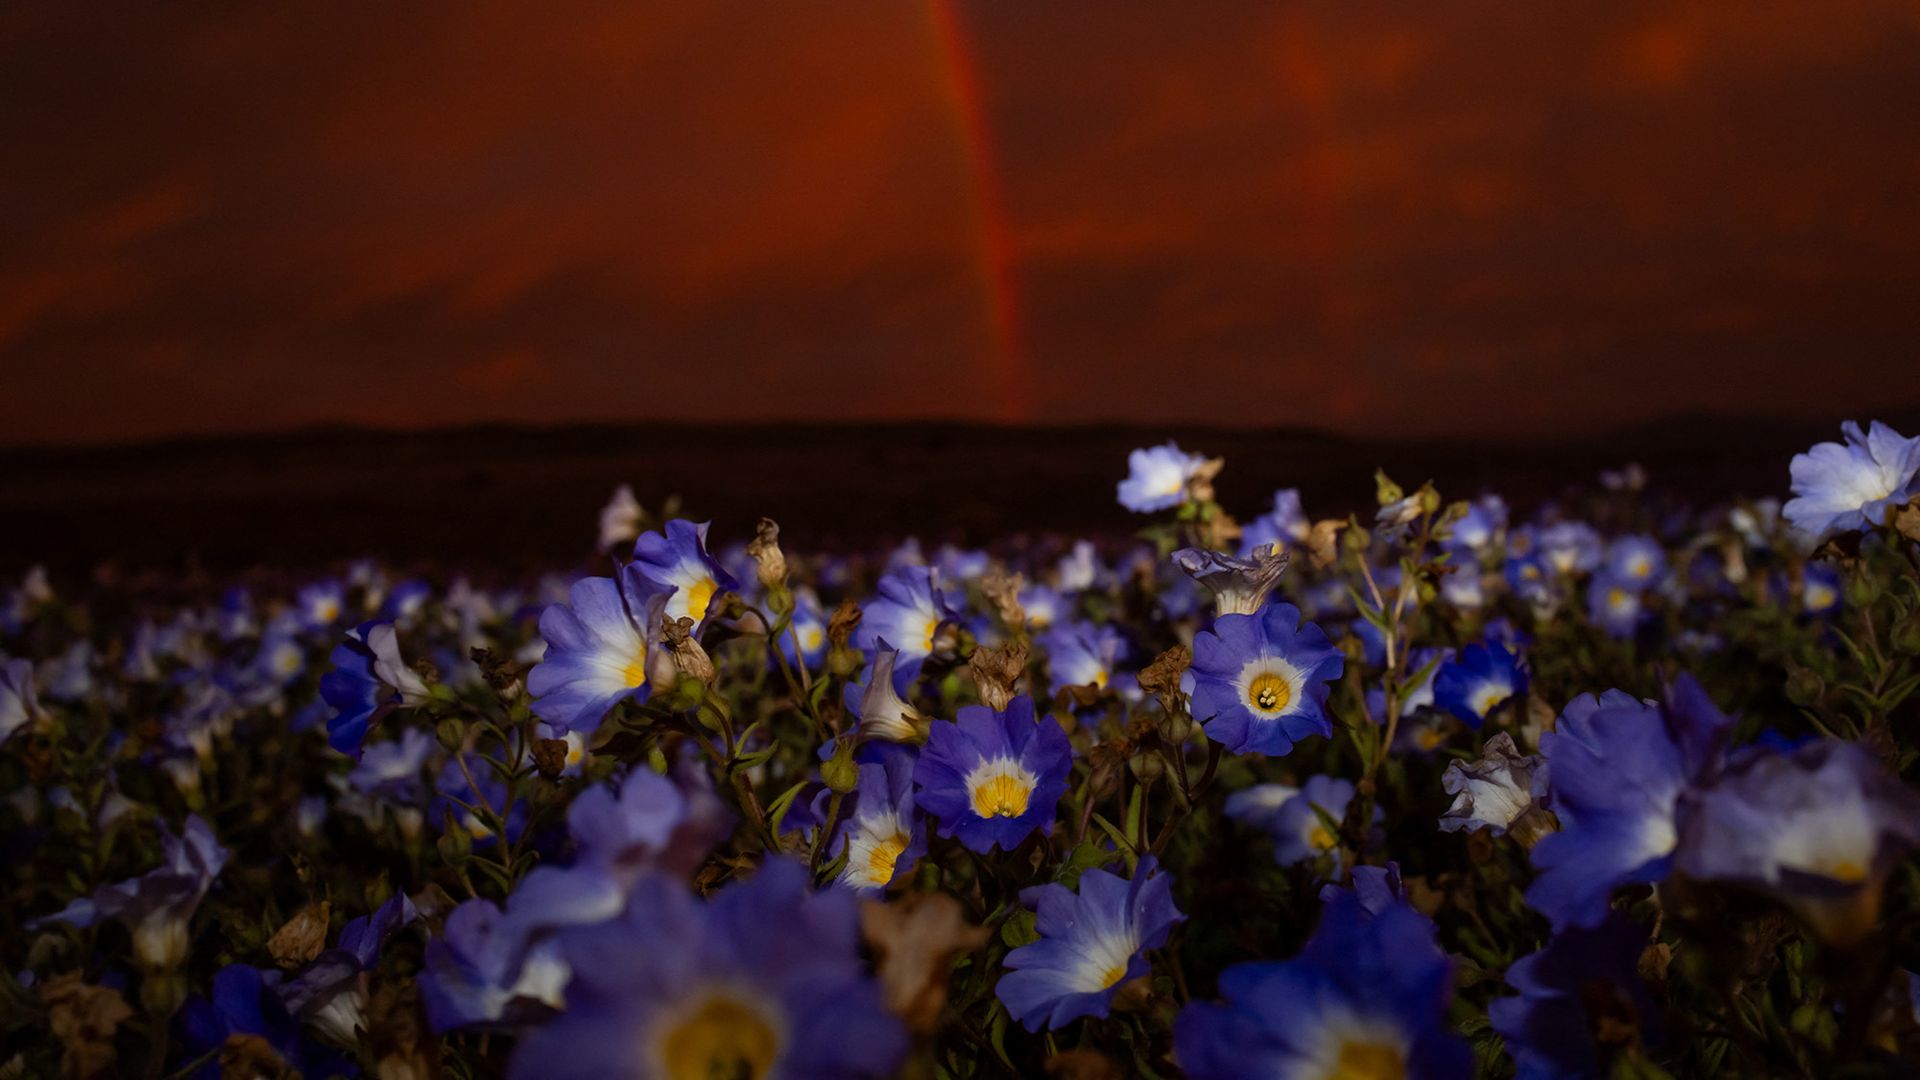
A series of purple flowers are seen under a red sky.

A rainbow glows over purple flowers in Chile's Atacama Desert. (Image credit: JAVIER TORRES via Getty Images)

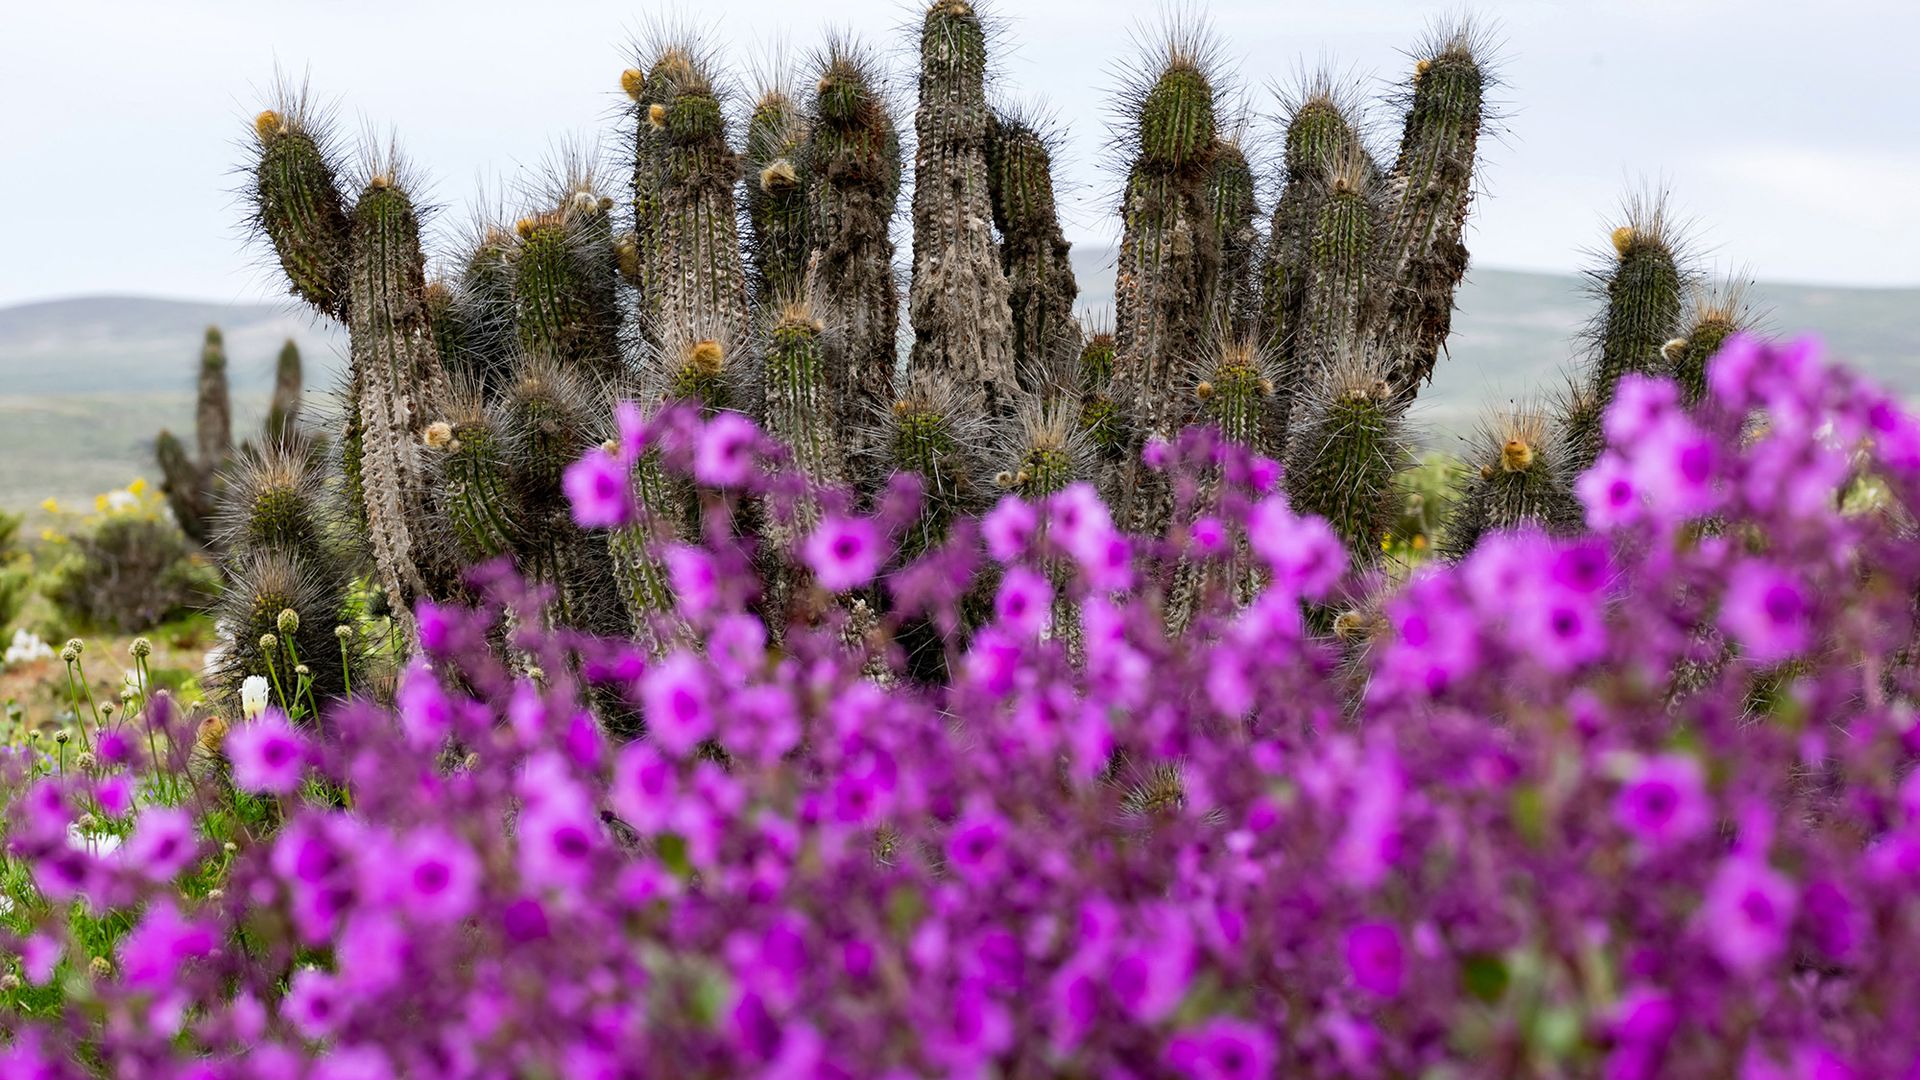
A patch of purple flowers is seen with long cacti in the background.

Cacti mix with blooming wildflowers in the Atacama Desert. (Image credit: JAVIER TORRES via Getty Images)

RELATED STORIES

β€”Bloom entombed in amber is the largest fossilized flower ever found

β€”Atacama Desert's center dried out 20 million years earlier than previously thought β€” before the Andes formed

β€”Hidden 'biosphere' of extreme microbes discovered 13 feet below Atacama Desert is deepest found there to date

Animals may have evolved 200 million years earlier than previously thought, new study suggests

2 October 2026 at 19:00

The first animals may have appeared on Earth hundreds of millions years earlier than their fossils suggest, a new modeling study suggests.

Previously, the earliest fossil evidence of animals dated to around 574 million years ago, during the Ediacaran period (635 million to 538 million years ago). In the new paper, a research team argues that we can't just rely on the spotty fossil record, and suggests that animals first appeared up to 200 million years earlier than the oldest known animal fossils.

In the study, published Friday (Oct. 2) in the journal Science Advances, the researchers argue that the absence of animal fossils in some exceptionally well-preserved ancient rocks doesn't mean the animals were absent from history. Instead, they suggest that the fossil record may be missing a key chapter of animal evolution, potentially pushing the origins of animals back to between 800 million and 700 million years ago.

This would place the emergence of animals deep within the Neoproterozoic era (1 billion to 539 million years ago), possibly before or during some of Earth's most extreme ice ages.

Even though scientists haven't found undisputed animal fossils from the Neoproterozoic, that doesn't mean animals didn't live at that time. Fossils can be absent from rocks for several reasons, including because scientists are looking in the wrong places or the conditions were unsuitable for creating fossils, making it difficult to determine the earliest evolved animals.

"Until that evidence becomes available, the precise birth date of the animal kingdom remains uncertain," study co-author Ross Anderson, an associate professor of natural history at the University of Oxford, said in a statement.

Where are the animals?

Until now, most researchers relied on the well-preserved rocks from the Ediacaran period, including the roughly 590 million-year-old Weng'an Biota in China, to investigate the timing of animal evolution. Because rock deposits there contain uniquely preserved microscopic organisms but no definitive animal fossils, experts have sometimes treated them as a kind of upper limit for when animals could have evolved.

"So the game is basically how much does it predate our first fossil discovery by and what happened in that evolutionary black box between when they actually originated versus when we get our first fossil window," Karma Nanglu, an assistant professor of evolutionary paleobiology at the University of California, Riverside who wasn't involved with the study, told Live Science.

But the researchers wondered whether other fossil sites from known animal periods actually had evidence of animal fossils.

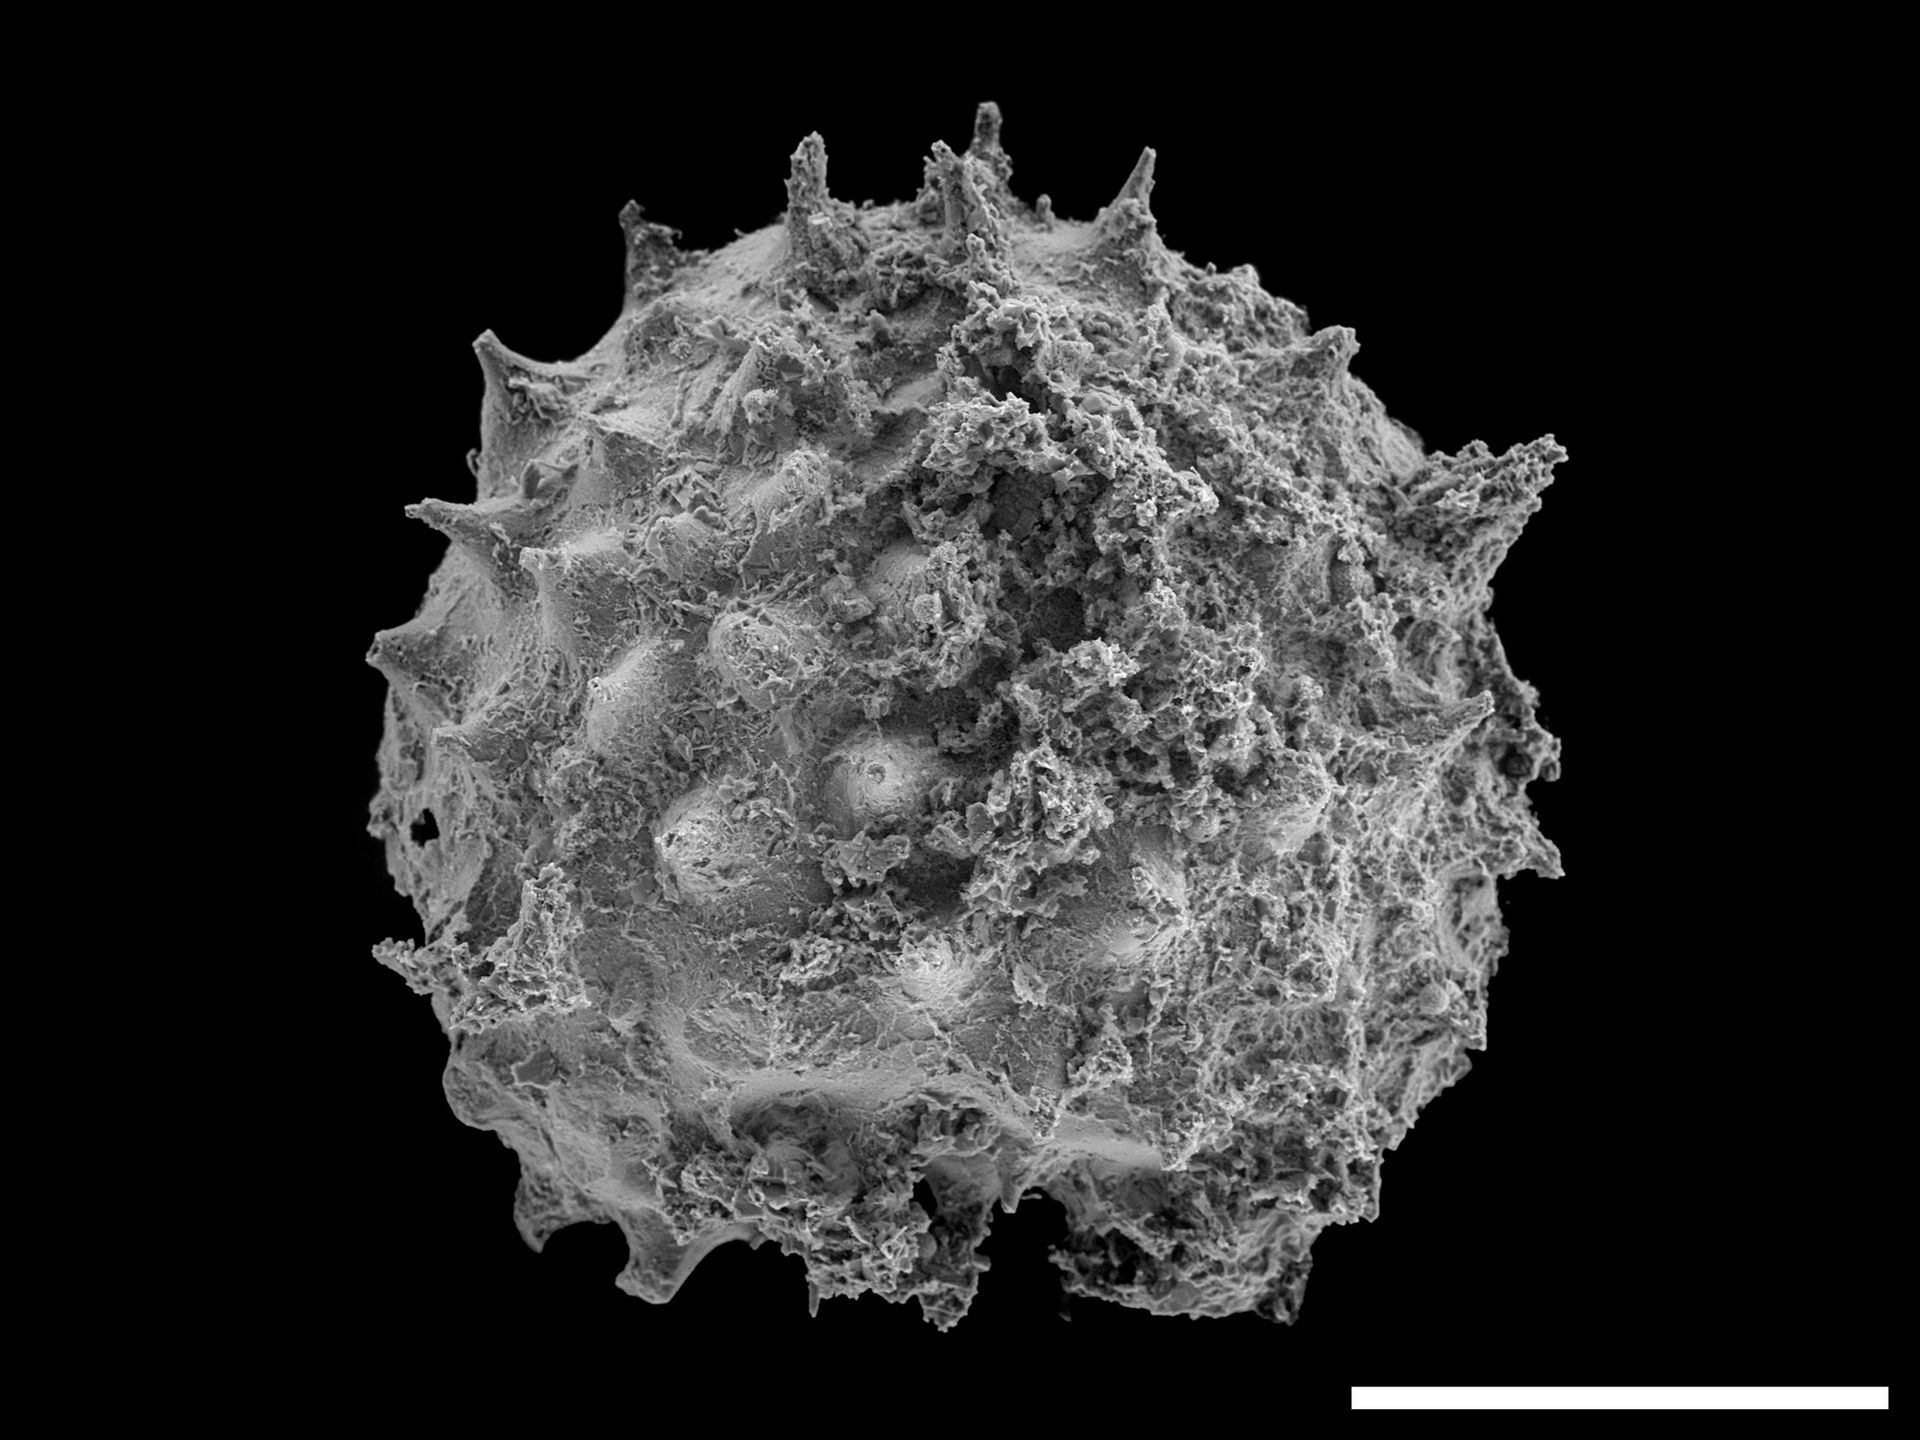
To find out, Anderson and his colleagues studied more than 140 samples from the Kheseen Biota in Mongolia, which is more than 40 million years younger than the 590 million-year-old Weng'an Biota deposit. Given that it's a younger deposit, the researchers hypothesized that there should be evidence of animal life left in the rock. Using electron scanning microscopy, the researchers saw microscopic fossils preserved in extraordinary detail, including tiny, spherical organisms and embryo-like structures containing internal cells.

A microscope image showing a gray sphere with jagged edges.

An electron microscope image of Asterocapsoides wenganensis, a microscopic fossil from the Kheseen Biota in Mongolia. (Image credit: Derek Briggs.)

Yet, despite the quality of preservation, the researchers couldn't identify any of the microfossils as animals. That's important, because by the time the Kheseen Biota was deposited, animals were present elsewhere on Earth.

"The Kheseen Biota breaks the argument that the exceptional microfossils of Weng'an mean we would have seen animal fossils in the assemblage had they existed at the time," Anderson said. "The Kheseen microfossils are just as well-preserved, yet animals continue to be absent β€” despite the fact we know at that point they existed."

Using molecular clocks

Given the absence of fossil evidence, Anderson and his collaborators turned to another common method used to date ancient life: molecular clocks. Molecular clocks estimate when evolutionary lineages diverged by comparing genetic differences among living organisms and combining those differences with rates of genetic change. For example, if two bird species have five DNA changes and one DNA change takes about 1 million years to accumulate, scientists could estimate that the two species diverged around 5 million years ago.

"Molecular clocks are useful when we don't have a particularly good fossil record for a group of interest or a time period of interest," Nanglu said.

When the analysis was constrained by the younger Weng'an deposit, the estimated origin of animals was comparatively recent. When they used older geological constraints β€” specifically rock formations in Norway, Australia and Arizona deposited between around 850 million and 730 million years ago that have been used in the past for trying to find animals' early ancestors, the timeline changed. By comparing modern animal DNA to reference dates from the fossil record along with evolutionary rates of change β€” their estimate shifted back by roughly 200 million years, to between about 800 million and 700 million years ago.

"Pre-Ediacaran animal body fossils still elude us, and this analysis does not prove that animals existed 800 million years ago," study first author Orin Lole Durbin, a doctoral student of paleobiology at Virginia Tech who was a University of Oxford undergraduate at the time of the study, said in the statement. "Meanwhile, our molecular-clock analyses show how much further back their evolutionary history could extend."

Could animals have lived before "Snowball Earth"?

There are other clues that animals may have a longer history.

Chemical fossils, or biomarkers, have been interpreted as evidence consistent with sponges living at least 650 million years ago, tens of millions of years prior to the oldest known animal fossils.

If animals did originate 800 million years ago, their emergence would also intersect with the Cryogenian period, which began around 720 million years ago as part of the Neoproterozoic era. During this interval, Earth experienced enormous glaciations often referred to as "Snowball Earth."

Although there is no definitive answer to whether animals survived this uncertain time, the researchers plan to search additional Neoproterozoic rocks with different environments and preservation conditions to find more evidence for their analysis.

"Fossils themselves are by definition kind of hidden from general sight," Nanglu said."Beyond that there's an even more hidden world, and that has a lot of potential to tell us about animal origins."

Think you know about natural selection? Try your hand at our evolution quiz!

How prepared are you for a disaster?

2 October 2026 at 16:01

This year's "super" El Nino means the U.S. will likely face a higher risk of stormy weather and flooding, so experts are recommending Americans stock up on food.

And flooding is just one of the natural disasters people will face β€” many people are at risk of wildfires, power outages or earthquakes. While some disasters are unexpected, preparation can make a significant difference in how much they impact peoples' daily lives.

But is anyone actually prepared for the worst?

Levels of preparedness vary widely. Some may keep an emergency kit stocked with food, water and first-aid supplies, while others may have an evacuation plan, emergency contacts or designated meeting place for their household. And others do nothing at all. Although a recent study revealed there's no single place on Earth that's best prepared for global disaster, there are steps people can take to feel well equipped.

Experts recommend stocking up on food supplies and other essentials, especially in areas that might be more disaster prone. But how prepared are you? Answer our poll below, and share how you've prepared for emergencies or what you have in your disaster kit in the comments.

❌