❌

Normal view

Bountiful Roebuck Bay 

11 August 2026 at 05:01
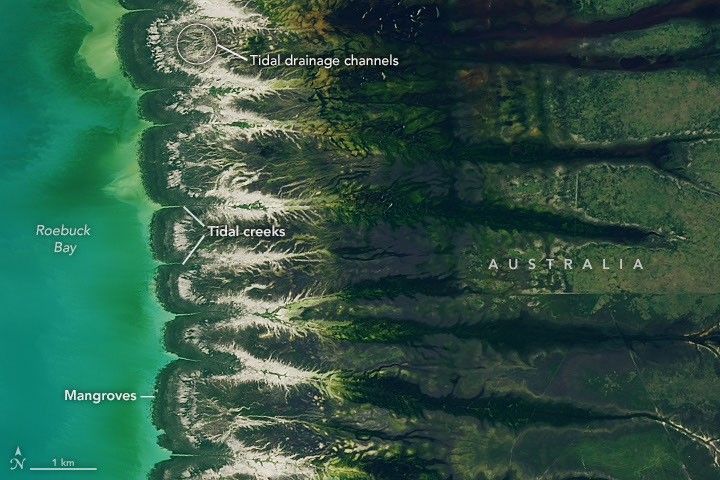
Blue coastal waters border a fringe of dark green mangroves with branching, linear tidal creeks and pale tidal flats and drainage channels visible to the east.
Water covers intertidal mudflats around Roebuck Bay in Western Australia, as seen in this image captured by the OLI (Operational Land Imager) on Landsat 8 on March 18, 2026.
NASA Earth Observatory / Lauren Dauphin

Editor’s Note: Today’s story is the answer to the August Puzzler.

Tides are among the clearest signs of the Moon’s pull on Earth. Just 239,000 miles (385,000 kilometers) away, the Moon’s gravity pulls on Earth’s oceans and solid crust, subtly distorting them into a more oblong shape with bulges roughly extending toward and away from the Moon.

High tides happen throughout Earth’s oceans, but in some places they leave an unusually strong fingerprint on the landscape. Among those places is Roebuck Bay, a crescent-shaped feature in the Kimberley region of Western Australia.

Roebuck Bay’s tidal range can reach a remarkable 9 meters (30 feet). Rising and falling tides repeatedly inundate and expose expansive mudflats, flood broad mangrove forests and salt marshes, and feed branching networks of tidal drainage channels. Many parts of Australia have tidal ranges of 2 meters or less. But the large range at Roebuck Bay is mostly a consequence of northwestern Australia’s unusually wide, shallow continental shelf, which helps amplify tides as they approach the coast.

The image at the top of the page shows the bay on March 18, 2026, when water levels were high. Green mangrove forests grow thickly along the shoreline and line the mouths of a network of evenly spaced, linear tidal creeks. These mangrove forests are dynamic. Analysis of decades of Landsat observations shows them expanding westward by nearly 2 meters per year as sediment from the waterways to the east accumulates in the sheltered bay.

Farther inland, branching networks of tidal drainage channels connect with the tidal creeks, giving the bay its feathered appearance. These channels, partially obscured by thick vegetation in March, were more visible earlier and later in the year, when vegetation was thinner.
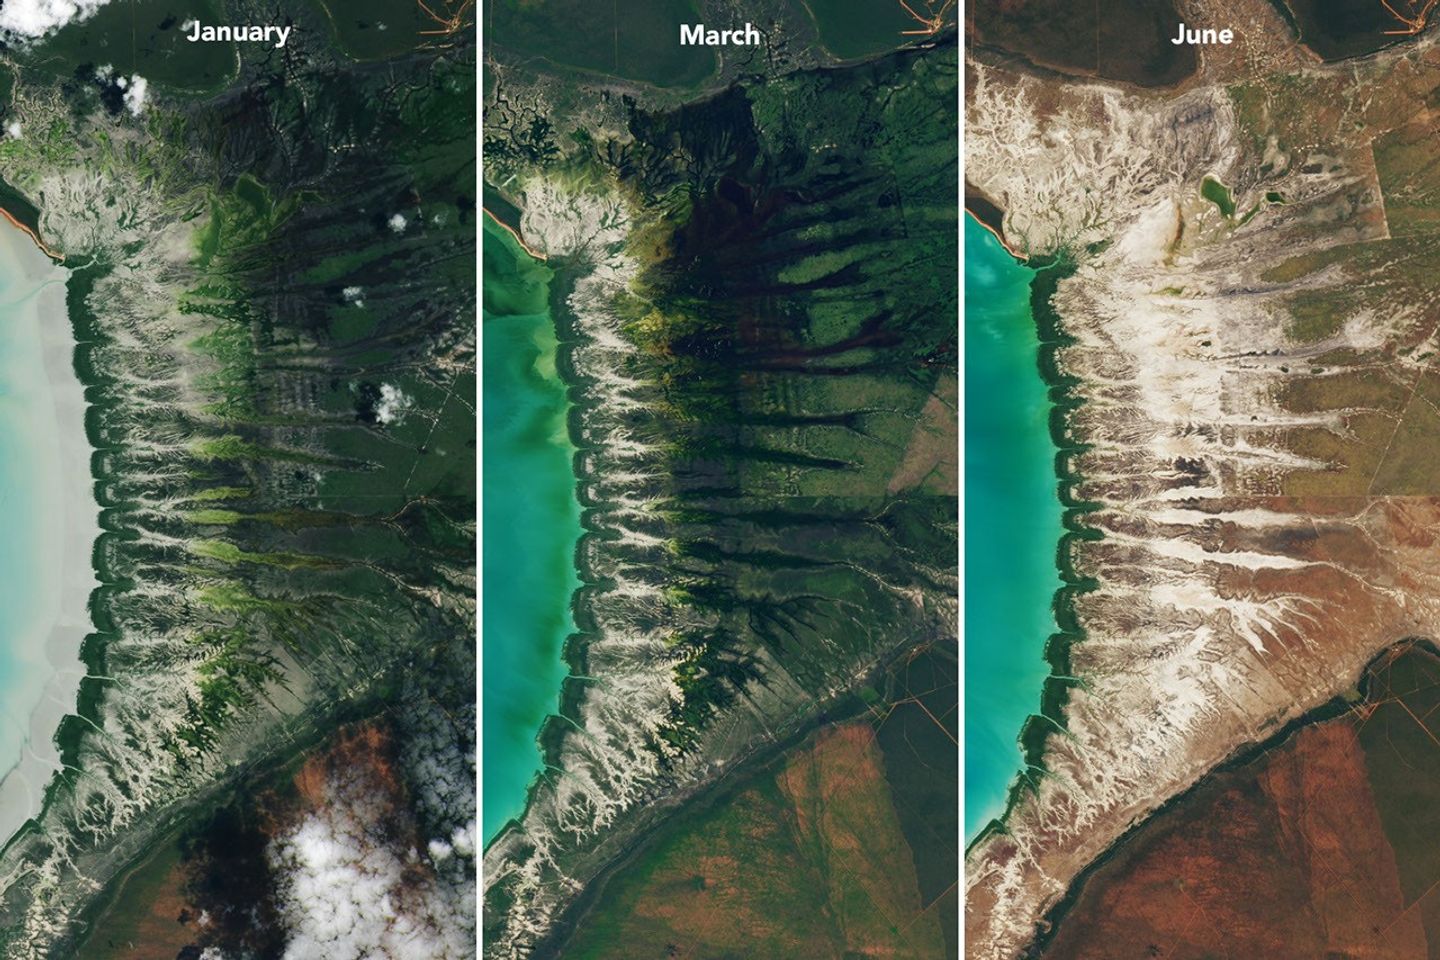
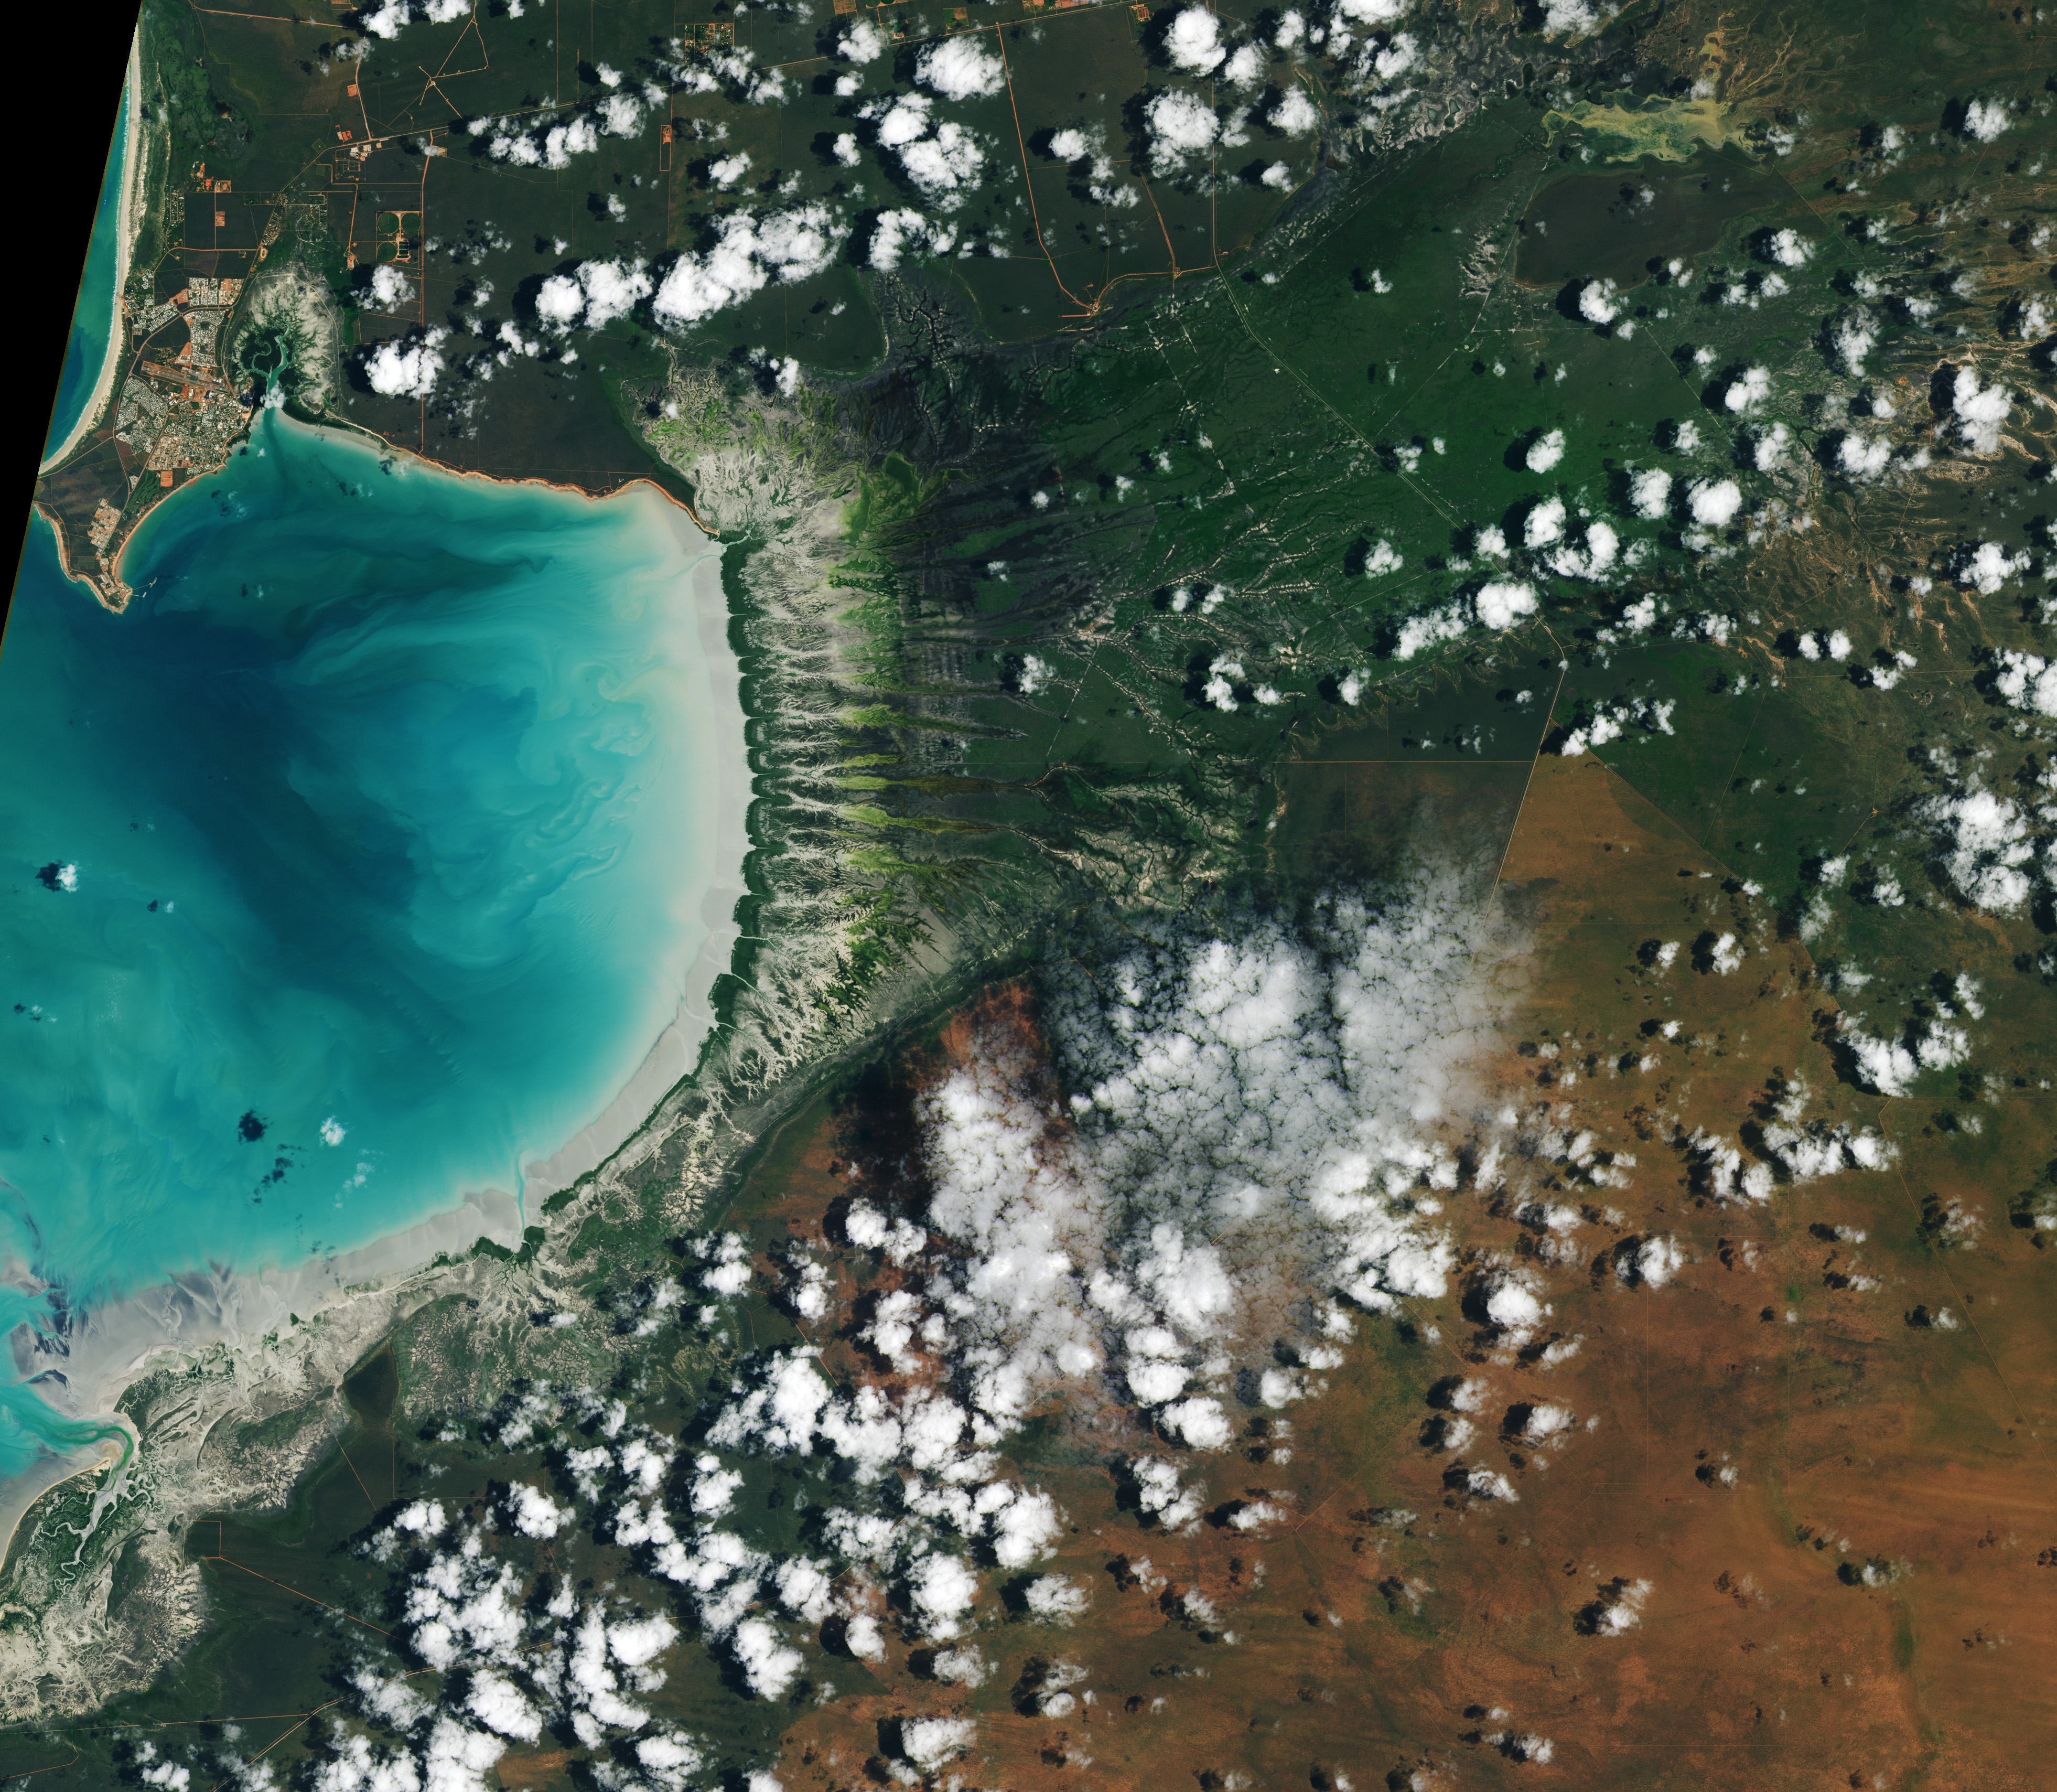
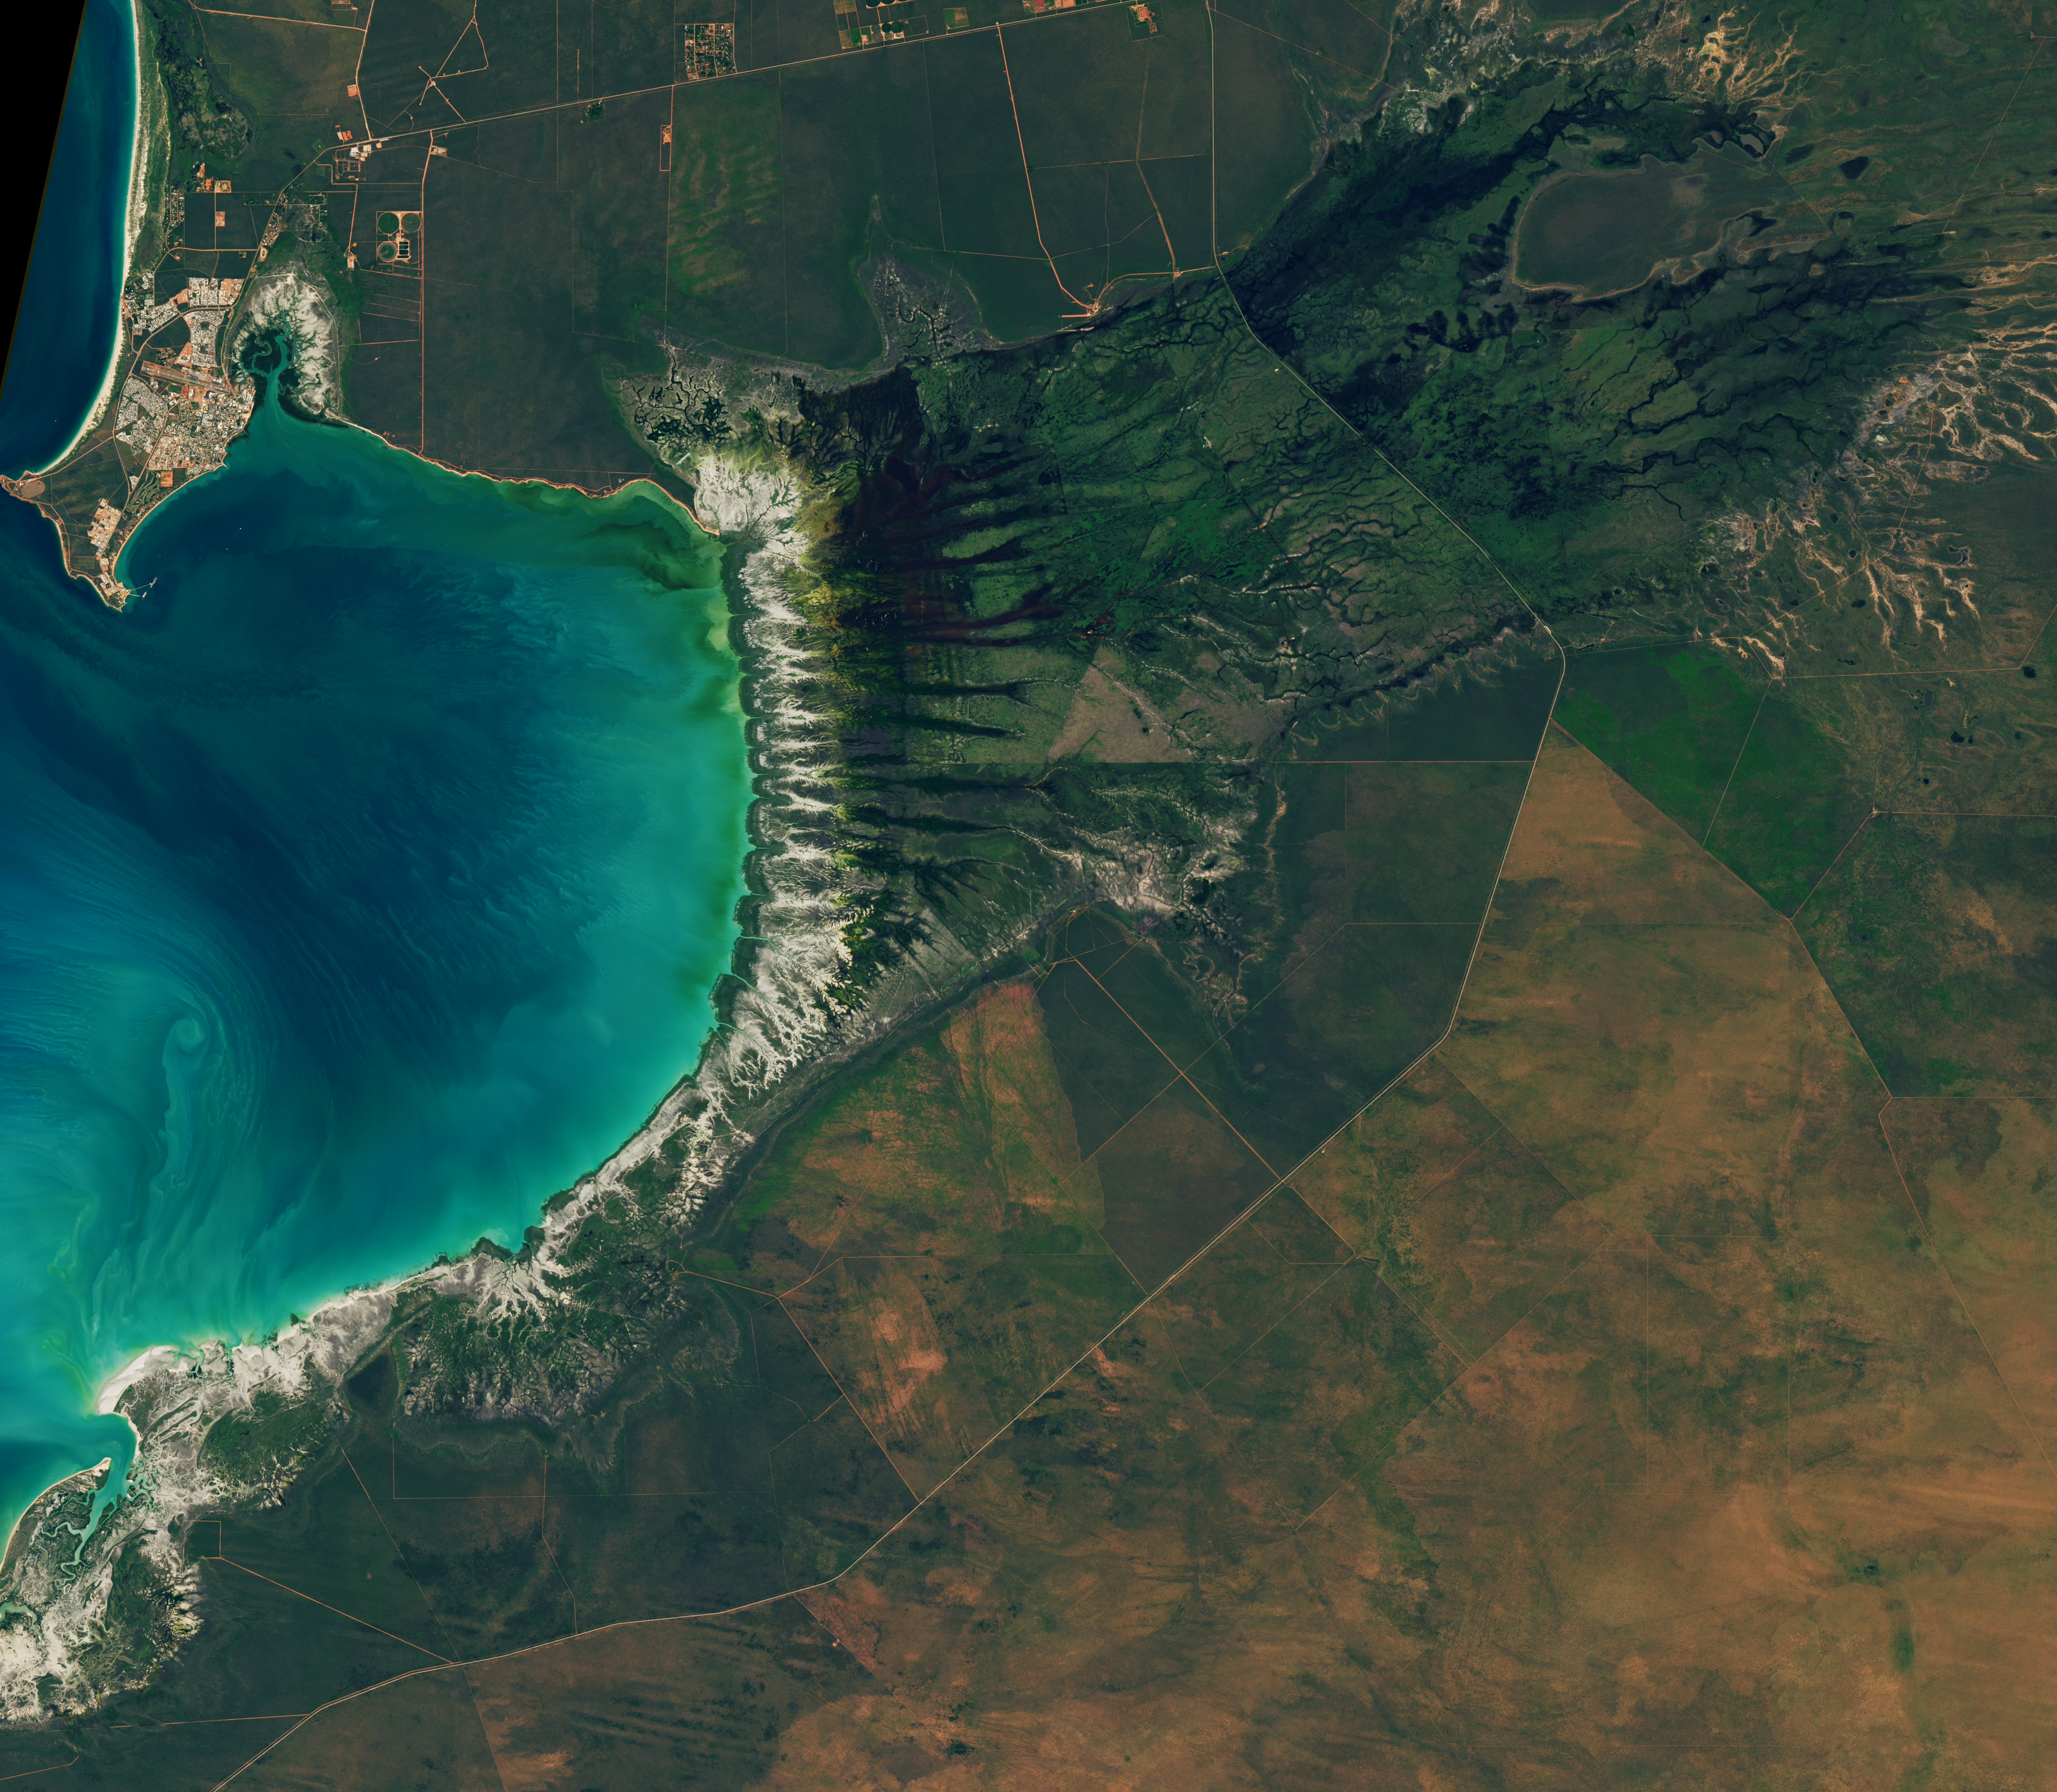
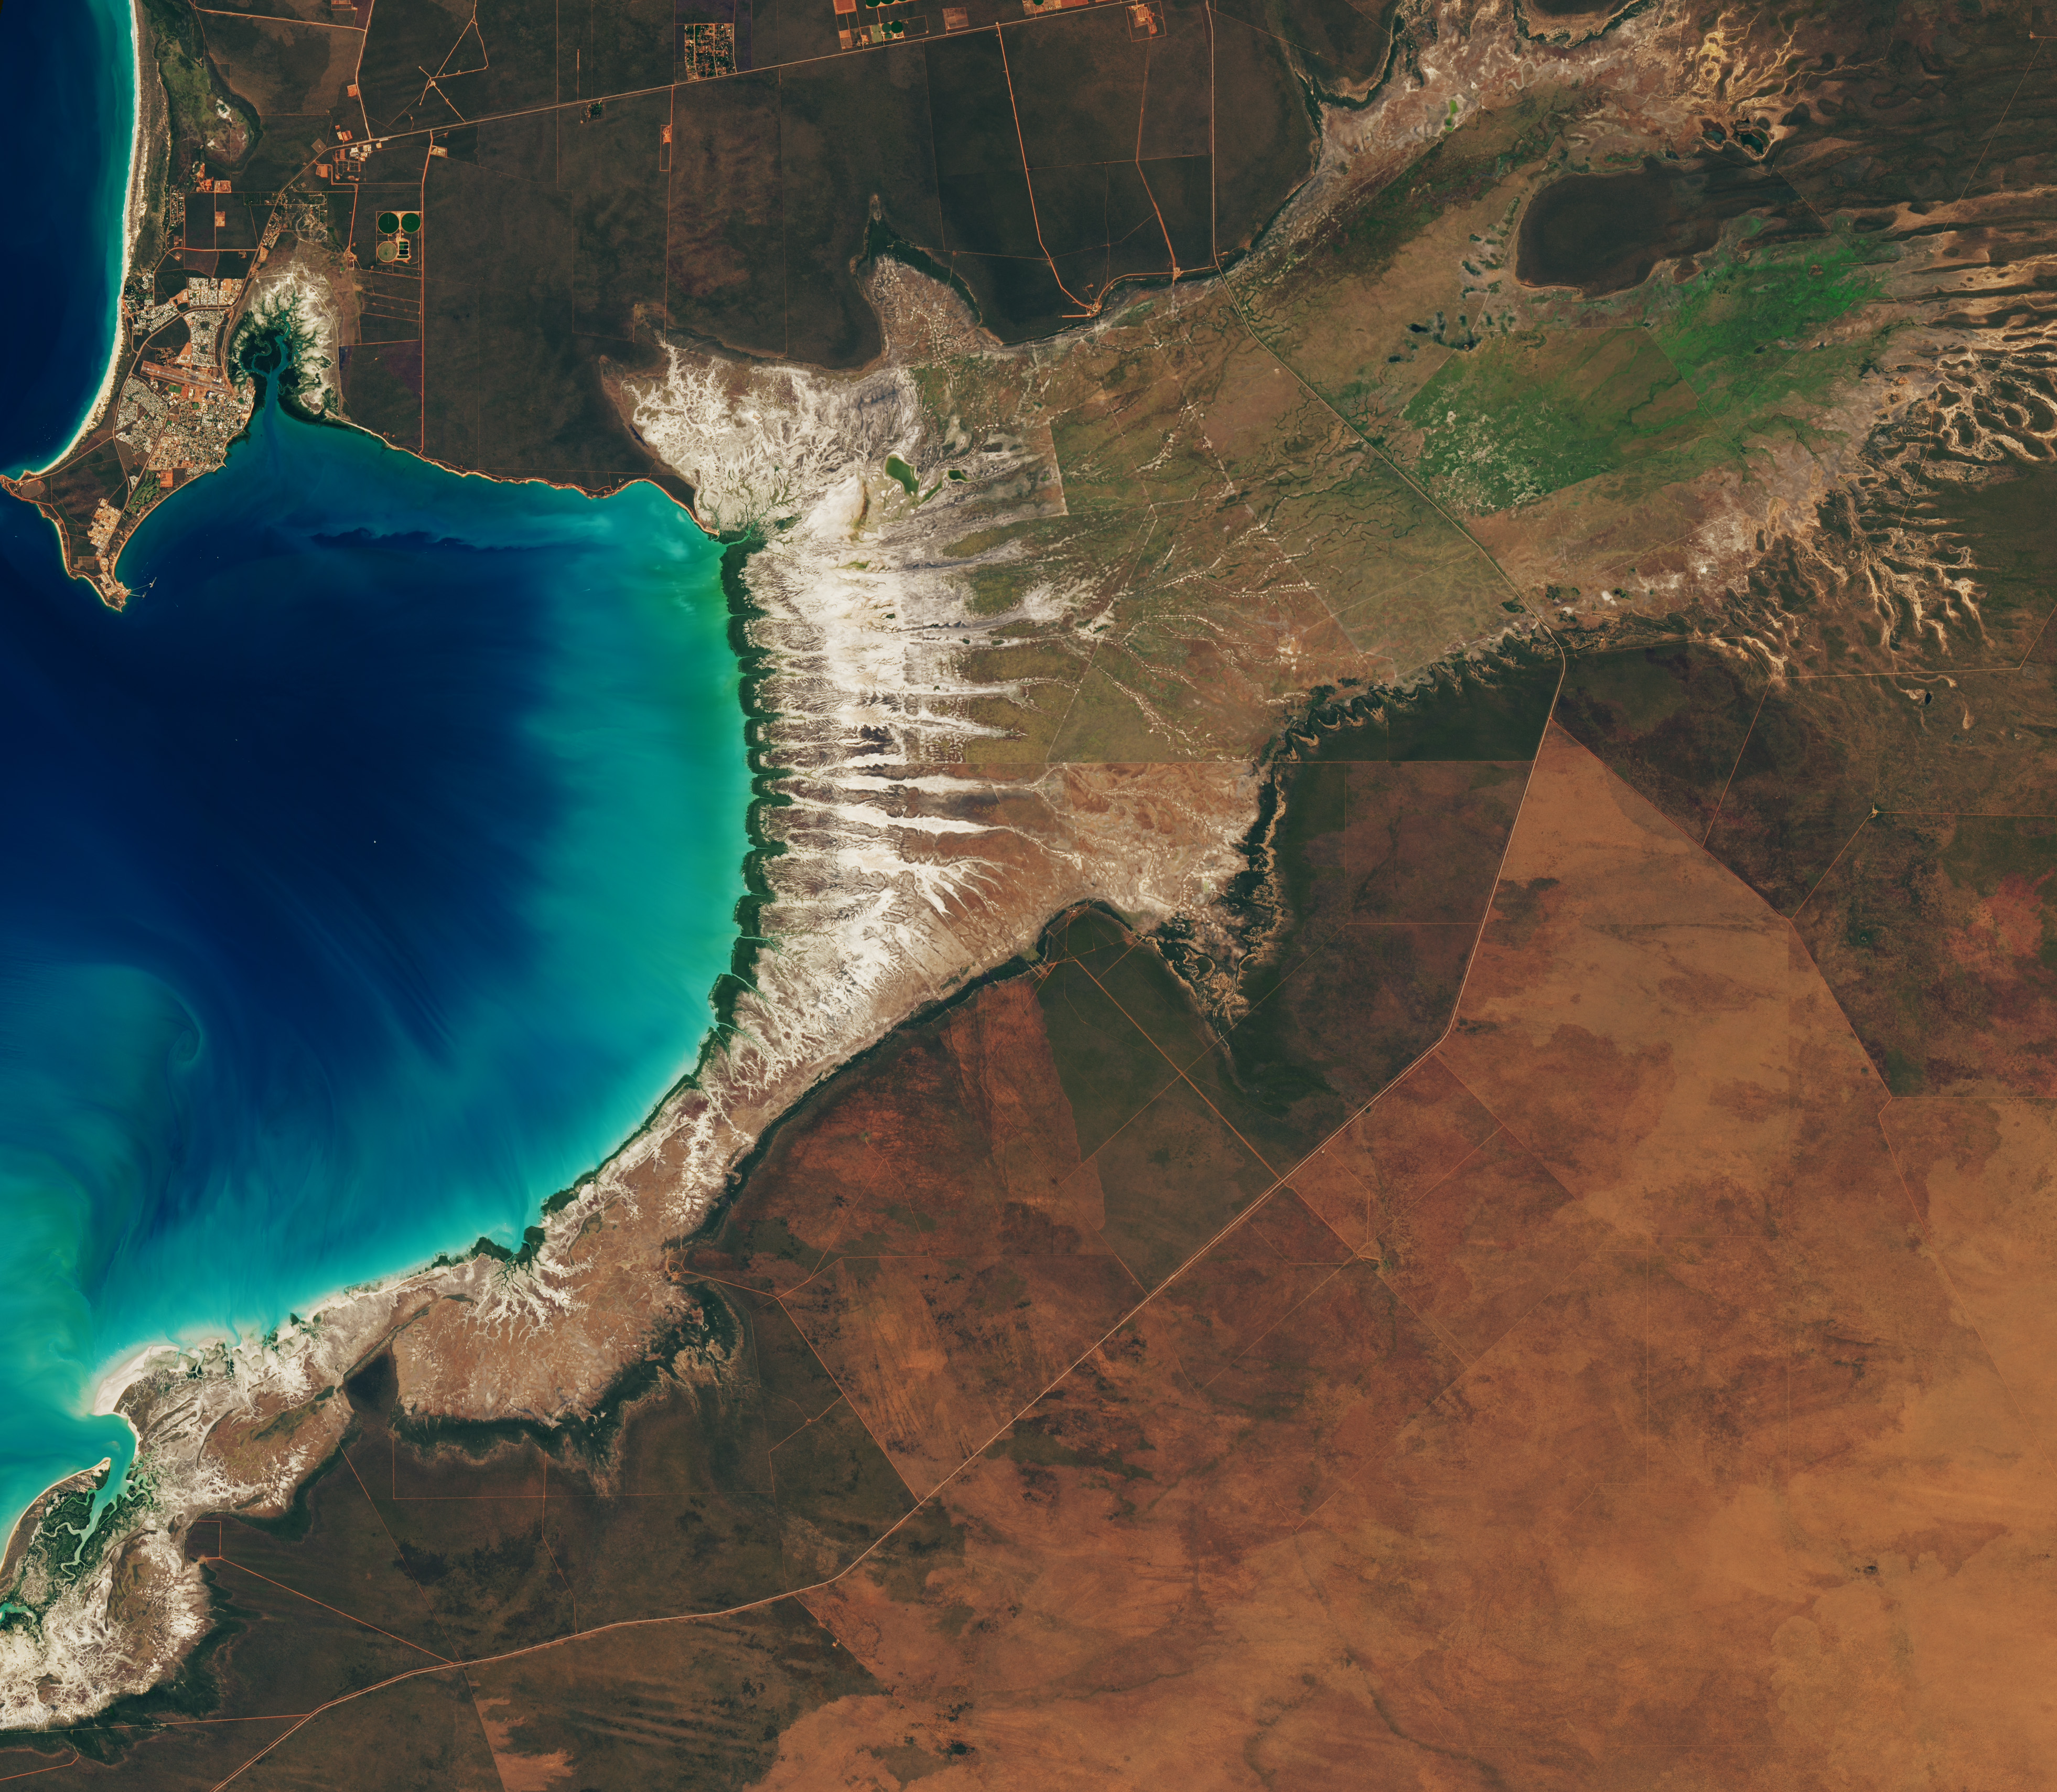
Landsat images from January 29 (left), March 18 (center), and June 30 (right) show seasonal changes. The tide was lower in the January image, exposing tan mudflats along the shoreline.
Around Roebuck Bay, inland vegetation greens after monsoon rains, peaking in March, and turns brown and dry by June. The Landsat 8 and 9 satellites captured these images throughout 2026.
NASA Earth Observatory / Lauren Dauphin

Monsoonal rains, typically falling between December and March, transform the landscape around the bay into lush grasslands and seasonal wetlands. As the rains fade in May and June and the dry season takes hold, these ephemeral grasses and sedge ecosystems die back, turning the landscape shades of gold and brown. The consistent spacing of the tidal creeks is likely not a tidal effect; it appears to be influenced by the regular spacing of linear dunes in the broader region, as seen in the plains to the east.

The bay’s dramatic tidal and seasonal changes are striking from above, and they also support a bounty of life on the ground. The mangroves serve as nurseries for crustaceans and fish, and the mudflats teem with dozens of types of invertebrates, including snails, worms, crabs, clams, and cockles. Shells and snails can reach an abundance of 2,500 per square meter, according to the Australian government.

This bounty of marine life is a major draw for birds. The bay, one of the most important sites for migratory birds in Australia and a key stop on the East Asian-Australasian Flyway, regularly hosts hundreds of thousands of birds, including plovers, godwits, and knots.

NASA Earth Observatory images by Lauren Dauphin, using Landsat data from the U.S. Geological Survey. Story by Adam Voiland.

Downloads

Tidal and seasonal shifts leave their mark on this crescent-shaped, productive bay in Western Australia's Kimberley region.

January 29, 2026

JPEG (3.65 MB)

Tidal and seasonal shifts leave their mark on this crescent-shaped, productive bay in Western Australia's Kimberley region.

March 18, 2026

JPEG (3.41 MB)

Tidal and seasonal shifts leave their mark on this crescent-shaped, productive bay in Western Australia's Kimberley region.

June 20, 2026

JPEG (3.61 MB)

References & Resources

You may also be interested in:

Stay up-to-date with the latest content from NASA as we explore the universe and discover more about our home planet.

Contours of the James Bay Lowlands
3 min read

After the Laurentide Ice Sheet retreated from present-day Hudson Bay, rebounding land has revealed striking nearshore topography.

Article
Why Maine’s Sandy Shorelines Turn Jagged
4 min read

Differences in the underlying bedrock and how rivers distribute sediment make the coastlines west of Portland look unlike those northeast…

Article
San Francisco’s Metropolitan Mosaic
3 min read

Urban development, green spaces, and maritime activity converge in this Northern California city.

Article

The post Bountiful Roebuck Bay  appeared first on NASA Science.

Bountiful Roebuck Bay 

11 August 2026 at 05:01
Blue coastal waters border a fringe of dark green mangroves with branching, linear tidal creeks and pale tidal flats and drainage channels visible to the east.
Water covers intertidal mudflats around Roebuck Bay in Western Australia, as seen in this image captured by the OLI (Operational Land Imager) on Landsat 8 on March 18, 2026.
NASA Earth Observatory / Lauren Dauphin

Editor’s Note: Today’s story is the answer to the August Puzzler.

Tides are among the clearest signs of the Moon’s pull on Earth. Just 239,000 miles (385,000 kilometers) away, the Moon’s gravity pulls on Earth’s oceans and solid crust, subtly distorting them into a more oblong shape with bulges roughly extending toward and away from the Moon.

High tides happen throughout Earth’s oceans, but in some places they leave an unusually strong fingerprint on the landscape. Among those places is Roebuck Bay, a crescent-shaped feature in the Kimberley region of Western Australia.

Roebuck Bay’s tidal range can reach a remarkable 9 meters (30 feet). Rising and falling tides repeatedly inundate and expose expansive mudflats, flood broad mangrove forests and salt marshes, and feed branching networks of tidal drainage channels. Many parts of Australia have tidal ranges of 2 meters or less. But the large range at Roebuck Bay is mostly a consequence of northwestern Australia’s unusually wide, shallow continental shelf, which helps amplify tides as they approach the coast.

The image at the top of the page shows the bay on March 18, 2026, when water levels were high. Green mangrove forests grow thickly along the shoreline and line the mouths of a network of evenly spaced, linear tidal creeks. These mangrove forests are dynamic. Analysis of decades of Landsat observations shows them expanding westward by nearly 2 meters per year as sediment from the waterways to the east accumulates in the sheltered bay.

Farther inland, branching networks of tidal drainage channels connect with the tidal creeks, giving the bay its feathered appearance. These channels, partially obscured by thick vegetation in March, were more visible earlier and later in the year, when vegetation was thinner.

Landsat images from January 29 (left), March 18 (center), and June 30 (right) show seasonal changes. The tide was lower in the January image, exposing tan mudflats along the shoreline.
Around Roebuck Bay, inland vegetation greens after monsoon rains, peaking in March, and turns brown and dry by June. The Landsat 8 and 9 satellites captured these images throughout 2026.
NASA Earth Observatory / Lauren Dauphin

Monsoonal rains, typically falling between December and March, transform the landscape around the bay into lush grasslands and seasonal wetlands. As the rains fade in May and June and the dry season takes hold, these ephemeral grasses and sedge ecosystems die back, turning the landscape shades of gold and brown. The consistent spacing of the tidal creeks is likely not a tidal effect; it appears to be influenced by the regular spacing of linear dunes in the broader region, as seen in the plains to the east.

The bay’s dramatic tidal and seasonal changes are striking from above, and they also support a bounty of life on the ground. The mangroves serve as nurseries for crustaceans and fish, and the mudflats teem with dozens of types of invertebrates, including snails, worms, crabs, clams, and cockles. Shells and snails can reach an abundance of 2,500 per square meter, according to the Australian government.

This bounty of marine life is a major draw for birds. The bay, one of the most important sites for migratory birds in Australia and a key stop on the East Asian-Australasian Flyway, regularly hosts hundreds of thousands of birds, including plovers, godwits, and knots.

NASA Earth Observatory images by Lauren Dauphin, using Landsat data from the U.S. Geological Survey. Story by Adam Voiland.

Downloads

Tidal and seasonal shifts leave their mark on this crescent-shaped, productive bay in Western Australia's Kimberley region.

January 29, 2026

JPEG (3.65 MB)

Tidal and seasonal shifts leave their mark on this crescent-shaped, productive bay in Western Australia's Kimberley region.

March 18, 2026

JPEG (3.41 MB)

Tidal and seasonal shifts leave their mark on this crescent-shaped, productive bay in Western Australia's Kimberley region.

June 20, 2026

JPEG (3.61 MB)

References & Resources

You may also be interested in:

Stay up-to-date with the latest content from NASA as we explore the universe and discover more about our home planet.

Contours of the James Bay Lowlands

3 min read

After the Laurentide Ice Sheet retreated from present-day Hudson Bay, rebounding land has revealed striking nearshore topography.

Article

Why Maine’s Sandy Shorelines Turn Jagged

4 min read

Differences in the underlying bedrock and how rivers distribute sediment make the coastlines west of Portland look unlike those northeast…

Article

San Francisco’s Metropolitan Mosaic

3 min read

Urban development, green spaces, and maritime activity converge in this Northern California city.

Article

El Niño Alters Marine Life in the Pacific

10 August 2026 at 05:01


june 2025
june 2026

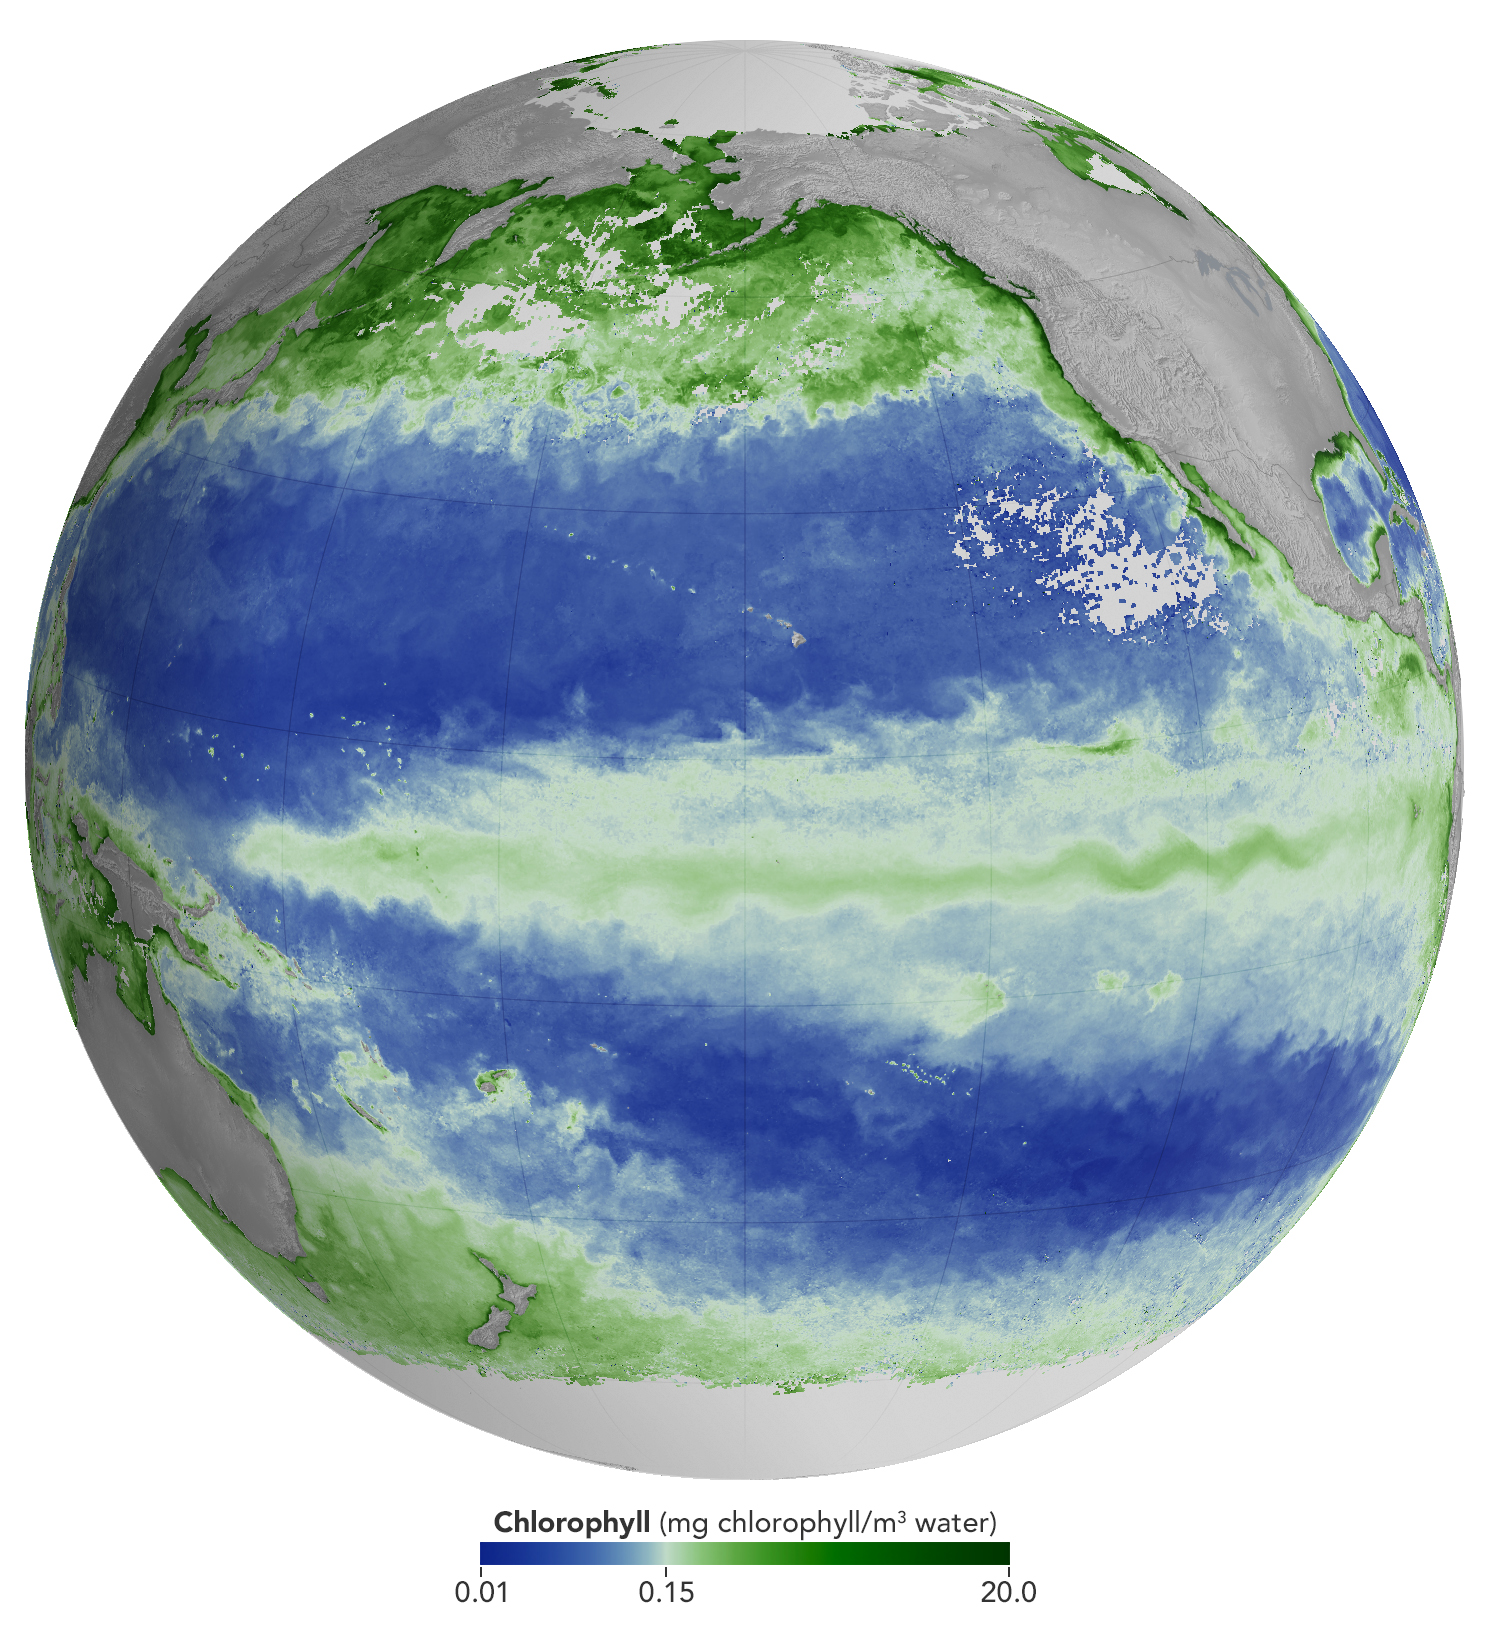
A global map centered on the Pacific Ocean shows a band of green across the equatorial region, indicating the presence of chlorophyll in surface waters.
NASA Earth Observatory/Michala Garrison

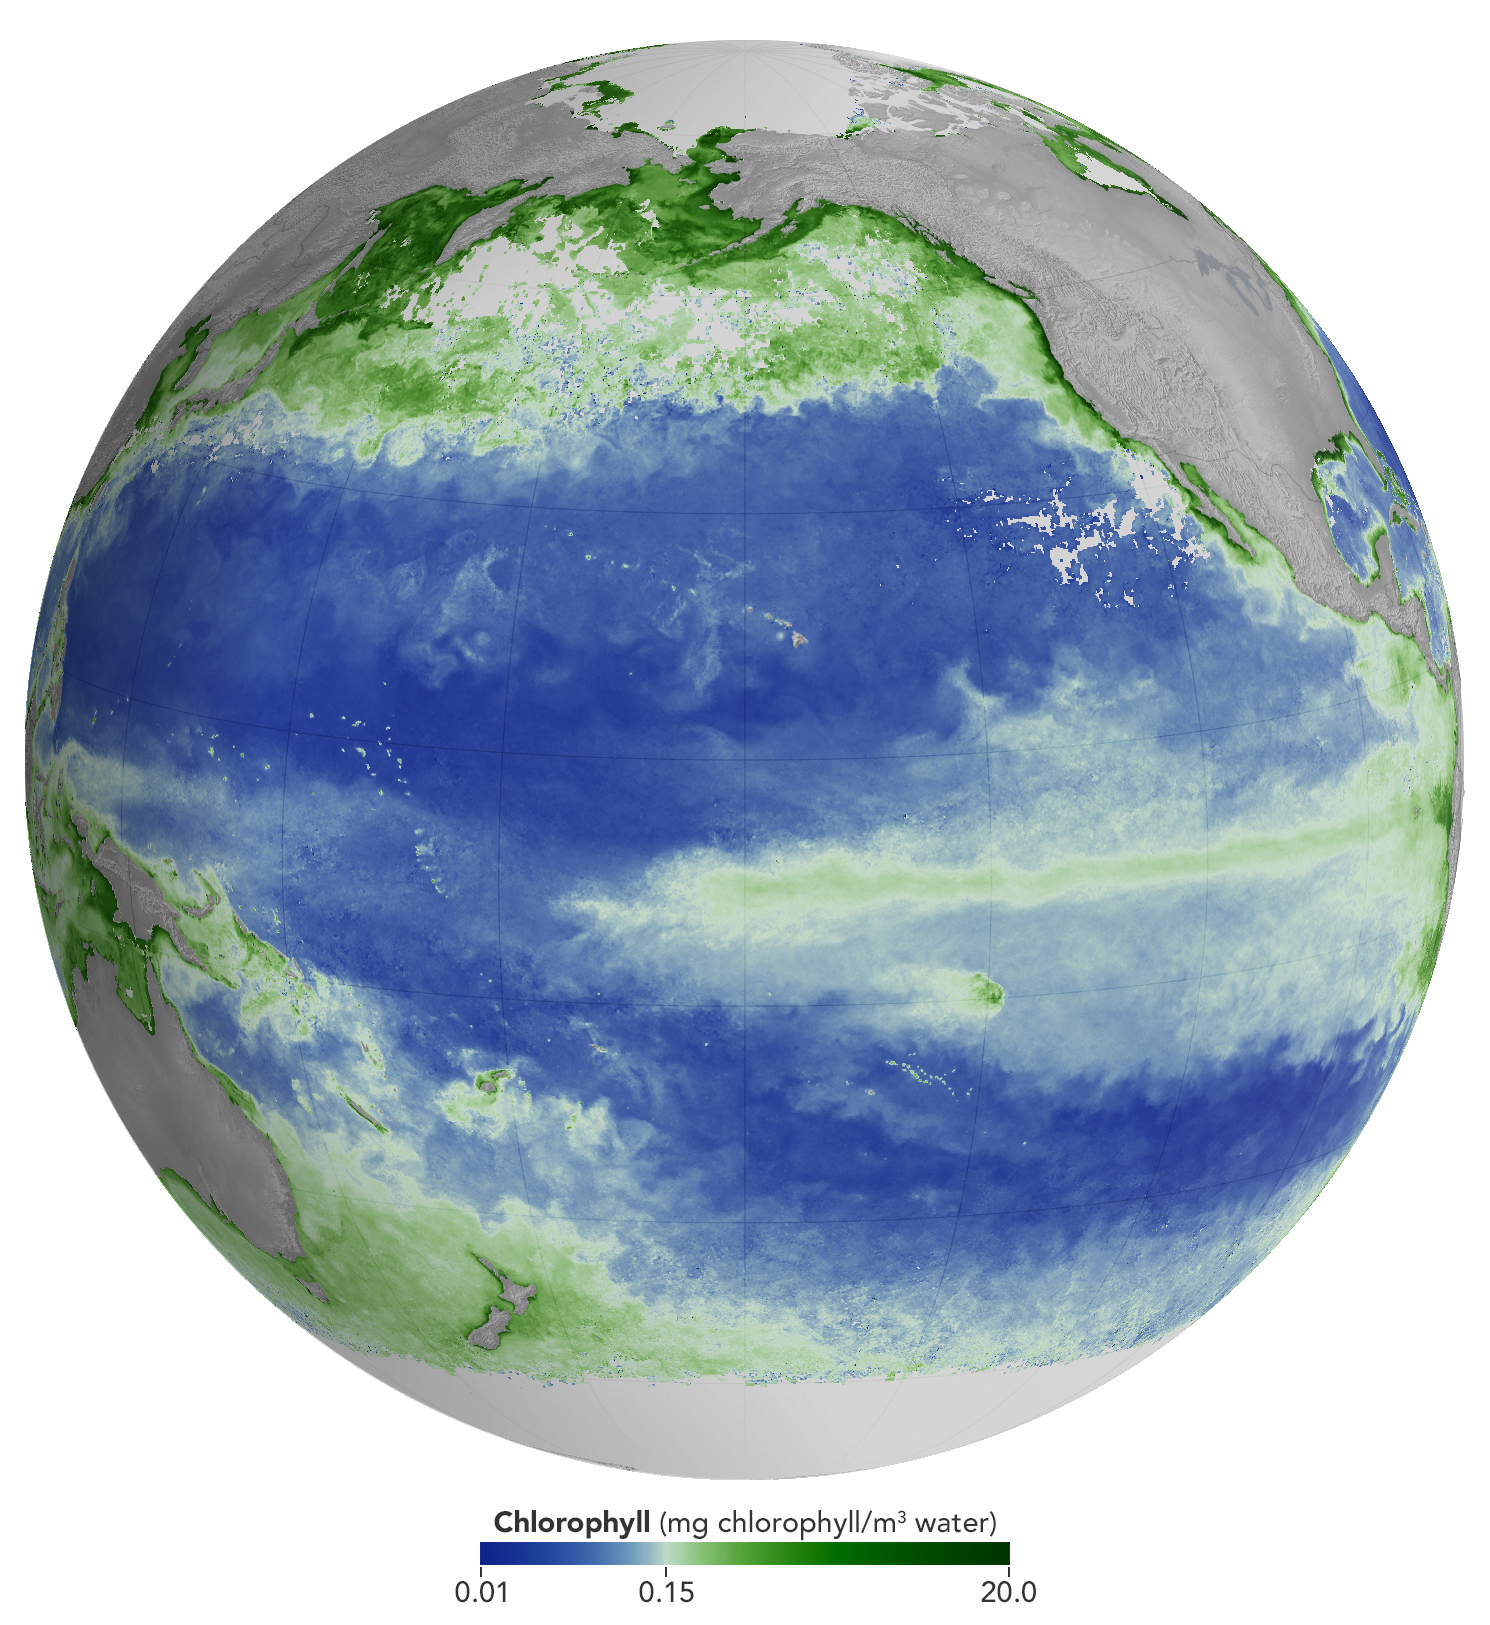
A global map centered on the Pacific Ocean shows a narrow band of green in the eastern equatorial region, indicating the presence of chlorophyll in surface waters. The central equatorial Pacific appears blue, meaning chlorophyll concentrations are low.
NASA Earth Observatory/Michala Garrison

A global map centered on the Pacific Ocean shows a band of green across the equatorial region, indicating the presence of chlorophyll in surface waters.
NASA Earth Observatory/Michala Garrison
A global map centered on the Pacific Ocean shows a narrow band of green in the eastern equatorial region, indicating the presence of chlorophyll in surface waters. The central equatorial Pacific appears blue, meaning chlorophyll concentrations are low.
NASA Earth Observatory/Michala Garrison

june 2025

june 2026


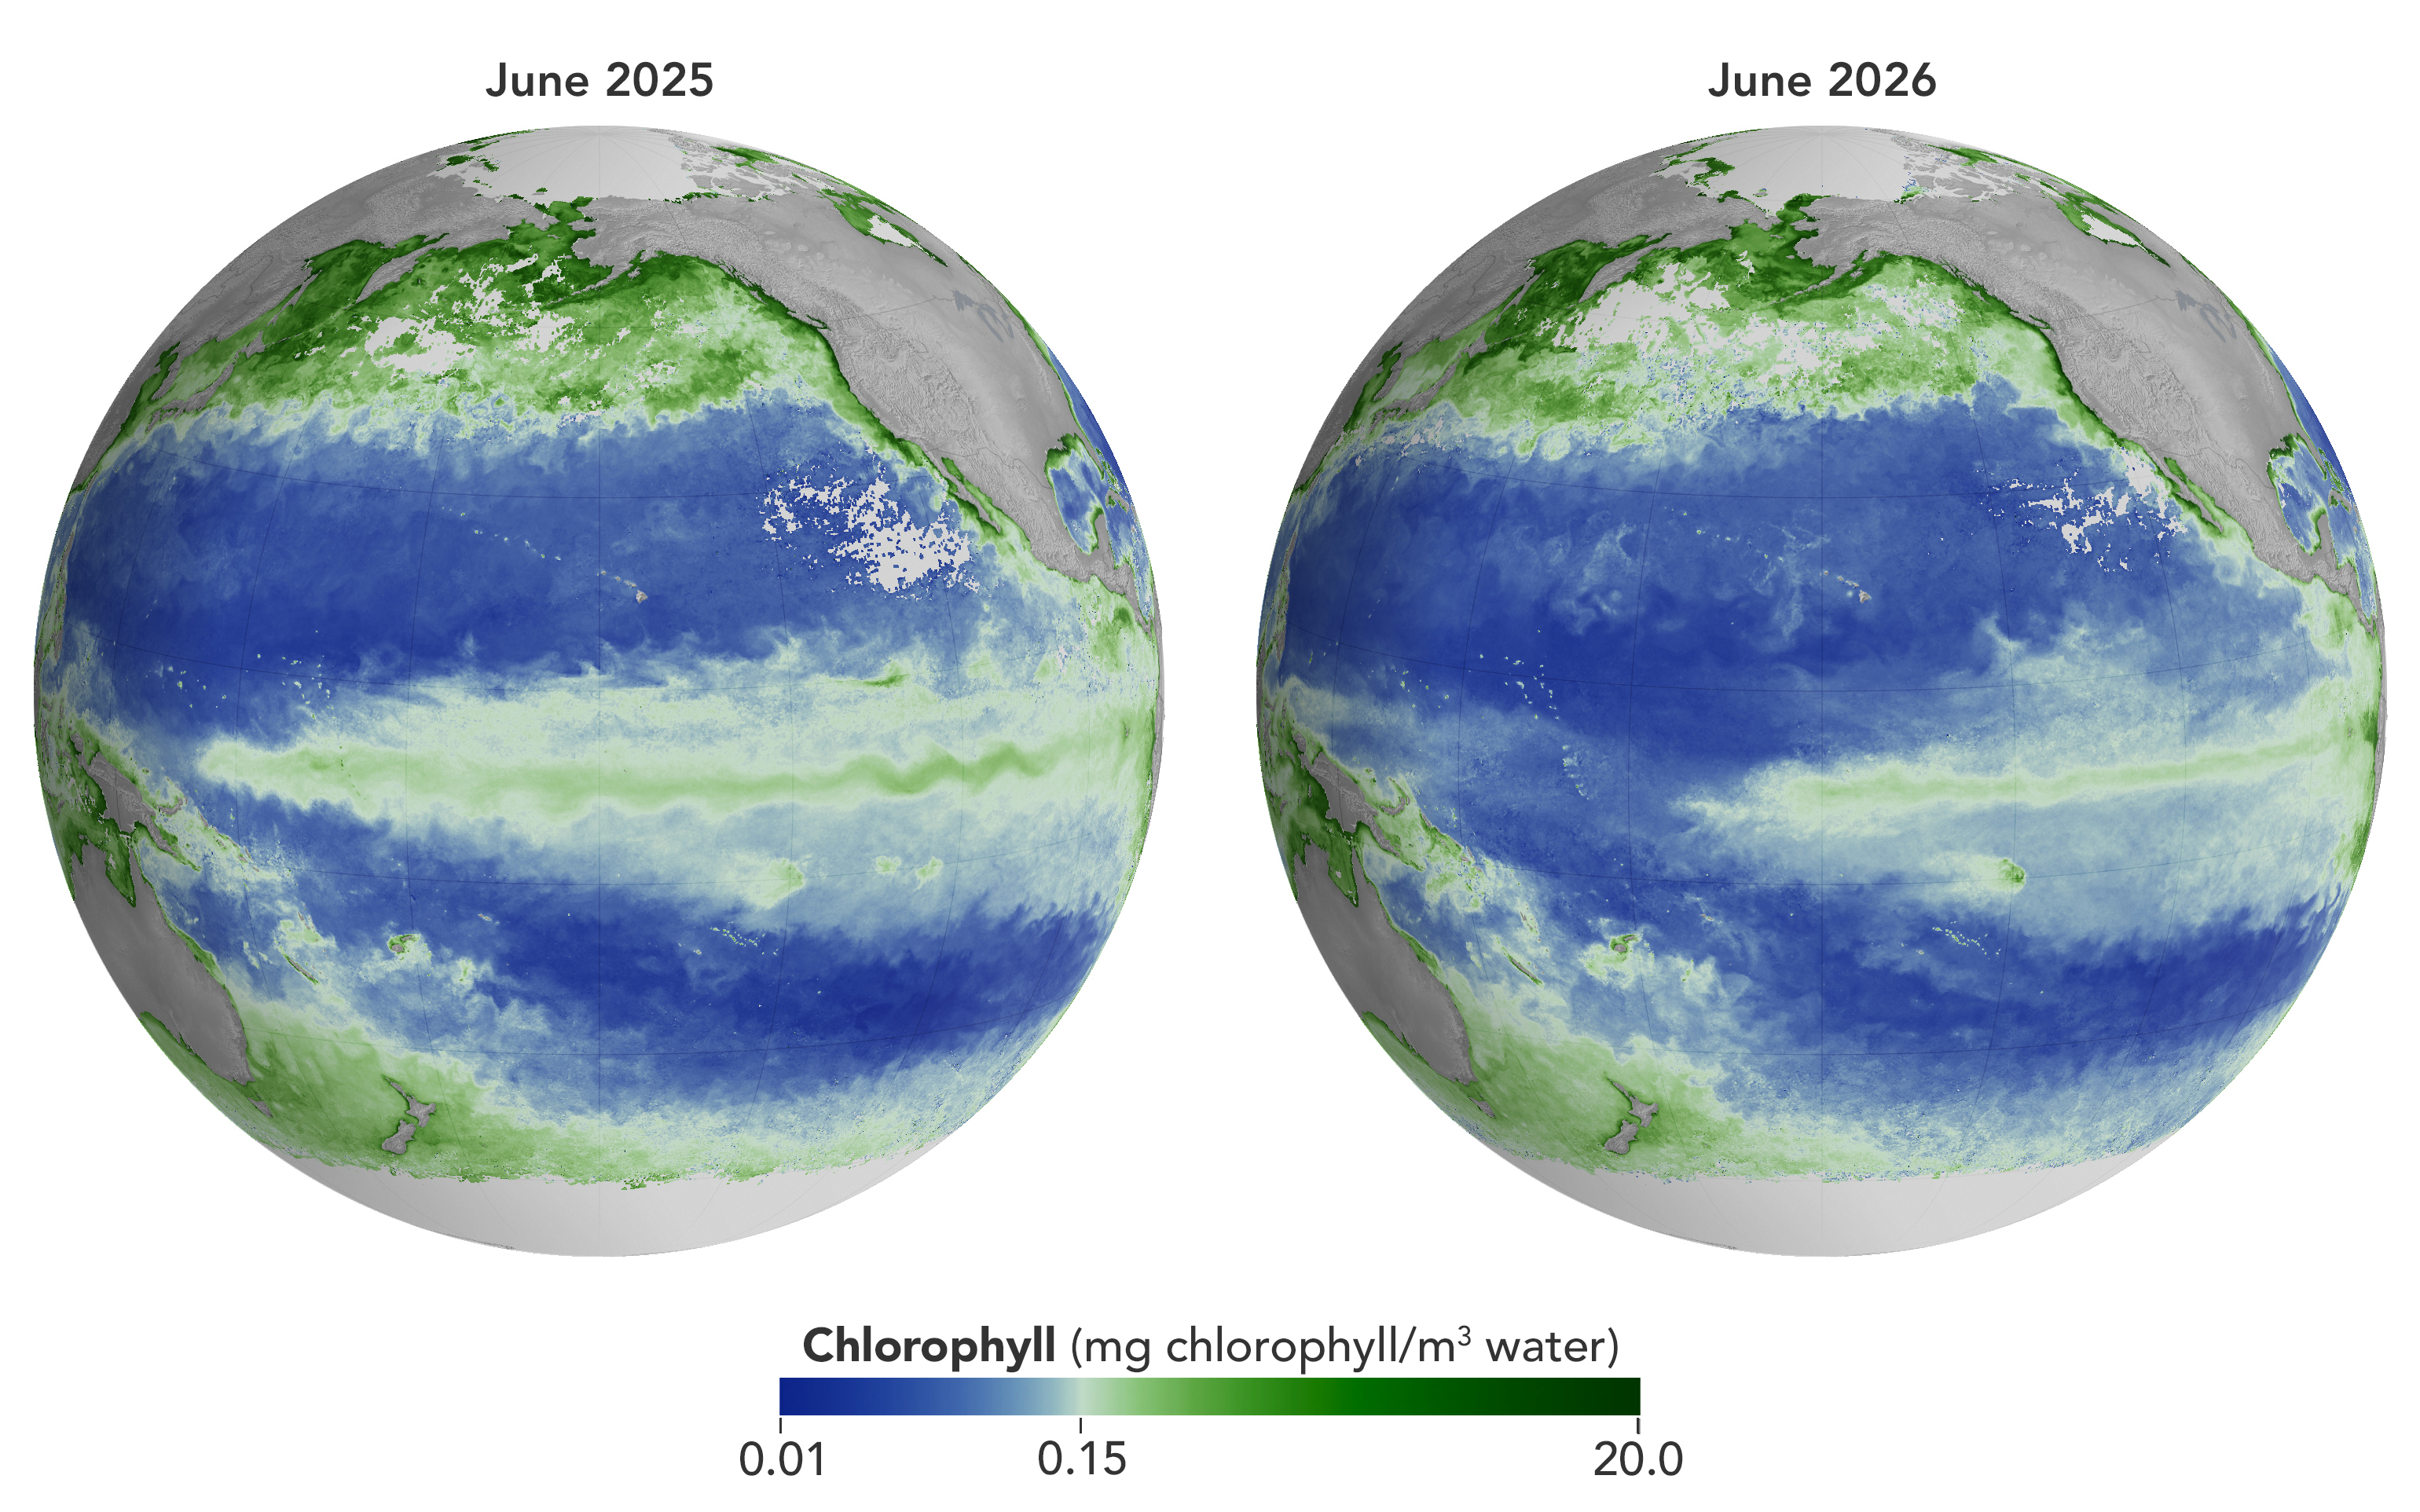
Concentrations of chlorophyll in the equatorial Pacific deviate from normal during El Niño events. These maps depict monthly average chlorophyll concentrations for June 2025 (left), under neutral conditions, and June 2026 (right), as El Niño was strengthening. Data come from the OCI (Ocean Color Instrument) on NASA’s PACE (Plankton, Aerosol, Cloud, ocean Ecosystem) satellite and are based on measurements of green and blue light from the ocean reflected back to the sensor. NASA Earth Observatory images by Michala Garrison.

As of June 2026, El Niño has officially arrived. This naturally recurring phenomenon is characterized by warmer-than-normal water temperatures in parts of the equatorial Pacific along with changes to atmospheric and oceanic circulation patterns. Its regional effects range from desert floods to delayed monsoons to shifts in where tropical cyclones are more likely to form.

NOAA’s Climate Prediction Center expects the current El Niño to continue to strengthen through the end of 2026, with a 97 percent chance of lasting through early Northern Hemisphere spring 2027. Even during El Niño’s early stages, satellites have observed characteristic changes along the equatorial Pacific, such as warmer-than-normal sea surface temperatures and higher-than-normal sea surface height.

Among the first ecological downstream effects are changes to the marine food web. The maps above show chlorophyll-a concentrations—the pigment present in most phytoplankton—as observed by the OCI (Ocean Color Instrument) on NASA’s PACE (Plankton, Aerosol, Cloud, ocean Ecosystem) satellite. In June 2025 (left), conditions were neutral, while in June 2026 (right), El Niño was strengthening.

The most noticeable difference appears in the central Pacific, around the equator due north of New Zealand: chlorophyll concentrations, an indication of phytoplankton abundance, are substantially lower in 2026. This change is expected, said Matthew Kehrli and Graham Trolley, oceanographers in the Ocean Ecology Laboratory at NASA’s Goddard Space Flight Center. That’s because during an El Niño, easterly equatorial trade winds weaken, the warm surface layer of the ocean extends deeper, and the upwelling of cool, nutrient-rich water that typically fuels phytoplankton growth is suppressed.  

As the El Niño progresses, the scientists anticipate the differences in the central Pacific will become more pronounced. “This may manifest as a greater difference in values across the current region, as a broadening region of reduced surface chlorophyll-a concentration, or both, depending on the behavior of the equatorial trade winds,” they said.

Reductions in phytoplankton have ripple effects through the marine food web, including in coastal regions. Less food is available for zooplankton, as well as for fish, seabirds, and marine mammals. Peru’s anchovy fisheries have seen profound declines in catch during past El Niños, driven similarly by warmer surface waters, reduced upwelling, and lower phytoplankton abundance. In 2026, Peru’s Ministry of Production repeatedly suspended the fishery to safeguard the country’s main fishing resource. Pelicans have been seen venturing into Peruvian ports and urban areas in search of food.

Although the disruptions to marine life can be severe, a post-El Niño “chlorophyll rebound,” with higher-than-normal concentrations in the equatorial Pacific, can occur. Research suggests that higher iron concentrations delivered in ocean currents, as well as dust arriving from drier land in parts of Central and South America, help fuel the resurgence—a rebound that doesn’t require a follow-on La Niña. La Niña, which often follows El Niño events, can also produce elevated chlorophyll concentrations. A strong La Niña in 1998–1999 set off a large phytoplankton bloom in the eastern Pacific and a dramatic increase in fish populations.

Scientists have new tools available for studying this sort of variability. The PACE mission launched in February 2024, making this the first complete El Niño event for which the satellite will gather global, near-daily hyperspectral measurements. “The scientific community will be able to observe the 2026 El Niño with data across more wavelengths of light than ever before,” Kehrli and Trolley said.

To better understand effects on life in the ocean, researchers hope to use PACE data to gauge the responses of specific phytoplankton communities to El Niño. And the possibilities extend beyond the marine realm, the scientists note. PACE’s sensors can measure plant pigment composition on land and clouds and aerosols in the atmosphere, all of which are influenced by El Niño.

NASA Earth Observatory images by Michala Garrison, using PACE data from the NASA Ocean Biology Distributed Active Archive Center OB.DAAC and processed by Matthew Kehrli. Story by Lindsey Doermann.

Downloads

A global map centered on the Pacific Ocean shows a band of green across the equatorial region, indicating the presence of chlorophyll in surface waters.

June 2025

JPEG (1.40 MB)

A global map centered on the Pacific Ocean shows a narrow band of green in the eastern equatorial region, indicating the presence of chlorophyll in surface waters. The central equatorial Pacific appears blue, meaning chlorophyll concentrations are low.

June 2026

JPEG (1.37 MB)

A global map centered on the Pacific Ocean shows a narrow band of green in the eastern equatorial region, indicating the presence of chlorophyll in surface waters. The central equatorial Pacific appears blue, meaning chlorophyll concentrations are low.

June 2025 + June 2026

JPEG (2.85 MB)

References & Resources

You may also be interested in:

Stay up-to-date with the latest content from NASA as we explore the universe and discover more about our home planet.

El Niño Is Underway

4 min read

Satellite observations of sea surface height indicated that the 2026 event continued to strengthen in early June.

Article

Color Off the Mid-Atlantic Coast

4 min read

Something is brewing in shallow waters offshore of Delaware, New Jersey, Maryland, and Virginia.

Article

Sizing Up the Sargassum Belt

6 min read

Seaweed composing the Great Atlantic Sargassum Belt hit near-record levels in June 2026, with the Caribbean Sea and Gulf of…

Article
❌