What it means: Autotrophs are organisms that can feed themselves with inorganic substances such as light (for plants) or methane (certain microbes). Autotrophs were the first single-celled life-forms to colonize the planet, thriving on chemicals bubbling up from the subsurface at deep-sea vents or figuring out how to harness the sun for energy. Heterotrophs (like you, me and all fungi), arrived on the scene later to feast on these DIY-ers.
How to use it in a sentence: Stromatolites, microbial mats built by cyanobacteria, are autotrophs that thrived in ancient shallow seas.
Can you crack our science word of the day puzzle, Chain Word?
This year's El Niño will almost certainly become the strongest ever recorded, an analysis by a prominent climate researcher has warned. Though other scientists have cautioned that it's still too early to say what it will unleash.
Dynamical models now assign a 90% chance of the 2026-2027 El Niño being an all-time record event, sending temperatures in the Pacific Ocean up to around 3.6 degrees Celsius (6.5 degrees Fahrenheit)above average, according to an analysis by Zeke Hausfather, a research scientist at Berkeley Earth and an author of the Intergovernmental Panel on Climate Change's Seventh Assessment Report.
As the warm phase of a multiyear natural climate pattern, the El Niño could bring unprecedented temperature extremes to an already-warming world. The natural climate pattern is infamous for boosting global temperatures and fueling disruptive weather events such as floods and droughts.
A strong El Niño doesn't guarantee more severe weather impacts. The current El Niño models are also imperfect predictions of what's to come, and we won't know the true nature of this El Niño event until it peaks, likely later this year. However, forecasters have been warning of potentially supercharged El Niño conditions for months, and as more data emerges, there are more reasons to prepare.
According to projections by the World Meteorological Organization, the current El Niño — officially declared on June 11— is on track to rapidly develop into a "strong" event between July and September. The National Oceanic and Atmospheric Administration's (NOAA) Climate Prediction Center now predicts a more than 80% likelihood of very strong El Niño conditions taking hold by the end of the year, ranking this El Niño event among the largest in the historical record.
"These are striking forecasts," Emily Black, a professor of terrestrial processes and climate at the University of Reading and a senior scientist at the National Centre for Atmospheric Science in the U.K., told Live Science in an email. "El Niño forecasts always come with uncertainty, but the level of agreement between models at this time of year, combined with the observed warming already underway in the tropical Pacific, means this should be taken very seriously."
"The important point is that a very strong El Niño would substantially shift the odds of damaging weather in many parts of the world, particularly in the Global South — with severe impact on livelihoods," Black added.
The International Rescue Committee, a humanitarian organization, has warned that the intense El Niño conditions threaten to unleash severe flooding and drought across East Africa and Asia, hitting some of the most vulnerable communities, Al Jazeera reported Tuesday (July 14).
El Niño continues and will strengthen through the end of the year, with a 97% chance it will persist through early spring 2027. An #ElNino Advisory remains in effect. #ENSO https://t.co/5zlzaZ1aZx pic.twitter.com/ASC46wKOn4July 9, 2026
During El Niño, warmer waters gather east of the equatorial Pacific, forcing the jet stream south. In the U.S., this typically brings warmer, drier conditions to the Northeast, while the Gulf Coast and Southeast experience an increased risk of flooding. Globally, the net result of the warmer waters is more heat in the atmosphere, on top of the temperature rise from human-driven global warming.
"El Niño is a natural climate phenomenon, but it is now happening against the backdrop of a much warmer planet," Black said. "That matters because a strong El Niño releases heat and energy into an already warmed world."
"This does not mean every impact can be attributed simply to El Niño or simply to climate change," Black added. "The two interact. El Niño can load the dice towards drought in some regions, flooding in others, marine heatwaves, disrupted monsoons and unusually high global temperatures. Climate change makes many heat extremes more severe and can intensify heavy rainfall because a warmer atmosphere can hold more moisture."
The last El Niño event occurred between 2023 and 2024. Both years broke temperature records, with 2024 becoming the hottest on record and the first to breach the 1.5-degree- Celsius (2.7 degrees Fahrenheit) warming limit set by the 2016 Paris Agreement. The current El Niño is forecast to be more intense than the one in 2023 and 2024, with the projected "very strong" status putting it in a different class of severity.
Residents wade through stagnant water over a flooded road at Kohoto estate in Naivasha, Kenya on November 17, 2025 (Image credit: Tony Karumba/AFP via Getty Images)
The strongest El Niño in history?
Hausfather's analysis reports that there's around a 90% chance that the current El Niño will be the strongest ever recorded, with data from multimodel forecasts suggesting that it may obliterate the previous record.
"With the July runs now in from 667 ensemble members across 14 different seasonal forecast models, it looks like this year's El Niño is not only very likely to be the strongest event since reliable records began — it may end up the strongest by a truly mind-blowing margin," Hausfather wrote in The Climate Brink Substack post published Monday (July 13).
NOAA recognizes El Niño conditions when the eastern tropical Pacific Ocean is at least 0.5 C (0.9 F) warmer than the historical average, while wind, surface pressure and rainfall in the region are also consistent with El Niño conditions. The El Niño is then categorized as weak, moderate, strong or very strong. A very strong El Niño (above 2 C, or 3.6 F, warmer than the historical average) is often nicknamed a "super" El Niño, though it's not a scientific term.
The July models suggest that temperatures will likely sail past 2 C above average in the coming months and could potentially even exceed 3.5 C (6.3 F) above average by the end of the year. This is based on newly introduced sea surface temperature forecasts that account for rising background temperatures that can inflate El Niño warming figures. In the traditional and most widely used indices, the temperature-anomaly forecasts cluster closer to 4 C (7.2 F), with some even exceeding 4 C.
This Sentinel-6 Michael Freilich satellite image captures the massive wave of warm water and higher-than-usual sea surfaces (red) that stretched across the Pacific on June 8, just a few days before El Niño was declared. (Image credit: Data for the map were acquired by the Sentinel-6 Michael Freilich satellite and processed by scientists at NASA’s Jet Propulsion Laboratory (JPL).NASA Earth Observatory/Lauren Dauphin)
In The Climate Brink Substack, Hausfather noted that the multimodel median for the event's peak is currently forecast at 3.6 C (6.5 F), or around 0.8 C (1.4 F) hotter than the prior record holder (2.75 C, set in the 2015-2016 El Niño event). Hausfather wrote that around 91% of ensemble members (individual computer models) have this El Niño exceeding the 2015-2016 record at their peak — around 77% likelihood in the newly introduced indices.
However, Black stressed that the models are still estimates, and not guarantees.
"It is certainly plausible that this could become a record-breaking El Niño, and the latest forecasts make that a real possibility rather than a remote one," Black said. "However, I would still be cautious about treating any probability estimate as a certainty."
"There are two reasons for caution," she added. "First, this event has not peaked yet, and El Niño events usually reach their maximum strength later in the year. Second, 'strongest ever recorded' depends on the index, dataset and baseline used."
"Impacts are what matter"
The most severe El Niño events have left a trail of devastation in their wake. For example, the 2015-2016 El Niño saw a record-breaking hurricane season in the central North Pacific, severe drought in the Caribbean and Ethiopia, and, of course, abnormally hot global temperatures, according to NOAA's Climate.gov. If the forecasts pan out, the current El Niño will match or exceed the 2015-2016 event, as well as an even more infamous super El Niño that occurred between 1877 and 1878, long before modern recordkeeping of El Niño began in 1950.
The 1877-1878 event likely fueled an extreme drought that fed into the 1876-1878 global famine, which ultimately killed more than 50 million people — making it among the worst humanitarian crises in history. However, the disaster was far from just an environmental one, with extractive colonial agricultural policies helping to create conditions for a massive humanitarian crisis. Nonetheless, the famine highlights what can happen when environmental and socioeconomic factors converge.
The El Niño-Southern Oscillation cycle triggers a warm El Niño and then a cold La Niña roughly every two to seven years, with each phase typically lasting around nine to 12 months. Carbon Brief has predicted that 2026 is likely to be the second-warmest year on record, with the intensifying El Niño increasing the likelihood that 2027 will be the warmest year ever recorded.
The strength of an El Niño event does not necessarily correspond to the size of its influence or impact, according to the Climate Prediction Center. More severe events typically, but not always, increase the certainty of expected impacts. Black believes the impact of an El Niño event is more important than where it ranks in the observational record.
"Records are compelling, but impacts are what matter," Black said. "Even if it falls just short of a record, a very strong El Niño can still have serious consequences. Finally, these forecasts are concerning, but they are also useful: they give societies time to anticipate possible impacts and act before the worst effects are felt."
Why it's incredible: It is the deepest lake in China and sits at the top of a giant volcano.
Heaven Lake is a crater lake at the top of Mount Changbaishan (also called Changbai Mountain) — a colossal, dormant volcano on the border between China and North Korea that formed through successive eruptions over the past 2.6 million years.
Known in China as Tianchi, the lake is the highest and largest crater lake in Northeast Asia, according to UNESCO. It is also the deepest lake in China, according to a study published in March. The lake sits at an elevation of around 7,200 feet (2,200 meters), covers roughly 3.6 square miles (9.2 square kilometers), and has a maximum depth of 1,224 feet (373 m), according to the study.
Heaven Lake is surrounded by 16 peaks that belong to Mount Changbaishan. The lake fills a caldera created by past eruptions, the biggest of which was the "millennium eruption" that took place in A.D. 946 and remains one of the largest eruptions in modern history.
Water started to pool on Mount Changbaishan's summit after the prehistoric Tianwenfeng eruption, which scientists dated to between 70,000 and 40,000 years ago. Heaven Lake has periodically emptied and refilled since then due to precipitation, snowmelt, and an active geothermal system beneath the volcano that forces water up through fault lines.
Although hundreds of reports in the early 2000s claimed there was a creature with a head shaped like that of a horse living in the water, scientists have repeatedly said they are skeptical that any large creature could survive in Heaven Lake.
Mount Changbaishan is one of the best-preserved stratovolcanoes from the past several million years, according to UNESCO. Stratovolcanoes, also known as composite volcanoes, are volcanic mountains built from alternating layers of solidified lava, volcanic ash and rocky debris. Mount Changbaishan is an "open-air classroom for volcanism" because it recorded the different stages of multiple eruptions in astounding detail.
In North Korea, Mount Changbaishan is known as Mount Paektu or Paeku Mountain, meaning "white-topped mountain." The volcano's Chinese name means "forever white mountain."
China, North Korea and South Korea have clashed over the volcano in the past, as the mountain holds cultural and geopolitical significance for the three countries. Two border treaties between China and North Korea in 1962 and 1964 divided the volcano and Heaven Lake roughly down the middle, with North Korea securing 54.5% of the lake.
In the 2000s, China moved to develop the region around the volcano, opening the Mount Changbai Airport and the Mount Changbai Eastern Railroad to connect the region with the rest of the country.
A geological park surrounding the Chinese site of the volcano was officially designated a UNESCO Global Geopark in 2024.
Discover more incredible places, where we highlight the fantastic history and science behind some of the most dramatic landscapes on Earth.
A large pit discovered by an amateur astronomer on Google Maps in 2024 is actually a 390 million-year-old meteor impact crater, scientists have confirmed.
Joël Lapointe was planning a camping trail through Quebec's Côte-Nord region when he stumbled upon a large indentation in the terrain, CBC reported at the time. The pit, centered around Lake Marsal, was about 25 kilometers (15.5 miles) in diameter and a near-perfect ring — it didn't seem like a normal ditch. Lapointe eventually got in touch with French geophysicist Pierre Rochette, who said that the surrounding topography was "very suggestive" of an impact crater.
Initial testing of samples retrieved from the site contained a mineral called zircon often formed during meteor impacts. However, zircon's presence alone was not enough to prove the crater's extraterrestrial origin story. So a team of scientists had visited the pit in person.
"One of the key things we look for is evidence for shock metamorphism, which can only occur due to the immense pressures created by asteroid or cometary impacts — or nuclear explosions," Gordon Osinski, a professor of planetary geology at Western University, told Live Science in an email. "Most of these features are microscopic, so you can only confirm in the lab with samples."
But there is one feature Osinski said can be seen with the naked eye: grooves or lines in the rock's surface called shatter cones, which are caused by shockwaves passing through the ground.
In October 2025, Osinski and a team of geologists visited the site to investigate whether any of these features were present. "This was one of the most arduous expeditions I’ve ever done — and I’ve done 25 expeditions to the Arctic and 6 continents," he said. "The terrain was incredibly rough and rugged, plus [there were] lots of bugs."
But they eventually found what they were looking for — shatter cones. They also discovered big cliffs of impact melt rock, created by the intense temperatures and pressures produced by a meteor impact. "You can melt literally tens of cubic kilometres of the Earth's crust when you get a big enough asteroid hitting," Osinski told CBC.
A) Shatter cone at the center of the structure. B) melt rock 4 km (2.5 miles) west of the structure center (Image credit: Gattacceca, J. et al.)
Osinski, who runs a website called Impact Earth dedicated to verifying meteor impact sites, is used to getting emails about strange looking satellite images. "I get lots of messages from the public thinking they have found a crater and 99/100 turn out not to be the case," he told Live Science. "This is one of those rare examples that shows this is possible."
So far, we know of roughly 200 impact craters on Earth, 31 of which have been found in Canada. "Typically about 1 or 2 craters are discovered per year, but these are typically less than 5-10 km [3 to 6 miles] in size," Osinski said. "[A crater of this size] is pretty rare."
The last meteor crater confirmed in Canada was in 2010.
After the new investigation confirmed the pit was punched out by a meteor impact, Osinski, Rochette and their team named it Uhaachatik Crater following discussions with the Ekuanitshit Innu council, a council representing the indigenous people in the area. The researchers will present their work at the Annual Meeting of the Meteorological Society in Germany next month.
Speaking to Radio-Canada, Lapointe said that he was very happy to hear his discovery had been confirmed as a genuine meteor crater. "It's not every day that an ordinary citizen finds a 390-million-year-old crater," he said. “I encourage everyone to not ignore intuition or an observation, even if it isn’t part of your field of expertise.”
Osinski and the team will continue their work on the collected samples to learn more about the impact site. "Any crater discovered offers us insight into how craters form and the effects that they can have on Earth’s geology, biology, and climate," he told Live Science.
New NASA Earth Missions Gear Up to Start Science Flights
Satellite imagery captured wildfires burning hot enough to generate pyrocumulonimbus clouds north of Lake Superior in July 2026. NASA aircraft will help scientists study the powerful storms as they develop.
Credits: CSU/CIRA & NOAA
Landslides in Alaska. Air quality in Atlanta. Fire clouds out West. From the Arctic fringes to farm country, NASA’s newest class of suborbital Earth Venture missions is gearing up to deliver science that will benefit communities in the United States and beyond.
The six projects will mobilize hundreds of scientists and pilots from NASA, the U.S. Navy, universities, and other institutions over the next several years. While the investigations range across topics, a defining feature of suborbital missions is the use of sensors mounted on aircraft.
Airborne remote sensing serves as a bridge between ground-based instruments and satellites. Data collected via planes, helicopters, drones, and balloons can fill in gaps in computer models used by weather forecasters, city planners, and others.
When wildfires create their own weather
The first project to take wing this summer is Injected Smoke and PYRocumulonimbus Experiment (INSPYRE), led by the Naval Research Laboratory. From mission headquarters in Colorado, the team will chase one of the least understood forms of severe weather on Earth: towering “fire clouds” generated when extreme wildfires burn hot enough to brew their own thunderstorms.
Pyrocumulonimbus clouds crackle with lighting in imagery captured over Utah and Colorado by the GOES-18 satellite in early July 2026.
CSU/CIRA & NOAA
Smoky and crackling with lightning, these unique storms can create blind spots for aviators above and spark new blazes below. Measuring and mapping the dangerous storms as they develop in real-time will help scientists forecast them in the future. Several aircraft, including NASA’s high-altitude ER-2, flying out of Montana, will carry a large suite of instruments over wildfire-generated storm systems. Among them will be two state-of-the-art infrared wildfire trackers, which were developed at NASA’s Jet Propulsion Laboratory (JPL) in Southern California and will be flying as part of the agency’s FireSense program.
Testing the air over farmland, megacities
Agricultural emissions represent an important and understudied part of Earth’s land and atmosphere systems. The FarmFlux mission, which kicks off this year, will deploy more than a dozen sensors to measure ozone, methane, ammonia, particulates, and other pollutants rising from agricultural lands and animal farms stretching from the Midwest to California’s Central Valley. These emissions affect human health, global climate, and stratospheric ozone. The mission is led by NASA’s Goddard Space Flight Center in Greenbelt, Maryland, along with Colorado State University, and Boston University.
NASA’s 777 aircraft is gearing up to start science flights. Structural modifications – like enlarged cabin windows and instrument portals – have transformed the former passenger plane into a flying laboratory. It’s seen here at Langley Research Center in Hampton, Virginia, in April 2026.
NASA/Ryan Hill
Two North American cities with air quality concerns are Atlanta and Mexico City. But the causes differ, with weather and terrain playing a role. To explore these differences, the Hemispheric Airborne Measurements of Air Quality (HAMAQ) mission will investigate areas of poor air in the two capitals and test how satellite information can help forecasting and mitigation efforts. The team will deploy two aircraft at different altitudes: NASA’s P-3B will fly close to the surface, directly measuring fine particle and gaseous pollutants, while the recently acquired 777 science jet will soar high above, mapping pollution with remote sensors. NASA’s Langley Research Center in Hampton, Virginia, is leading the mission.
Fast-changing north
As the Arctic warms at least twice as fast as the rest of Earth, data collected today can help guide communities on the front lines of change.
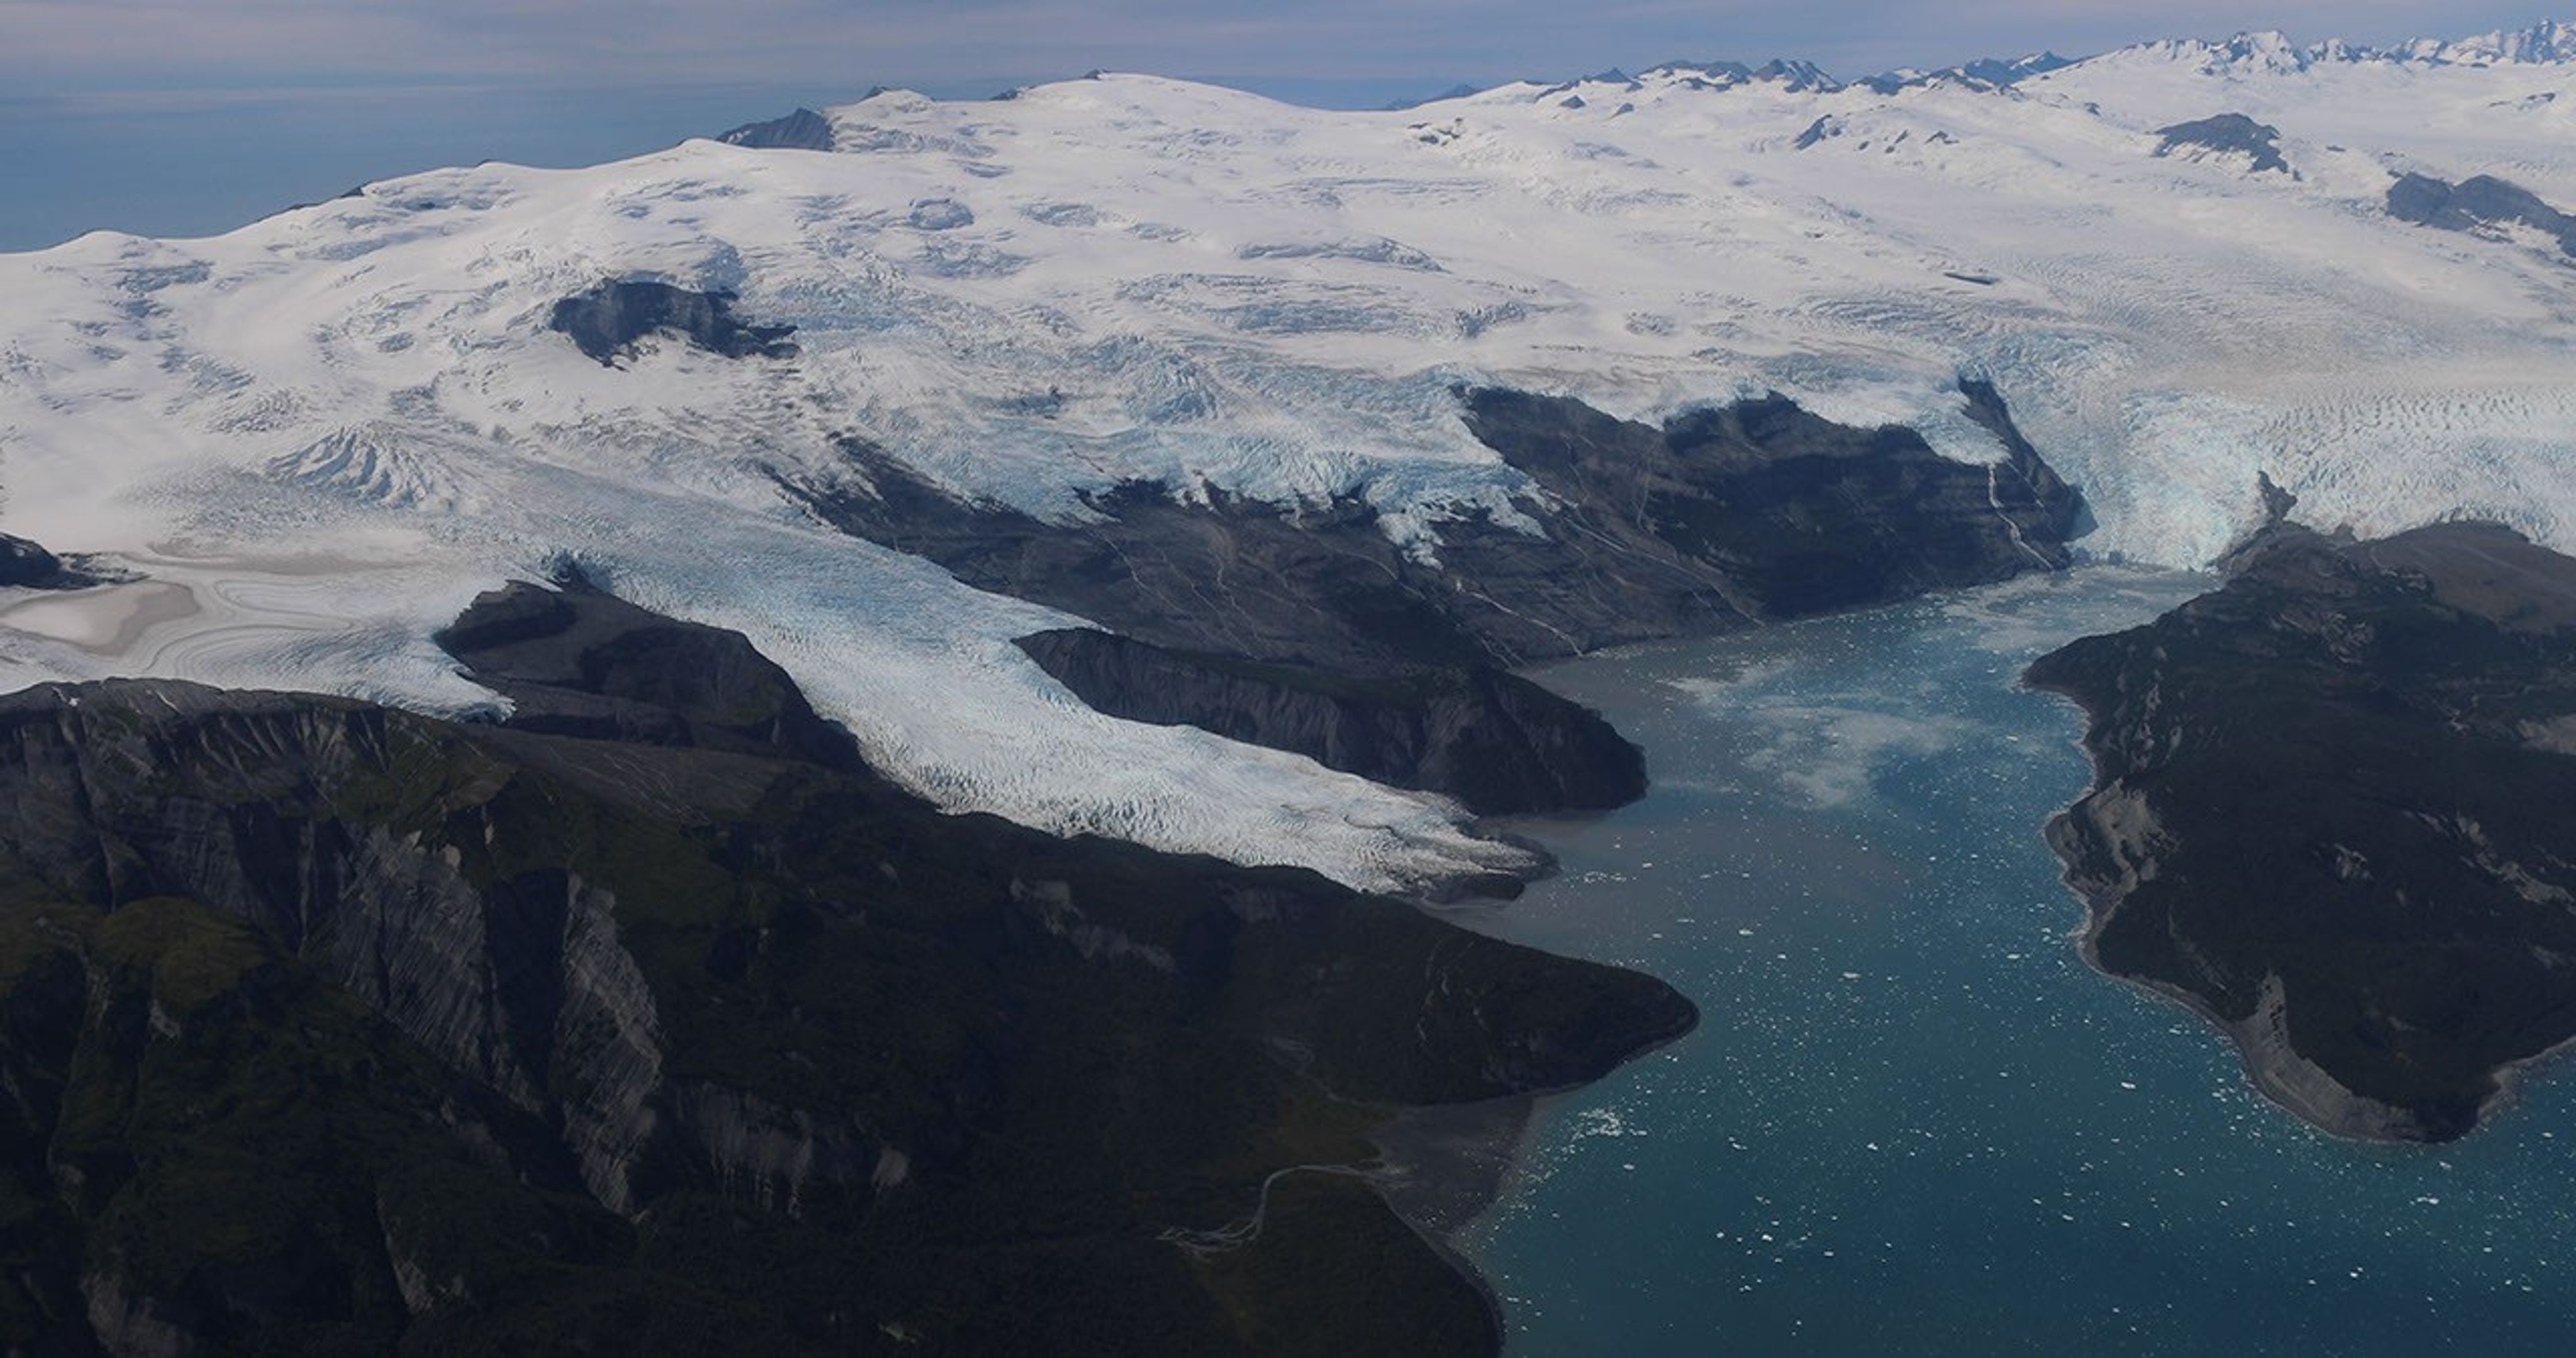
Alaska’s glaciers are losing ice and contributing to sea level rise. NASA is tracking the changes from land, air, and space.
NASA
The Snow4Flow campaign, led by the University of Arizona, seeks to measure and model how far and fast glaciers are retreating in the far north. Traversing remote icescapes across Alaska, the Yukon, Arctic Canada, Greenland, and Svalbard, Norway, they’ll sound both the near-surface and frozen depths of hundreds of glaciers while flying over in a modernized WWII-era aircraft outfitted with a scanning laser altimeter and two custom radars. Their observations, combined with satellite data and advanced models of snowfall and glacier flow, will advance our understanding of how glaciers behave in different regions of the Arctic. The mission seeks to uncover not just what these glaciers look like beneath the surface today, but the processes that will drive changes in the future.
As permafrost thaws, rivers on the doorstep of the Arctic become conveyor belts of carbon and sediment. NASA Goddard, and the City College of New York lead a multidisciplinary team studying how rivers, lagoons, and estuaries across Alaska’s North Slope interact with the Arctic Ocean. The project, called Frontlines of Rapidly Transforming Ecosystems (FORTE) will combine optical and radar measurements from satellites, planes, high-tech research vessels, drones, and underwater autonomous systems to track microscopic marine life, water flow, and chemistry. The team will collaborate with local and tribal communities to sustain observations over time and apply NASA assets to address emerging local needs and decision-making priorities.
Landslide triggers
When a slow-moving landslide in California suddenly collapsed and buried a section of coastal highway in 2017, scientists at NASA JPL wanted to know how precipitation swings played a role. JPL studies how water infiltrates and destabilizes hillslopes all over the world. The Landslide Change Characterization Experiment (LACCE) project will combine airborne synthetic aperture radar with land-based sensors to track how slopes in California are responding to a world of intensifying droughts and downpours. The project also takes aim at emerging landslide hazards in Alaska, where rapidly retreating glaciers are accelerating slope movements that have the potential to create mega-tsunamis.
This series of images shows the collapse of the Mud Creek landslide in May 2017 along the Big Sur coast in Central California, and the subsequent repairs to Highway 1, which was damaged during the event.
Andy Ritchie/USGS Pacific Coastal and Marine Science Center
NASA’s Earth Venture Suborbital program, designed to be nimble and high impact, was established following a recommendation by the National Research Council in 2007. In the decades since, teams have studied phenomena, including blizzards, coral reefs, and ocean whirlpools.

 Login