❌

Normal view

The Oldest Starlight

28 April 2026 at 17:00

illustration of stars in the early universe

Editor’s Note: Astrobites is a graduate-student-run organization that digests astrophysical literature for undergraduate students. As part of the partnership between the AAS and astrobites, we occasionally repost astrobites content here at AAS Nova. We hope you enjoy this post from astrobites; the original can be viewed at astrobites.org.

Title: Hunting for the First Explosions at the High-Redshift Frontier
Authors: Junehyoung Jeon et al.
First Author’s Institution: The University of Texas at Austin
Status: Published in ApJ

Back in the 1920s, astronomers discovered that we live within just one of many, many galaxies in the big, wide universe. Since then, we’ve been racing to search for the most distant galaxy that can be observed — in other words, searching for the oldest starlight we can see, since the light from these distant sources has been travelling towards us for most of the age of the universe. (Remember: more distant = higher redshift = longer lookback time.)

This race to the redshift frontier has had a pretty eventful history (see a great overview video here), which became even more eventful with the launch of JWST. JWST rapidly smashed the previous redshift (z) record of z = 10.6 by discovering a galaxy at z = 13.2, and then it broke its own record twice more. The current title holder sits at z = 14.4, observed less than 300 million years after the Big Bang.

Several galaxy candidates (to date unconfirmed) have now even been proposed at z ~ 25–32 (e.g., Capotauro), only 100 million years after the Big Bang! If real, these sources would pose a serious challenge to our understanding of the formation of the first galaxies, as galaxies shouldn’t really be observable at such early times. In today’s article, the authors put forward an intriguing alternative: what if some of these ultra-high-redshift candidates aren’t galaxies at all, but transient explosions from the universe’s first stars?

The First Stars and Their Explosive Endings

The earliest generation of stars (Population III; see my previous bite on these here) formed from pristine hydrogen and helium gas. Without metals to cool the gas efficiently, theory predicts that these stars were extremely massive, often exceeding 100 solar masses. While such stars would be short-lived, their deaths could be spectacular.

Population III stars of sufficient mass are predicted to end their lives as hyper-energetic pair-instability supernovae (PISNe). This is a long-winded name for a rapid, intensely hot explosion that leaves no remnant behind — not even a trace of the pre-existing star. Whilst nothing would remain of the star, the light emitted in that explosion could be bright enough to masquerade as a high-redshift galaxy candidate in current JWST surveys, but only if three key conditions are met:

  1. JWST must observe a sufficiently overdense region, where lots of Population III stars can form very early.
  2. A PISN must occur while JWST is “watching.”
  3. The explosion must be bright enough to rise above JWST’s detection limits.

Simulating a (Biased) Universe

To address the likelihood of these conditions having already been met by existing JWST observations, the authors turn to cosmological simulations. Rather than simulating an “average” patch of the universe, they focus on an extremely overdense region (Fig. 1). This creates a rare but important environment where structures collapse earlier than usual. These regions are exactly where large numbers of Population III stars are expected to form at the highest redshifts.
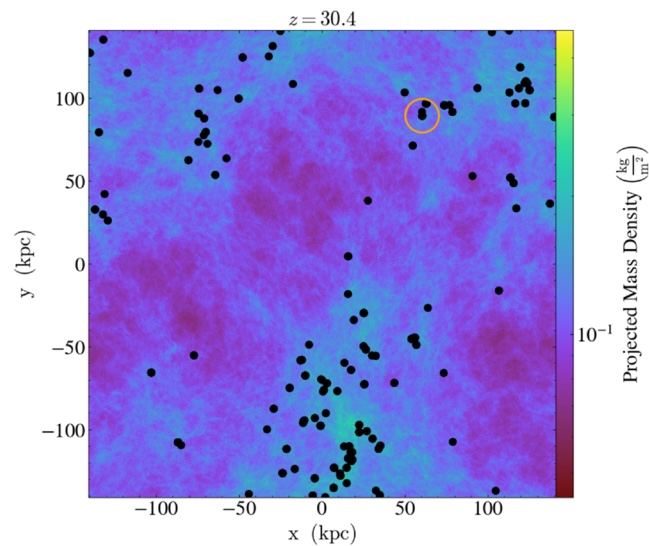
projection of the gas density in the simulated overdense region at z = 30.4

Figure 1: A projection of the gas density in the simulated overdense region at z = 30.4. The densest structures stand out clearly, tracing the locations where the first stars are able to form. Black dots mark newly formed groups of stars, while the most massive dark matter halo in the region is highlighted with an orange circle. The figure illustrates that in such an unusually dense patch of the early universe, star formation can already be underway just 100 million years after the Big Bang, creating the conditions needed for early Population III stars and their explosive deaths. [Adapted from Jeon et al. 2026]

In their simulations, star formation begins as early as z ~ 30–40 (within the first hundred million years after the Big Bang), producing Population III stars and, by extension, potential PISNe very shortly afterwards. While such overdense regions are rare, the authors show that the total area already surveyed by JWST (including large surveys such as CEERS, JADES, PRIMER, and COSMOS-Web) is large enough that it is plausible JWST has already observed at least one such region.

Catching a Cosmic Explosion in the Act

So, we can tick off condition #1: it’s possible that a sufficiently overdense region has already been observed by JWST. Next up, how lucky do we have to be to catch an explosion in the act (condition #2), so to speak? For this condition, cosmic time dilation actually works in our favour. A PISN explosion at z > 20 that lasts only months in its own rest frame can last for decades in the observed frame. (This whole time-being-relative thing sounds wacky because it is — please join me, Neil deGrasse Tyson, and countless others in struggling to imagine this.)

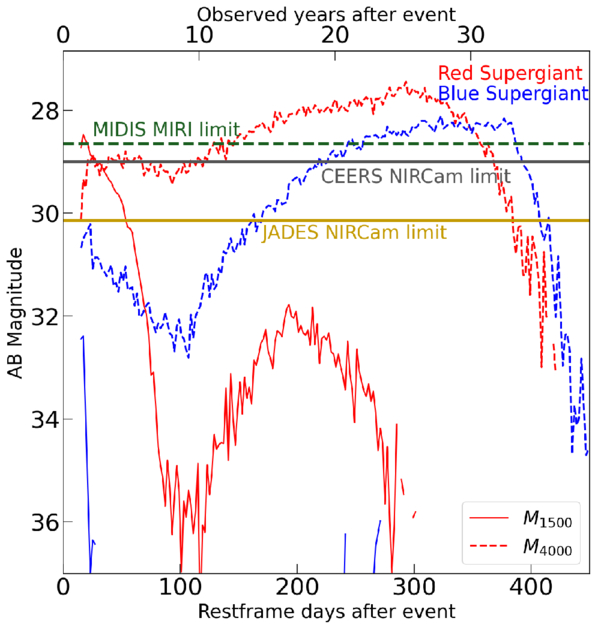
But would any such explosion be bright enough (condition #3)? Using theoretical PISN spectra, the authors show that these explosions could reach observed magnitudes of ~28–29 at z ~ 30 — right at the depth of current JWST deep surveys (Fig. 2). In fact, the predicted brightness and colours are somewhat comparable to those of some proposed z ~ 30 candidates (Fig. 3), raising the possibility that these objects could be PISNe rather than galaxies.
plot of predicted PISN brightness

Figure 2: This plot compares the predicted brightness of PISNe originating from different types of extremely massive stars to the depth reached by existing JWST surveys, showing that these explosions could remain detectable for ~20 years at peak brightness in the observed frame. [Jeon et al. 2026]
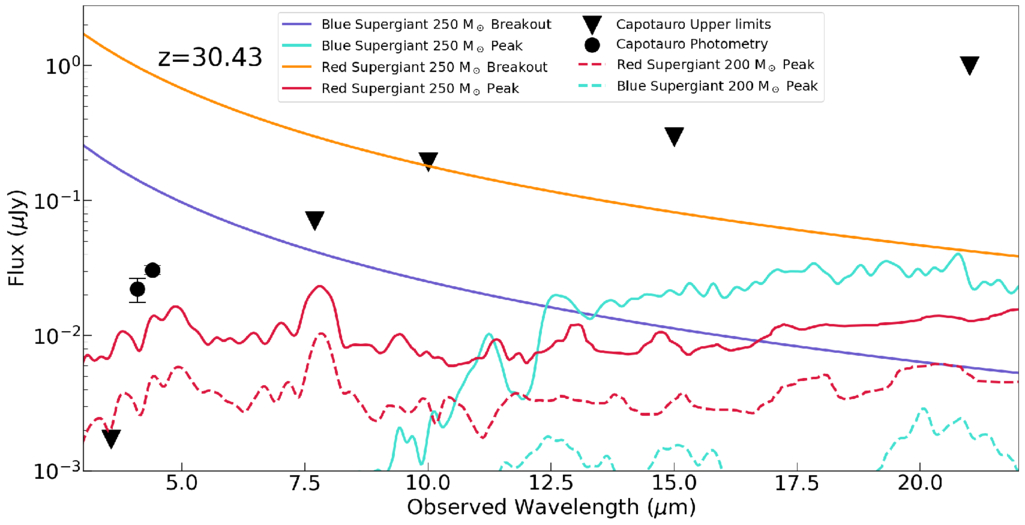
Theoretical PISNe spectra compared to a proposed z = 32 source

Figure 3: A comparison of theoretical PISNe spectra with the observed photometry of one proposed z ≈ 32 source (Capotauro). The coloured curves show model spectra for PISNe originating from extremely massive stars, at different stages of the explosion, while the data points represent the observed brightness of the high-redshift candidate across multiple JWST filters. [Jeon et al. 2026]

So… Are We Seeing the First Stars Die?

It’s not time to throw a party just yet. The authors note there are several caveats and uncertainties. The nature of Population III stars is still highly uncertain, JWST does not continuously monitor the same patch of sky, and identifying a PISN at such high redshift would be extremely challenging. Thanks to time dilation, these explosions would fade very slowly, making them hard to distinguish from steady sources using photometry alone. Alternatively, there are other plausible explanations for these ultra-high-redshift candidates: lower-redshift interlopers (a rather infamous example is CEERS-93316), local brown dwarfs, or even nearby exoplanets.

Still, the idea is exciting. If JWST were to detect a genuine PISN at z > 20, it would represent a direct glimpse of the very first stars, pushing observational astronomy into truly uncharted territory. For now, the most distant explosions in the universe may already be hiding in JWST images; we just have to learn how to recognise them.

Original astrobite edited by Nathalie Korhonen Cuestas.

About the author, Lucie Rowland:

I’m a fourth (and final!) year PhD student at Leiden Observatory in the Netherlands, studying massive, star forming galaxies in the early universe with ALMA and JWST. It’s a really exciting time to be interested in astronomy, so I hope to make groundbreaking new research more accessible!

The post The Oldest Starlight appeared first on AAS Nova.
A Possible GLIMPSE of the Universe’s First Stars

21 April 2026 at 17:00

Population III stars

Editor’s Note: Astrobites is a graduate-student-run organization that digests astrophysical literature for undergraduate students. As part of the partnership between the AAS and astrobites, we occasionally repost astrobites content here at AAS Nova. We hope you enjoy this post from astrobites; the original can be viewed at astrobites.org.

Title: GLIMPSE: An Ultrafaint ≃105 M⊙ Pop III Galaxy Candidate and First Constraints on the Pop III UV Luminosity Function at z ≃ 6–7
Authors: Seiji Fujimoto et al.
First Author’s Institution: University of Toronto; The University of Texas at Austin
Status: Published in ApJ

You, me, your laptop, my $8 matcha, and just about everything else on Earth was forged in the fiery bellies of dying stars. Generations of stars had to live and die before the universe became enriched with any elements heavier than helium (what astronomers call “metals”). The first stars to undergo this cosmic cycle are known as Population III (Pop III) stars. Though their existence has been hypothesized since the 1960s, astronomers have failed to observe these distant metal-free stars or the faint, low-mass galaxies that host them.

The first Pop III stars likely formed around 100 million years after the Big Bang in pristine pockets of hydrogen gas. Although these are too distant for us to observe, we expect that as the universe started to become metal enriched, there were still existing pockets of gas introverted enough to survive unpolluted and form metal-free Pop III stars up to a redshift of z ~ 6–7 (when the universe was around 900 million years old)!

JWST is the perfect instrument to search for these systems. You can read other astrobites on the search for possible Pop III systems with JWST here and here. The authors of today’s article seek to develop the most efficient way of using JWST’s Near-Infrared Camera (NIRCam) to find the galaxies hosting Pop III stars. Using their selection method on existing NIRCam data, the authors identified one promising Pop III galaxy candidate.

I’m Not Like Other Galaxies

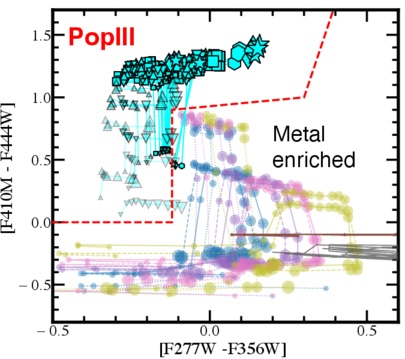
In order to find a Pop III galaxy, we need to take a look at galaxies’ spectral energy distributions (SEDs). These are graphs that show the energy emitted by a galaxy at different wavelengths of light. Pop III galaxies are expected to have SEDs that differ from your everyday, metal-enriched galaxy. NIRCam will be especially sensitive to three key spectral features that show up in the SEDs of Pop III galaxies: an absent [O III] line (light emitted by doubly ionized oxygen atoms), a strong H-alpha line (light emitted when a hydrogen atom transitions from its third to its second energy level), and a significant Balmer jump (light absorbed to ionize electrons in the second energy level of a hydrogen atom). To identify these key SED characteristics, the authors use SED fitting and color–color diagrams to execute an efficient Pop III search with NIRCam.

The first selection method involves SED fitting. Astronomers create template SEDs that represent different types of galaxies and then compare these templates to the observed SEDs to see which one matches best. In this work, the authors use metal-rich galaxy templates and Pop III templates to fit the galaxies observed with NIRCam. They then calculate the chi-squared χ2 (a statistical measure of best fit) between the data and all the SED templates. A galaxy is selected as a Pop III candidate if the Pop III model provides a good fit (χ2 < 10) to the photometry and is significantly better than any metal-rich model. It’s kind of like looking for Cinderella by making every woman in the kingdom try on the glass slipper.

A color-color diagram showing how Pop III models lie in a different parameter space than metal-rich galaxies.

Figure 1: Color–color diagram for selecting Pop III galaxies where the x and y-axes show the different NIRCam filters being subtracted. The cyan symbols are different Pop III models while the other colored dots are different metal-rich galaxy models. [Adapted from Fujimoto et al. 2025]

A color–color diagram plots the difference in magnitude between two filters on each axis. NIRCam filters are specially chosen to emphasize the SED characteristics above. When these filters are chosen, Pop III galaxies occupy a distinct region of this diagram as compared to metal-rich galaxies. For example, subtracting the F356W filter from the F277W filter is sensitive to the presence of the [O III] line and the Balmer jump. Figure 1 demonstrates how this color selection separates Pop III galaxies from typical galaxies.

O Pop III, Pop III, Wherefore Art Thou?

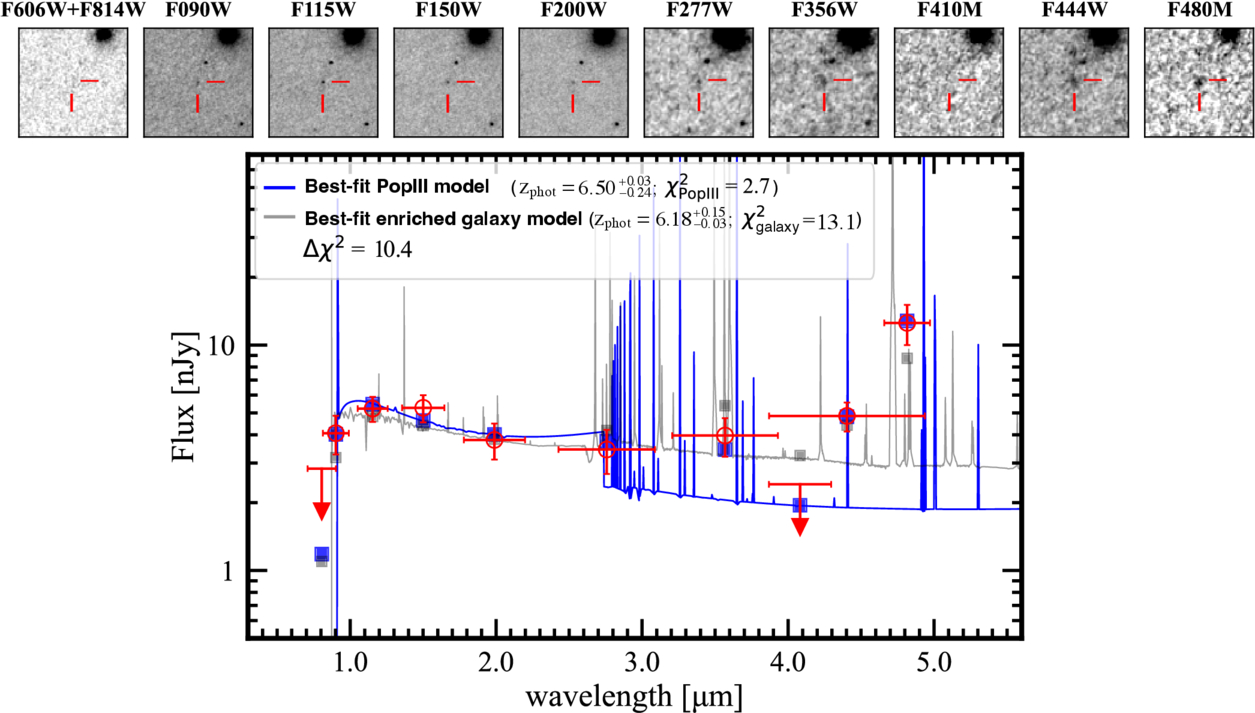
The authors apply their fresh new selection criteria to publicly available NIRCam data from large surveys. And (drum roll please) the slipper fits! The Pop III galaxy candidate GLIMPSE-16043 is an ultra-faint galaxy at z = 6.5. It was imaged in the GLIMPSE survey, which uses the technique of gravitational lensing to observe faint and distant galaxies.

The GLIMPSE survey targeted a massive galaxy cluster, Abell S1063. The cluster bends the light from distant galaxies and, like a giant lens, magnifies faraway objects, providing some of the deepest JWST imaging to date. The Pop III candidate passes both tests: it resides in the Pop III region of the color–color diagram, and its SED is best fit by a Pop III model, not a metal-rich galaxy model (see Figure 2). Next, spectroscopic follow-up is needed to ensure that this galaxy is truly metal free and not just extremely metal poor.

The spectral energy distribution of a Pop III galaxy candidate. This plot shows that the JWST data is best fit by a Pop III model rather than a metal-rich galaxy.

Figure 2: SED of GLIMPSE-16043 with the best-fit Pop III template (blue) and best-fit metal-enriched template (gray). The top panel is the galaxy imaged in different filters from NIRCam and the Hubble Space Telescope. [Fujimoto et al. 2025]

The authors conclude that our best shot at identifying additional Pop III galaxy candidates is using NIRCam to image large numbers of gravitationally lensed clusters. Without magnification from gravitational lensing, it may be impossible to see these ultra-faint Pop III galaxies. Once candidates have been identified, they can be followed up with deep spectroscopy to confirm their redshift and their lack of metals. Who knows? With these new methods, we may soon get a glimpse of the universe’s very first stars.

Original astrobite edited by Chris Layden and Margaret Verrico.

About the author, Madison VanWyngarden:

I am a first-year PhD student in astronomy and NSF Graduate Research Fellow at the University of Arizona. I study galaxy formation and evolution in the distant universe and am particularly interested in dusty star-forming galaxies. In my free time, I love reading, hiking, and baking bread!

The post A Possible GLIMPSE of the Universe’s First Stars appeared first on AAS Nova.

Featured Image: Massive Stars in the Making

10 April 2026 at 17:00

W51A star forming region

W51A study region

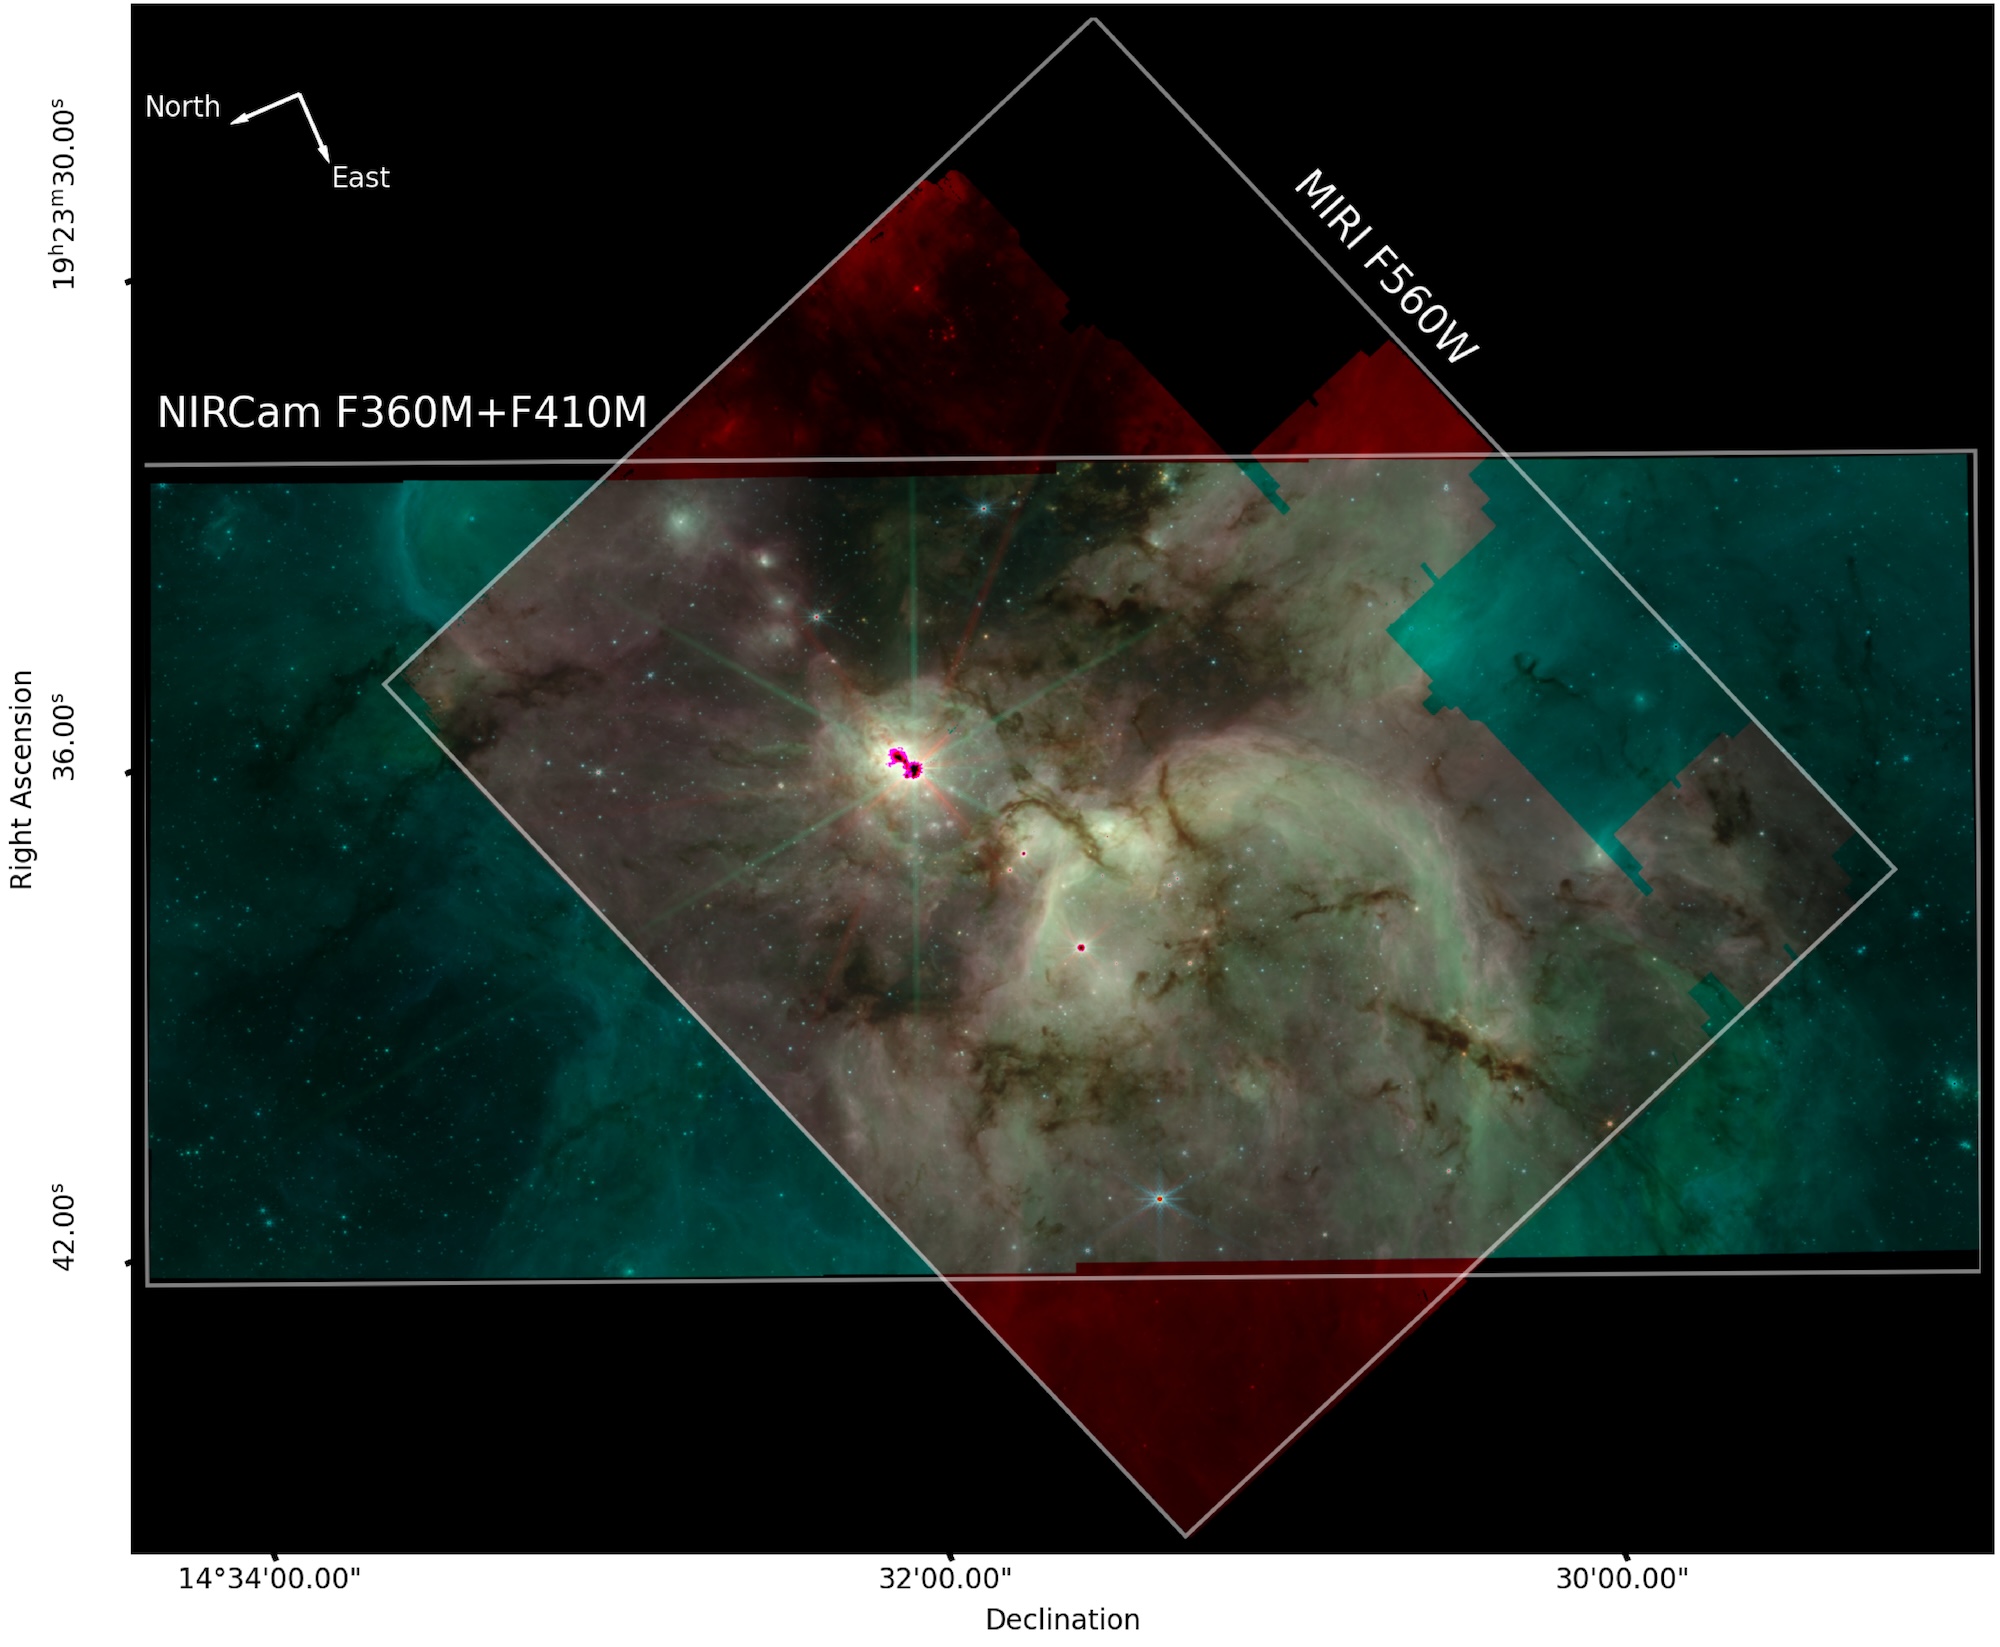
The full view of the study region, showing the NIRCam and MIRI footprints. [Yoo et al. 2026]

This image shows one W51A, of the most active star-forming regions in our galaxy. A research team led by Taehwa Yoo (University of Florida) recently observed this region with JWST, using the telescope’s Near-Infrared Camera (NIRCam) and Mid-Infrared Instrument (MIRI) to record fine structures in the swirling, dusty gas and reveal deeply embedded protostars. The JWST data enabled the team to study two protoclusters that are busily sculpting roughly 10,000 solar masses of gas — each! — into new stars. One protocluster, W51-IRS2 (containing the brightest source in the image above), has excavated a bubble around itself through intense stellar feedback, while the other, W51-E (down and to the right of W51-IRS2, where multiple dust lanes converge), is still being fed by dusty tendrils. For more details on this star-forming region, be sure to check out the full research article linked below.

Citation

“A JWST NIRCam/MIRI View of the W51A High-Mass Star-Forming Region,” Taehwa Yoo et al 2026 AJ 171 208. doi:10.3847/1538-3881/ae40b7

The post Featured Image: Massive Stars in the Making appeared first on AAS Nova.

A Mysterious Spectral Feature Could Help Crack the Case of Neutron Star Structure

1 April 2026 at 17:00

Artist's impression of a pulsar

Neutron stars are composed of some of the most extreme material in the universe, and their internal properties are challenging to determine. Recently, researchers investigated an unusual spectral feature that may help to probe the interiors of neutron stars.

Examining Extreme Matter

supernova remnant 1E 0102.2-7219

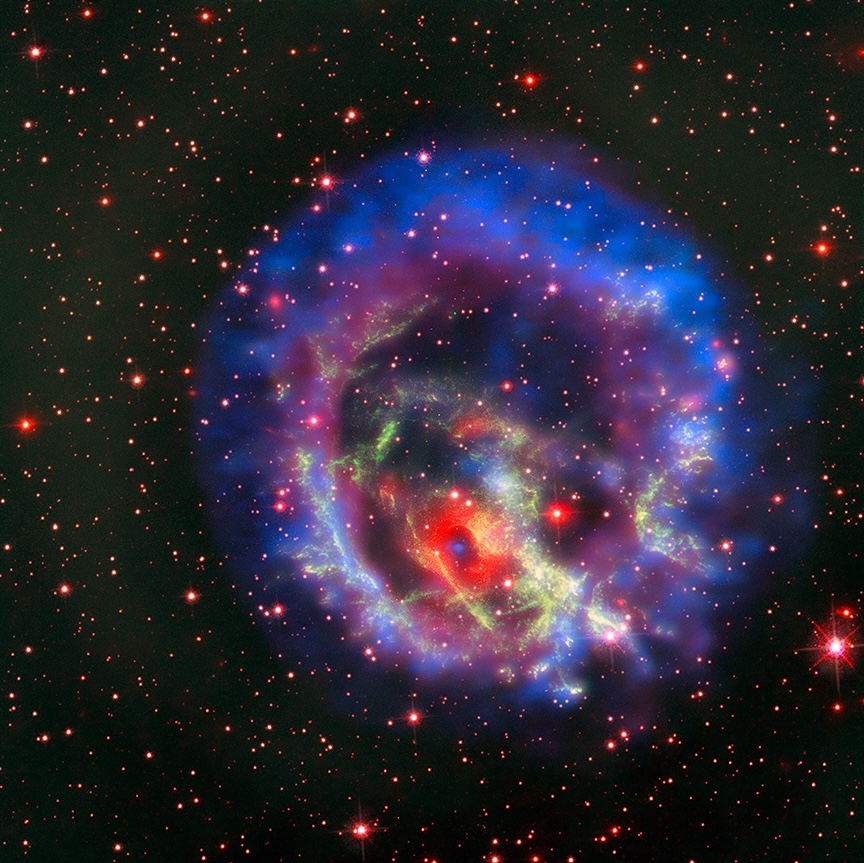
This composite X-ray and optical image shows the supernova remnant 1E 0102.2-7219. The blue source at the center of the bright red ring inside the remnant is a neutron star that was created in the supernova explosion. [X-ray (NASA/CXC/ESO/F.Vogt et al); Optical (ESO/VLT/MUSE & NASA/STScI)]

When a massive star expires in a supernova explosion, it can leave behind its condensed core in the form of a neutron star: an exceptionally dense sphere roughly as wide as Manhattan is long, composed almost entirely of neutrons. Neutron stars represent an extreme state of matter and contain some of the densest and strongest material in the universe.

By observing neutron stars, astronomers attempt to pin down their equation of state, or the relationship between their interior density and pressure. In a recent research article led by Rosario Iaria (University of Palermo) described a promising way to probe the interior of a neutron star.

This method relies on measurements of a spectral line that originates near the neutron star’s surface and is gravitationally redshifted as it escapes from the intense gravitational pull of the star. The gravitational redshift provides a direct measurement of the compactness of the neutron star, or the ratio of its radius to its mass. Despite the promise of this method, definitive identification of gravitationally redshifted absorption lines has been challenging.

Directly Measuring Compactness

Iaria’s team identified potential evidence of this phenomenon in Neutron star Interior Composition Explorer (NICER) observations of 4U 1820-30, a close binary system containing a neutron star that is accreting matter from a white dwarf companion. (4U 1820-30 is famous for having one of the most rapidly rotating neutron stars known, with a blistering rate of 716 rotations per second.)

MAXI observations of 4U 1820-30

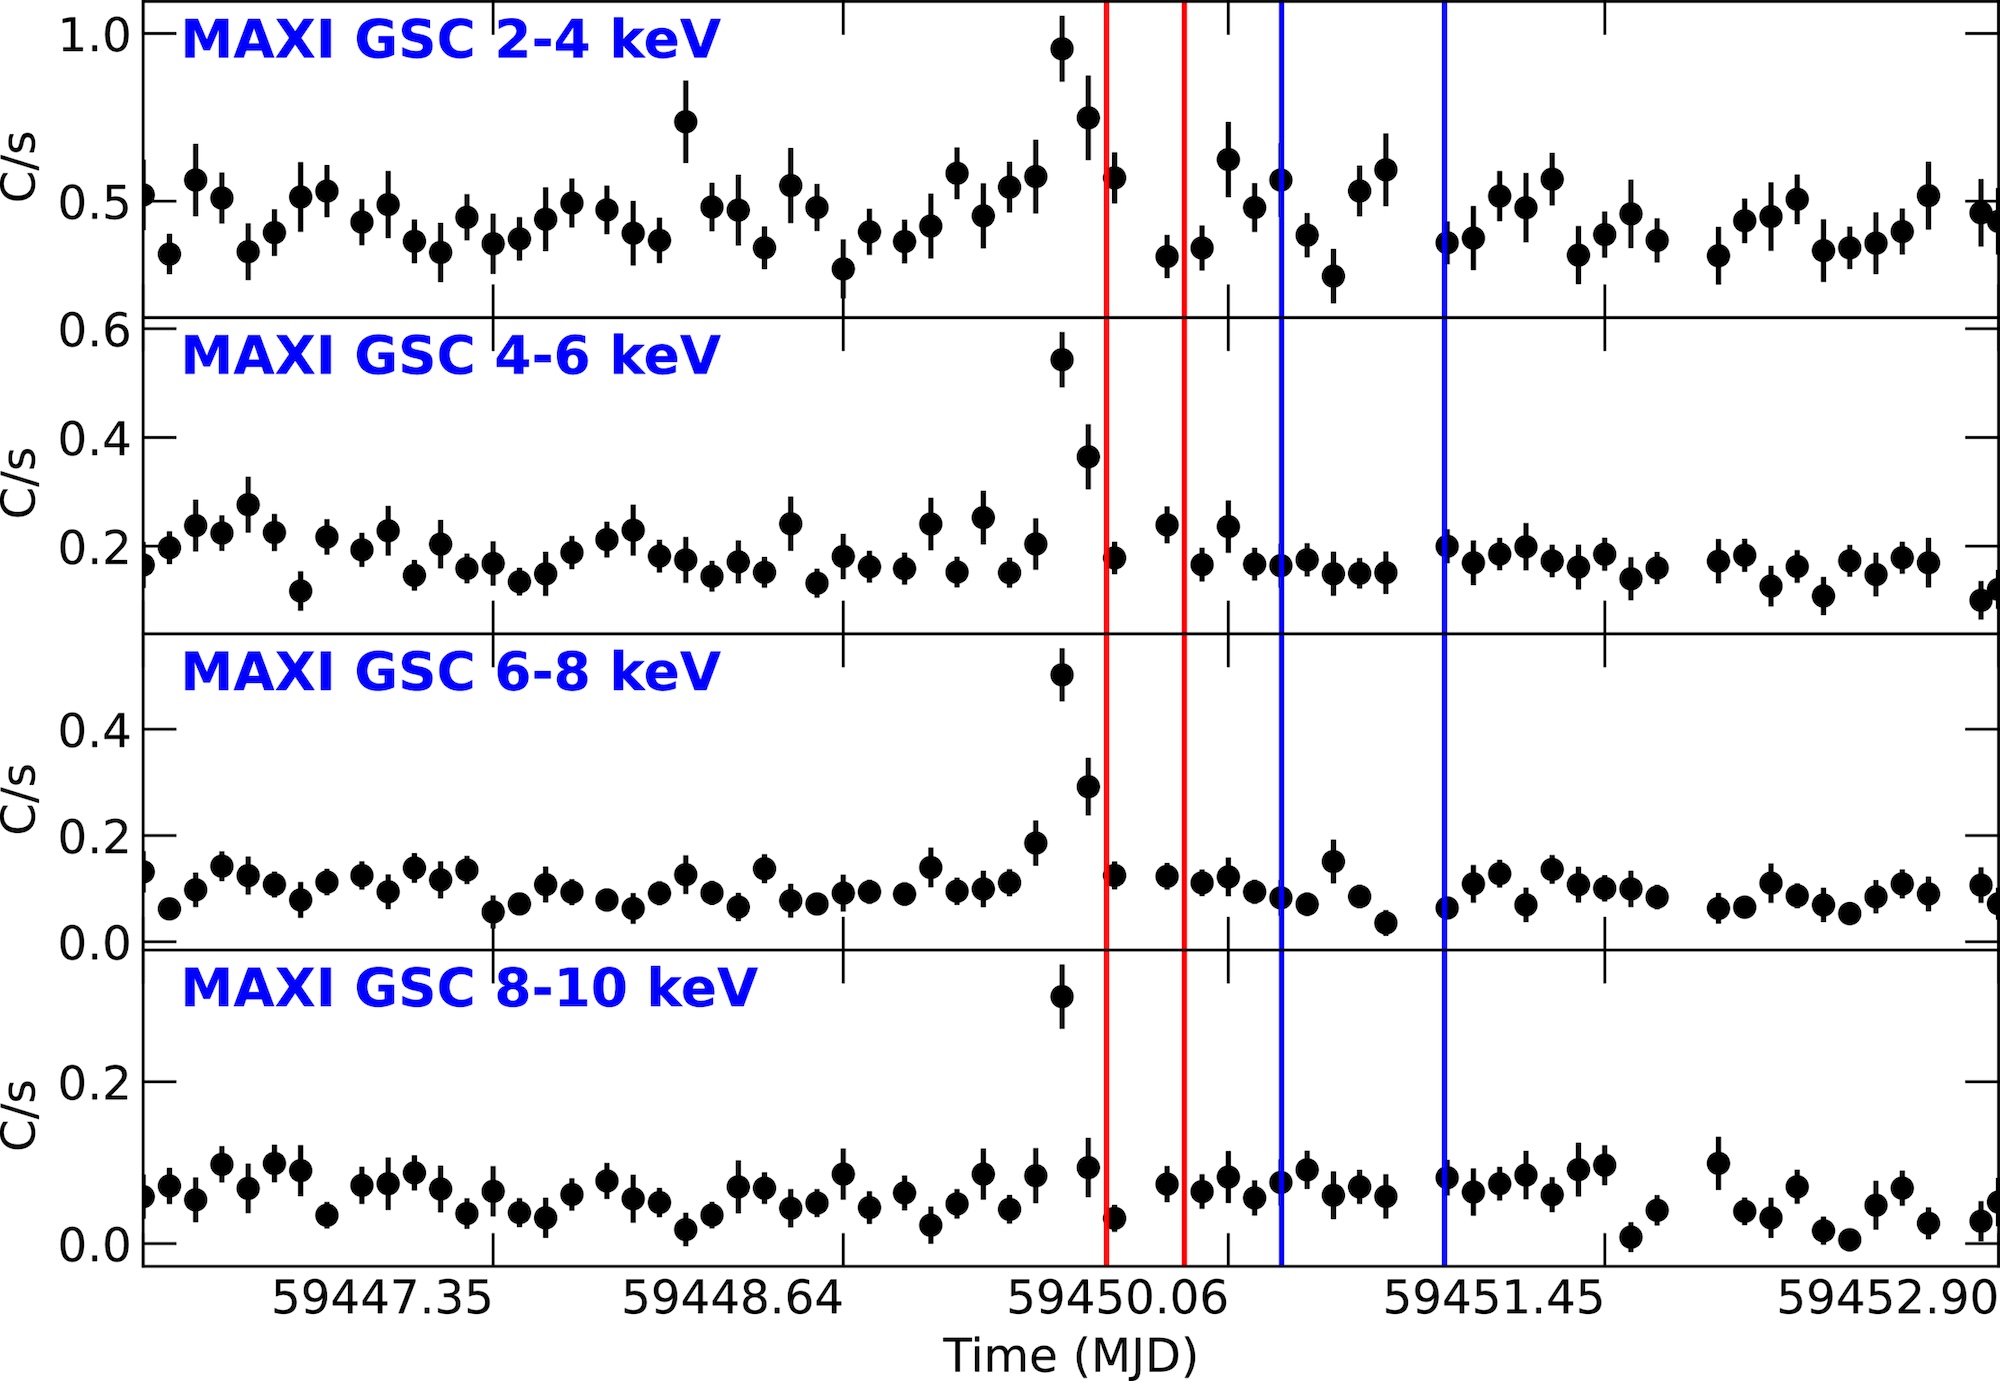
Observations of 4U 1820-30 from the Monitor of All-Sky X-ray Image (MAXI) showing the sudden increase in counts during the superburst, which was followed by two observing epochs by NICER, marked with red and blue vertical lines. Click to enlarge. [Iaria et al. 2026]

Iaria and collaborators focused on a strong iron absorption line at 3.8 keV, which arose three hours after a carbon superburst: a rare burst of high-energy radiation from thermonuclear burning of carbon deep in the neutron star’s atmosphere. The signal persisted for nearly 17 hours before subsiding.

The team proposed that the rare superburst paved the way for the gravitationally redshifted absorption line to appear. During the superburst, a powerful radiation-driven wind swept away most or all of the neutron star’s corona, a diffuse cloud of plasma floating above and below the accretion disk. After the superburst ended and the wind subsided, but before the obscuring corona reformed, the tell-tale absorption line was visible for a short time.

Cracking the Mystery of Neutron Star Structure

By interpreting the 3.8 keV absorption feature as a gravitationally redshifted spectral line arising near the neutron star’s surface, Iaria and collaborators measured a redshift of 1 + z ≅ 1.72. This corresponds to a compactness of 4.46 kilometers per solar mass, which translates to a radius of 6.4 km for a typical mass of 1.4 solar masses or a mass of 2.2 solar masses for a typical radius of 10 km.

The interpretation of the 3.8 keV absorption line as a gravitationally redshifted iron line is still tentative. Further measurements with NICER, or with future facilities like the Advanced Telescope for High-ENergy Astrophysics (Athena) X-ray observatory (planned launch in 2037) or the enhanced X-ray Timing and Polarimetry (eXTP) mission (planned launch in 2030), may help to advance the study of neutron star interiors using this technique.

Citation

“A Mysterious Feature in the NICER Spectrum of 4U 1820-30: A Gravitationally Redshifted Absorption Line?” R. Iaria et al 2026 ApJ 998 58. doi:10.3847/1538-4357/ae2758

The post A Mysterious Spectral Feature Could Help Crack the Case of Neutron Star Structure appeared first on AAS Nova.

Detecting New Icy Molecules Around a Newly Forming Star with JWST

31 March 2026 at 17:00

Large Magellanic Cloud

Editor’s Note: Astrobites is a graduate-student-run organization that digests astrophysical literature for undergraduate students. As part of the partnership between the AAS and astrobites, we occasionally repost astrobites content here at AAS Nova. We hope you enjoy this post from astrobites; the original can be viewed at astrobites.org.

Title: Protostars at Subsolar Metallicity: First Detection of Large Solid-State Complex Organic Molecules in the Large Magellanic Cloud
Authors: Marta Sewiło et al.
First Author’s Institution: NASA Goddard Space Flight Center
Status: Published in ApJL

Stars and planets form when clouds of molecules collapse in on themselves due to the overwhelming force of gravity (which, relatable). This process is quite mysterious, as these clouds will only live for a couple million years before collapsing, and the newly forming protostars only live for about half a million years before becoming main-sequence stars.

But we are able to find some protostars in the Milky Way and in the Small and Large Magellanic Clouds near us, and observing the molecules around these protostars can help us understand how protostars form.

To look for molecules around protostars, astronomers take spectra of the protostars in the infrared, which is a wavelength region where molecules emit a lot of light. As better instruments are being built, astronomers are more often able to look for what are called complex organic molecules, which are carbon-bearing molecules with at least six atoms.

These complex organic molecules can be detected in different states: most detections have been of gaseous molecules in and around protostars or planet-forming disks, but they can also be found in a solid state on the surfaces of dust grains in the interstellar medium in a galaxy. In this state, they are called complex organic molecule “ices.” These “ices” were rarely found pre-JWST, but since its launch, detections have been more numerous, mainly in the Milky Way. Observing these complex molecules on the surfaces of dust grains tells us more about protostellar dust chemistry, which is an important but still mysterious aspect of star formation.

In this study, researchers look outside of our own galaxy to explore the complex organic molecules in the Large Magellanic Cloud (LMC). The LMC is an interesting place to look for these molecules because it has lower metal content (i.e., elements heavier than hydrogen and helium) than the Milky Way, as well as a harder radiation field. This means photons flying around in the LMC generally have higher energies than photons flying around in the Milky Way, and elements like carbon, oxygen, and nitrogen are less abundant. This is important because these conditions are more similar to what typical galaxies were like in the early universe. Thus the LMC is a better test bed to look at protostars than the Milky Way if we want to understand how stars formed in the early universe.

The authors of this study have found signatures of complex organic molecules in protostars forming in the LMC. They focus on the protostar ST6 in the LMC, shown in the right image in Figure 1. They used JWST’s Mid-Infrared Instrument to take spectra of the region around ST6.

Large Magellanic Cloud and N158

Figure 1: The LMC (left) and a zoomed-in view of region N158 (right) containing protostar ST6, the focus of this study. In the inset panel of the right picture, contours of carbon monoxide emission are shown. [Sewiło et al. 2025]

Spectroscopic Signatures of Molecules on Dust Grains

The researchers used the Python tool called dEcompositioN of Infrared Ice features using Genetic Modelling Algorithms (ENIIGMA) to fit the spectroscopy. This code compares the spectra to laboratory data of these complex organic molecules at the temperatures we see in the LMC. The authors fit for complex organic molecules they might expect to see, and they detect methanol (CH3OH), acetaldehyde (CH3CHO), ethanol (CH3CH2OH), methyl formate (HCOOCH3), and acetic acid (CH3COOH); of these, acetaldehyde, ethanol, and methyl formate have never before been detected outside of the Milky Way. Interestingly, this is the first time acetic acid has been definitively detected in any astrophysical environment. The spectral contribution from each molecule is shown in Figure 2; all the individual contributions added together make up the observed spectrum.

spectrum of the protostar ST6

Figure 2: Model fits to the spectrum of the protostar ST6 using the code ENIIGMA. Molecules and their fitted emission are given in the legend. [Sewiło et al. 2025]

These detections provide evidence that these complex organic molecules can be produced on the surfaces of dust grains. Further, their detection in the LMC provides evidence that these molecules can be produced in “harsh” environments like the LMC, with lower metal content and harder radiation fields.

When the authors compared the abundances of these ices to other protostars in the Milky Way galaxy, they found that the abundances are slightly lower around the LMC protostar. This may happen because the dust temperatures are generally higher in the LMC due to the higher-energy photons, which affect the chemistry happening on the dust. Some species they found, however, do have similar abundances to the Milky Way protostars, indicating that the harder radiation field of the LMC does not affect how these species form. Finding more complex organic molecules in the Magellanic Clouds will help us understand further how these compounds form on dust grains and how the galactic environment may affect their formation.

Original astrobite edited by Shalini Kurinchi-Vendhan.

About the author, Caroline von Raesfeld:

I’m a third-year PhD student at Northwestern University. My research explores how we can better understand high-redshift galaxy spectra using observations and modeling. In my free time, I love to read, write, and learn about history.

The post Detecting New Icy Molecules Around a Newly Forming Star with JWST appeared first on AAS Nova.

I Survived a Type Ia Supernova, and All I Got Was This Kick Velocity

17 March 2026 at 16:00

G272.2-3.2

Editor’s Note: Astrobites is a graduate-student-run organization that digests astrophysical literature for undergraduate students. As part of the partnership between the AAS and astrobites, we occasionally repost astrobites content here at AAS Nova. We hope you enjoy this post from astrobites; the original can be viewed at astrobites.org.

Title: Supernova Ia Remnants with M-Dwarf Surviving Companions
Authors: Kuo-Chuan Pan (潘國全), Pilar Ruiz-Lapuente, and Jonay I. González Hernández
First Author’s Institution: National Tsing Hua University
Status: Published in ApJ

Type Ia supernovae are important tools astronomers use to measure distances in space. Despite their important role as “standardizable candles,” their origins remain hotly debated. It’s long been theorized that a Type Ia supernova can develop from one of two pathways: the single-degenerate channel or the double-degenerate channel. In the single-degenerate channel, a white dwarf and a non-degenerate star (such as a red giant or main-sequence star like our Sun) orbit each other in a close binary system. The white dwarf accretes material from the outer surface of the non-degenerate star until it reaches a critical mass and explodes. The double-degenerate channel begins instead with two white dwarfs orbiting each other. Most explosion mechanisms from this channel result in the complete obliteration of the secondary, less-massive white dwarf. However, one theoretical explosion mechanism, called the dynamically driven double-degenerate double-detonation (D6) channel, might allow the secondary companion star to survive an explosion from a double-degenerate Type Ia supernova.

Generally, due to the immense energy from a supernova explosion, we expect these surviving companion stars to be “kicked” away from the blasts at high velocities. Fortunately, astronomers have found evidence of these surviving companion stars. As covered in a previous Astrobite, three hypervelocity white dwarfs have been found in Gaia data and traced back to the locations of double-degenerate Type Ia supernovae. Given the prevalence of Type Ia supernovae, however, astronomers are led to question why we haven’t seen many more of these candidates. It’s additionally important to wonder what similar “runaway” companions might look like for the single-degenerate channel.

Recent observations by the Gaia spacecraft near the supernova remnant G272.2-3.2 show an M-dwarf star, MV-G272, with an unusually high velocity around 240 km/s and a trajectory tracing back to the center of the supernova remnant. Is it possible for this M dwarf to be the runaway companion to the remnant’s original supernova? The authors of today’s article look at simulations of potential companion stars from single-degenerate Type Ia supernovae and compare their results to this observed potential companion candidate.

Because this work focuses on the potential for M-dwarf companions, the authors explored a range of simulated companion-star masses and radii characteristic of M dwarfs: 0.5, 0.6, and 0.7 solar mass and 0.396, 0.454, and 0.483 solar radius, respectively. To make these models, they used the stellar evolution code Modules for Experiments in Stellar Astrophysics (MESA) to construct and evolve a number of simulated stars with these specifications.

After setting up the models in MESA, they used the magnetohydrodynamics code FLASH to perform 2D and 3D simulations of the supernova explosion and the subsequent impact of the exploding star’s ejecta (or hot material) on its M-dwarf companion. After the explosion and impact were modeled, the companion star’s evolution was further followed in MESA.

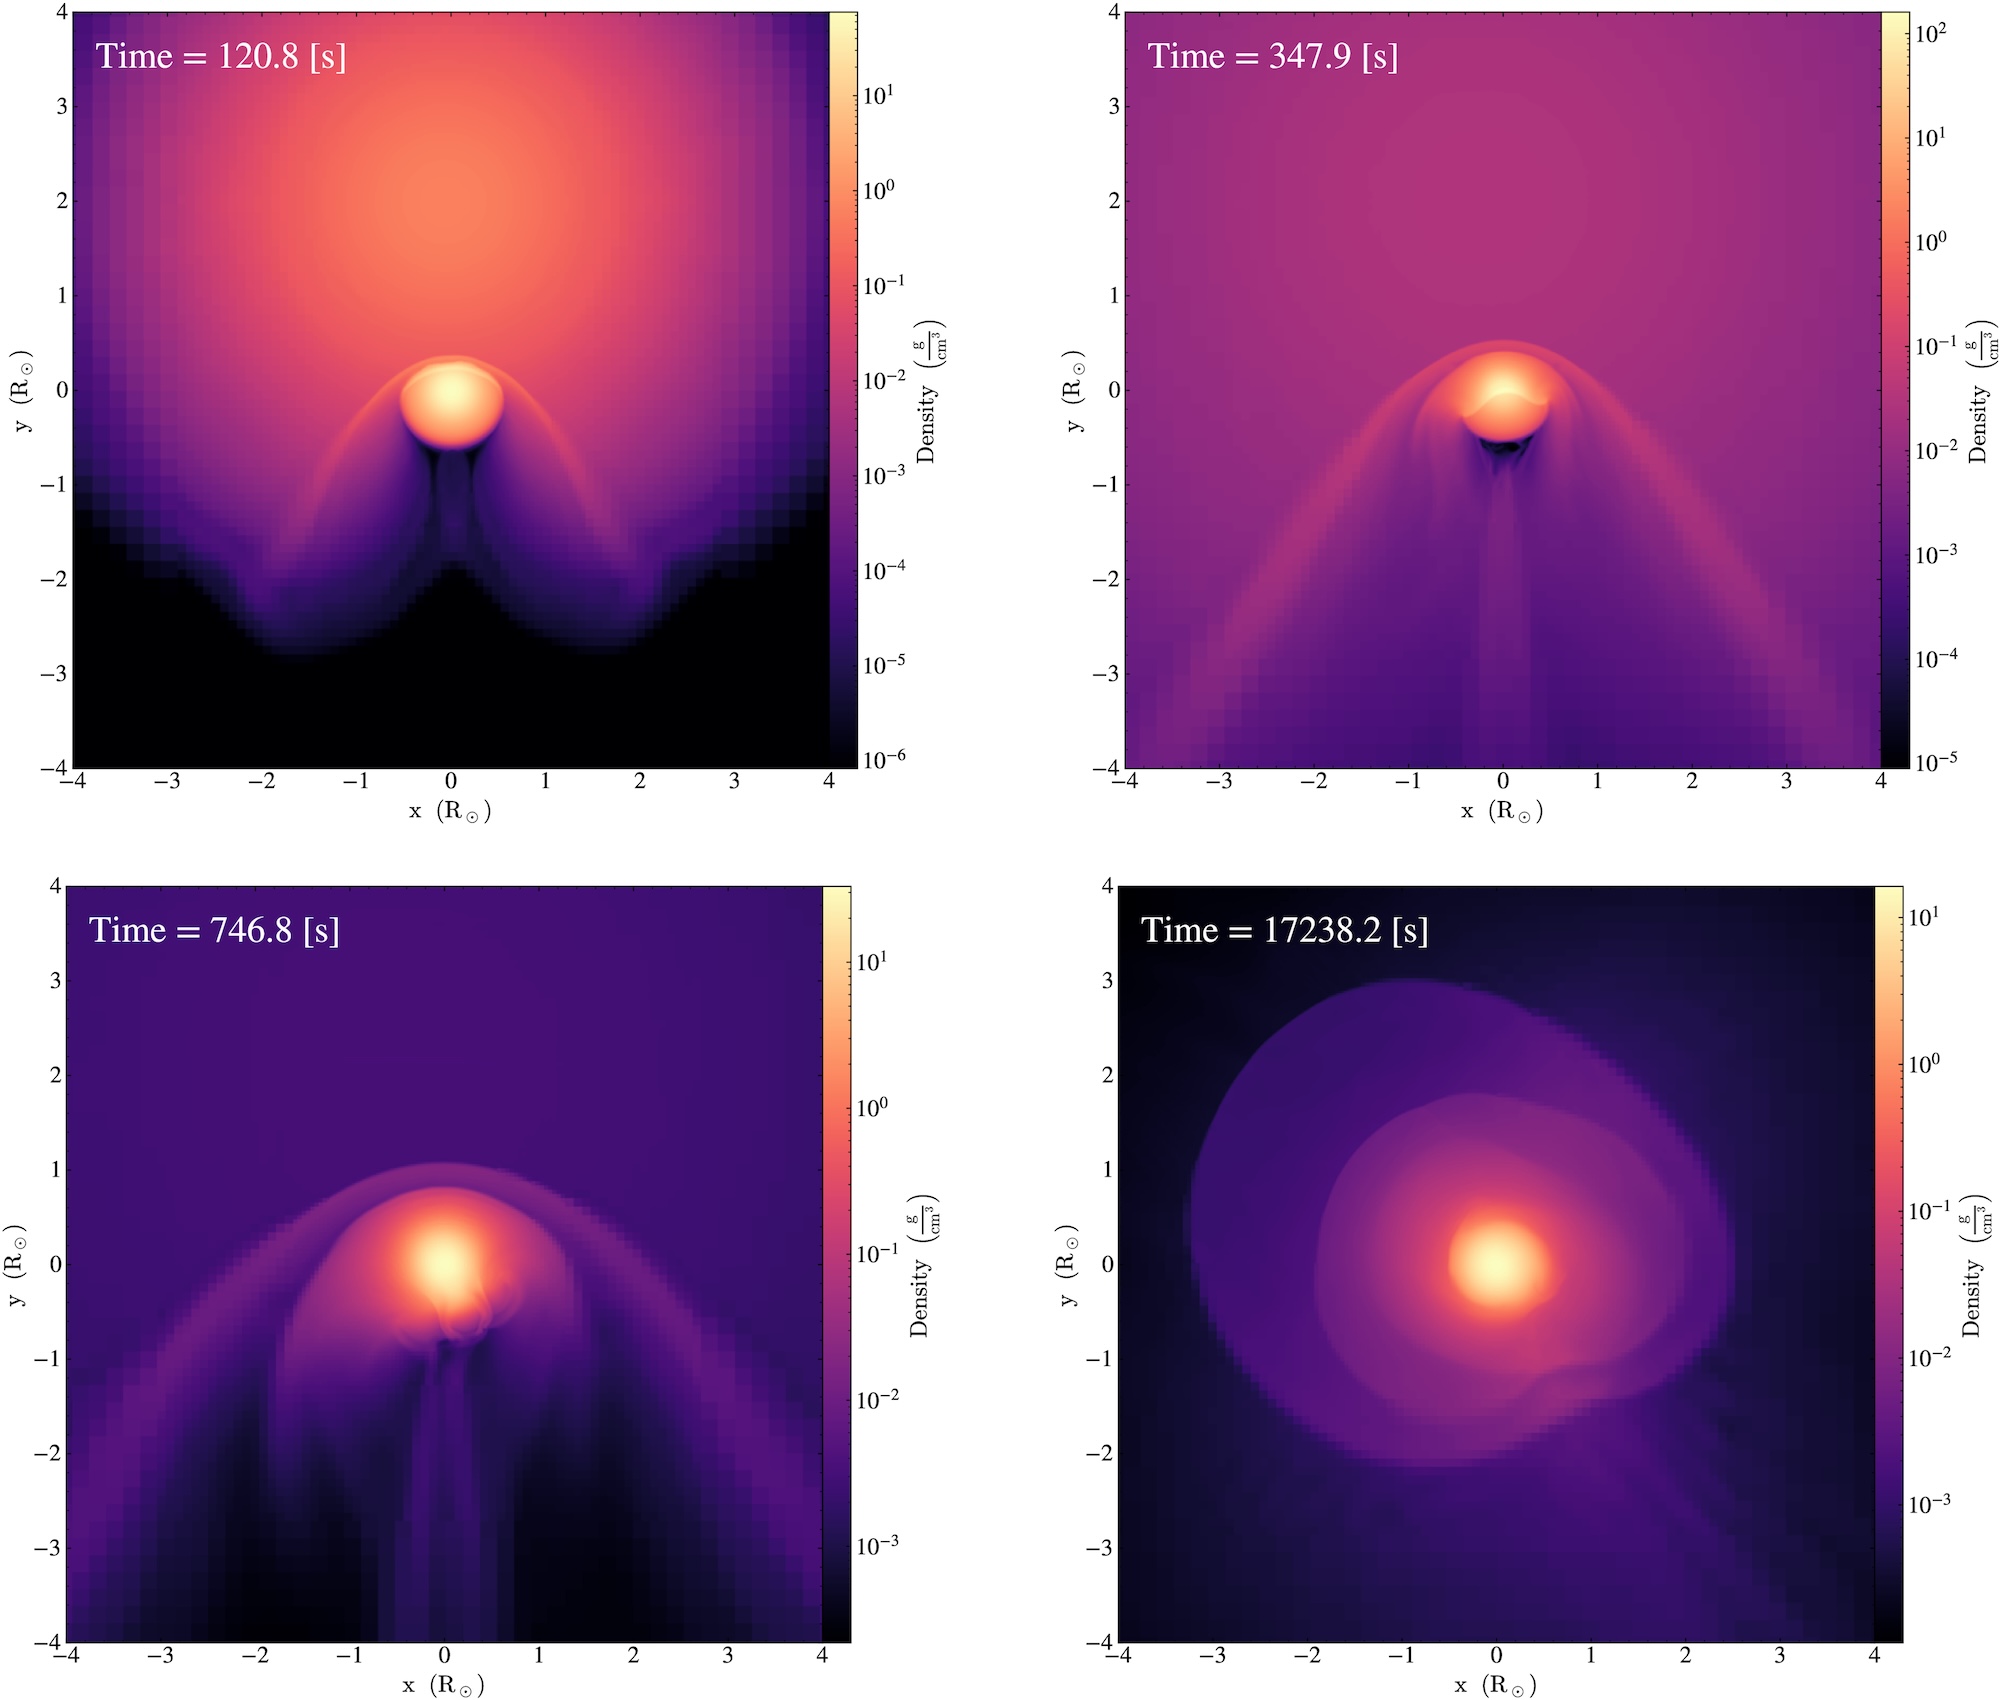
Figure 1 shows the density of the supernova’s ejecta, or exploding material, as it impacts the companion star. (You can think of this figure as if you were looking at the companion star out in space.) After roughly 100 seconds, you can see a bow shock develop around the top of the companion (or the “front” of the star) as it wraps around the companion. This impact causes significant compression of the companion star and rips away upwards of 50% the companion’s mass. The impact of this shock is what gives the companion star its “kick,” sending it hurtling through space.

simulations of supernova ejecta colliding with a star

Figure 1: Visual of the density of the companion star (center of each plot) and the supernova ejecta over time. In the top row of plots and the bottom-left plot, you can see the higher-density bow shock bent around the top (or front) of the companion star. In the bottom-right plot, you can see some of the supernova ejecta and unbound mass from the companion star settling around the companion star. [Pan et al. 2025]

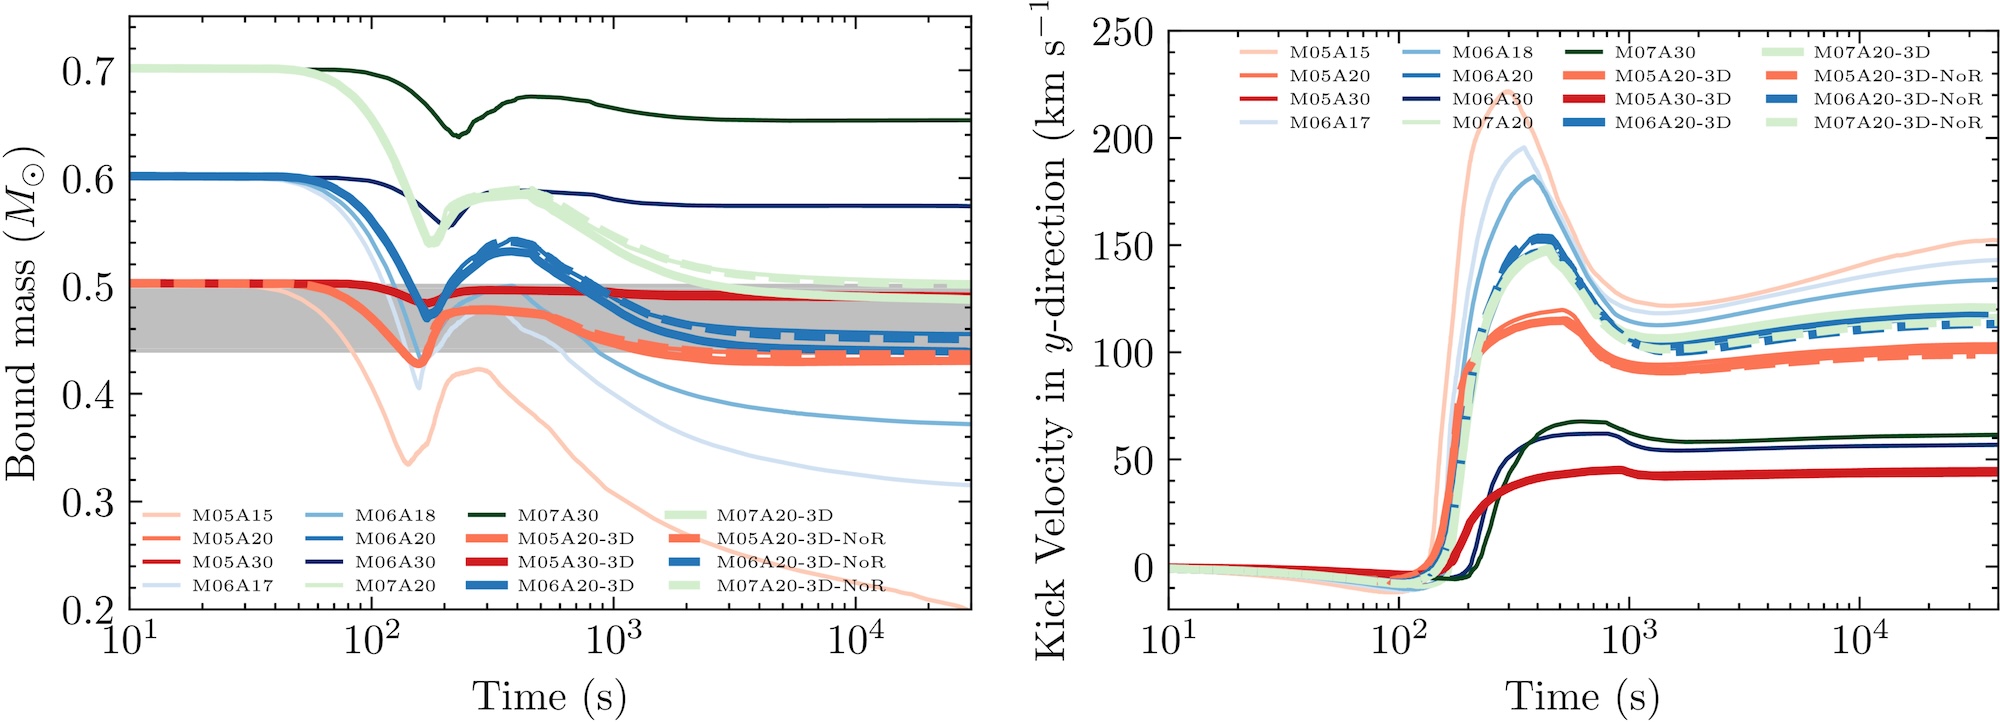
Because the authors explored a range of initial companion masses and distances between the primary and companion star, their results show some range. Figure 2 shows two important results: the evolution of the companion’s mass before and after the explosion (left plot), and the evolution of the companion’s kick velocity (right plot). The dip in mass around 100 seconds (102 s) indicates the impact of the bow shock. Even though the simulations model companions with a relatively narrow mass range (0.3–0.7 solar mass), there is considerable variation in the final masses after explosion. For example, the initial 0.5-solar-mass model ends up with anywhere between 0.07 solar mass (just 14% of its initial mass) and almost its full initial mass of 0.5 solar mass, depending on the distance between the companion and its exploding star.
plots of bound mass and kick velocity as a function of time

Figure 2: The different models shown in both plots indicate different initial masses and separation distances between the companion and the exploding star. Left: how the companion’s gravitationally bound mass evolves over time. The plot can be read left to right. The dip around 102 seconds indicates the impact of the supernova shock, which unbinds layers of the companion’s mass. Some of that mass becomes bound again to the companion after the shock passes. Right: how the companion star’s kick velocity changes based on initial mass and separation distance between companion and exploding star. The peak in values between 102 and 103 seconds indicates the impact, or “kick,” from the supernova. [Pan et al. 2025]

The results from this work generally show, predictably, that a companion closer to its primary star gets a bigger kick in velocity. These “kicks” range from about 50 km/s to 150 km/s. When added to the system’s initial velocity in space, it brings the total velocity of these companions into the 150–200 km/s range. This result is generally well aligned with the observed velocity of MV-G272, which was roughly 240 km/s.

Notably, runaway companion stars of these Type Ia supernovae seem to retain information from the initial explosion. Given the final velocities of these companions, astronomers might be able to figure out the companion’s initial mass and trace back its trajectory to the system it originated from. Overall, the fact that MV-G272 has a trajectory that tracks back to the center of a supernova remnant makes it a good companion candidate. These results support the feasibility of M-dwarf runaway companions from single-degenerate Type Ia supernova systems. Now that we know what these companions might look like — and how fast they can be going — astronomers can hopefully better search for these high-velocity stars in the future.

Original astrobite edited by Catherine Slaughter.

About the author, Mckenzie Ferrari:

I’m currently a PhD student in the geophysical sciences program at the University of Chicago. While I now study the atmosphere and oceans of Earth, most of my previous research focused on simulations of Type Ia supernovae and galaxy formation and evolution. In my free time, I foster cats for a local organization, enjoy cooking, and can often be found running along Lake Michigan.

The post I Survived a Type Ia Supernova, and All I Got Was This Kick Velocity appeared first on AAS Nova.

Black Hole Baby Photos: JWST and Chandra Observe M31-2014-DS1

4 March 2026 at 17:00

illustration of M31-2014-DS1

One of the most luminous supergiant stars in the Andromeda Galaxy, M31-2014-DS1, has disappeared, potentially leaving behind a black hole shrouded in dusty gas. What do new infrared and X-ray observations tell us about this event?

Failure to Explode?

SN 2023ixf in Messier 101

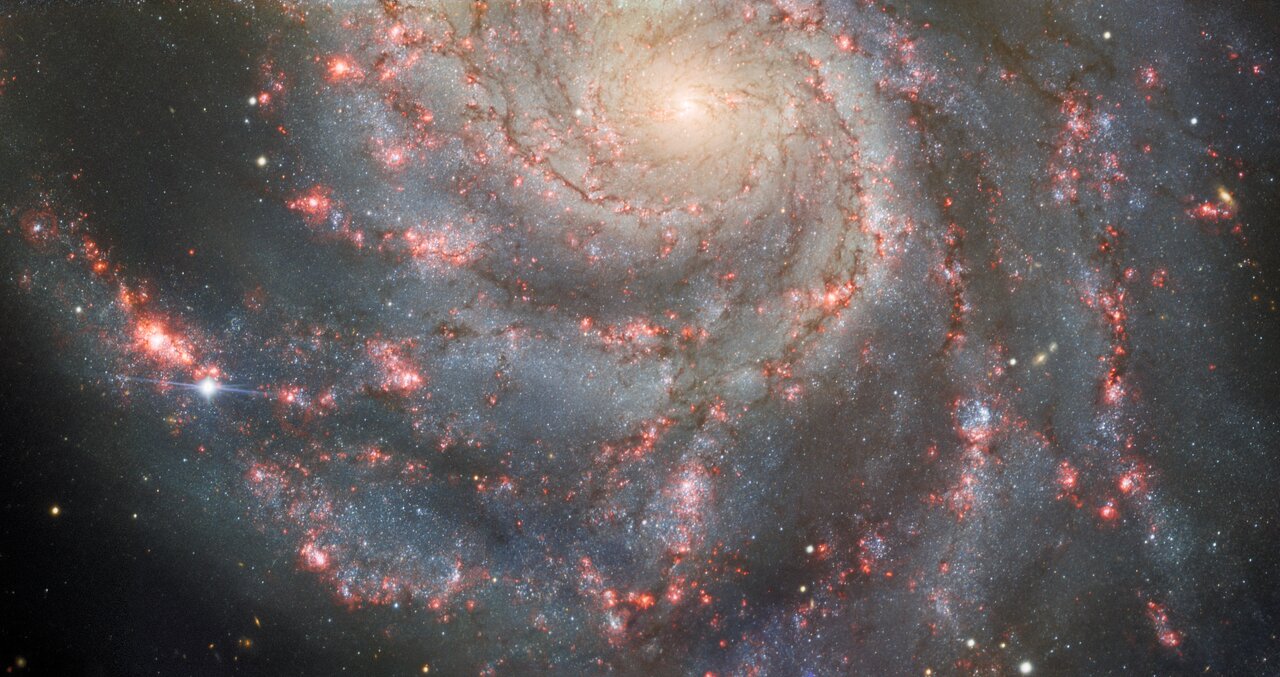
This image from Gemini North shows the supernova SN 2023ixf along one of the spiral arms of Messier 101. Though less showy than core-collapse supernovae, “failed” supernovae may be another way to form stellar-mass black holes. [International Gemini Observatory/NOIRLab/NSF/AURA; CC BY 4.0]

Massive stars are famous for going out with a bang. After swelling into supergiants, these stars bring their brief lives to a close in a cosmic fireworks show: a supernova explosion that creates a neutron star or a black hole.

But a splashy supernova explosion may not be the only way for a massive star to go out. As observations have begun to suggest, some massive stars may — for reasons not yet fully understood — quietly collapse in upon themselves, going out with a whimper rather than a bang. Though less spectacular and far harder to spot, these “failed” supernovae highlight a possible pathway for the formation of stellar-mass black holes.

A Newborn Black Hole in a Dense, Dusty Blanket

Just last month, researchers reported their discovery of a potential failed supernova. The supergiant M31-2014-DS1 suddenly brightened in 2014 before fading to obscurity, leading researchers to suspect that the star had experienced a failed supernova and created a black hole. The event shared similarities with another failed supernova candidate, NGC6946-BH1.

JWST data of M31-2014-DS 1

Left: A JWST image of M31-2014-DS 1. Right: Spectral energy distributions of the progenitor star/the remnant using data from 2005 to 2012 (empty circles), 2022 to 2023 (filled circles), and 2024 (colored lines). Click to enlarge. [De et al. 2026]

In a new article published in the Astrophysical Journal Letters, Kishalay De (Columbia University; Flatiron Institute) and coauthors have used JWST and the Chandra X-ray Observatory to learn more about what remained after M31-2014-DS1 disappeared. The JWST observations show an extremely red object that has faded considerably in just a few years, with a deep absorption feature from silicate dust and numerous narrow molecular absorption lines. Chandra did not detect any X-rays.

Together, these observations support a model in which the collapsing star ejected its outer layers in a relatively low-energy event (somewhere in the broad ballpark of one hundred-millionth to one ten-thousandth the energy of a typical core-collapse supernova) and formed a black hole. Some of the ejected material fell backward and fed the newborn black hole, while the remainder created a dense blanket that blocked the light from the accreting black hole from view.

Continued Evolution

schematic of the gas surrounding a newborn black hole

Cartoon showing the authors’ model and the model parameters inferred from the observations. Click to enlarge. [De et al. 2026]

In observations from 2024, the source had faded to just 7% of the progenitor star’s luminosity, supporting the conclusion that the star has disappeared and what lies beneath the dusty ejecta is a black hole. De’s team expects that as time goes on, the gas that obscures the accretion-powered luminosity of the newborn black hole will expand and become less dense along our line of sight. At some point — estimated to be no sooner than about 27 years from now — the X-ray emission from the accreting black hole should pierce the dusty shroud and become visible to sensitive X-ray observatories. In the infrared, JWST will be able to track the source’s evolution caused by continued dust creation in the expanding shell.

Thanks to its location in a neighboring galaxy, M31-2014-DS1 has granted astronomers a front-row seat to a poorly understood pathway for black hole formation. Going forward, we can expect further insights into M31-2014-DS1 and, hopefully, the discovery of many more sources like it.

Citation

“Fading into Darkness: A Weak Mass Ejection and Low-Efficiency Fallback Accompanying Black Hole Formation in M31-2014-DS1,” Kishalay De et al 2026 ApJL 999 L25. doi:10.3847/2041-8213/ae468d

The post Black Hole Baby Photos: JWST and Chandra Observe M31-2014-DS1 appeared first on AAS Nova.

JWST Spies a Potential Microlensed Massive Binary Star System

11 February 2026 at 17:00

galaxy cluster MACS J0416.1-2403

JWST images of galaxy clusters are rich with gravitationally lensed galaxies. Recent work examines a source in a lensed galaxy that may offer a glimpse into the lives of massive stars billions of years ago.

Cosmic Gems arc

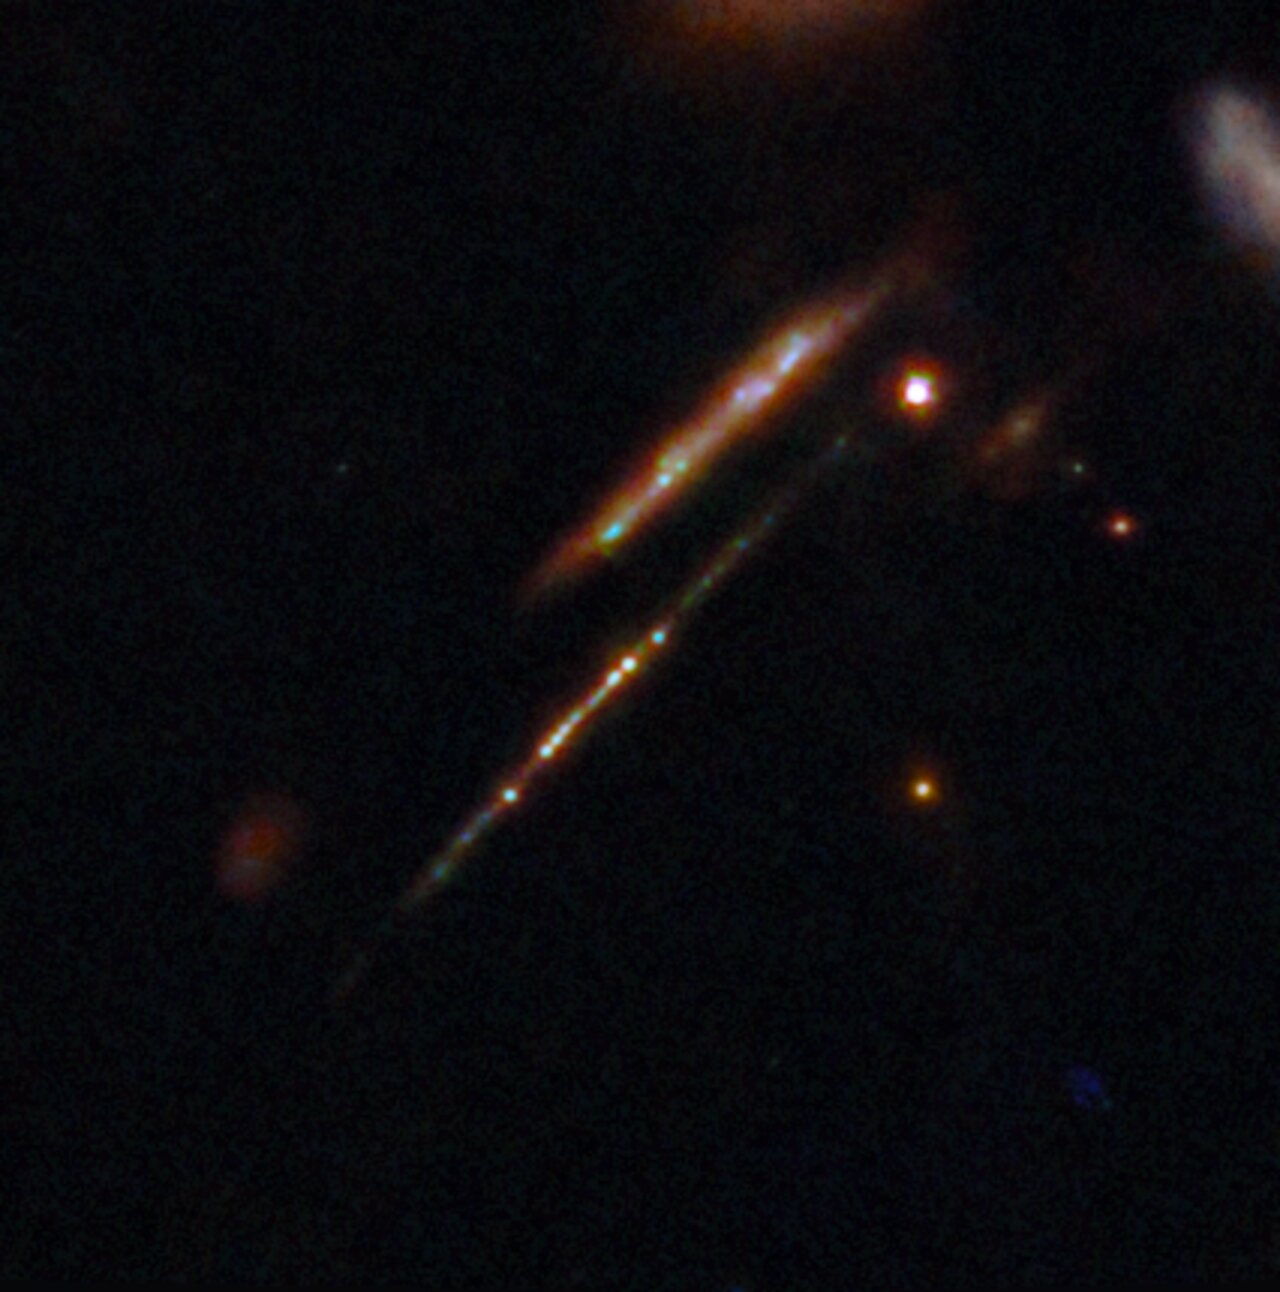
JWST image of the gravitationally lensed Cosmic Gems arc, in which multiple individual star clusters are visible. [ESA/Webb, NASA & CSA, L. Bradley (STScI), A. Adamo (Stockholm University) and the Cosmic Spring collaboration; CC BY 4.0]

Glimpses of Single Stars

Galaxy clusters, the largest gravitationally bound structures in the universe, create the conditions necessary for astronomers to perform an extraordinary feat: examine individual massive stars and star clusters at far greater distances than our telescopes can typically achieve. This is possible thanks to gravitational lensing, the bending of spacetime by an immense mass, which warps and magnifies the light from more distant objects.

These glimpses of single stars and star clusters offer a rare chance to study massive stars in our universe’s distant past directly. In particular, these observations allow us to probe whether factors like the multiplicity fraction — how many massive stars are in binary or multiple systems — have changed over cosmic time.

Peering Through a Gravitational Lens

In a recent research article, a team led by Hayley Williams (University of Minnesota) reported on their examination of an intriguing source in a gravitationally lensed galaxy called the “Warhol arc.” This galaxy, located at a redshift of z = 0.94 (when the universe was roughly 6 billion years old), is gravitationally lensed by the massive galaxy cluster MACS J0416.1−2403. The cluster is located at a redshift of z = 0.396, corresponding to when the universe was about 9.4 billion years old.

Using data from the JWST Prime Extragalactic Areas for Reionization and Lensing Science (PEARLS) program and the Canadian NIRISS Unbiased Cluster Survey (CANUCS), Williams’s team analyzed a source in the Warhol arc called W2, which previous work suggests is either a binary star system or a small star cluster.

Multiplicity and Microlensing

Warhol arc

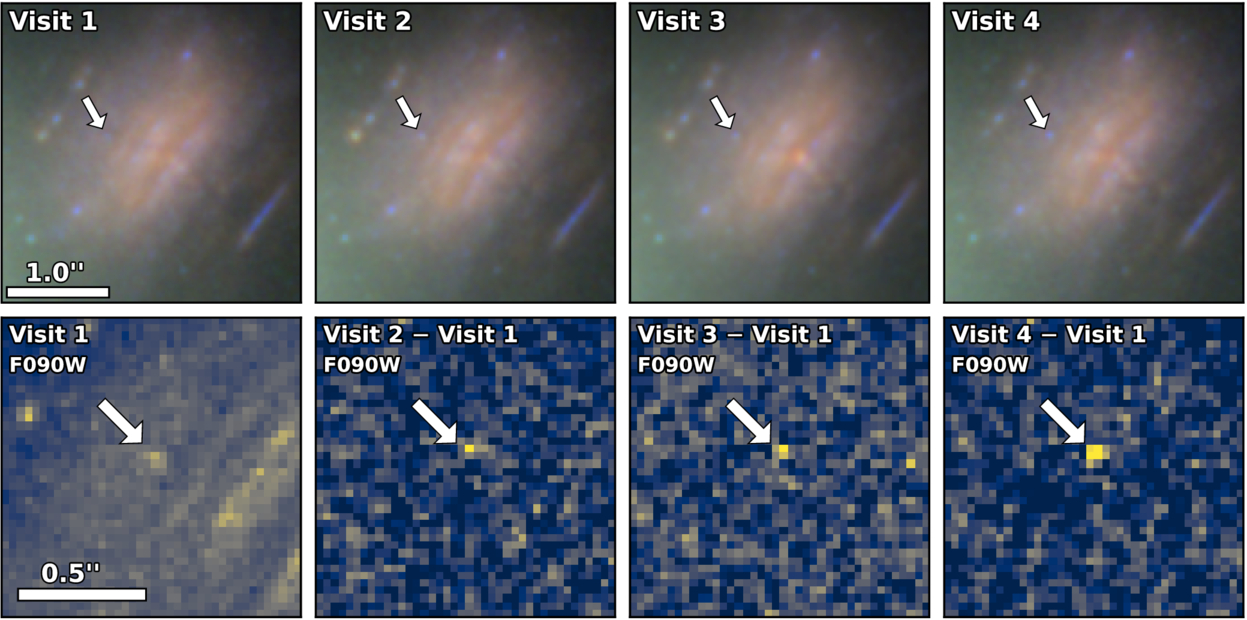
Top row: The Warhol arc during four epochs of JWST observations. Bottom row: On the left, a magnified image of W2 during the first epoch. The remaining images show the difference in brightness between subsequent epochs and the first epoch. Click to enlarge. [Williams et al. 2026]

Across four epochs spanning 126 days, the JWST observations show the source W2 within the Warhol arc. Williams and collaborators performed spectral fitting of the JWST light curves to investigate the multiplicity of the source. They found that the data are best matched by a binary system containing stars with temperatures of 3500K and 12600K.

W2 varies between observations in both brightness and color, a fact that the authors suggested is due to microlensing by a star within the lensing galaxy cluster, rather than variability within the binary system itself. Under this hypothesis, the orbital motions of the binary bring the stars across the microlensing caustic — a region in which the magnification is exceptionally high — and the brightness and color of W2 vary as the components of the binary approach and recede from the caustic.

Williams and collaborators also performed stellar population modeling to explore the binary configurations that could match the observations. They found that the stars likely have masses of 21–24 solar masses, with one being a cool red supergiant and the other a hot, main-sequence companion. Depending on the precise evolutionary stage of the binary, it’s possible that one of the stars is nearing a supernova explosion. Lending more support to the binary system hypothesis, the microlensing measurements constrain W2 to be no larger than 90 au — too small for even a compact star cluster.

The team closed by proposing further observations of W2’s position to rule out the possibility that the microlensing rate there is unusually high, an outcome that may suggest that microlensing of two unrelated stars, rather than a binary system, is responsible for these observations.

Citation

“JWST’s PEARLS: A Candidate Massive Binary Star System in a Lensed Galaxy at Redshift 0.94,” Hayley Williams et al 2026 ApJ 997 292. doi:10.3847/1538-4357/ae2003

The post JWST Spies a Potential Microlensed Massive Binary Star System appeared first on AAS Nova.

Supernovae, Shocks, and Spindown: A Possible Origin Story for Ultra-Long-Period Pulsars

16 January 2026 at 17:00

Researchers have recently discovered a number of ultra-long-period pulsars that are difficult to explain with typical pulsar models. A new article explains how these pulsars might arise from massive stars in close binary systems.

Strangely Slow Sources

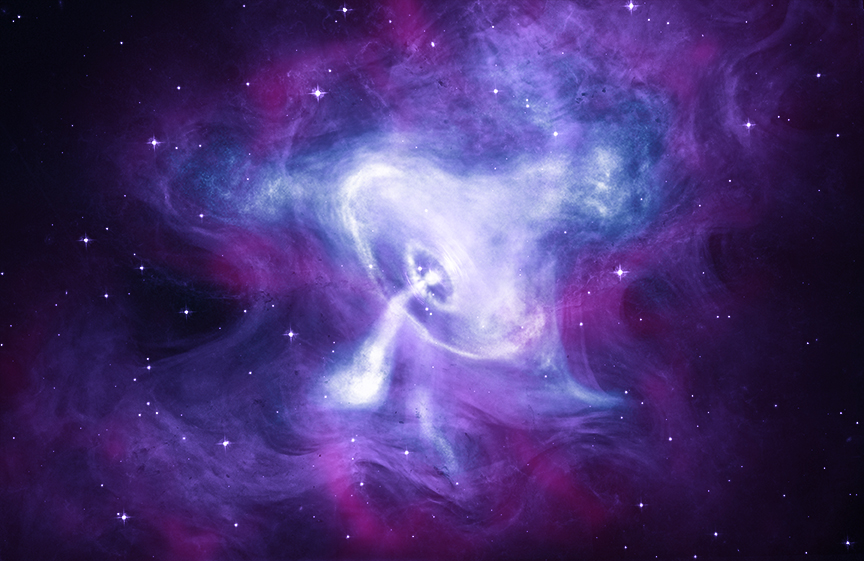
Crab Nebula

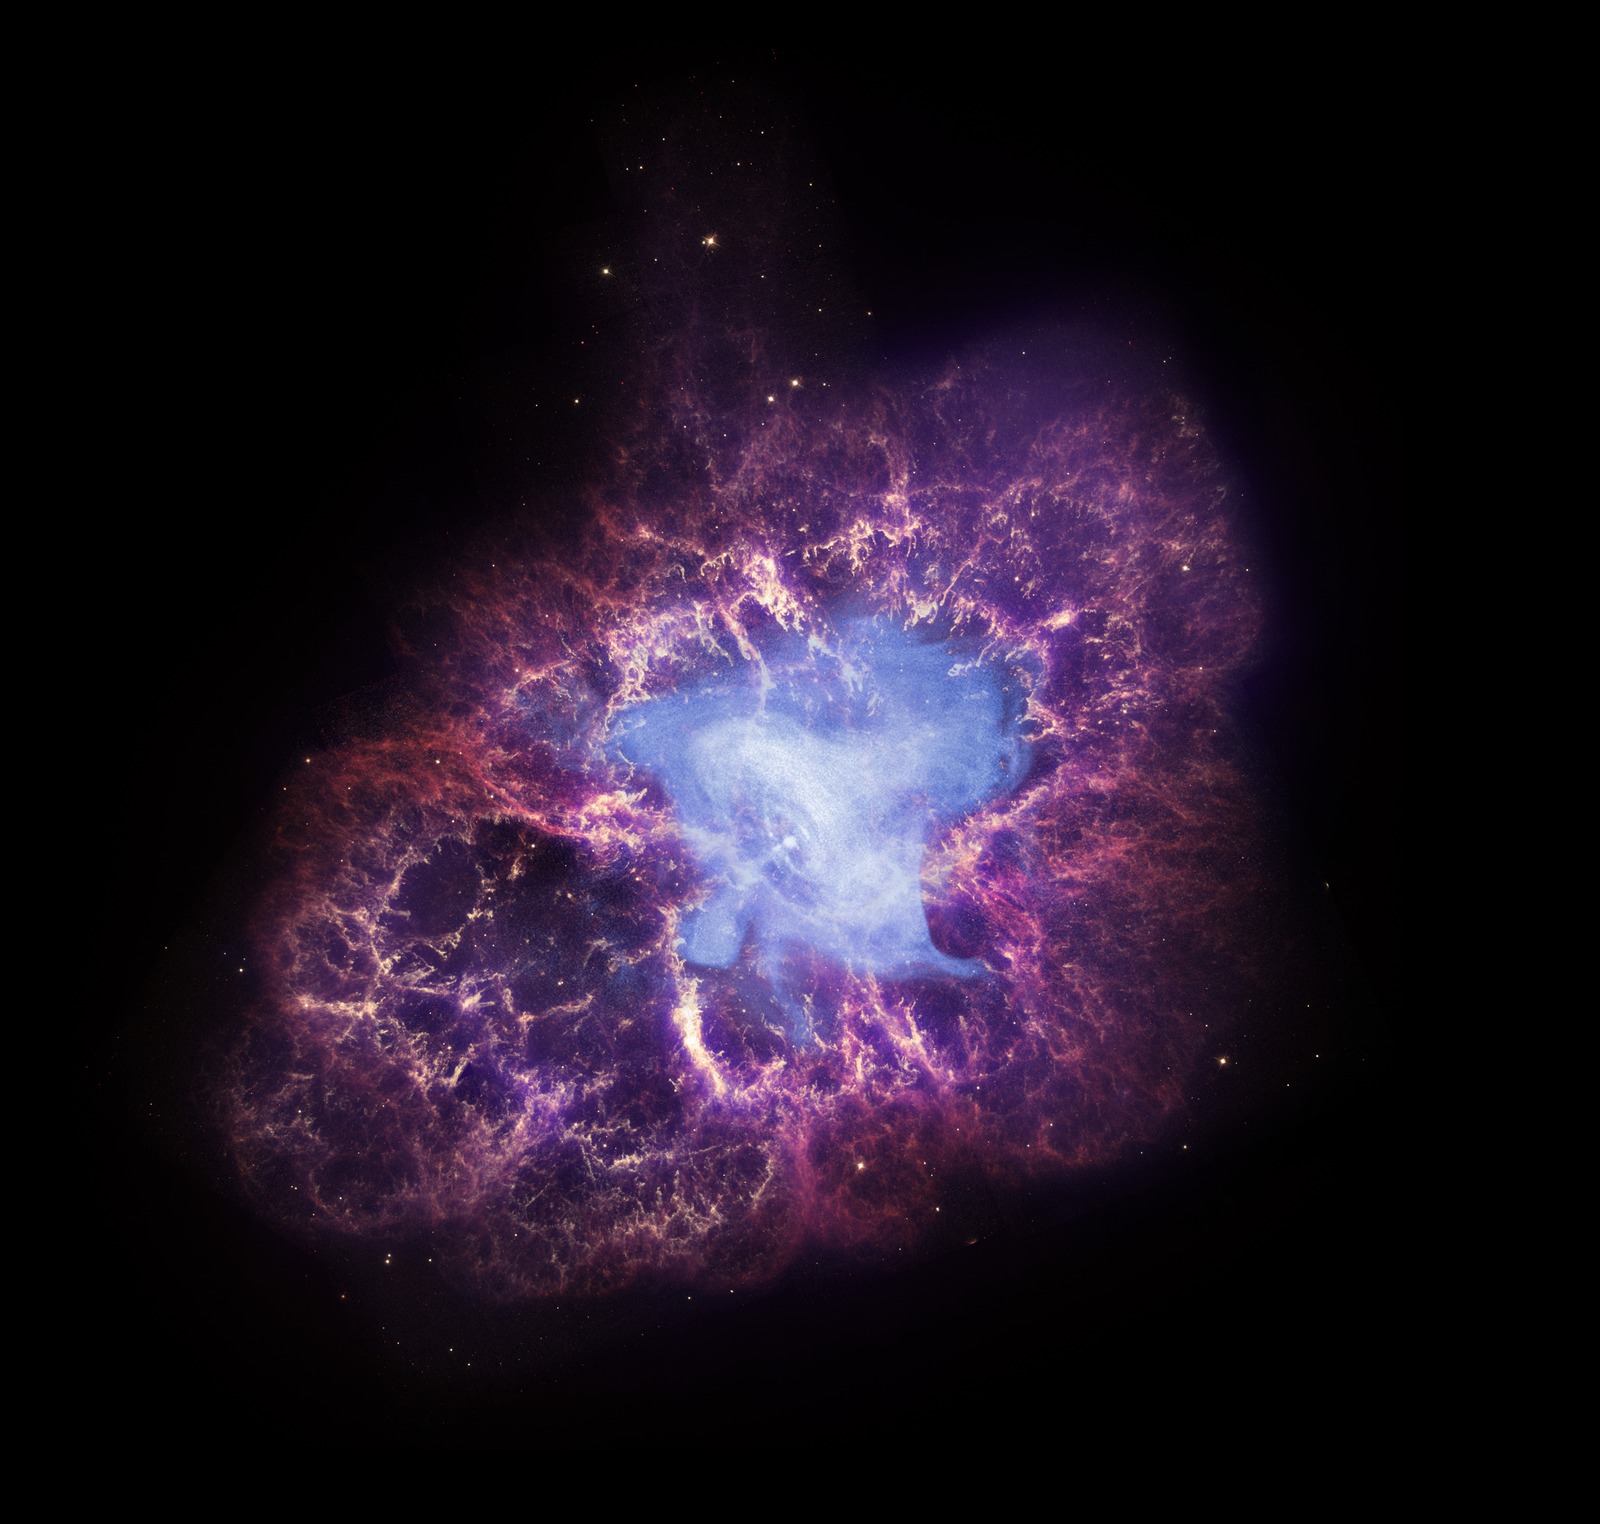
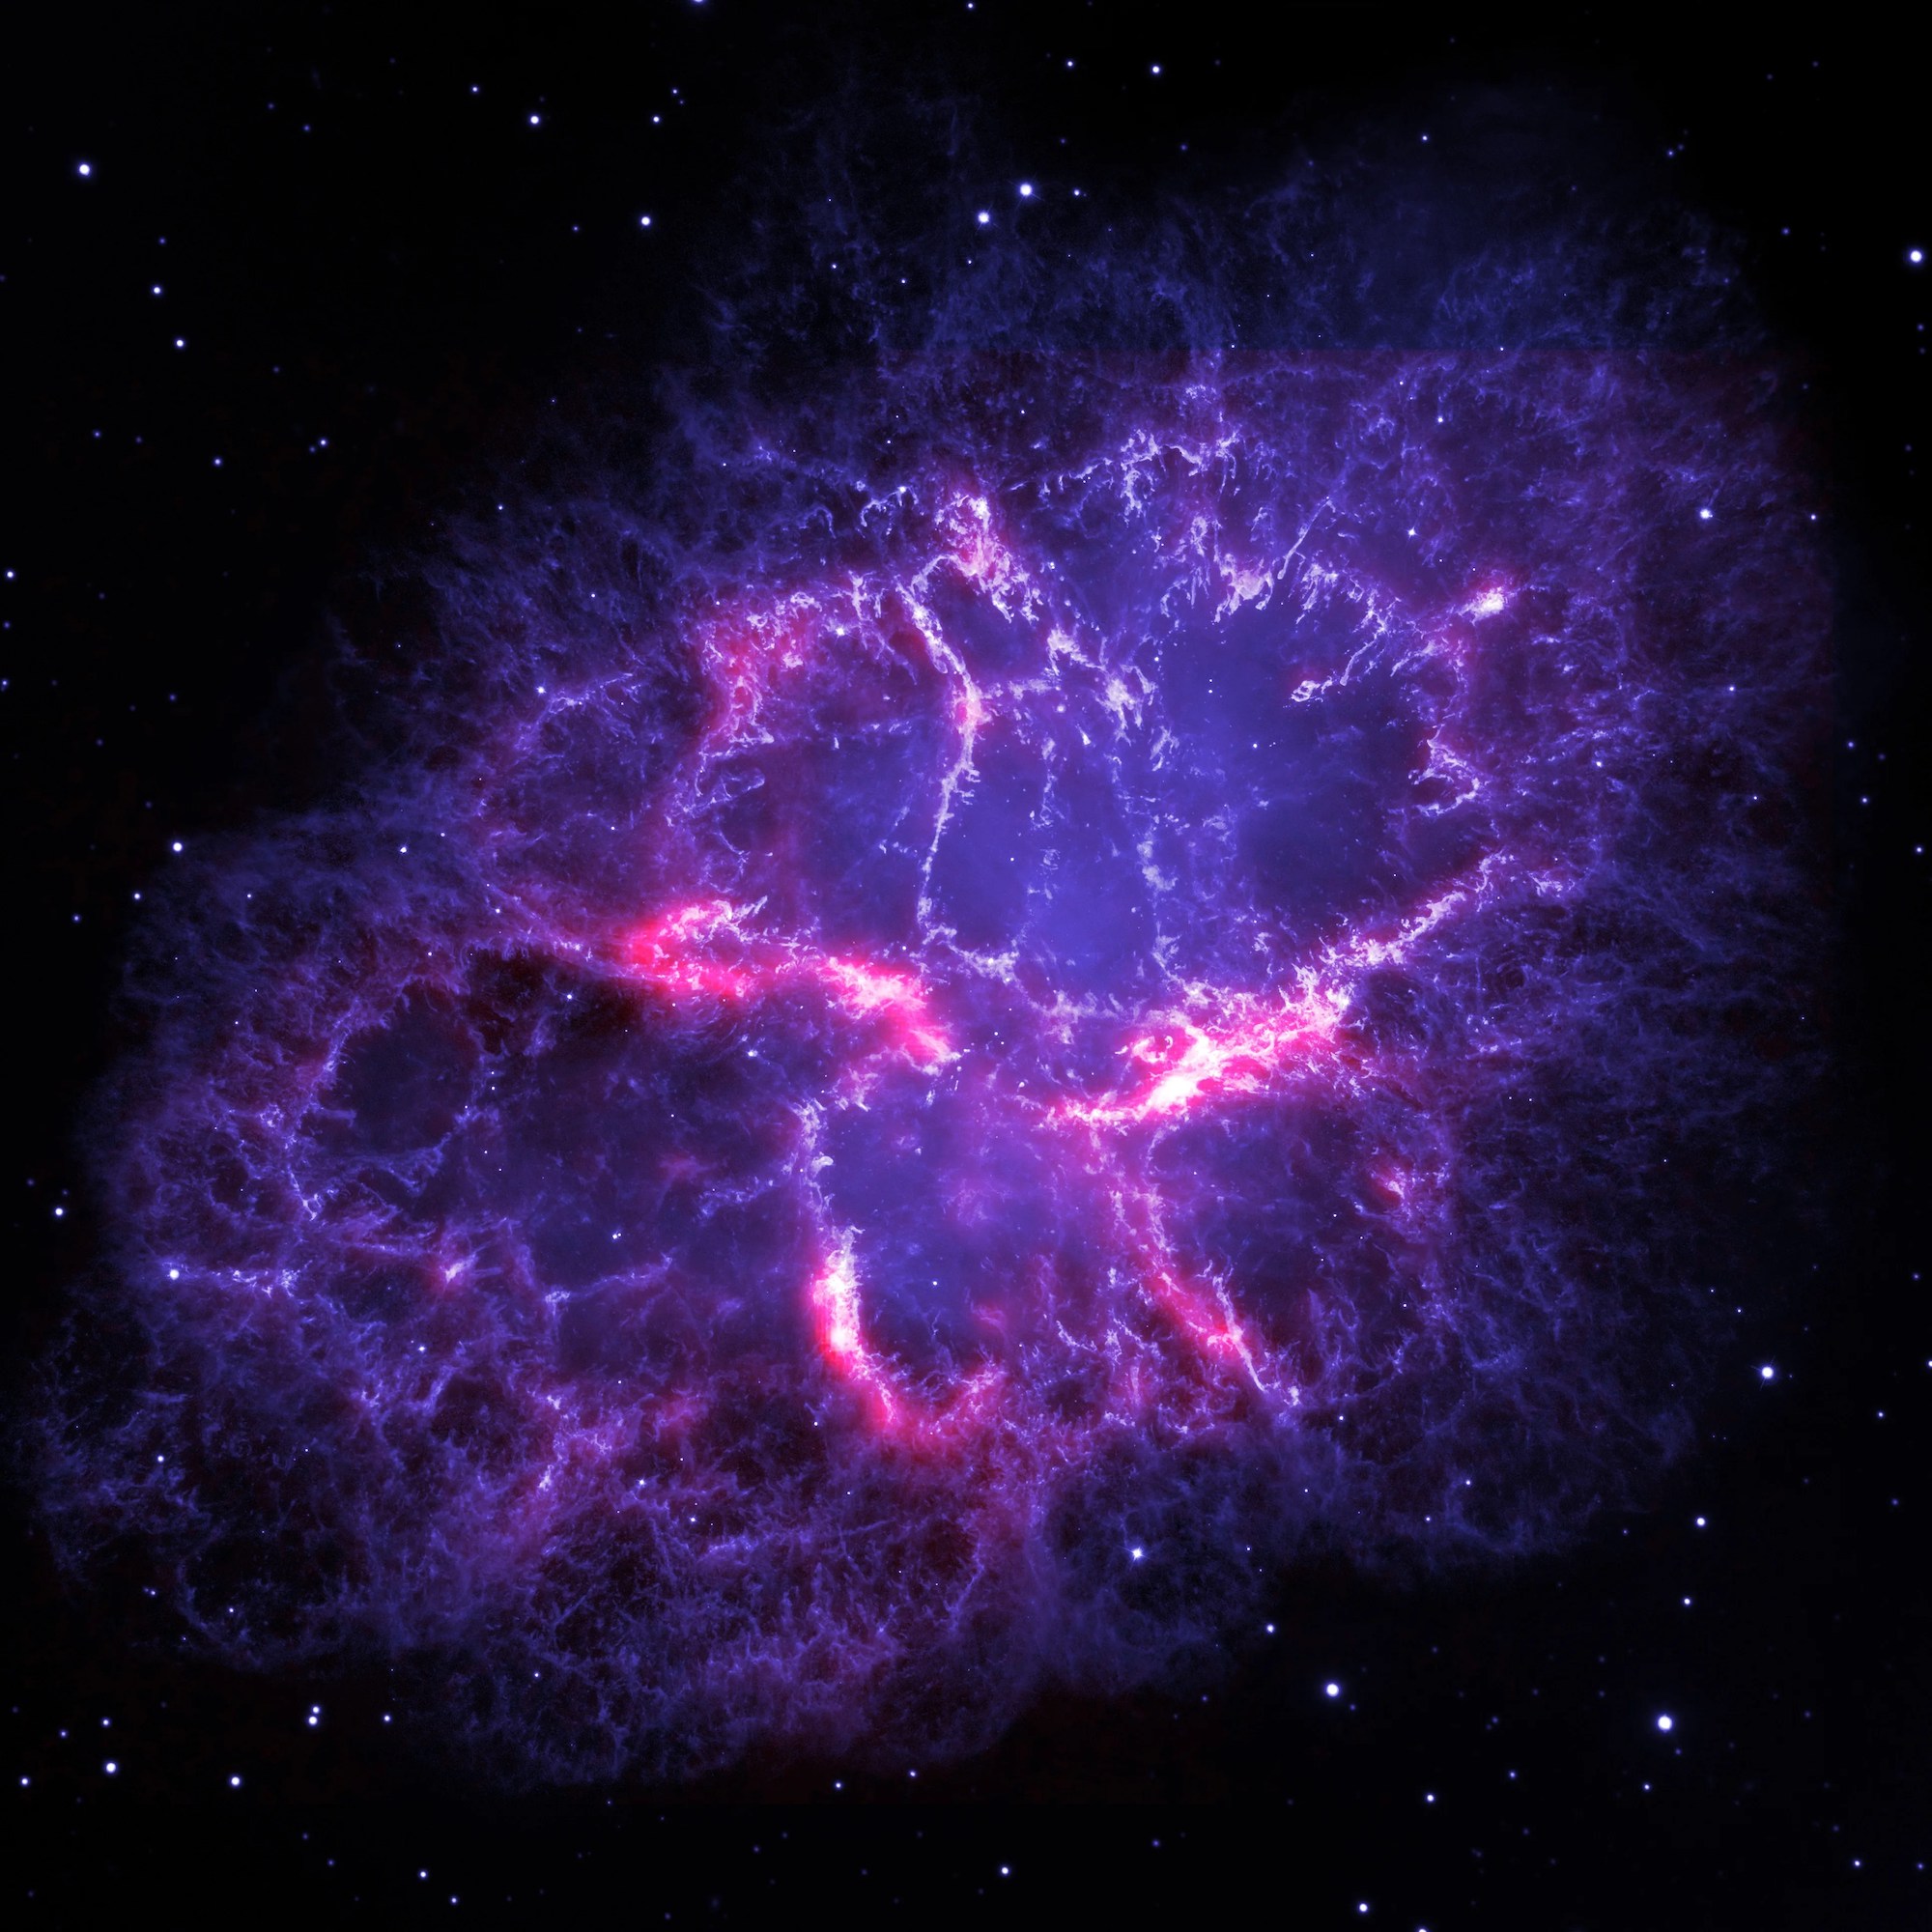
A multi-wavelength view of the Crab Nebula, the remnant of a supernova that birthed a neutron star. The neutron star powers a pulsar wind nebula, shown in blue. [X-Ray: NASA/CXC/J.Hester (ASU); Optical: NASA/ESA/J.Hester & A.Loll (ASU); Infrared: NASA/JPL-Caltech/R.Gehrz (Univ. Minn.)]

When massive stars go supernova, the explosion can leave behind the condensed stellar core in the form of a neutron star. Neutron stars that spin rapidly become pulsars, whose fast rotation powers beams of radio emission along the star’s poles.

Until not too long ago, pulsars appeared to have periods no longer than 12 seconds. Above that “sluggish” rotation rate, researchers suggested, pulsars could no longer produce electron–positron pairs and channel them along polar magnetic field lines to generate their characteristic radio signals.

So it seemed, until unexpectedly slow pulsars began to crop up. The first trend-breaking pulsars had periods of a few dozen seconds, and objects with pulse periods of minutes or hours have now been found. What could these strange objects be?

Neutron Star Origin Story

In a recent article led by Savannah Cary (University of California, Berkeley), researchers proposed that these strange radio sources are pulsars, but pulsars that rotate slowly and have magnetically powered (rather than rotationally powered) radio emission.

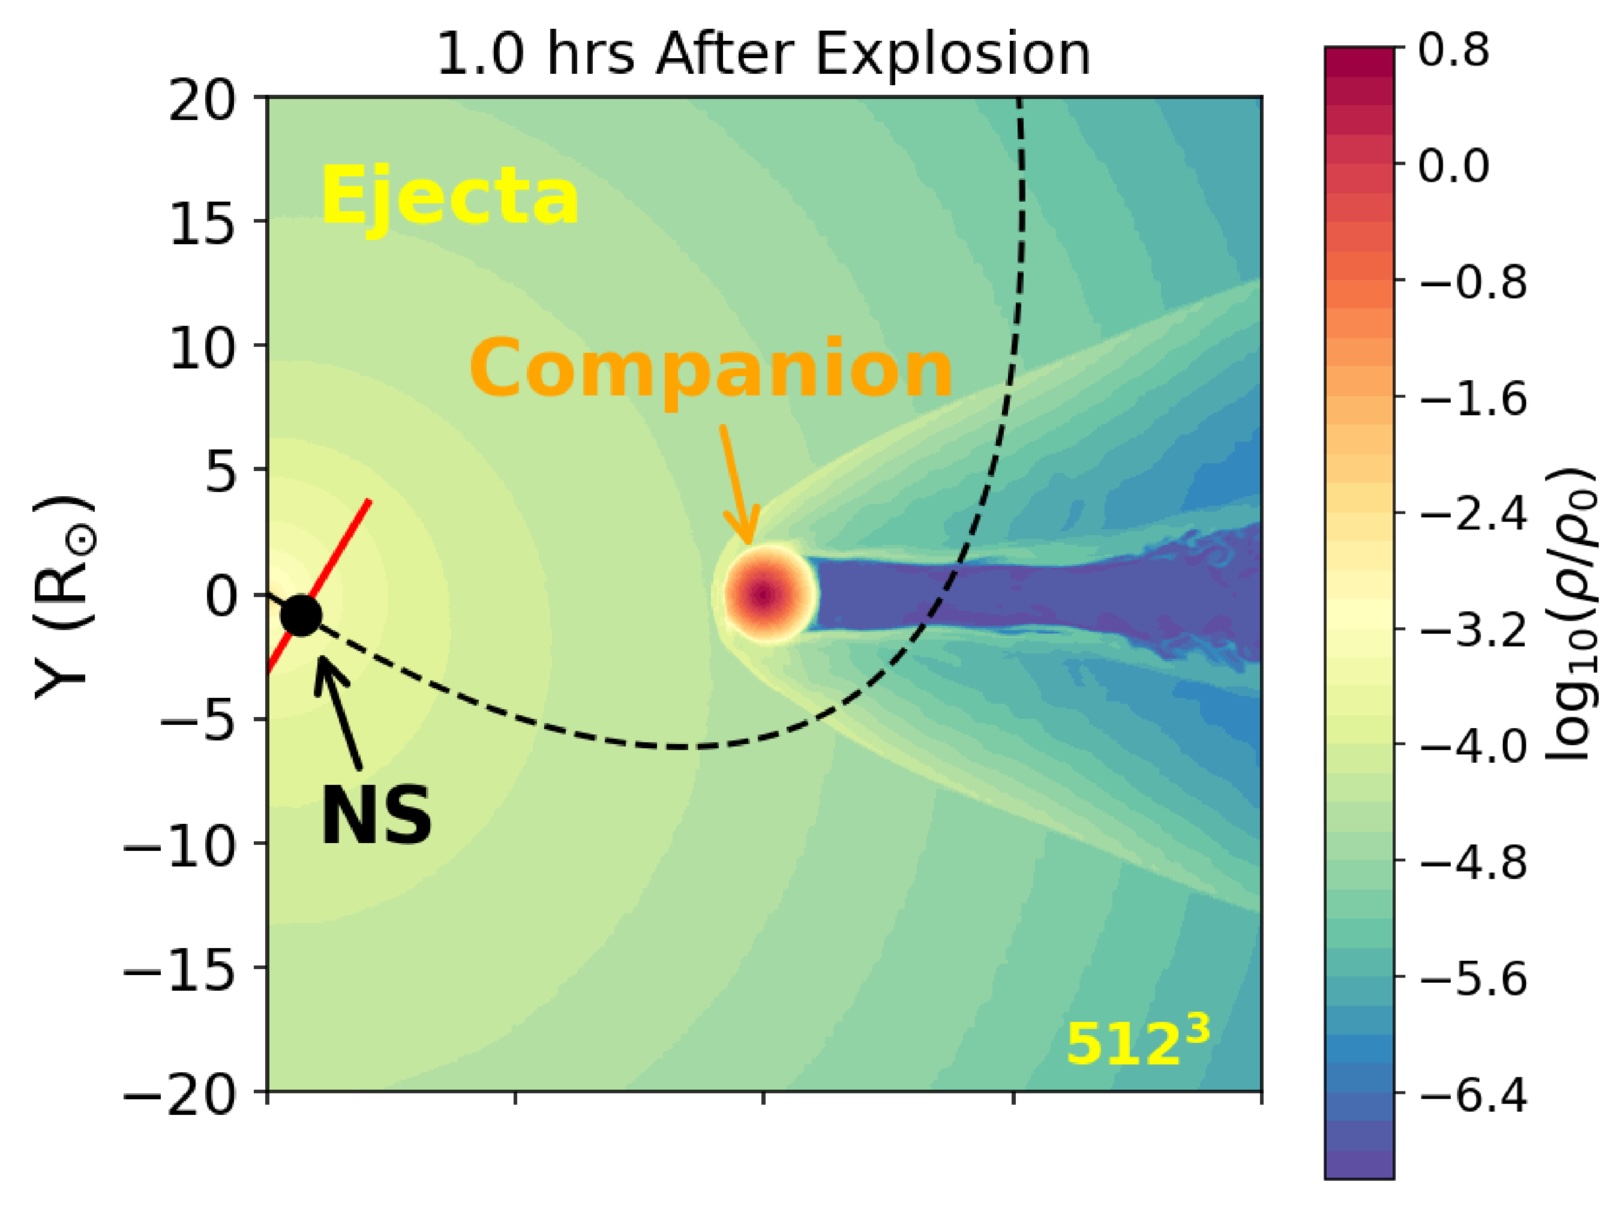
The proposed origin story for these ultra-long-period pulsars begins with a binary system containing a massive star and a close stellar companion. As the massive star evolves, it transfers its outer layers to the companion and expires as a stripped-envelope supernova that births a rapidly spinning neutron star. As the supernova ejecta crashes into the companion star, the star heats up and expands to 5–100 times its original radius.

simulation of supernova ejecta colliding with a star

Simulation snapshot taken one hour after the supernova explosion. The black dashed line shows the path the neutron star (NS) will take through the companion star’s outer layers. Click to enlarge. [Adapted from Cary et al. 2026]

Meanwhile, the explosion delivers a ferocious kick to the newborn neutron star, likely unbinding the binary system. This sets the neutron star on a new course that could take it through the puffed-up outer layers of its former companion, where it may collect gas from the star and ejected material from the supernova into an accretion disk.

Slowing Down

Cary’s team explored the outcomes of this scenario with a trio of simulations: hydrodynamical models for the shock heating of the companion star, numerical models for the formation of the disk around the neutron star, and analytical models for the interaction between the disk and the neutron star.

For a binary system containing stars of 6.4 and 4.0 solar masses and a separation of 20 solar radii — values drawn from observations and simulations — the resulting unbound neutron star collects a disk in 8–10% of cases. The neutron star’s mass, radius, rotation rate, and magnetic field strength determine whether the neutron star and the disk will interact. If they don’t, the neutron star remains rotating rapidly like a typical pulsar. If they do, the neutron star’s rotation will slow to a relative crawl over about a million years. For modest magnetic fields between 1013 and 1014 Gauss, this means rotation periods in the realm of 102 seconds, whereas stronger magnetic fields, above 1015 Gauss, yield periods of roughly a day.

This work suggests that close binary systems could be the source of ultra-long-period pulsars, of which Cary’s team estimates there may be 10–1,000 in the Milky Way. Future work will explore this possibility further, examining broader swaths of parameter space to learn more about how this scenario could contribute to the population of ultra-long-period pulsars in our galaxy.

Citation

“Accretion from a Shock-Inflated Companion: Spinning Down Neutron Stars to Hour-Long Periods,” Savannah Cary et al 2026 ApJ 996 141. doi:10.3847/1538-4357/ae1d43

The post Supernovae, Shocks, and Spindown: A Possible Origin Story for Ultra-Long-Period Pulsars appeared first on AAS Nova.

Selections from 2025: The Formation of Massive Stars

22 December 2025 at 17:00

star-forming region AFGL 5180

Editor’s Note: For the remainder of 2025, we’ll be looking at a few selections that we haven’t yet discussed on AAS Nova from among the most-downloaded articles published in AAS journals this year. The usual posting schedule will resume January 2nd.

The SOFIA Massive (SOMA) Star Formation Survey. V. Clustered Protostars

Published June 2025

Main takeaway:

A team led by Zoie Telkamp (University of Virginia) used the Stratospheric Observatory for Infrared Astronomy, SOFIA, to study massive protostars and test theories of high-mass star formation. Contrary to the predictions of some star-formation models, the team found no evidence that massive protostars require a certain surface mass density to form. Formation in a cluster environment, however, may limit the formation of the most massive protostars.

Why it’s interesting:

Massive stars are rare, short-lived, and luminous. They influence their environments across a vast range of spatial and temporal scales, from advancing the epoch of reionization in the early universe to impacting the formation of individual planetary systems in the present-day universe. The fundamental question of how high-mass stars form is still unsettled. Theories of high-mass star formation range from scaled-up versions of low-mass star formation to scenarios involving collisions between protostars.

More about this massive-star study and the potential impact of a cluster environment:

infrared images of massive protostars

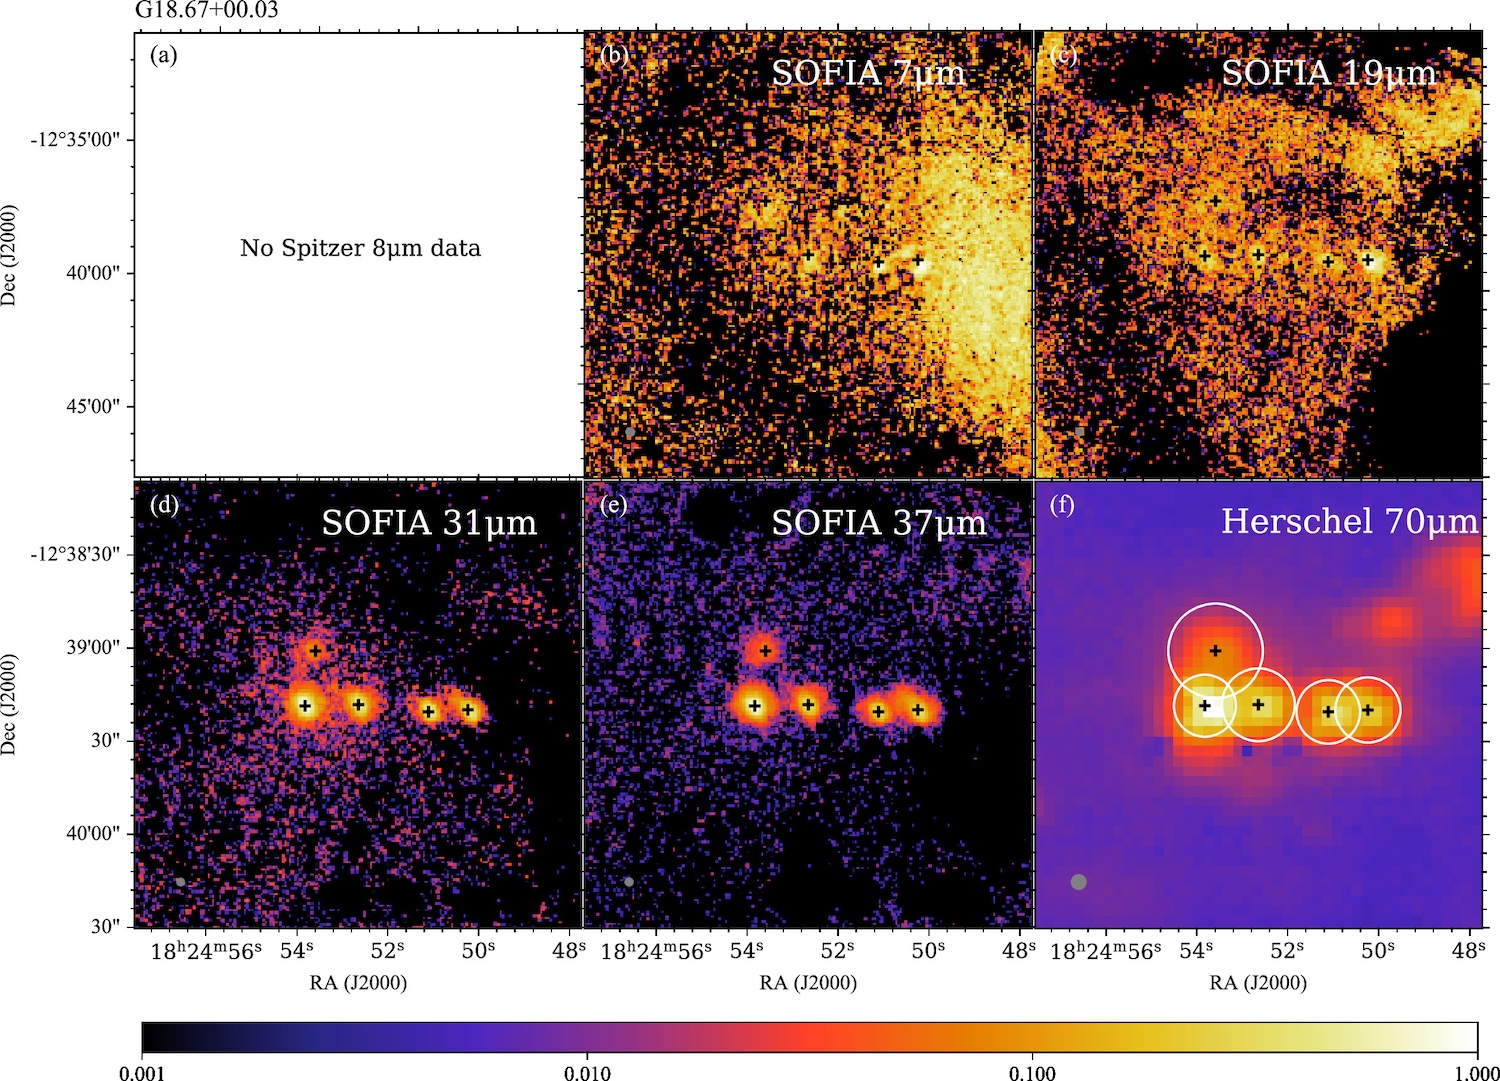
SOFIA FORCAST and Herschel Space Observatory images of protostars in the G18.67+0.03 star-forming region. Click to enlarge. [Telkamp et al. 2025]

Researchers developed the SOFIA Massive Star Formation Survey to investigate the origins of massive stars, targeting roughly 50 high-mass and intermediate-mass protostars in a wide variety of environments in our galaxy. This particular work, the fifth in a series of articles reporting the survey’s findings, described the team’s study of massive protostars forming in cluster environments. Using the Faint Object infraRed CAmera for the SOFIA Telescope (FORCAST), Telkamp and collaborators identified 34 protostars in seven star-forming regions and estimated their masses and other physical properties. The team noted a lack of protostars above 30 solar masses in these cluster regions, which might be evidence that competition for gas in dense environments can prevent the formation of more massive protostars. More work is needed to confirm this finding.

Citation

Zoie Telkamp et al 2025 ApJ 986 15. doi:10.3847/1538-4357/adcd79

The post Selections from 2025: The Formation of Massive Stars appeared first on AAS Nova.

A Unified Explanation for Fast Radio Bursts

10 December 2025 at 17:00

artist's impression of a magnetar in a binary system

A discovery that linked a fast radio burst to a magnetar in the Milky Way showed that certain fast radio bursts come from magnetars. A new study explores whether all fast radio bursts could have magnetar origins.

Varied Bursts

magnetar SGR 1935+2154

The bright blue source at the center of this X-ray image is SGR 1935+2154, the first magnetar to be associated with a fast radio burst. [Zhou et al. 2020]

Fast radio bursts — extremely bright radio blips lasting anywhere from a fraction of a millisecond to a few seconds — have provided researchers with one of the best recent astronomical mysteries. What causes these brilliant radio flashes, and why are they so varied? Most fast radio bursts seem to happen just once, while others repeat frequently or infrequently on irregular or regular timescales.

In July 2020, astronomers reported the discovery of a fast radio burst likely associated with a magnetar in the Milky Way. This discovery suggested that at least some fast radio bursts come from magnetars, the rapidly spinning, intensely magnetized remnants of certain massive stars. However, it’s still not known whether all fast radio bursts share this origin, or if their varied behaviors can be traced to equally varied origins.

Mystery Solved by Magnetars?

In a recent research article, Bing Zhang (University of Hong Kong; University of Nevada) and Rui-Chong Hu (University of Nevada) set out to explore the possibility that all fast radio bursts have magnetar origins.

illustration of magnetar origins

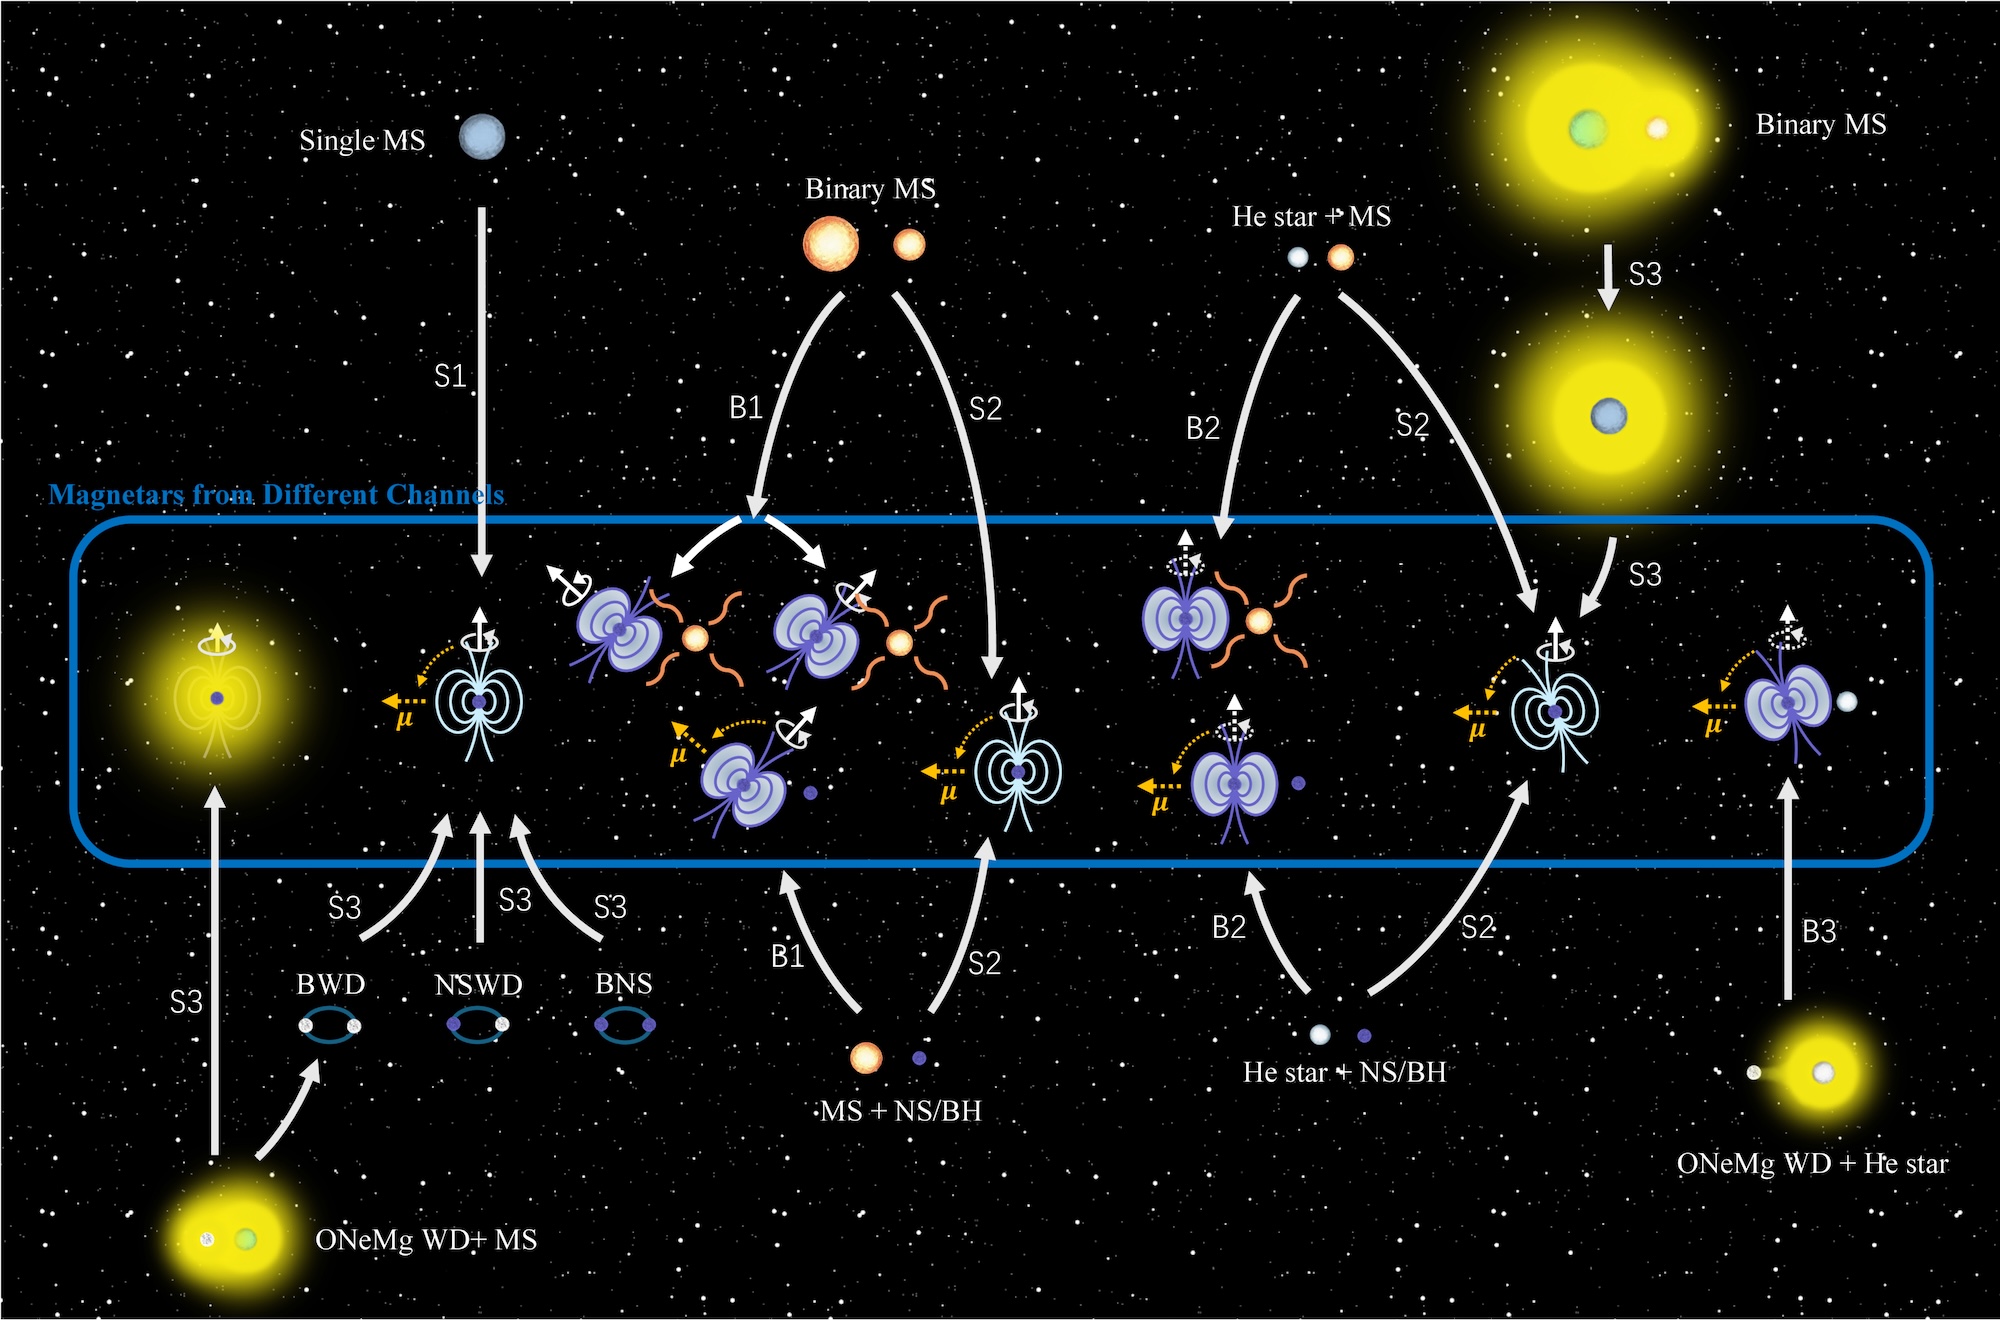
Magnetar formation pathways. The magnetic field lines of isolated magnetars have a black background, while the field lines of magnetars in binary systems have a white background. Click to enlarge. [Zhang & Hu 2025]

Zhang and Hu examined the different pathways through which magnetars form, as well as what properties they tend to have in each of these scenarios. This analysis suggested that the vast majority of magnetars in our universe are singletons, having formed from isolated stars, disrupted binary systems, or stellar mergers. This aligns with observations of magnetars in the Milky Way, none of which appear to have companions.

The remaining few percent of magnetars reside in binary systems. These coupled-up magnetars largely have companions more than twice as massive as the Sun, though some are paired with helium stars or compact objects.

Multiple Possible Arrangements

illustration of a magnetar in a binary system

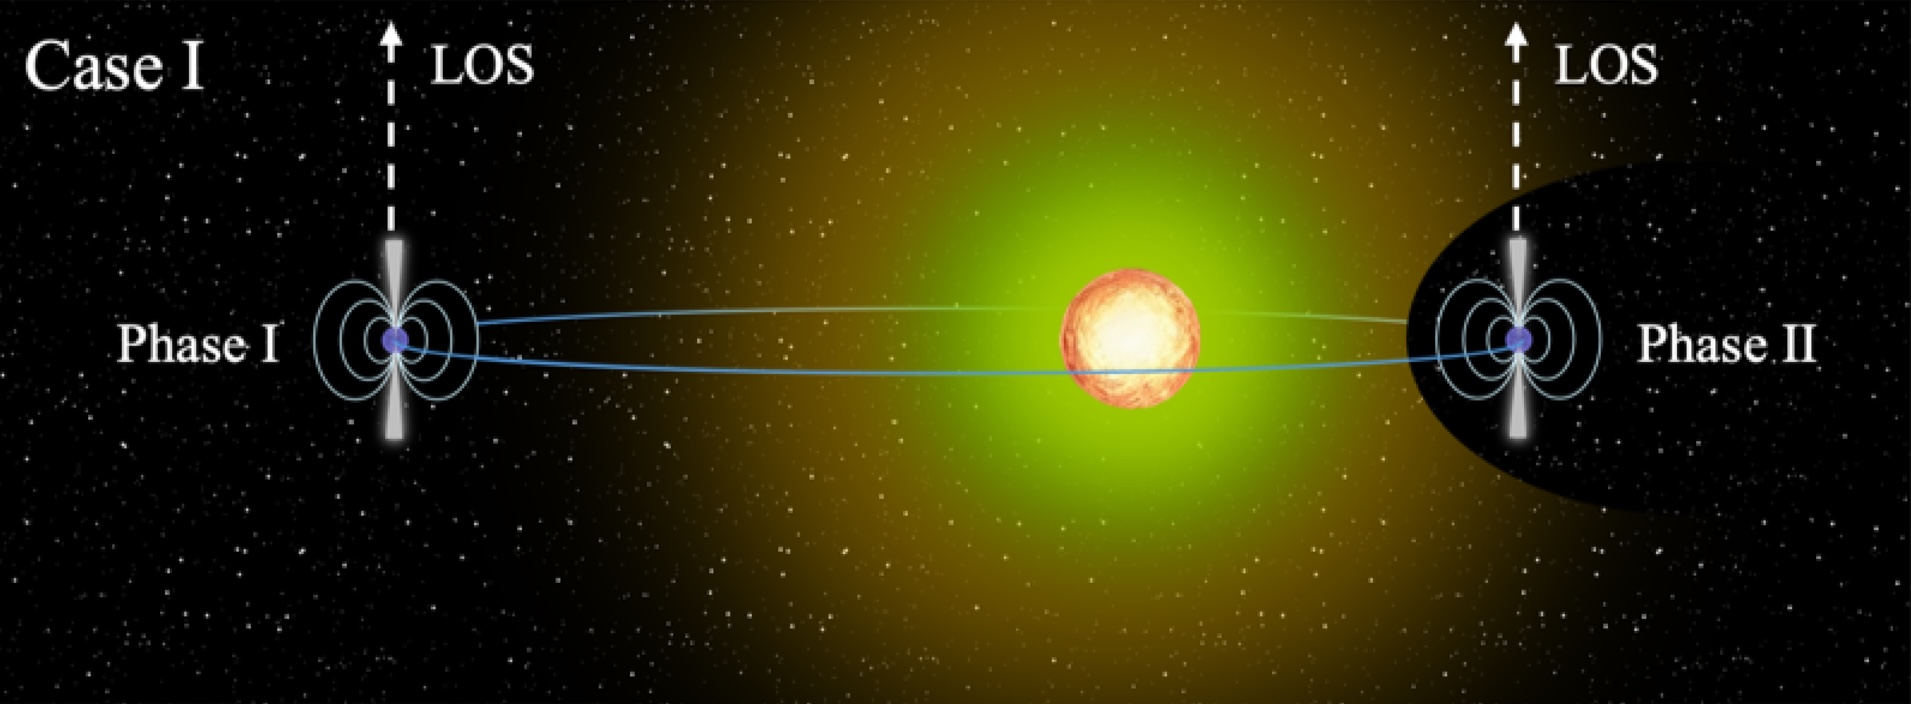
Illustration of a magnetar in a binary system with a star with a stellar wind. As the magnetar moves along its orbit, it encounters differing amounts of stellar wind. This affects the polarization angle of the bursts. Click to enlarge. [Adapted from Zhang & Hu 2025]

Zhang and Hu found that both isolated and paired-up magnetars tend to form with their spin and magnetic axes in close alignment — a setup that likely enables the production of rapid-fire fast radio bursts. For isolated magnetars, these axes may become misaligned over time, sapping their ability to produce repeated bursts. In binary systems, magnetars that accrete mass from the stellar winds of a companion likely retain their alignment, creating a long-lasting engine of repeating fast radio bursts. The presence of winds from a stellar companion may also explain several curious traits of some fast radio bursts, such as rapid changes in polarization angle.

In this framework, actively repeating fast radio bursts arise from aligned magnetars in binary systems, while one-off or infrequently repeating bursts come from isolated magnetars or misaligned magnetars in binary systems. Isolated magnetars could also be responsible for some actively repeating bursts, though this ability is likely short lived.

Though this work demonstrates that magnetars could be the source of all fast radio bursts, it doesn’t rule out the possibility that fast radio bursts have diverse origins instead. Further work is needed to explore other pathways and make even more headway on the mystery of fast radio bursts.

Citation

“Magnetars in Binaries as the Engine of Actively Repeating Fast Radio Bursts,” Bing Zhang and Rui-Chong Hu 2025 ApJL 994 L20. doi:10.3847/2041-8213/ae1023

The post A Unified Explanation for Fast Radio Bursts appeared first on AAS Nova.

Bumpy Road Ahead: Can Binary Interactions Make Supernovae Periodically Brighter?

2 December 2025 at 17:00

Hubble image of a supernova in the galaxy NGC 2525

Editor’s Note: Astrobites is a graduate-student-run organization that digests astrophysical literature for undergraduate students. As part of the partnership between the AAS and astrobites, we occasionally repost astrobites content here at AAS Nova. We hope you enjoy this post from astrobites; the original can be viewed at astrobites.org.

Title: Supernova-Induced Binary-Interaction-Powered Supernovae: A Model for SN2022jli
Authors: Ryosuke Hirai (平井遼介) et al.
First Author’s Institution: RIKEN Pioneering Research Institute, Monash University, OzGrav: The ARC Centre of Excellence for Gravitational Wave Discovery
Status: Published in ApJ

There are thousands of dying stars that go bang in the night. These explosions are known as supernovae, and they are classified primarily on what spectral lines they show in the days and weeks following their initial explosion. Most broadly, they are separated into Type I (spectra that show little or no evidence of hydrogen) and Type II (spectra that show hydrogen). The physics leading to each type of supernova is different, and astronomers use all of the information at their disposal to learn about these cosmic fireworks.

One of the most useful tools for monitoring and learning about a supernovae is its light curve — the plot of the explosion’s brightness over time. This light curve usually appears as a steep incline up to a peak in brightness several days after the initial detonation, and then a shallow decline in brightness over the following weeks. There are, however, a few examples of supernovae that break this mould.

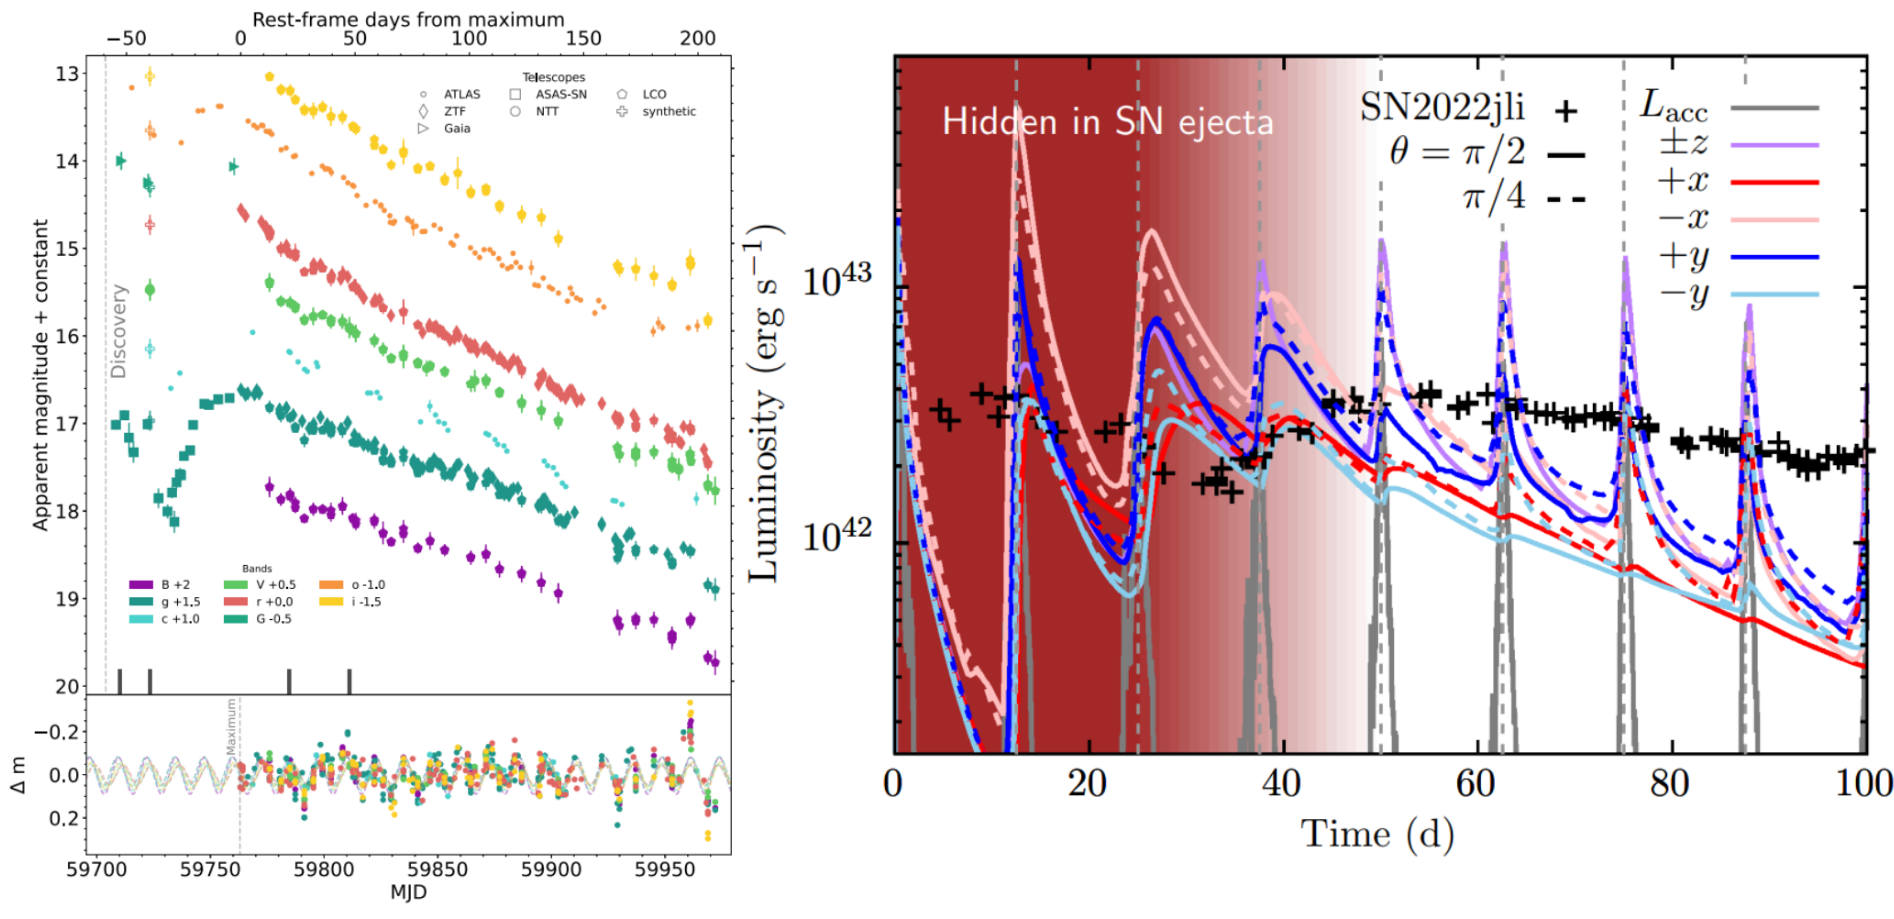
Today’s article seeks to understand the curious case of supernova SN2022jli. Unlike the typical gradual fade in brightness, the light curve of this supernova shows a periodic bump of brightness every 12.5 days (see Figure 1). The proposed mechanisms to explain this include the blown-apart supernova material interacting with concentric and regularly spaced shells of circumstellar matter, or a binary companion that interacts with the supernova remnant each orbital period. The authors of today’s article investigate the latter scenario by running 3D hydrodynamical simulations of an interacting, post-supernova binary to try to recover SN2022jli’s periodic light curve and constrain the orbital characteristics of the system.

light curve of SN2022jli

Figure 1: The light curve of SN2022jli shows periodic oscillations in the brightness, superimposed on top of the typical fading luminosity of a supernova. The left plot shows the light curve across various colours, and the associated bottom panel shows the oscillations with the typical fading supernova signal subtracted. The right plot shows the light curve of the authors’ proposed mechanism, where the different coloured lines are for different viewing angles on the system at the heart of the supernova. [Moore et al 2023 (left) and Hirai et al. 2025 (right)]

The authors only have the supernova’s light curve to go off of, so they explore a range of orbital scenarios to explain SN2022jli. They run a series of models evolving a neutron star — the degenerate core left over after a low-mass supernova — together with a main-sequence stellar companion, varying the orbital eccentricity and companion mass, while fixing the orbital period (at the observed 12.5-day oscillatory period) and neutron star mass to 1.4 solar masses — a typical mass for a newborn neutron star.

Why a neutron star? SN2022jli is a sub-class of Type I supernovae involving a “stripped” massive star which has lost its hydrogen — most likely through interactions with a close companion. These interactions typically circularise the pre-supernova orbit, and the subsequent explosion most commonly yields neutron stars. To explain the necessarily highly eccentric post-supernova orbit that may cause the periodic oscillation in SN2022jli, there was most likely a “natal kick” — a sudden and asymmetric burst during the supernova that rockets the neutron star in a random direction — which widened the orbit and de-circularised it, giving further evidence for a neutron star remnant.

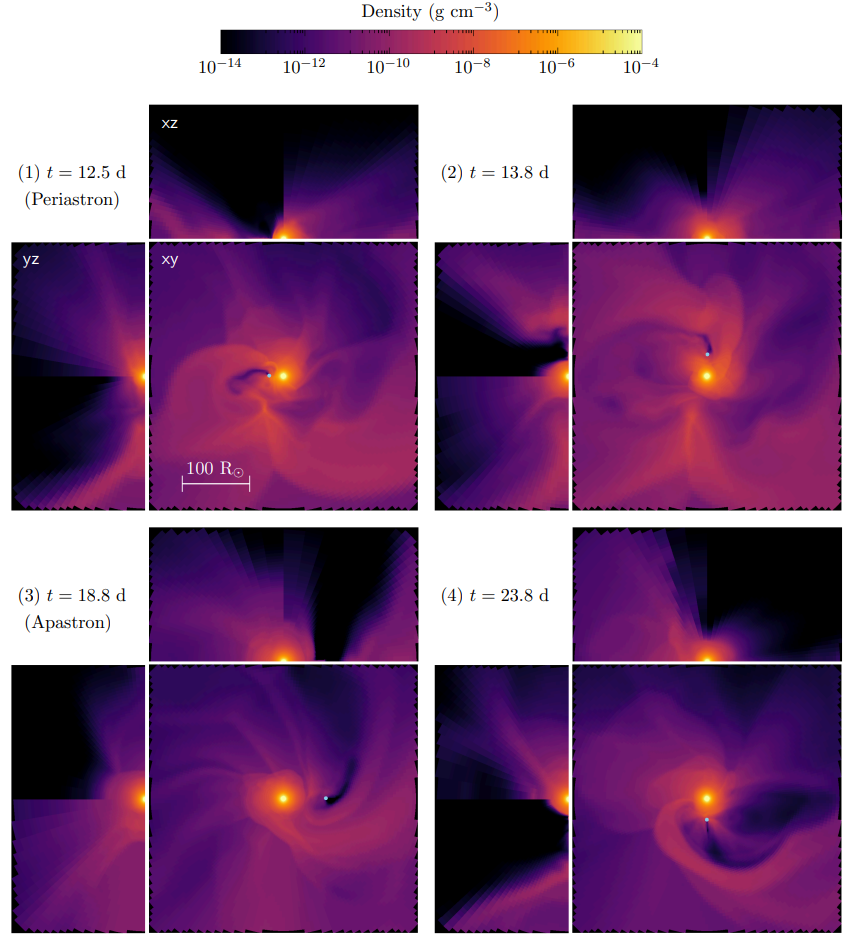
Immediately following the supernova explosion, ejecta interacting with the main-sequence companion star would heat the star and cause it to swell up. This inflated companion then feeds matter to the orbiting dense neutron star, and the accretion is most intense when the stars are closest in their orbit (called the periastron). During accretion, however, mass is not perfectly absorbed onto the neutron star, and there is some feedback onto the surrounding gas due to the complex thermal and magnetic physics around the neutron star. In this study, the authors model cases where there is no feedback, feedback from thermal radiation due to accretion, or feedback from bipolar outflows via jets or disk winds. Snapshots from the simulation involving a 5-solar-mass companion on an orbit with eccentricity of 0.5 and bipolar feedback is shown in Figure 2.

simulations of a neutron star with an inflated main-sequence companion

Figure 2: Several density snapshots of the 3D hydrodynamic simulations show how the neutron star (blue point) in the binary accretes and sculpts matter from the inflated main-sequence companion star (bright diffuse blob in the centre of each panel). The xy panels are a top-down look onto the orbital plane, while the xz and yz panels show a cross section through the plane. [Hirai et al. 2025]

The authors evolve the simulation for several orbits and show that periodic bursts of accretion onto the neutron star are capable of producing the oscillatory behaviour seen in SN2022jli’s light curve. The scale of the brightness oscillations are best recreated if the plane of the binary’s orbit is aligned with our line of sight (shown with the +x red line on the right side of Figure 1). Still, the profile of the undulations is not exactly reproduced by the model, and the outcome is very sensitive to our viewing angle of the binary orbit.

SN2022jli is just one of an emerging class of oscillatory supernovae, with more and more being discovered with highly sensitive modern all-sky surveys. Today’s authors rigorously modelled one proposed scenario to explain this periodic oscillation in brightness and showed that it is viable. More modelling using this interacting-binary mechanism on other oscillating supernova light curves — those with longer periods and different supernova classifications — will show whether this explanation is ubiquitous, or if the population of dancing supernova light curves is due to some other process!

Original astrobite edited by Anavi Uppal.

About the author, Ryan White:

I am a masters student at Macquarie University in Australia, working mainly on binary/multiple systems with massive stars (Wolf–Rayets in particular!). Outside of study, I’m a novice film buff, baking sourdough all the time, probably drinking coffee, and trying to get more into reading and frisbee/squash. You can also find me procrastinating on Bluesky @astroryan.bsky.social.

The post Bumpy Road Ahead: Can Binary Interactions Make Supernovae Periodically Brighter? appeared first on AAS Nova.

The Times They Are A-Changin’: Searching for Shifts in Variable Star Light Curves

26 November 2025 at 17:00

field of stars containing RR Lyrae variables

Editor’s Note: Astrobites is a graduate-student-run organization that digests astrophysical literature for undergraduate students. As part of the partnership between the AAS and astrobites, we occasionally repost astrobites content here at AAS Nova. We hope you enjoy this post from astrobites; the original can be viewed at astrobites.org.

Title: Search for the Blazhko Effect in Field RR Lyrae Stars Using LINEAR and ZTF Light Curves
Authors: Ema Donev and Željko Ivezić
First Author’s Institution: XV. Gymnasium (MIOC)
Status: Published in AJ

RR Lyrae stars are a class of pulsating variable stars — similar to better-known Cepheid variables — that sit on the horizontal branch of the Hertzsprung–Russell diagram. Because of the regularity with which they pulsate, these stars are useful for a number of scientific applications, including standard-candle distancing (helping astronomers set the scale of distances in the universe) and as probes of very old star formation in nearby populations (because most RR Lyrae stars are at least 10 billion years old).

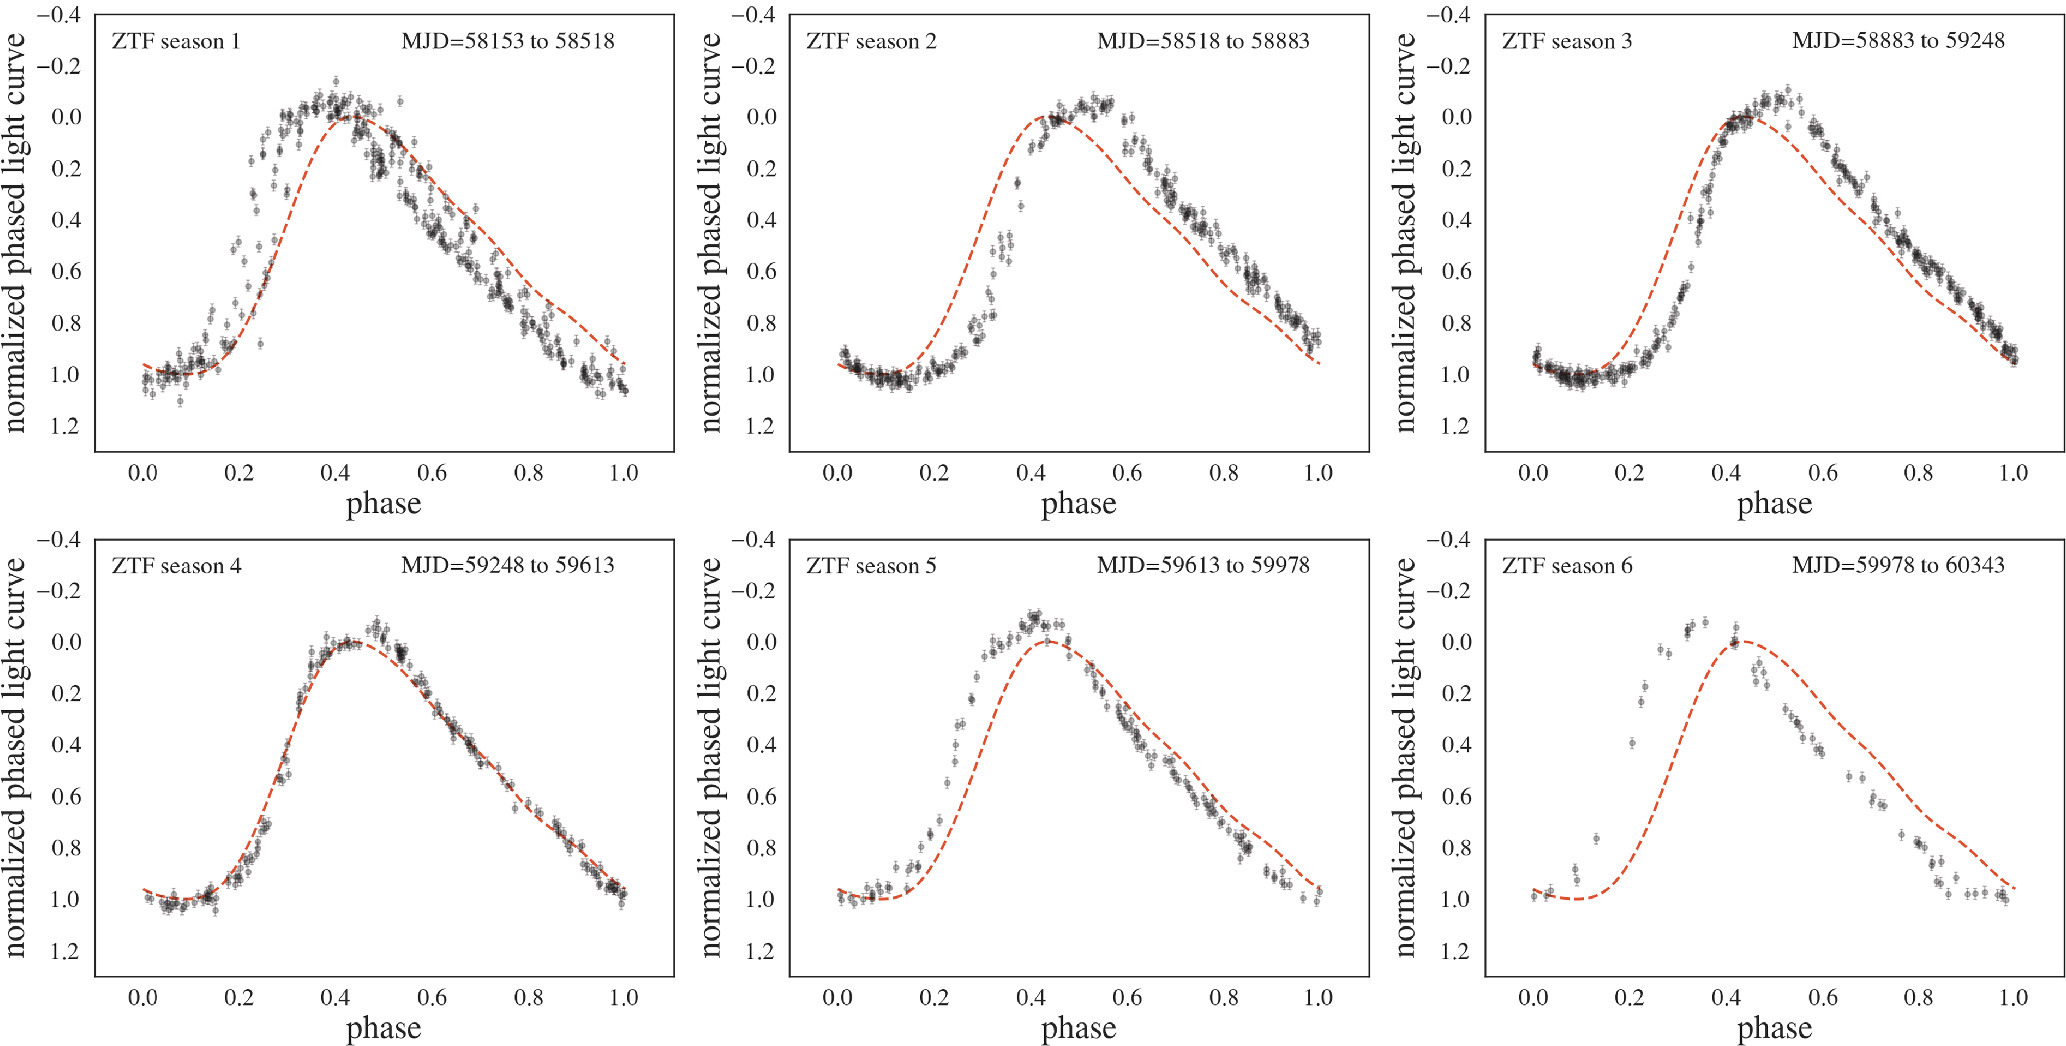
Today’s article studies the Blazhko effect in RR Lyrae stars. Simply put, the Blazhko effect is a long-term change of the duration (period) or strength (amplitude) of pulsation in some RR Lyrae variables. Fig. 1 shows an example from today’s article. While this effect was first observed as early as 1907, the physical mechanism for Blazhko modulation is still formally unknown, as is the percentage of RR Lyrae stars that exhibit it. Broadly speaking, there are three explanations for this effect: 1) nonlinear resonance between a star’s primary pulsation mode and some higher-level pulsation, 2) magnetic influence, or 3) cycles in the convection activity.

example of the Blazhko effect

Figure 1: An example of the Blazhko effect. Each panel shows data from ZTF for the same source for different seasons (at different times). The best-fit pulsation model for the total data set is shown in red. Over time, the actual pulsation of the source (black data) varies significantly from the average best fit due to Blazhko modulation. [Adapted from Donev and Ivezić 2025]

Today’s article searches for and identifies a population of Blazhko stars that may be used for future research into the Blazhko effect. Using data from the Lincoln Near-Earth Asteroid Research (LINEAR) asteroid survey and the Zwicky Transient Facility (ZTF) survey, the authors analyze around 2,857 RR Lyrae stars found in both data sets. The LINEAR survey was taken over a period of about 6 years, and the ZTF survey over about 5 years. On average, there is a 15-year difference between the LINEAR and ZTF observations. Using both, therefore, allows the authors to search for Blazhko modulation in each survey individually, as well as to compare between the two over the 15-year period. They additionally require a source to have at least 150 data points in both surveys to be considered.

From this initial set of RR Lyrae stars, today’s article identifies 531 potential Blazhko star candidates that are moved on to a visual inspection step. In order to identify the candidates for visual inspection, the authors establish two pre-selection methods based on the direct light curve and periodogram for each source:

  1. Light curve selection works by algorithmically assigning a score to each source, with higher scores indicating a greater expectation that the source is a Blazhko RR Lyrae star. The scores are associated with best-fit pulsation models. One way a given source could earn points was by having a very high reduced χ2 statistic in one or both data sets. Blazhko modulation changes the characteristics of the pulsations over time, meaning the best-fit model will be a poor fit to many of the pulsations within one or both data sets. Generally, poorer fits mean higher reduced χ2 values. In addition, candidates could earn points by having a moderately high reduced χ2 statistic in one or both data sets, as well as a significant change in pulsation characteristics of the best fit model from one data set to the next. Such a change between data sets is an indication of long-term Blazhko modulation. From this 479 of the 531 candidates are identified.
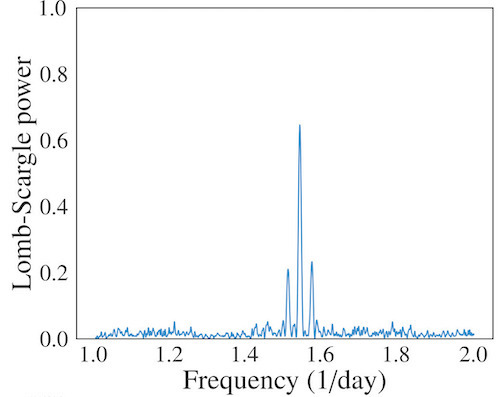
  2. Periodogram selection works by looking for interactions between the primary pulsation and Blazhko frequencies. First, the authors create a periodogram for the time-series data. In short, a periodogram plots a number of possible frequencies (or periods) of variability in the data versus the “power” associated with that frequency (or period), where higher power means the data vary more strongly at that frequency. When periodic data have only one associated frequency, the periodogram will show a single peak with high power. In the case where there are two effects of variation (in this case, the pulsation of the star and the Blazhko modulation) with disparate frequencies, a single, large peak will occur at the average frequency, with a smaller peak appearing to either side. Fig. 2 shows an example using simulated data. By identifying the location and strength of these side peaks, the authors are able to identify a handful of additional Blazhko sources (29), as well as estimate the frequencies of Blazhko modulation.
simulated Lomb–Scargle periodogram

Figure 2: A simulated Lomb–Scargle periodogram made using the sum of two sine functions with similar, but different, frequencies. Note the primary peak at the frequencies’ mean, and the smaller side peaks indicating the difference. [Adapted from Donev and Ivezić 2025]

From here, the authors visually inspect the 531 candidates and confirm that 228 of them exhibit convincing evidence of the Blazhko effect. They are able to place a lower limit on the percentage of RR Lyrae stars that are Blazhko sources at 11.4 ± 0.8%. In addition, they report that for a certain subclass of RR Lyrae stars, those that show the Blazhko effect have pulsation periods 5% shorter on average but no significant difference in amplitude. But a less common subclass of RR Lyrae stars shows no significant difference in period or amplitude when comparing Blazhko sources to the general population. Finally, the authors highlight that some sources show Blazhko modulation in one data set, but not the other, indicating that the modulation itself may change over time. Further research into this finding may help us better identify the most likely physical mechanism(s) for the Blazhko effect.

Original astrobite edited by Kylee Carden.

About the author, Catherine Slaughter:

Catherine is a PhD candidate in astrophysics at the University of Minnesota. Her research primarily deals with stellar population astrophysics in local dwarf galaxies, with particular focus on the intersection between computational and observational research methods. Prior to moving to Minnesota, she completed her BA in Physics and Astronomy, and MSc in Astronomy Research at Leiden University.

The post The Times They Are A-Changin’: Searching for Shifts in Variable Star Light Curves appeared first on AAS Nova.

Hubble on the Hunt: A Spectroscopic Search for Betelbuddy

24 November 2025 at 17:00

constellation Orion

Multiple research teams have turned to the famous red supergiant Betelgeuse in search of a possible companion star hiding in its glare. A carefully designed spectroscopic search has placed new constraints on the identity of Betelgeuse’s stellar buddy.

Betelgeuse and its companion star

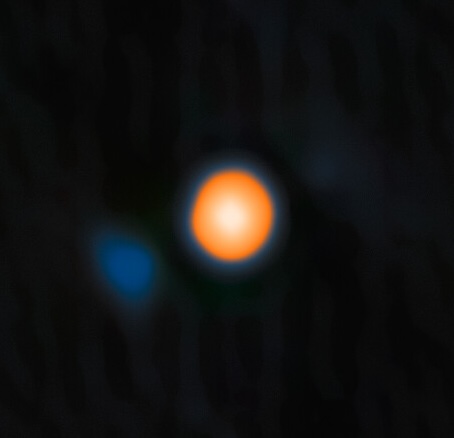
An image of Betelgeuse and its probable companion star from the ‘Alopeke instrument on the Gemini North telescope. [International Gemini Observatory/NOIRLab/NSF/AURA; Image Processing: M. Zamani (NSF NOIRLab); CC BY 4.0]

Betelgeuse and Its Buddy

Betelgeuse, a nearby red supergiant, is a variable star with a 400-day primary pulsation period and a 2,100-day secondary variation period. Recent studies have speculated that this secondary period is due to the presence of an 0.5–2.0-solar-mass companion star (often nicknamed “Betelbuddy”), and researchers using a speckle imaging technique likely spotted this companion earlier this year.

As is often the case when there’s an intriguing astronomical possibility, multiple research teams have sought out Betelgeuse’s purported stellar companion in different ways. One avenue recently described in a published paper was spectroscopic, searching for signs of ultraviolet emission lines from a growing young star.

Spectroscopic Search

In just 10 million years, Betelgeuse has sped through its main-sequence lifetime and taken on a new starring role as a red supergiant. In contrast, a 0.5–2.0-solar-mass companion star would not have even reached the main sequence in the same span of time. How is it possible to spot a tiny young stellar object next to a much brighter supergiant?

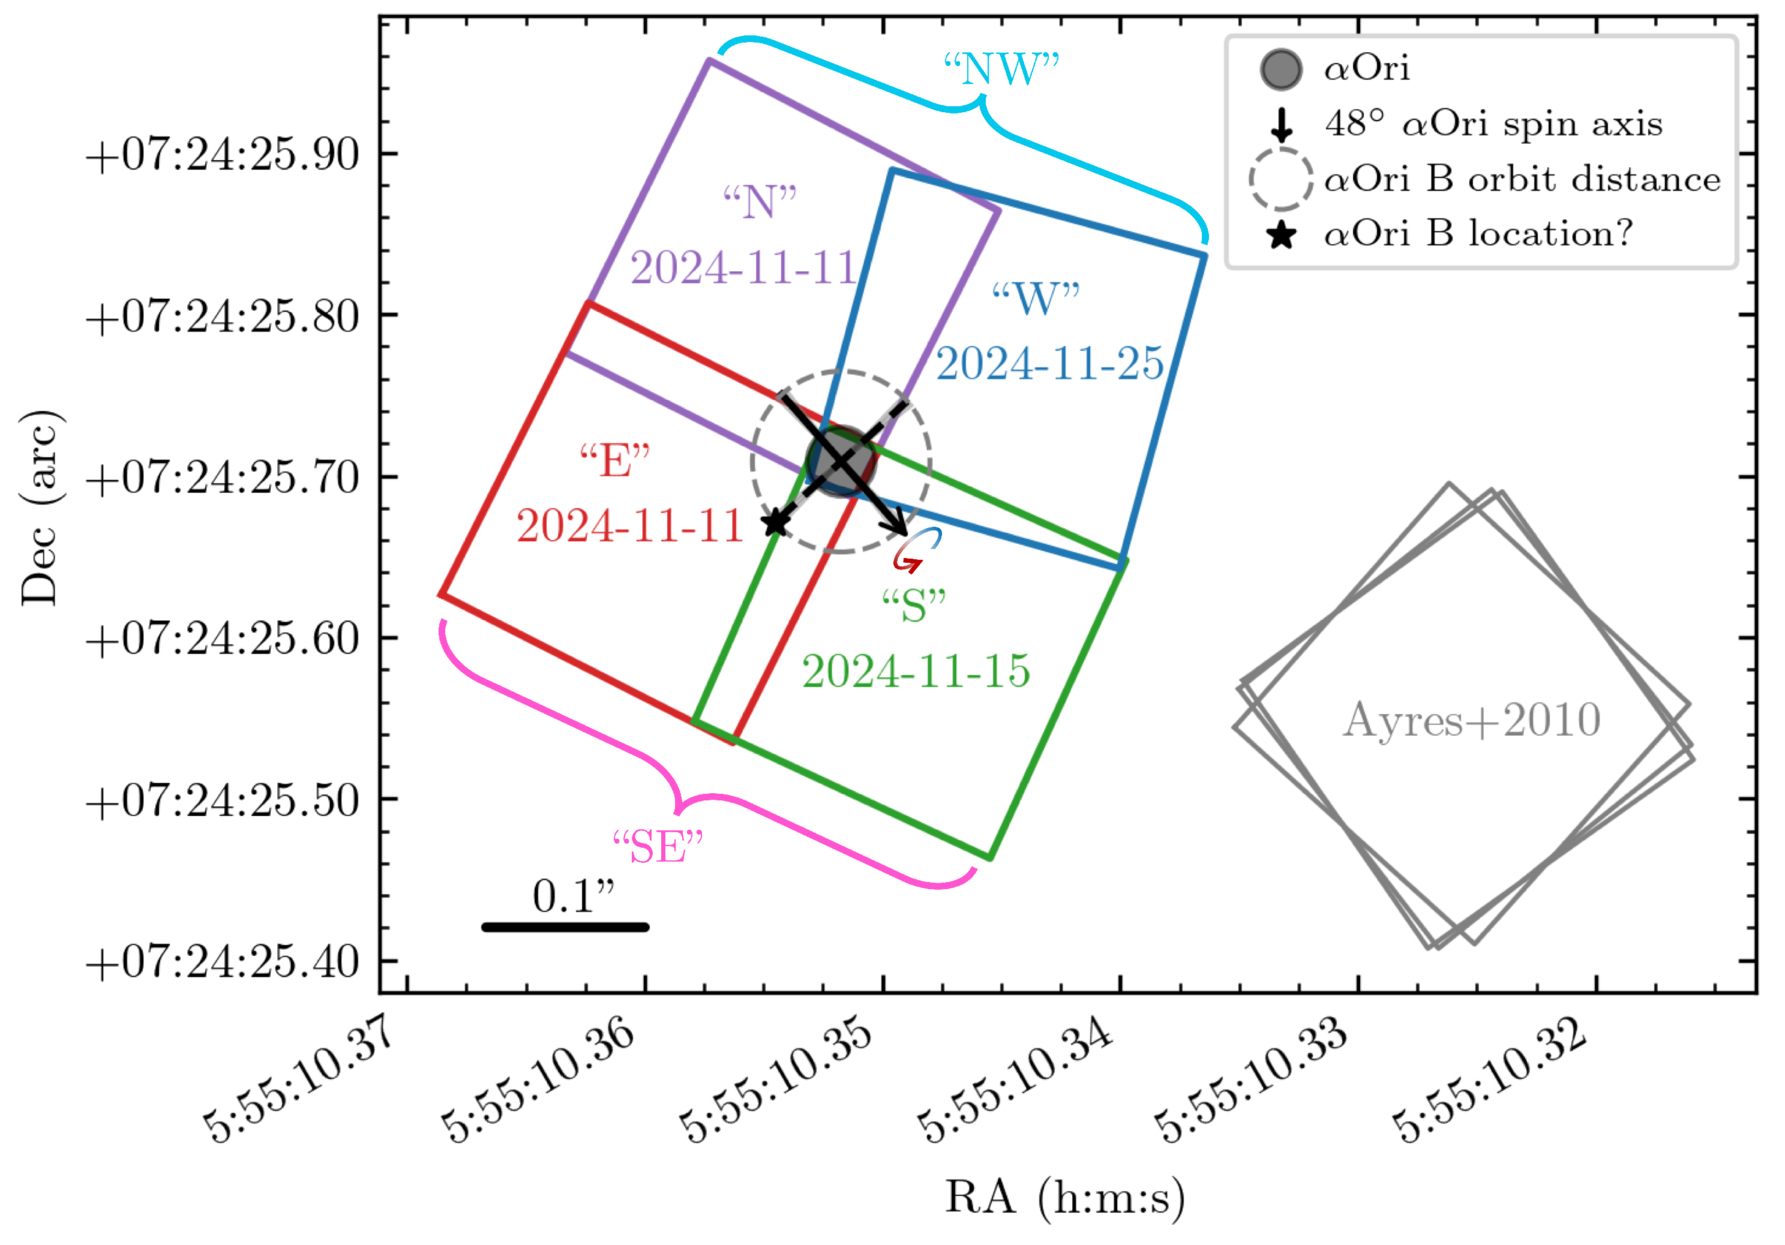
Hubble's observing pattern of Betelgeuse

Hubble observing pattern, showing how the quadrants are arrayed around Betelgeuse. Click to enlarge. [Goldberg et al. 2025]

A team led by Jared Goldberg (Flatiron Institute) found a possible way forward in the far-ultraviolet, where young stellar objects and red supergiants both display prominent emission lines. Though Betelgeuse would greatly outshine its stellar buddy, the companion’s orbital motion should shift its emission lines relative to those of Betelgeuse, bringing them into view. To guide their search, the team consulted spectra of known young stellar objects, finding a dozen ultraviolet spectral lines that either rival the strength of those from Betelgeuse or aren’t present in Betelgeuse’s spectrum at all.

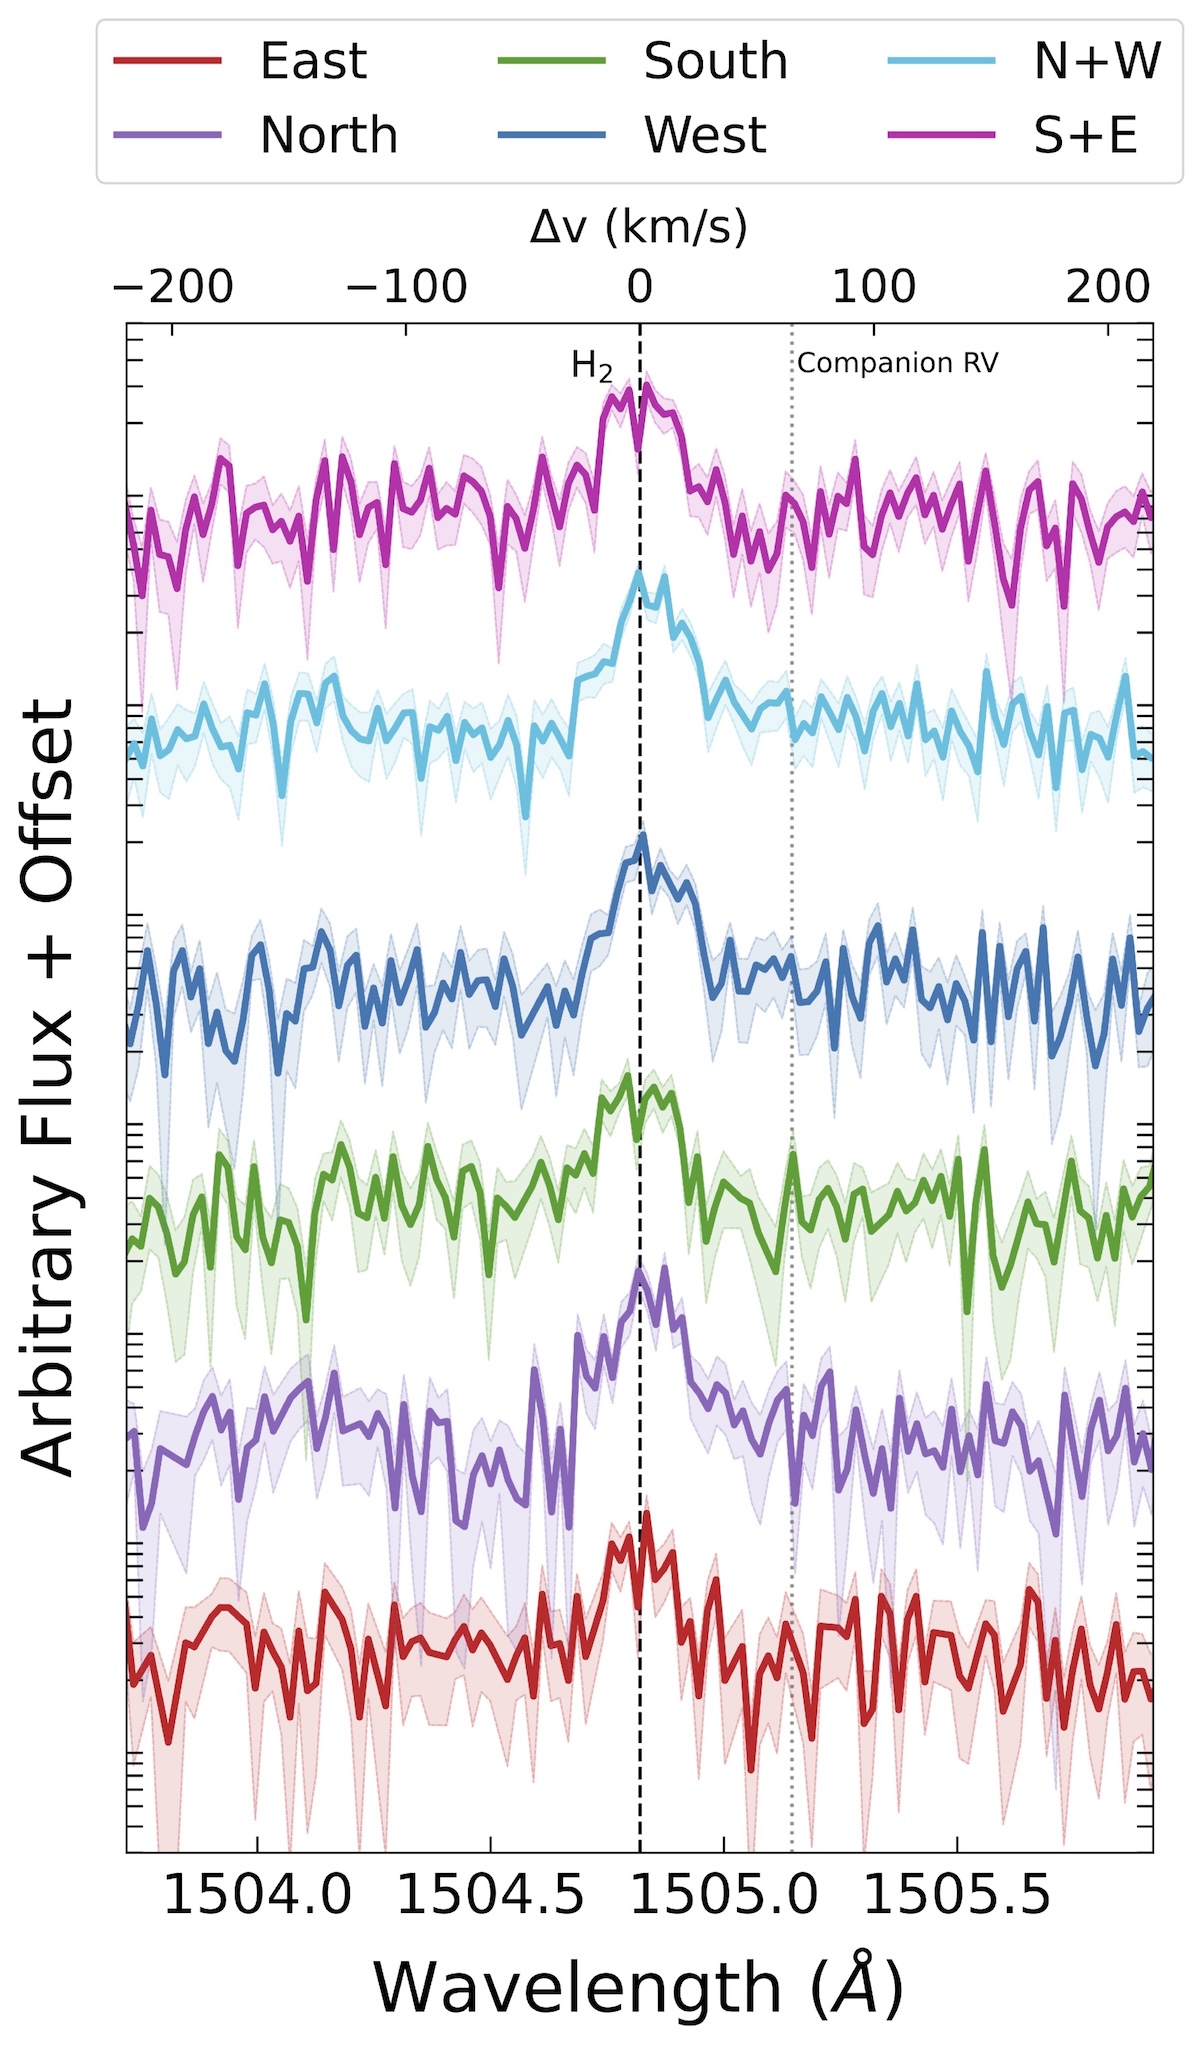
The search is on: Goldberg and collaborators observed Betelgeuse with the Hubble Space Telescope in November 2024, timed to when the companion star’s emission lines would be shifted relative to Betelgeuse. The observations split Betelgeuse’s disk into quadrants, only one or two of which should contain the companion, helping the team tease out the signal from the smaller star, if present. Ultimately, though, no statistically significant signals were found.

spectra of Betelgeuse

Emission around Betelgeuse’s 1504.82 Angstrom H2 line from each of the four observed quadrants as well as combinations of two quadrants. No significant signals were detected at the expected radial velocity of the companion star. [Goldberg et al. 2025]

When Finding Nothing Tells You Something

A lack of a significant detection doesn’t mean that the companion isn’t there, but it does place constraints on its identity. The data confidently rule out a companion star twice as massive as the Sun, marginally permit a star in the 1.1–1.5-solar-mass range, and favor a star lower than 1.1 solar masses.

Researchers assigned a likely mass of about 1.5 solar masses to the probable companion star imaged earlier this year. Though this is at the limit of what’s permitted by the ultraviolet observations, Goldberg and coauthors note that the companion star’s ultraviolet output could be suppressed due to tidal coupling with Betelgeuse or other processes. If the star’s ultraviolet emission is lower than expected, a 1.5-solar-mass companion remains consistent with Hubble’s non-detection of the star.

This is a fantastic example of how multiple lines of inquiry can converge on similar solutions. With the companion star expected to swing around to a favorable observing position again in 2027, this is certainly not the last chapter in the tale of Betelgeuse and Betelbuddy.

Citation

“Betelgeuse, Betelgeuse, Betelgeuse, Betel-buddy? Constraints on the Dynamical Companion to α Orionis from HST,” Jared A. Goldberg et al 2025 ApJ 994 101. doi:10.3847/1538-4357/ae0c0c

The post Hubble on the Hunt: A Spectroscopic Search for Betelbuddy appeared first on AAS Nova.

Too Much Nitrogen Pops Open the Search for the Universe’s First Stars

21 November 2025 at 17:00

Star formation in the early universe.

Astronomers have long sought evidence of the universe’s first generation of stars, and as more distant galaxies come into view, it seems these stars may finally be within reach.

JWST deep field

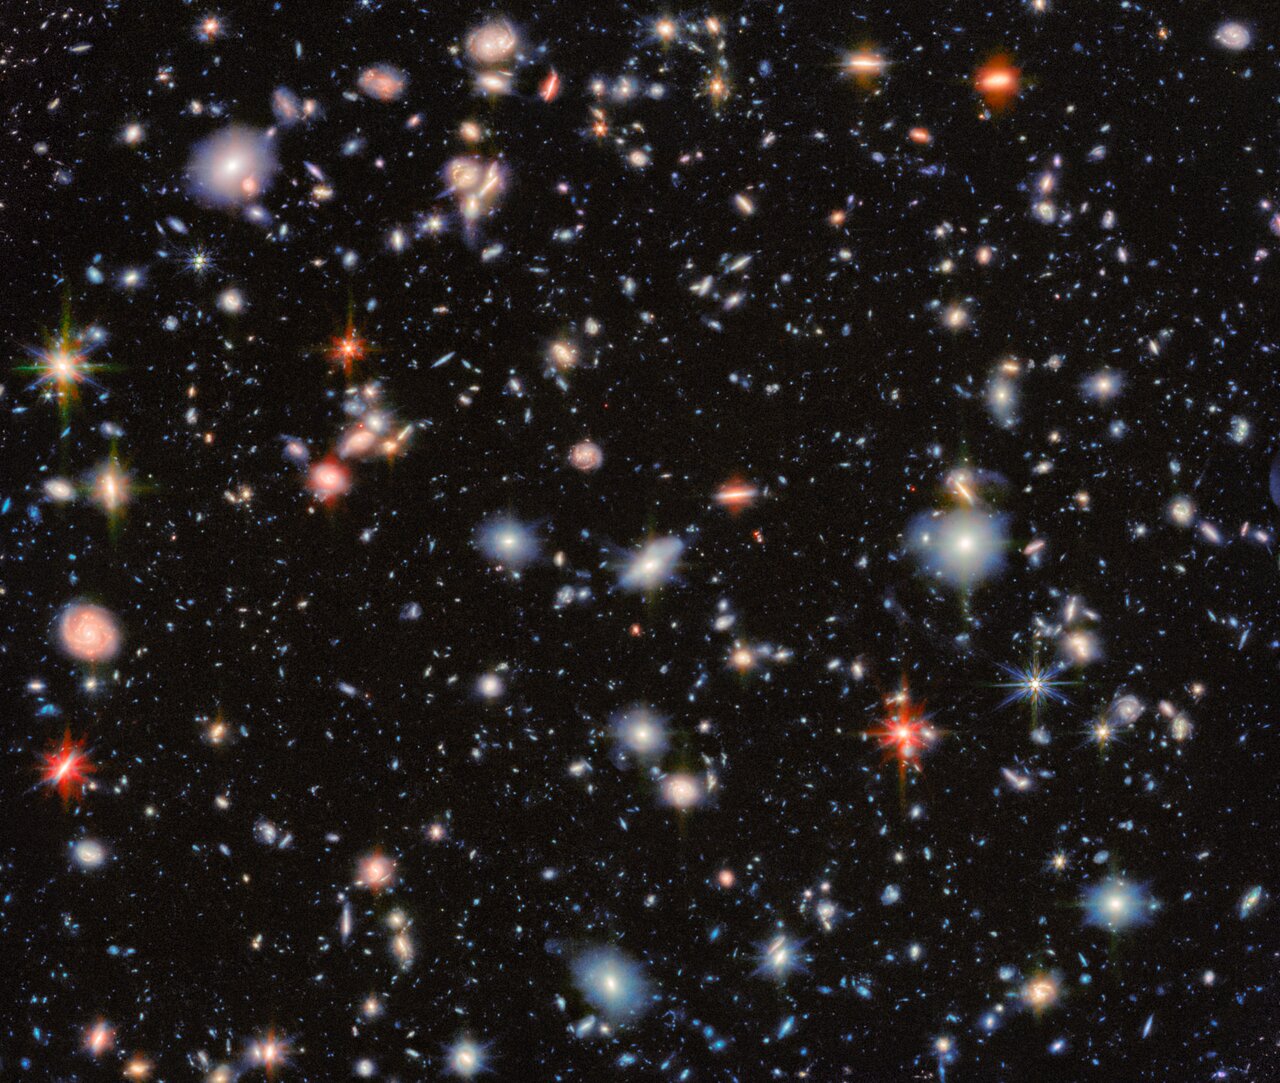
JWST spies thousands of distant galaxies in the classic Hubble Deep Field — many galaxies being uncovered for the first time with the space telescope’s powerful instruments. [ESA/Webb, NASA & CSA, G. Östlin, P. G. Perez-Gonzalez, J. Melinder, the JADES Collaboration, the MIDIS collaboration, M. Zamani (ESA/Webb); CC BY 4.0]

Excess Metals Popping Up

Since its 2021 launch, JWST has given astronomers eyes to peer into the distant past, discovering many galaxies whose light reveals the universe’s early stages of star and galaxy formation. Within the population of newly discovered galaxies are a few with bizarre chemical properties that, upon first pass, seem to be too enriched to exist so early in the universe. These hard-to-reconcile abundances may be a sign of the universe’s first stars. 

Known as Population III (Pop III) stars, the first stars in the universe were born out of giant clouds of pristine gas (hydrogen, helium, and a little lithium) and were able to form at masses hundreds to thousands of times the mass of our Sun. Though they burned bright, they did not burn for very long, ending their lives in violent supernovae and chucking their newly enriched guts back into their surroundings. While these stars are long dead, the chemical imprints they left on their host galaxies can persist  — and understanding how Pop III stars create and distribute metals could clue us in to the odd chemical signatures recently found with JWST.

Too Much Nitrogen in GS 3073

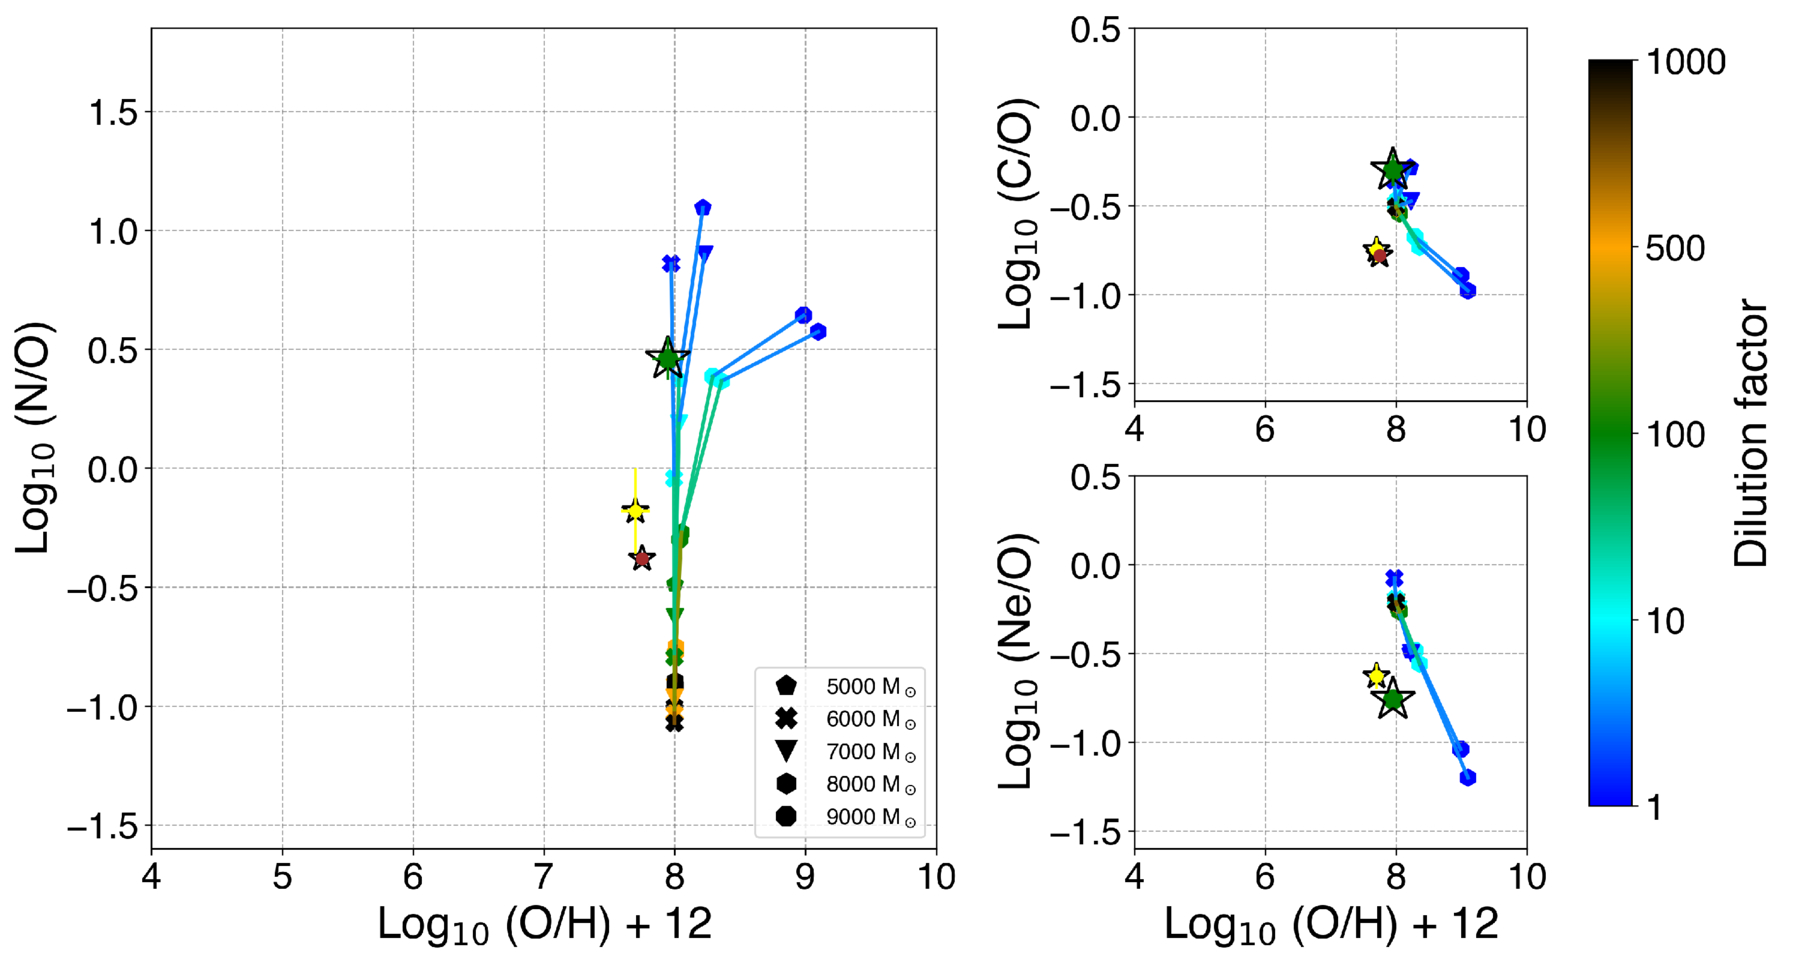
Researchers have identified a few galaxies exhibiting high nitrogen-to-oxygen (N/O) ratios that cannot be explained by stars similar to those in the universe today. A couple of these galaxies could be explained through multiple stellar populations, rapidly rotating stars, massive explosions, or the early stages of globular cluster formation. However, GS 3073, a galaxy with a redshift of z = 5.55 (about one billion years after the Big Bang), has an N/O excess so high that is has, so far, defied explanation.

Aiming to make sense of this bizarre phenomenon, Devesh Nandal (University of Virginia; Center for Astrophysics | Harvard & Smithsonian) and collaborators used stellar evolution models to see if Pop III stars could be the culprit. Modeling stars with masses 1,000–10,000 times the mass of our Sun, the authors traced the elemental yields of these supermassive stars as they go through the various stages of nuclear burning. The analysis takes into account mixing within the stars, mass loss throughout their lifetimes, and how the eventual supernova ejecta mixes within the interstellar medium.

N/O, C/O, and Ne/O abundance ratios of five modeled supermassive Pop III stars taking into account the contribution from other stars in the galaxy and the Pop III star losing 10% of its mass over its lifetime. The green star indicates the observed ratios of GS 3073. Click to enlarge. [Nandal et al 2025]

From this modeling, the authors found that massive Pop III stars between 1,000 and 10,000 solar masses can produce the observed elemental abundances measured for GS 3073. Stars less massive do not produce high enough N/O ratios, and stars more massive have much lower oxygen-to-hydrogen ratios — strongly suggesting upper and lower mass limits to the possible supermassive stars that could have produced GS 3073’s chemical composition.

Finally Evidence of Pop III Stars?

This study of GS 3073 is the first of its kind to confirm the chemical imprints of Pop III stars on their host galaxy at this redshift. The unique nitrogen abundance can only be produced through the evolutionary phases of Pop III stars that burn quickly enough to produce and release an excess amount of nitrogen while other elements stay consistent. From their modeling, the authors suggest that galaxies with even higher nitrogen excess could exist, and further observations with JWST may just find them. 

The search for Pop III stars is booming — another recent study (Visbal et al 2025) examines the galaxy LAP1-B. While GS 3073 shows evidence of Pop III stars through chemical abundances, the study of LAP1-B finds that the galaxy matches theoretical predictions for the formation environments and mass distributions of Pop III stars. Both of these recent research works are laying the groundwork for the wealth of discovery possible with JWST, and the universe’s first stars are no longer out of reach.

Citation

“1000–10,000 M⊙ Primordial Stars Created the Nitrogen Excess in GS 3073 at z = 5.55,” Devesh Nandal et al 2025 ApJL 994 L11. doi:10.3847/2041-8213/ae1a63

The post Too Much Nitrogen Pops Open the Search for the Universe’s First Stars appeared first on AAS Nova.

A Black Hole Family Tree

31 October 2025 at 16:20

A rendering of two dark spheres surrounded by bright, misaligned disks drawing near to one another.

Black holes can have messy family histories, and a recent massive merger challenged astronomers to sort out just how many generations of black holes were involved in the event. Recent research, however, may have untangled the lineages of the two progenitors.

A Massive Collision

Earlier this year, the Laser Interferometer Gravitational-Wave Observatory (LIGO) detected the ripples in spacetime caused by the merger of two black holes somewhere in the distant universe. Though these detections have become increasingly common, this one in particular stood out among the more than 200 reported over the last decade. Named GW231123, this event must have caused more of a splash than a ripple since the two black holes that slammed together were unusually massive; both likely weighed more than 100 times the mass of the Sun. Not only that, each was also spinning unusually rapidly prior to the collision.

A photograph of two perpendicular straight lines that cut through a forest and meet at a complex of buildings in a clearing.

LIGO Livingston, one of the two LIGO detectors. [Caltech/MIT/LIGO Lab]

According to theory, black holes this large are not supposed to form on their own. When massive stars die, they can collapse into a black hole; but, when really massive stars die, the collapse is so violent that no material is left over to form the black hole. So, when researchers first measured the masses of the black holes involved in GW231123, they knew that the black holes involved couldn’t have formed directly from collapsed stars. Instead, they were likely second-generation black holes, meaning that they themselves formed from previous black hole–black hole mergers.

Merger Mystery

This result was celebrated as evidence of so-called “hierarchical formation,” in which black holes formed in dense environments swarm throughout their star clusters, merging with other black holes they encounter and growing ever larger.

However, there were a couple of complications with this picture. For one, theory predicts that it is challenging to form such rapidly spinning black holes from randomly oriented progenitors, since usually the spins wash out and leave the remnant rotating slowly. For another, the merging process tends to give the final black hole a “kick” that sends it flying rapidly away from the site of the impact, occasionally fast enough to leave the star cluster altogether, meaning second-generation black holes might not be able to merge into subsequent generations.

A multi-panel cartoon showing black holes merging through various combinations of 1st, 2nd, and 3rd generation black holes.

A schematic of various potential black hole family trees. The binary-star origin scenario is shown in the green box. Click to enlarge. [Stegmann et al. 2025]

Born as a Pair

New research led by Jakob Stegmann, Max Planck Institute for Astrophysics, suggests a way around each of these problems. In the team’s model, the two black holes involved in the GW231123 merger didn’t form from isolated black holes in a cluster, but rather from binary stars embedded within that cluster. In this picture, two massive stars were born bound together, orbiting one another within a larger cluster of stars. Crucially for this scenario, the massive primordial stars have aligned spins — an expected outcome of massive binary star evolution.

After both stars in the binary collapsed into black holes, these black holes merged to form a rapidly spinning second-generation black hole. This second-generation black hole eventually encountered another black hole within the cluster and merged to produce the ripples in spacetime we observed as GW231123.

Since black holes born within binary systems are expected to have smaller kicks and faster spins, this scenario neatly explains the properties observed in GW231123. As LIGO keeps listening for more black hole mergers, hopefully similar events will provide more chances to untangle their complex family trees.

Citation

“Resolving Black Hole Family Issues Among the Massive Ancestors of Very High-Spin Gravitational-Wave Events like GW231123,” Jakob Stegmann et al 2025 ApJL 992 L226. doi:10.3847/2041-8213/ae0e5f

The post A Black Hole Family Tree appeared first on AAS Nova.

Shortest-Period Polar Cataclysmic Variable Discovered

22 October 2025 at 17:00

cataclysmic variable system

Astronomers have discovered the most compact cataclysmic variable system containing a strongly magnetized white dwarf. The extreme closeness of the system suggests that the companion may be a metal-poor star — the first time such a star has been paired with a strongly magnetized white dwarf.

Meet the Cataclysmic Variable

Cataclysmic variables are binary star systems that contain a white dwarf and a companion star in uncomfortably close quarters. In these systems, the companion star transfers gas to the white dwarf, resulting in sudden, irregular, and often repeated outbursts as the stolen gas ignites on the scorching surface of the white dwarf.

These bound-together stars typically orbit one another on orbits ranging from about 80 minutes to 10 hours. Though theorists place the minimum orbital period around 76 minutes, a handful of cataclysmic variable systems have cropped up with periods below this limit. The systems that have limboed under the limit are thought to have stellar companions that are more compact than typical main-sequence stars, allowing the white dwarf to nestle in closer.

Exploring Below the Limit

Discovered in 2019 by the Gaia spacecraft, Gaia19bxc is a cataclysmic variable that fluctuates with a period of 64.42 minutes. If this variability is linked to the orbital period of the system, that would place it well below the theoretical minimum period. Adding to the intrigue, early observations also hinted that Gaia19bxc’s white dwarf is strongly magnetic, making the system what’s called a polar. In polar systems, the white dwarf’s magnetic field diverts the accreted matter toward the white dwarf’s poles as it is collected, rather than into a disk around the white dwarf’s equator.

Light curves of Gaia19bxc

Phase-folded light curves for Gaia19bxc from the Caltech HIgh-speed Multi-colour camERA (CHIMERA) on the Hale Telescope. The double-peaked light curve is evidence for cyclotron beaming, which occurs in strongly magnetized white dwarfs. [Adapted from Galiullin et al. 2025]

Now, Ilkham Galiullin (Kazan Federal University) and collaborators have analyzed photometry and spectra of Gaia19bxc from the Zwicky Transient Facility, the Hale Telescope, and the Keck I telescope to investigate the nature of this unusual system.

The team’s analysis confirmed that the stars of Gaia19bxc orbit one another every 64.42 minutes, cementing the system’s place below the period minimum for typical cataclysmic variables. The system’s double-peaked light curves and evidence for an accretion stream — rather than an accretion disk — confirm the system’s polar nature, implying a magnetic field strength greater than 10 million Gauss. This makes Gaia19bxc the most closely orbiting system to contain a strongly magnetized white dwarf.

A Sign of Discoveries to Come

histogram of cataclysmic variable orbital periods

Gaia19bxc’s orbital period compared to known polar cataclysmic variables (gray) as well as the theorized minimum periods for systems containing a metal-poor (Pop II) companion (cyan) and an evolved companion (blue). [Galiullin et al. 2025]

These observations illuminate the nature of the white dwarf — but what about the companion star?

Galiullin and coauthors saw no evidence for metal lines in Gaia19bxc’s spectrum, nor did they see spectral features arising from a hot companion star. These findings suggest that the companion is an old, cool, compact, metal-poor star, which would make Gaia19bxc the first known polar to contain a metal-poor star. It’s also one of only a handful of cataclysmic variables to contain a metal-poor star and be below the theoretical period minimum.

Though Gaia19bxc is currently in a class of its own, it may not be for long; with the start of the Vera C. Rubin Observatory’s Legacy Survey of Space and Time rapidly approaching, many more cataclysmic variable systems as faint as or fainter than Gaia19bxc may soon be discovered.

Citation

“Optical Spectroscopy of the Most Compact Accreting Binary Harboring a Magnetic White Dwarf and a Hydrogen-Rich Donor,” Ilkham Galiullin et al 2025 ApJL 990 L57. doi:10.3847/2041-8213/adff82

The post Shortest-Period Polar Cataclysmic Variable Discovered appeared first on AAS Nova.

Kickin’ It into Overdrive with Stellar Escapees

13 October 2025 at 17:00

Illustration of a binary system containing two white dwarfs

Editor’s Note: Astrobites is a graduate-student-run organization that digests astrophysical literature for undergraduate students. As part of the partnership between the AAS and astrobites, we occasionally repost astrobites content here at AAS Nova. We hope you enjoy this post from astrobites; the original can be viewed at astrobites.org.

Title: The Evolution of Hypervelocity Supernova Survivors and the Outcomes of Interacting Double White Dwarf Binaries
Author: Ken J. Shen
Author’s Institution: University of California, Berkeley
Status: Published in ApJ

Even stars get kicked around sometimes. When a white dwarf — a dense stellar corpse that’s run out of its nuclear fuel — gets pushed past its limit, the result is a spectacular thermonuclear explosion called a Type Ia supernova. Two stars are needed to trigger a Type Ia supernova explosion. In a binary system that gives rise to a Type Ia supernova, the more massive star, called the primary, steals mass from the less massive companion star. As the primary gains mass, it undergoes a runaway thermonuclear reaction and explodes. Despite the violent nature of the blast, it doesn’t always destroy everything in sight. While the primary star is obliterated, the companion star might survive the explosion by being launched, or “kicked,” into space at incredibly high speeds.

A few of these hyper-velocity survivors have been detected in surveys, particularly from the Gaia mission. Understanding how these stars survived a supernova provides important clues about how a supernova forms and explodes in the first place.

The D6 Model: (Double the Trouble) + (Double the Double the Trouble)

In today’s post, we explore the “dynamically driven double-degenerate double-detonation” model, fortunately shortened to the D6 model. (Try to say that ten times fast!) The D6 model describes a binary star system of two white dwarfs, each of which is generally composed of an even mix of carbon and oxygen. (Sometimes white dwarfs composed of helium or a mix of oxygen and neon are also possible.) As the white dwarfs spiral toward each other, the more massive primary star steals material, often helium, from the less massive companion star’s outer shell. If this mass transfer is violent enough, it can trigger a detonation within the helium shell of the primary star. This detonation then triggers an explosion deep within the core of the primary star, causing a supernova.

For a Type Ia supernova, it takes two stars to tango. What happens to the secondary (donor) star? One theory suggests that it can be blasted away from the scene of the crime at speeds ranging from approximately 1,000 to 3,000 km/s, becoming a so-called hyper-velocity star. Of these observed “survivors,” the hottest of the bunch have been theorized to be heated by the supernova explosion itself. But some of these survivors have been cooler (in temperature). If these companion stars were in the vicinity of the blast, how could they not be heated by the explosion? What can their temperature tell us about their origin?

Defining the Model

To explore the origins of these cool hyper-velocity stars, today’s author used the stellar evolution code MESA to model the evolution of different types of white dwarf companion stars after (presumably) surviving a Type Ia supernova. A key focus was on the Kelvin–Helmholtz mechanism, which is the process by which a star cools and therefore contracts over long periods as it radiates away its internal heat.

Because white dwarfs come in many flavors, they explored a range of possible elemental compositions for the companion white dwarf: helium-rich (He-rich), carbon/oxygen-rich (C/O-rich), and oxygen/neon-rich (O/Ne-rich).

One important detail of these models is that the stars were assumed to be fully convective, which is a common property of low-mass stars with masses less than around 0.4 M☉. (You can think of a fully convective star almost like a massive lava lamp where the heat source is at the center of the sphere.) Extensive mass loss can cause a more massive non-convective star to become less massive and convective, which in turn makes it susceptible to cooling quickly and avoiding a fiery death as a supernova. (Hotter gas rises to the surface, where the particles lose kinetic energy by doing work, gradually slowing down and cooling off.) This is key if we want to produce cool, fast-moving stars.

Detonate First, Simulate Later

For helium-rich survivors, the simulations suggest that if the companion star loses enough mass either before or during the explosion, the star’s natural Kelvin–Helmholtz evolution can potentially explain why we observe some cool hyper-velocity survivors. In the case of a star called D6-2, the simulations reproduced its low temperature and luminosity, assuming that it began its life as a helium white dwarf that was shredded but not entirely destroyed. This produces a tiny, convective, hyper-velocity supernova survivor.

D6-2 is an interesting object, however, because it has a fairly low velocity for a potential hyper-velocity survivor. Its velocity is estimated to be about 1,050 km/s, which simulations suggest should be higher based on its estimated mass. It’s likely that either the simulations and models need refining or D6-2 had an altogether different origin.

What About the Others?

So far, we’ve mainly talked about He-rich stars, but what about those C/O-rich ones? These stars would likely appear cooler and redder since they evolve at a nearly constant temperature before moving onto the standard white-dwarf cooling track. (This is called the Hayashi track.)

Red objects are harder for telescopes to detect and often get mistaken for other stars or objects, partially due to a pesky phenomenon called dust extinction, or interstellar reddening. To expand the search for these hyper-velocity candidates, surveys like Gaia might benefit by expanding their search limits to include redder stars, although this opens up the possibility of increasing the number of false positives.

A different class of fast-moving, faint stars — like LP 40-365 — could be related to this population. They are theorized to be remnants of white dwarfs around 1.4 M☉ that only partially exploded. Low-mass, O/Ne-rich survivors might match the observed temperatures and luminosities of LP 40-365, but the ages don’t line up as well as one might hope. (More work will be needed to figure out this particular puzzle.)

The Odds of Stellar Survival

Based on these simulations, it’s estimated that about 2% of Type Ia supernovae might leave behind a He-rich hypervelocity star like D6-2 (see Fig. 1). If we consider C/O-rich survivors (like D6-2’s cousins D6-1 and D6-3), the rate drops to about 0.2%, which is intriguingly close to the estimated rate of SN 2003fg-like events: unusually bright, slowly evolving Type Ia supernovae that often display tell-tale signs of unburned carbon and oxygen in their spectra.

A histogram of detectable hypervelocity survivors from the He-rich track

Figure 1: A histogram of detectable hyper-velocity survivors from the He-rich track assuming every Type Ia supernova produces a companion with a mass of 0.02 solar mass. These survivors are assumed to be ejected from their Type Ia supernovae at a velocity of 1,050 km/s, matching D6-2. The x-axis, tmidplane, describes the apparent travel time from the midplane of the simulation’s galaxy. A negative value means the survivor was observed before it passed through the plane. A total count of 43 hyper-velocity survivors from every Type Ia supernova yields an estimated survival rate of about 2%. [Shen 2025]

The presence of these hyper-velocity survivors might be linked to rare types of supernovae, which would provide an interesting way to look into the origins of these oddball events.

Choose Your Own (Stellar) Adventure

This article suggests different evolutionary paths for how binary white dwarfs might evolve. Depending on the properties of the merger, the system might do any of the following:

  1. Trigger nuclear reactions within the outer shell of the primary without detonating the primary’s core
  2. Become a normal Type Ia supernova
  3. Leave behind a hyper-velocity remnant
  4. Become a SN 2002es-like supernova, which is a fainter type of Type Ia supernova

There are lots of potential outcomes for these types of binaries, and hyper-velocity survivors indicate just a tiny fraction of a particular configuration of binary white dwarfs (see Fig. 2).

diagram of the speculative outcomes for a white dwarf–white dwarf binary

Figure 2: A diagram of the speculative outcomes for a white dwarf–white dwarf binary. The y-axis shows the secondary’s initial mass, whereas the x-axis shows the primary’s initial mass. The dashed lines indicate where the combined white dwarf mass is 1.4 M☉. The plot illustrates the wide variety of outcomes of white dwarf–white dwarf binaries, of which hyper-velocity survivors (HVS) are rare. sdB/sdO = subdwarf B/O stars; R CrB = R Coronae Borealis, variable star; Fe CC = iron core-collapse supernovae; HVS = hyper-velocity survivor; NS = neutron star. [Shen 2025]

These stellar survivors are rare and fast. Cooler hyper-velocity survivors, in particular, are fascinating because they may originate from white-dwarf binaries with unusual properties. Studying these fast-moving stars helps piece together our understanding of Type Ia supernovae as a whole. With improved surveys and simulations, we may discover more about these elusive escapees.

Original astrobite edited by Chloe Klare.

About the author, Mckenzie Ferrari:

I’m currently a PhD grad student in the Geophysical Sciences program at the University of Chicago. While I now study the atmosphere and oceans of Earth, most of my previous undergrad and grad research focused on simulations of Type Ia supernovae and galaxy formation and evolution. In my free time, I foster cats for a local organization, enjoy cooking, and can often be found running along Lake Michigan.

The post Kickin’ It into Overdrive with Stellar Escapees appeared first on AAS Nova.

Kicking Neutron Stars from the Nest

24 September 2025 at 17:00

A blue/white star with lines representing magnetic fields sprouting from the poles against a black background.

Neutron stars don’t stick around for long after they’re born. Recent research has now uncovered just how fast they flee.

They Grow Up So Fast

Human beings require many years of care and support from their parents before they’re able to venture forth into the world. This is an embarrassingly long process compared to the standard for animals like deer and horses, whose offspring are ready to walk mere minutes after birth. However, baby neutron stars, some of the densest objects in the known universe, put all life on Earth to shame with their immediate self-reliance: after a fiery birth from a supernova explosion, these stars flee the site of their creation at hundreds of kilometers per second.

Crab Nebula supernova remnant

Hubble Space Telescope and Herschel Space Observatory image of the Crab Nebula, which is the remnant of a supernova explosion. [ESA/Herschel/PACS/MESS Key Programme Supernova Remnant Team; NASA, ESA and Allison Loll/Jeff Hester (Arizona State University)]

These “natal kicks,” as they’re called in research literature and in recent work by Paul Disberg and Ilya Mandel (Monash University and OzGrav) are a natural consequence of neutron star formation. When a massive star burns through the last of its fuel and surrenders to its own gravity, it collapses inward and compresses its core into a neutron star before rebounding in an explosion. This collapse is never perfectly symmetric, however, and the slight imbalance gives the resulting neutron star a shove.

By measuring the characteristic speeds of these “kicks,” astronomers can deduce how asymmetric the preceding collapse must have been, along with other information about the earliest moments of the supernova. Though measuring the speed of something so small from the other side of the galaxy is no easy task, Disberg and Mandel’s recent publication in The Astrophysical Journal Letters takes on the challenge.

Quantifying the Kicks

The pair first began by examining measurements of neutron stars known to be less than 10 million years old, which is extremely young in an astronomical context. Since these objects haven’t had time to be slowed down or altered from their course by passing stars or the galactic tide, their present-day speeds should be the same as their natal kicks. The researchers found that while every neutron star had its own unique kick velocity, the distribution of all the velocities followed a log-normal pattern with a peak near 150–200 km/s.

Measured kick velocities and fit distributions

Measured kick velocities (histograms) and fit distributions (curves) for different subsamples. Click to enlarge. [Disberg & Mandel 2025]

Next, Disberg and Mandel examined the distribution of velocities from older neutron stars. These, which had to be measured via a different method, turned out to be very similar to the distribution assigned to the younger stars. Finally, they re-examined previous studies that attempted their own models of the kick distribution. Though several of these studies conflicted with one another, the team found that these discrepancies could be explained by different sample sizes and mistaken statistical interpretations. On the whole, the team’s distribution fit all the available data well and the most succinctly of any alternative framework.

Going forward, other astronomers focused on modeling supernovae, orbits within the galaxy, and binary-star evolution can use this distribution either to sanity check their models or as inputs to other simulations. Through slow accumulation of studies like this, each with its own quantified measurement of some property in the galaxy, we come to understand our universe more fully and unlock our ability to make ever more models and predictions.

Citation

“The Kick Velocity Distribution of Isolated Neutron Stars,” Paul Disberg and Ilya Mandel 2025 ApJL 989 L8. doi:10.3847/2041-8213/adf286

The post Kicking Neutron Stars from the Nest appeared first on AAS Nova.
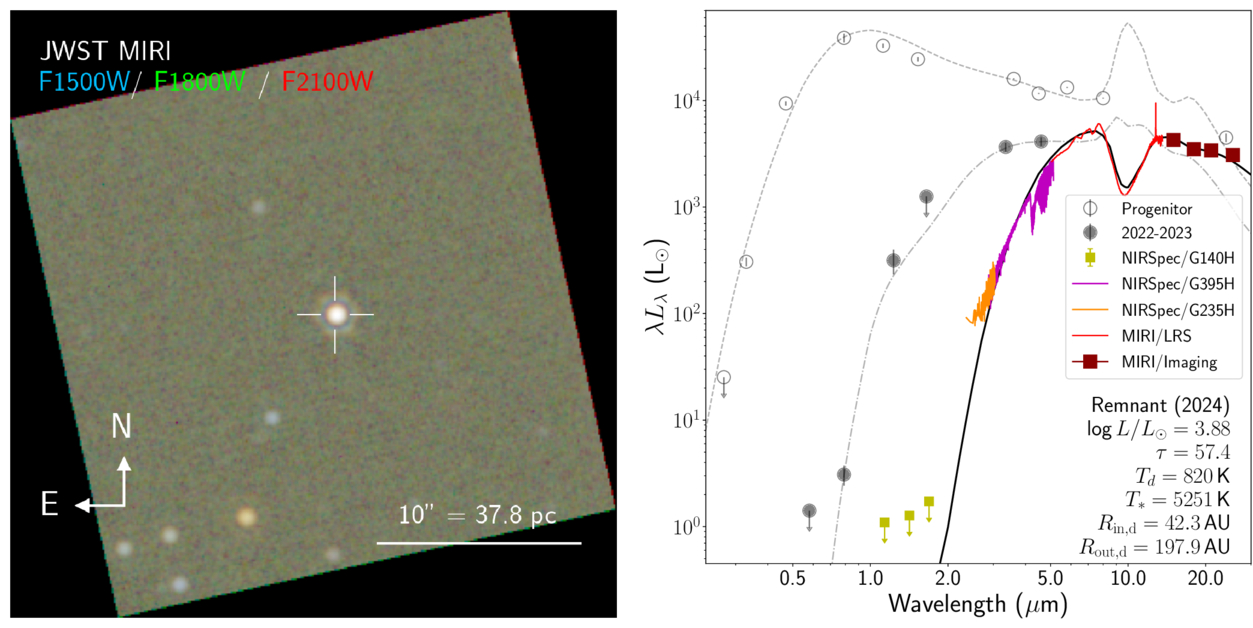
Get a Kick Out of This: Researchers Waited 15 Years to Measure a Neutron Star’s Journey

1 August 2025 at 17:00

Crab Nebula

With a measurement 15 years in the making, astronomers have pinned down the path of a neutron star launched by a collapsing star. This finding helps to explain how neutron stars are “kicked” into space by supernovae.

Just for Kicks

Crab Nebula pulsar

This multiwavelength image shows the pulsar — a type of neutron star — at the center of the Crab Nebula supernova remnant. [X-ray: NASA/CXC/SAO; Optical: NASA/STScI; Infrared: NASA-JPL-Caltech]

When massive stars reach the end of their lives, they expire in a final, fantastic cosmic display: a core-collapse supernova. These events can leave behind remnants called neutron stars, which are composed of highly compressed neutrons arranged in a sphere roughly as wide as the island of Manhattan is long.

Many neutron stars have been observed to zip through space at hundreds of kilometers per second, which suggests that these stars get a “kick” when they’re born in a supernova. However, the details of this kick are not yet clear. Are neutron stars launched into space in the opposite direction from the material ejected in the explosion, as some studies suggest? Or is the neutron star’s motion determined by the burst of neutrinos that carries off most of the supernova’s energy, as other studies hint?

Worth the Wait

To answer these questions, astronomers must compare the velocities of young neutron stars to the movement of their associated supernova remnants. In a recent research article, Tyler Holland-Ashford (NASA Goddard Space Flight Center) and collaborators measured the motion of the neutron star affiliated with the G18.9–1.1 supernova remnant, using Chandra observations made 15 years apart in September 2009 and July 2024.

Chandra images of the field containing the neutron star

Chandra images from 2009 (left) and 2024 (right; this image is the merged product of two observations). The neutron star is shown in black. Blue and red sources were used for astrometric correction. The red sources were present in both observations. Click to enlarge. [Holland-Ashford et al. 2025]

Making this measurement is trickier than it sounds, requiring more finesse than simply charting the location of the neutron star at different times. Holland-Ashford’s team used measurements from the ultra-precise star-mapping Gaia spacecraft to account for the proper motions of other sources in the images and to put the observations from the two time periods into the same frame of reference. After these adjustments, they measured the proper motion of the neutron star to be 24.7 milliarcseconds per year.

Because the distance to the supernova remnant is uncertain, this proper motion could correspond to a range of transverse velocities. For distance estimates of 6,800 and 12,400 light-years, this puts the neutron star’s transverse velocity at 264 or 474 km/s, respectively.

A Distinct Offset

supernova remnant and neutron star location

Current location of the neutron star (purple) compared to the geometric center of the supernova remnant (red) and the center of its X-ray emission (green). Even assuming the oldest reasonable age for the supernova remnant, there is a distinct offset between the neutron star’s birthplace and the center of the remnant. Click to enlarge. [Holland-Ashford et al. 2025]

What does this velocity tell us about the kick this neutron star received at birth? To probe the origin of the kick, the team first used the neutron star’s measured velocity and the likely age of the supernova remnant to trace the neutron star’s trajectory back to its birth site. This showed that the neutron star’s birthplace is offset from the center of the supernova remnant by several arcseconds, though both locations fall along the trajectory set by the neutron star’s motion. This suggests that the ejected stellar material and the newborn material were kicked in opposite directions by the supernova, most likely by a theorized “conservation-of-momentum-like” process.

Currently, Chandra is the only X-ray observatory with fine enough resolution to make the kind of measurement needed in this study. Luckily, Chandra’s observations of neutron stars stretch back to 1999, and combining this wealth of data with sensitive measurements from future high-resolution X-ray instruments should provide the long time baselines needed to trace the trajectories of more neutron stars and further explore the origins of neutron star kicks.

Citation

“Proper Motion of the Neutron Star in the Supernova Remnant G18.9–1.1,” Tyler Holland-Ashford et al 2025 ApJ 988 218. doi:10.3847/1538-4357/adeb7e

The post Get a Kick Out of This: Researchers Waited 15 Years to Measure a Neutron Star’s Journey appeared first on AAS Nova.
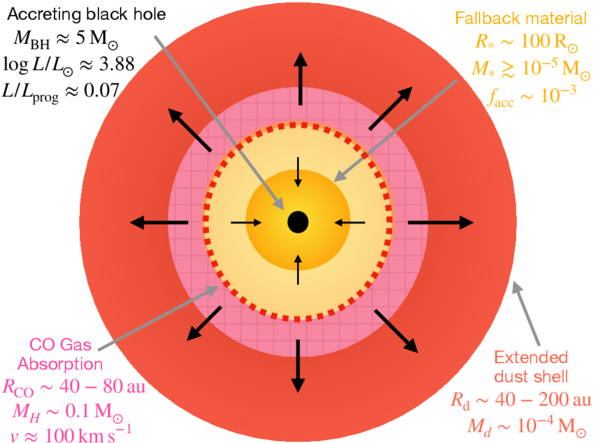
❌