❌

Normal view

Mangrove Forests Face Existential Threat as Rising Seas Challenge Nature’s Carbon Guardians

6 June 2026 at 21:01
Mangrove Forests Face Existential Threat as Rising Seas Challenge Nature’s Carbon Guardians

For tens of millions of years, mangrove forests have stood as nature’s ultimate survivors, thriving where land meets sea in some of Earth’s harshest conditions. These remarkable trees have mastered the art of living in saltwater, creating vast coastal ecosystems that serve as powerful weapons against climate change by storing enormous amounts of carbon in their roots, trunks, and surrounding soil.

Beyond their role as carbon storage champions, mangroves form living shields that protect millions of people from storm surges and coastal flooding. Their intricate root systems act as natural breakwaters, absorbing wave energy and preventing erosion that could devastate coastal communities. These forests also support incredible biodiversity, serving as nurseries for countless fish species and providing habitat for birds, reptiles, and marine life.

However, new research reveals a troubling paradox: while mangroves are among our most effective natural allies in fighting climate change, they may not be able to withstand the very problem they help solve. Rising sea levels driven by global warming threaten to push even these resilient ecosystems beyond their survival threshold. The modeling study suggests that the rate of sea level rise may soon outpace the mangroves’ ability to adapt, potentially triggering a devastating feedback loop where the loss of these forests releases stored carbon back into the atmosphere.

This threat represents more than just the loss of trees—it signals the potential collapse of a critical natural infrastructure that protects both climate stability and human communities worldwide.

The post Mangrove Forests Face Existential Threat as Rising Seas Challenge Nature’s Carbon Guardians first appeared on EnviroLink Network.

Now That’s Metal: How to Spot Stars That Have Swallowed Their Planets

3 June 2026 at 17:00

An illustration of an exoplanet about to be engulfed by its host star

Planets that get too close to their host stars are liable to be engulfed and consumed. New research explores how to identify stars that have had a planetary snack.

It’s Snack Time

Being a planet that closely orbits its star is dangerous, and various dynamical processes can draw a planet inward past the point of no return. When a planet vanishes beneath the surface of its host, it eventually disintegrates within the star, its atoms mixing into the blazing stellar soup.

This outcome is likely extremely common across the universe, and researchers have begun to see evidence for it: stars that appear to have absorbed angular momentum from their planets, white dwarfs with uncanny metals in their spectra, and stars with chemical abundances that don’t match those of their siblings. Now, in a recent publication led by Kaitlyn Lane (Vanderbilt University), researchers seek to find observational signatures of planetary engulfment of rocky exoplanets by main-sequence stars.

Modeling Engulfment

Lane’s team focused on main-sequence stars in the range of 0.5 to 1.4 solar masses, using one-dimensional analytical models to determine which of these stars will most readily display signs of having engulfed a planet. They simulated the stars as they consumed either an Earth-like planet or a super-Earth with the same composition as Earth but 15 times its mass.

illustration of a planet being engulfed by its star

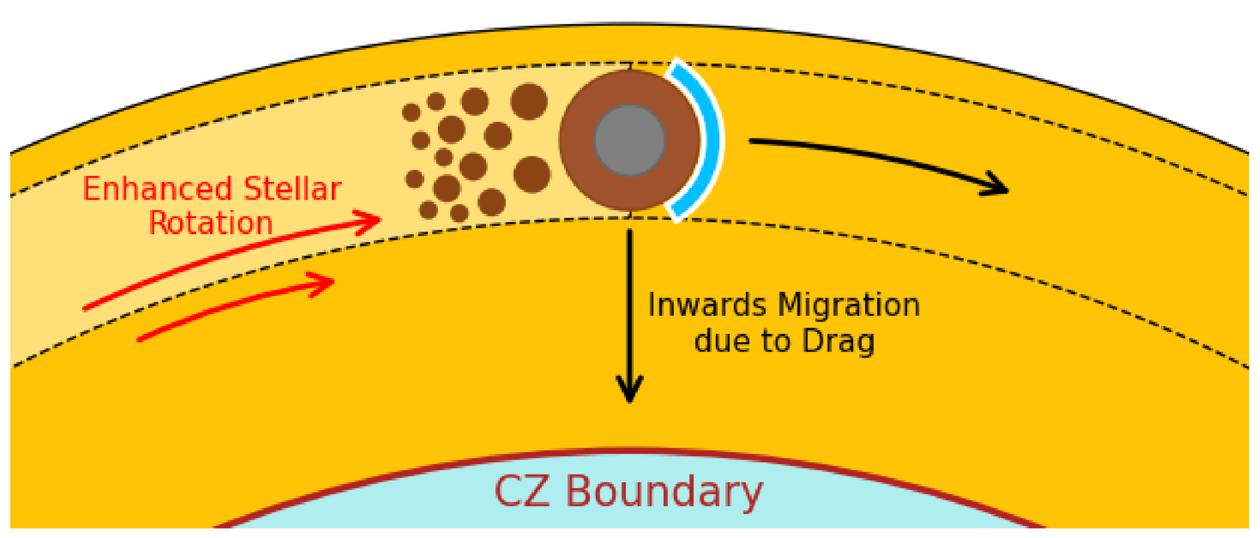
Diagram showing a planet being engulfed by its star and beginning to disintegrate before migrating inward. The boundary between the star’s outer convective zone (CZ) and inner radiative zone is shown. Click to enlarge. [Lane et al. 2026]

At the onset of the model, the engulfment is set to begin, the planet placed tangent to the star’s surface. The planets sink down and orbit just barely within their stars for 1–10 years, their solid surfaces slowly beginning to evaporate.

After that relatively lengthy phase, the process proceeds rapidly: as the planet inches deeper into its star, the drag forces grow stronger and the planet’s demise accelerates, with the planet disintegrating over the course of hours. In the last phase, the planet makes its final plunge and is destroyed in a half hour.

Signs of Planets Past

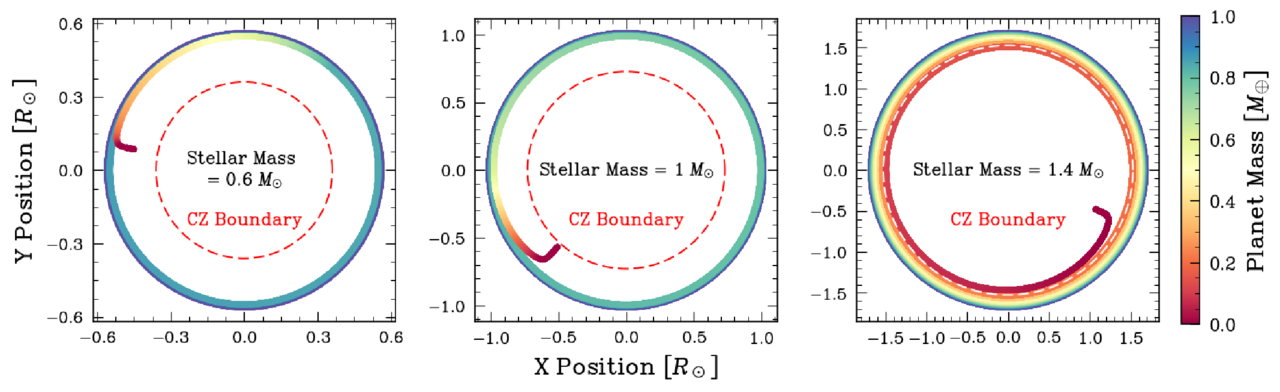
Lane’s team found that the planets tended to be destroyed fully within the outer convective layer of their stars, except in the case of the most massive stars studied here. For more massive stars, the outer convective zone is shallower than it is for the less massive stars, allowing a chunk of each planet to survive the passage through the convective zone to reach the radiative zone below.

simulation results showing planets disintegrating within their host stars

The trajectories of three example cases, showing how the planet loses mass as it spirals inward. In the 1.4-solar-mass case, part of the planet survives to reach the radiative zone, but the shallowness of the star’s convective zone means that the disintegrated planetary material is easier to observe. Click to enlarge. [Lane et al. 2026]

What this translates to, for the purposes of identifying planet-eating stars from afar, is that stars near the top of the mass range studied — from 1.0 to 1.4 solar masses — make the best targets. This is because the tell-tale planetary metals are not overly diluted within the stars’ relatively small convective zones, making these elements easier to detect. In terms of specific metals, the authors found that aluminum, calcium, and vanadium are the best signposts of planetary engulfment, with lithium also making the list.

While the authors acknowledge that there’s more work to be done — they plan to investigate the impacts of planetary engulfment on stellar structure more closely, for example — this work represents an important foray into identifying targets for future studies of stars that have eaten their planets.

Citation

“Observable Metal Pollution in Main-Sequence Stars: Simulations of Rocky Planets Engulfed by Stars in the 0.5 to 1.4 M⊙ Range,” Kaitlyn T. Lane et al 2026 ApJ 1003 67. doi:10.3847/1538-4357/ae5b9a

The post Now That’s Metal: How to Spot Stars That Have Swallowed Their Planets appeared first on AAS Nova.

Characterizing the Atmosphere of Exoplanet WD 0806b with JWST

3 April 2026 at 17:00

gas giant orbiting white dwarf

Orbiting a white dwarf, the exoplanet WD 0806b is the subject of a recent study using JWST to measure the atmospheric conditions governing the planet.

Directly Imaged Exoplanet WD 0806b

Most of the 6,000 and counting exoplanets discovered thus far have been detected due to their impacts on their host star — passing in front of the star and causing it to dim, or gravitationally tugging on the star and causing it to wobble. On rare occasions, though, astronomers have been able to catch the exoplanet itself through direct imaging. Directly imaged exoplanets offer key insights that cannot be obtained through indirect detection methods. Luminosity measurements and spectral emission features allow astronomers to more directly measure planet mass, radius, and composition otherwise inferred from the host star.

WD 0806b system

NIRCam image showing host star WD 0806 circled in orange and the location of exoplanet WD 0806b marked by the orange arrow. [Lew et al 2026]

Included in the about 90 distant planets that have posed for a picture is WD 0806b, a rare exoplanet companion trotting around a white dwarf at an orbital distance of 2,500 au (50 times the distance from the Sun to the Kuiper belt!). Originally discovered with the Spitzer Infrared Array Camera in 2011, WD 0806b is the second-coldest directly imaged exoplanet to date. With JWST’s high-precision photometric and spectroscopic capabilities, WD 0806b provides a unique opportunity to probe the atmospheric chemistry of cold giant planets and take steps toward understanding the co-evolution of white dwarfs and their surviving exoplanets.

WD 0806b’s Atmospheric Abundances from JWST

Aiming to characterize the physical properties and atmospheric composition of WD 0806b, Ben W.P. Lew (Bay Area Environmental Research Institute; NASA Ames Research Center) and collaborators used JWST’s Near-Infrared Camera (NIRCam) and Near-Infrared Spectrograph (NIRSpec) to obtain high-resolution imaging and spectroscopy of the exoplanet. Combining these observations, prior lower-resolution observations, and evolutionary planet models, the authors estimated the physical properties of WD 0806b including mass, radius, surface gravity, and effective temperature.

WD 0806b spectrum

NIRSpec spectrum of WD 0806b with best-fit model spectra overlaid. [Lew et al 2026]

From the derived physical properties, the authors modeled the NIRSpec spectrum to estimate molecular abundances and elemental abundance ratios in the atmosphere of WD 0806b. They obtained measurements of multiple molecules including carbon dioxide, carbon monoxide, and ammonia; these molecular abundances offer the opportunity to test chemical equilibrium and disequilibrium as well as eddy diffusion, or bulk mixing, in the planet’s atmosphere. The authors developed a novel chemical analysis framework to determine how bulk mixing varies with altitude in WD 0806b and reported the first observational evidence that mixing becomes weaker at higher altitudes in exoplanet atmospheres. This result points to the need for future studies exploring the impact of these chemical processes on spectra and photometry, which are essential to characterizing cold giant planets.

This study highlights how high-precision JWST data can reveal a rich collection of atmospheric conditions, chemical composition, and physical processes occurring in cold giant planets. With such a wide orbit from its host white dwarf, WD 0806b serves as an interesting case study for how giant planet composition may reflect the formation and evolutionary history of the overall system. Future observations of and comparisons to similarly cold giant planets will further uncover how atmospheric characterization may fit into our understanding of exoplanets and their histories.

Citation

“JWST Spectral Retrieval of Cold Directly Imaged Planet WD 0806b and the First Measurement of Altitude-dependent Kzz in Exoplanet Atmospheres,” Ben W.P. Lew et al 2026 AJ 171 227. doi:10.3847/1538-3881/ae4747

The post Characterizing the Atmosphere of Exoplanet WD 0806b with JWST appeared first on AAS Nova.

Details on Dinkinesh and Its Surprise Satellite from the Lucy Mission

20 March 2026 at 16:00

Dinkinesh and Selam

The Lucy spacecraft, en route to its primary mission targets, zipped past the main-belt asteroid Dinkinesh and revealed its tiny satellite, Selam. New research examines the surfaces and histories of these small rocky worlds.

A Stop Along the Way

In 2021, the Lucy spacecraft embarked on a 12-year mission to study several Jupiter trojan asteroids, which share Jupiter’s orbit. The spacecraft won’t have its first encounter with a Jupiter trojan until 2027, but it hasn’t been idle during its long journey. In November 2023, Lucy performed a dress rehearsal of its trojan-encounter maneuvers during a flyby of a 738-meter-wide main-belt asteroid called (152830) Dinkinesh.

Dinkinesh and Selam

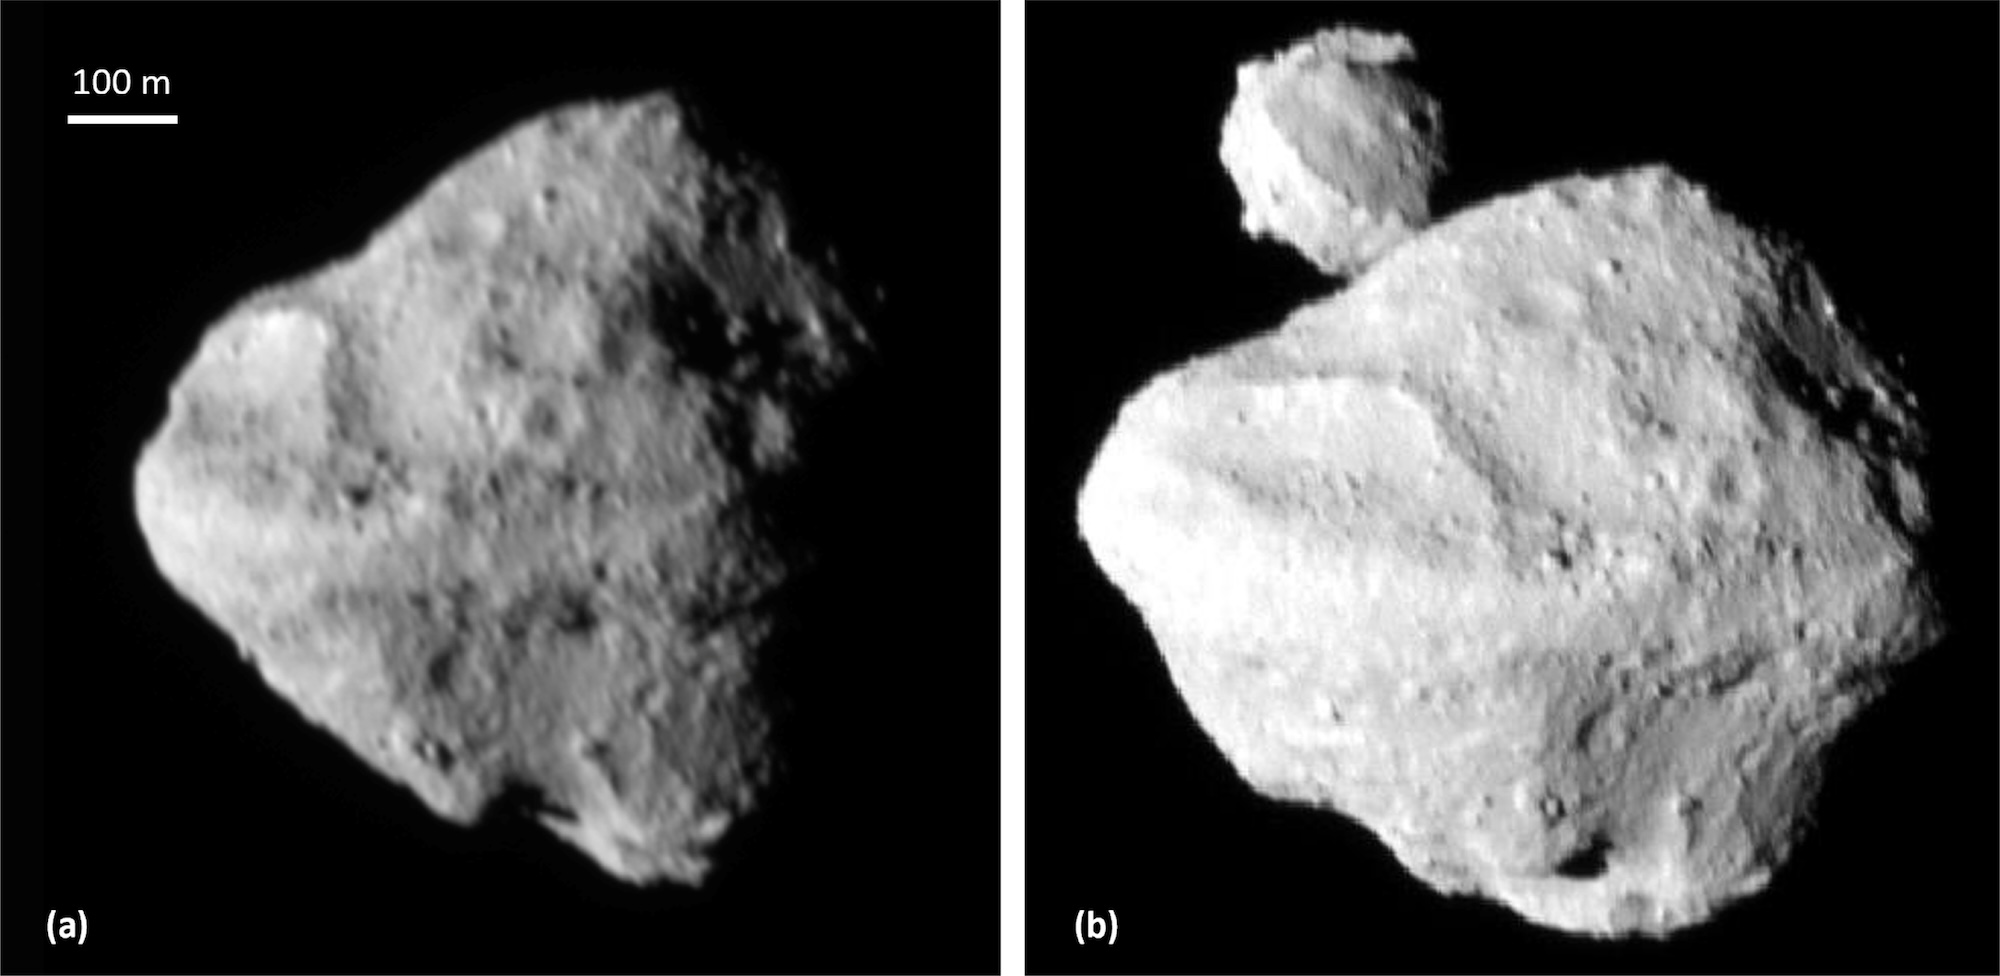
Two images of Dinkinesh from the Lucy mission. The second image features its satellite, Selam. [Bierhaus et al. 2025]

During this flyby, Lucy flew within 430 km (267 mi) of the asteroid and made a surprise discovery: Dinkinesh has a tiny companion, which has been named Selam. (The name Dinkinesh comes from the Amharic name for the Lucy fossil discovered in 1974; Selam is similarly named after a hominid fossil that is sometimes called “Lucy’s baby.”) Remarkably, Selam is the first known asteroid satellite that is a contact binary, made up of two separate bodies that have gently merged into one.

Craters and Boulders

In a recent research article, Edward Bierhaus (Lockheed Martin Space) and collaborators analyzed Lucy flyby images to study the surfaces of Dinkinesh and Selam. The team analyzed global features like troughs and ridges and measured visible craters and boulders.

craters on Dinkinesh and Selam

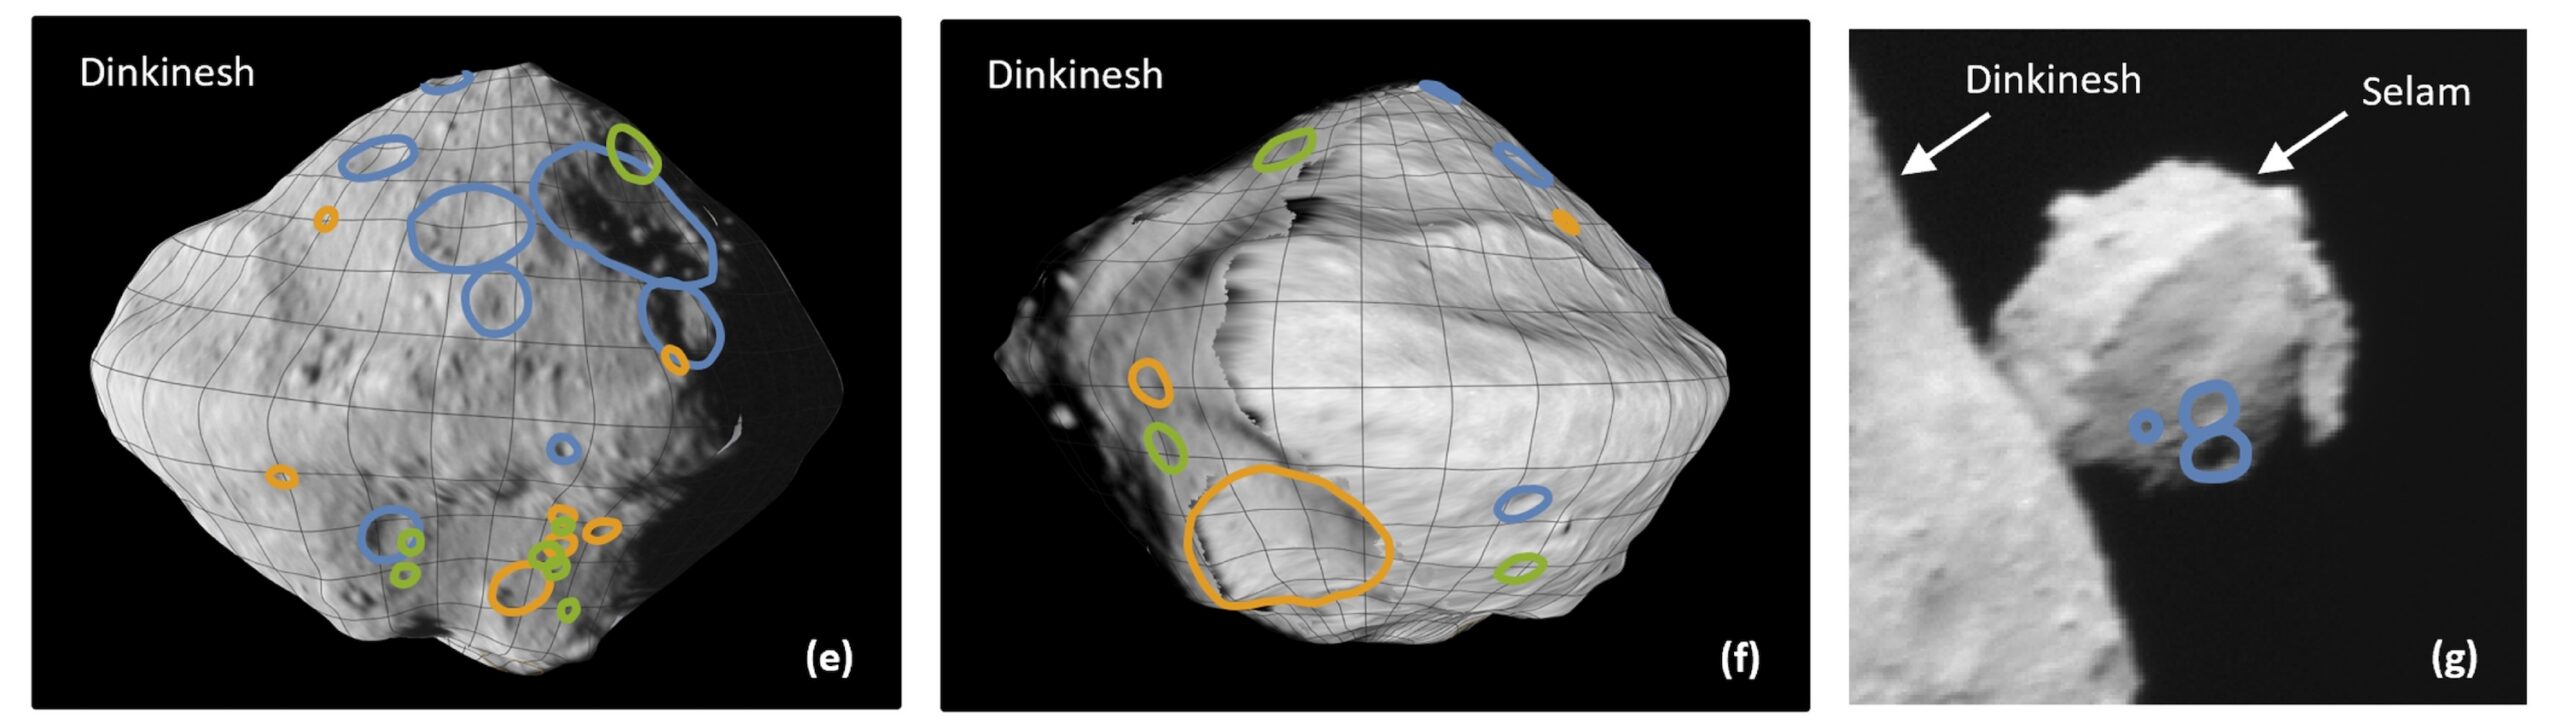
Locations of craters on Dinkinesh and Selam. The blue lines indicate the most confidently identified craters; orange and green lines mark craters identified less confidently. Click to enlarge. [Bierhaus et al. 2025]

While the small numbers of craters detected — 29 for Dinkinesh and 3 for Selam — makes further analysis difficult, the team determined that Dinkinesh’s crater size–frequency distribution is shallower than expected, though similar to that of small near-Earth asteroids (e.g., Ryugu). The seemingly shallow distribution may be an effect of the phase angle and resolution of the observations, or it could be a sign of impact armoring or other surface processes.

The size–frequency distribution of Dinkinesh’s boulders, on the other hand, is somewhat steeper. This discovery may mean that S-type (stony) asteroids like Dinkinesh have different boulder size distributions than C-type (carbonaceous) asteroids.

Possible Histories

An analysis of the collisional timescales in the main asteroid belt suggests that Dinkinesh is a fragment of a larger asteroid that was split apart at least once, though it’s not yet possible to say which parent body it might have come from. After splitting off from its parent asteroid, Dinkinesh appears to have been subjected to the Yarkovsky–O’Keefe–Radzievskii–Paddack (YORP) effect. This effect arises when sunlight falls on a small asymmetric asteroid, creating a torque that can alter its spin rate. In extreme cases, the YORP effect can crank up an asteroid’s spin rate so much that it sheds some of its surface material or flies apart altogether.

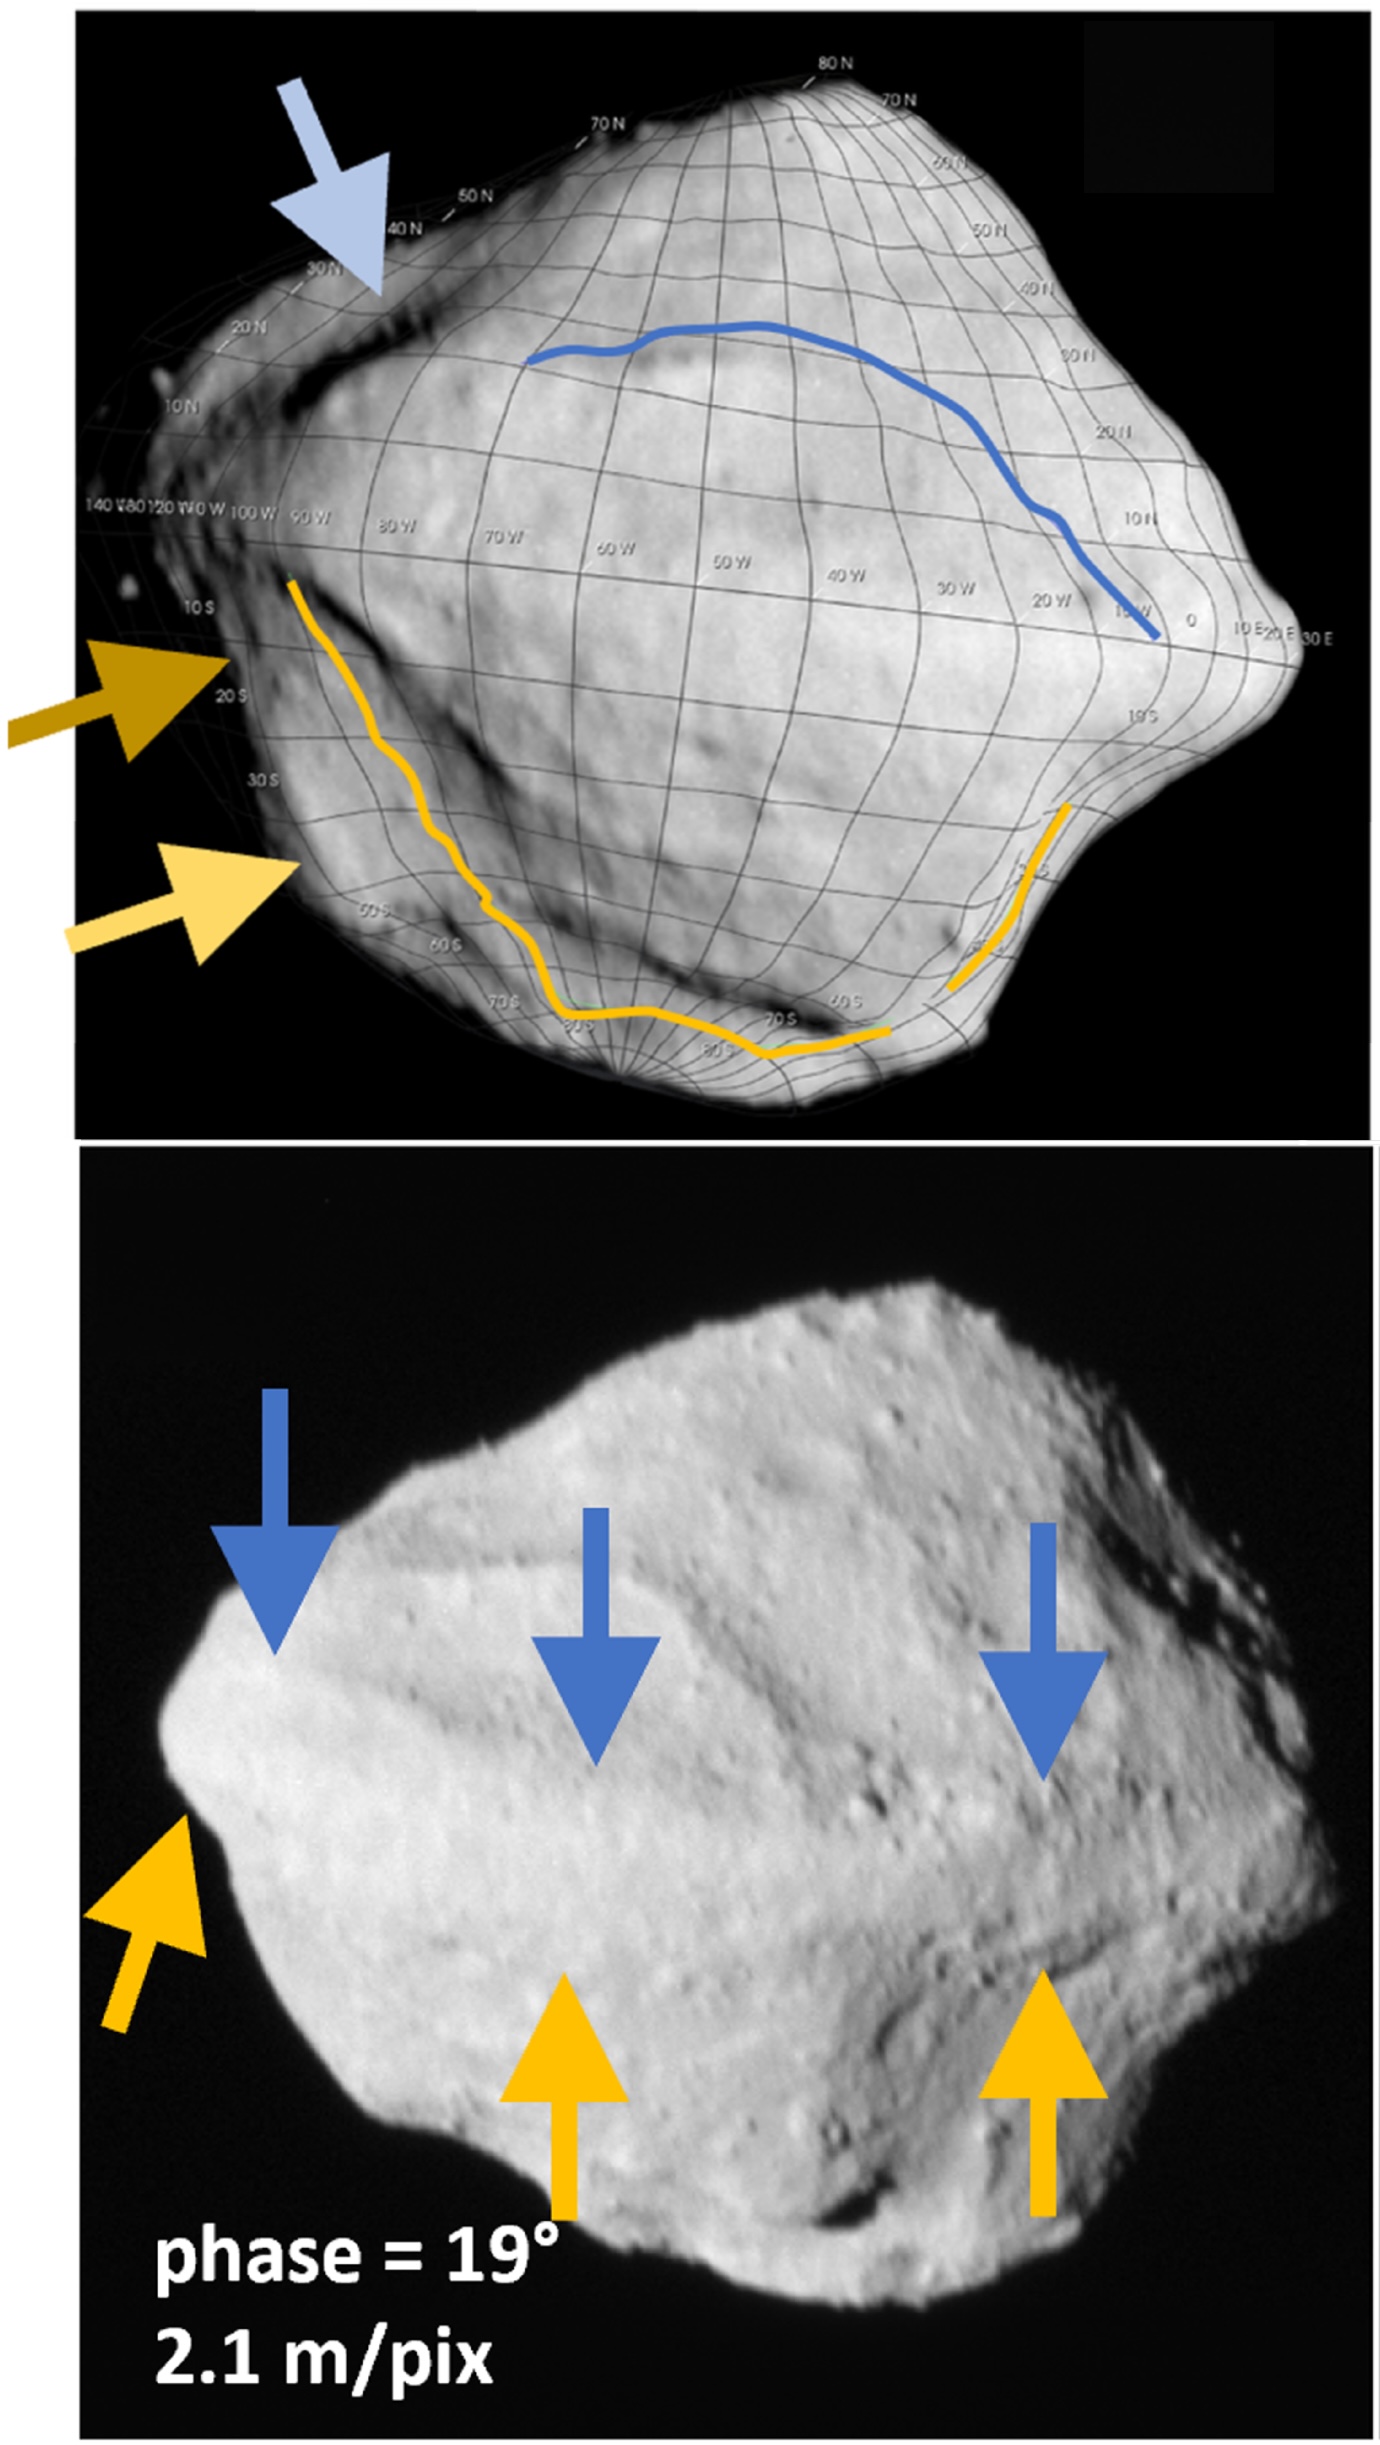
Sumak Fossa and Fab Dorsum on Dinkinesh

Locations of Sumak Fossa (top) and Fab Dorsum (bottom) indicated with arrows. [Adapted from Bierhaus et al. 2025]

Dinkinesh seems to show clear signs of YORP-driven structural failure. Sumak Fossa (a large trough) and Fab Dorsum (a ridge running along the asteroid’s equator) may have formed through this process. If Sumak Fossa was excavated by a YORP-induced mass-shedding event, both Fab Dorsum and Selam could have formed out of the cast-off material.

With Lucy en route to its primary objective, there’s still much for us to learn from this mission about the small bodies of our solar system. In the meantime, be sure to check out the full article linked below, as there are far more details about Dinkinesh and Selam than could be included in this short summary!

Citation

“The Geology of a Small Main-Belt S-Class Binary Asteroid System: Dinkinesh and Its Contact Binary Satellite Selam as Observed by the Lucy Mission,” E. B. Bierhaus et al 2025 Planet. Sci. J. 6 299. doi:10.3847/PSJ/ae1968

The post Details on Dinkinesh and Its Surprise Satellite from the Lucy Mission appeared first on AAS Nova.

Pulling Back the Curtain on DART Ejecta

6 March 2026 at 17:00

In September 2022, the Double Asteroid Redirection Test (DART) mission served as the first attempt at redirecting a near-Earth asteroid — an experiment testing humanity’s ability to fend off any threatening Earth-bound asteroids. A recent study presents the first 3D reconstruction of the impact ejecta, suggesting that the blown-out material is more complex than previous models considered.

DART-ing into Dimorphos 

The DART spacecraft intentionally smashed into Dimorphos, the small and unassuming moon of the larger asteroid Didymos. This space-based crash test aimed to determine if kinetic impactors like DART could successfully change an asteroid’s course through the solar system. Dimorphos’s orbit was indeed shortened by roughly 30 minutes, confirming that ramming an asteroid with a spacecraft could be a viable method of planetary defense. However, determining exactly how much an asteroid’s path will be altered is not necessarily straightforward. When a spacecraft collides with an asteroid, the impactor imparts momentum to the target, and any material excavated from the impact site can also alter the asteroid’s course.

DART’s impact launched a significant spray of rubble, or what researchers call an ejecta curtain. The ejecta curtain is typically modeled as a cone, using a simple geometry to determine its contribution to momentum transfer. However, when looking closely at imaging taken soon after the collision, the real physical structure of the ejecta appears to be more complex. Untangling the true 3D distribution of the ejecta is necessary to understand how momentum was actually distributed among escaping ejecta, better estimate the total mass ejected from Dimorphos, and improve modeling of the Didymos system’s orbit after impact.

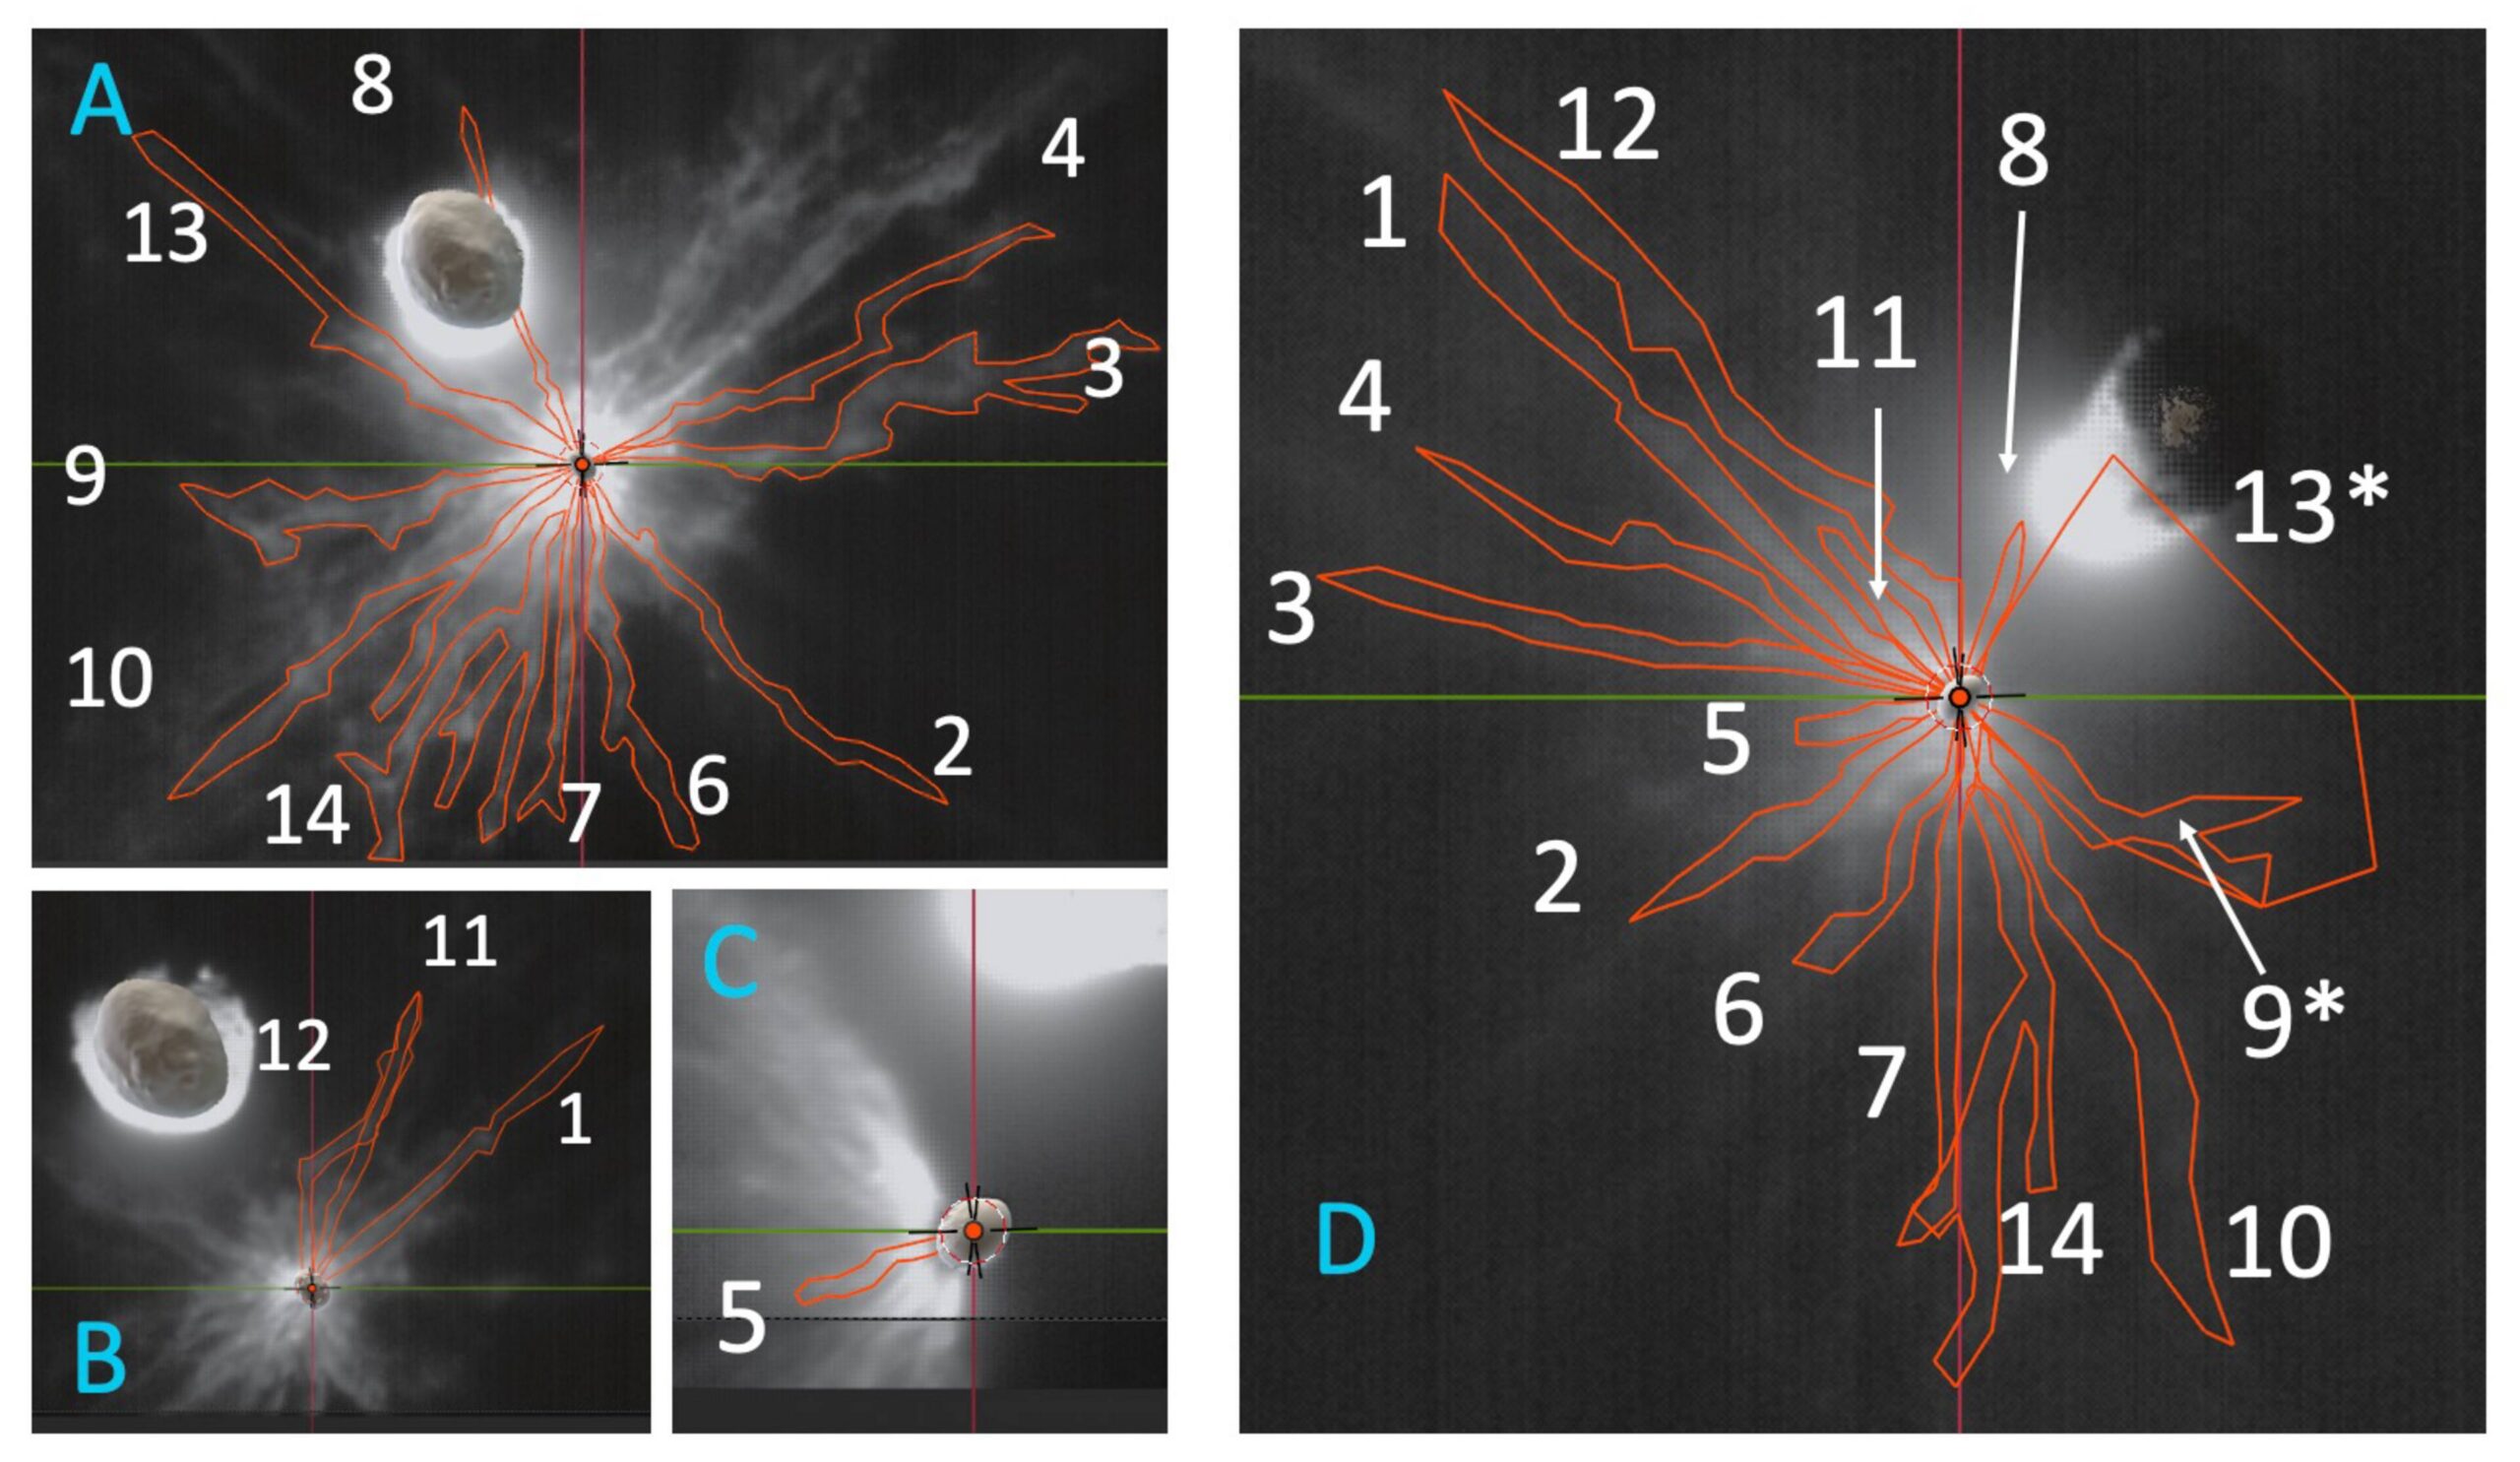
DART ejecta

LICIACube images of the DART ejecta curtain with the 14 distinct features identified in this study outlined in red. Click to enlarge. [Deshapriya et al 2026]

Determining Debris Distribution

Seeking to better characterize the ejecta curtain, a team led by J. D. P. Deshapriya from Italy’s National Institute for Astrophysics used data from the Light Italian CubeSat for Imaging of Asteroids (LICIACube) that flew behind the DART spacecraft to capture images of the system shortly after the impact. After careful image handling to bring out diffuse and faint material, the researchers identified 14 distinct ejecta features across the flyby imaging. LICIACube viewed the aftermath both side on and face on, providing valuable 3D information about the distribution and motion of the ejecta. 

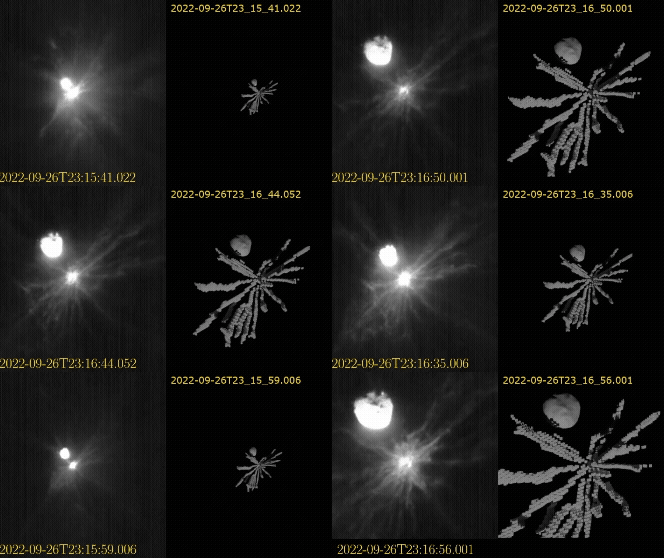
DART ejecta animation

Animation of the DART ejecta as the LICIACube spacecraft approached the impact. The left shows the images taken by the spacecraft, and the right shows the 3D model produced for the ejecta. Click to play animation. [Deshapriya et al 2026]

Using 3D modeling software, the researchers traced each of the 14 distinct features across the images and reconstructed a 3D representation of the ejecta morphology. While earlier models assumed symmetric cone-like geometries, this 3D modeling revealed clear asymmetric and non-uniform structures within the ejecta curtain. These variations point to underlying heterogeneities in the impact site on Dimorphos — surface and subsurface composition naturally link to the resulting ejecta distribution according to previous laboratory experiments. The spatial and directional features uncovered in this study highlight the limitations of models that attempt to characterize ejecta curtains with symmetric and uniform distributions. Refining these model parameters will better match observations and better predict momentum transfer in future missions. 

Planetary Defense

What does this mean for planetary defense? While simplified symmetric cone models provide helpful approximations for kinetic impactor missions, they do not fully capture the true complexity of the impact. This study shows that local variations in an asteroid’s surface and interior properties can directly influence the resulting ejecta distribution and motion. The true momentum imparted to the target asteroid depends heavily on the specific ejecta material, and these details inform how effective planetary defense missions can be in redirecting asteroids. Incorporating realistic, observation-driven ejecta distributions into modeling frameworks is essential to achieve reliable predictions for future planetary defense missions.

Citation

“3D Reconstruction of DART Ejecta at Dimorphos Reveals an Anisotropic, Filamentary Structure,” J. D. P Deshapriya et al 2026 Planet. Sci. J. 7 4. doi:10.3847/PSJ/ae2c64

The post Pulling Back the Curtain on DART Ejecta appeared first on AAS Nova.

Are Water Worlds Just Made of Soot?

20 January 2026 at 17:00

illustration of K2-18b

Editor’s Note: Astrobites is a graduate-student-run organization that digests astrophysical literature for undergraduate students. As part of the partnership between the AAS and astrobites, we occasionally repost astrobites content here at AAS Nova. We hope you enjoy this post from astrobites; the original can be viewed at astrobites.org.

Title: Soot Planets Instead of Water Worlds
Authors: Jie Li et al.
First Author’s Institution: University of Michigan
Status: Published in ApJL

They Might Be Planets with a Lot of Water…

Since the discovery of PSR B1257+12 c and d in 1992 and  51 Pegasi b in 1995, we have found evidence for thousands of planets in other star systems. One of the most striking things (aside from how common planets seem to be) is how many of them are so unlike anything we had imagined we would find. Our growing list of exoplanets includes a truly remarkable variety of types, from cold rocky planets smaller than Earth to scorching hot giants bigger than Jupiter.

However, one category of planets is particularly interesting: the sub-Neptunes. These planets, smaller than Neptune but larger than Earth, are characterized by their low densities, which suggests they could be dominated by water or volatile-rich atmospheres. What makes sub-Neptunes so intriguing is that we don’t have a clear counterpart for them in our own solar system. As such, we don’t really know a lot about them other than there seem to be a lot of them out there.

Although these planets are sometimes theorised to be rocky worlds with large hydrogen–helium envelopes, they have alternatively been considered as water worlds, i.e., worlds with giant planet-wide oceans thousands of kilometres deep. The thinking goes that since water ice appears to be abundant beyond the snow line, water worlds would be a natural consequence of planet formation. And if these planets exist, some might host a temperate liquid ocean with the conditions for life.

…or They May Just Be CHON(ky)

However, today’s article suggests that these supposed water worlds may not be as wet as we think they are. They may instead be rich in what are called refractory carbonaceous materials. This term describes solids rich in carbon, hydrogen, oxygen, and nitrogen, or CHON. It is a bit of a mouthful and is often just referred to as “soot,” but it is important to remember that it is different from the black stuff you would find in ye old chimney. Soot, in this case, is a major component of comets. We know that this type of material is present around planet formation, as protoplanetary dust contains not just silicates (rock) and water ice but also a significant amount of CHON, and comets are leftovers from this dust.

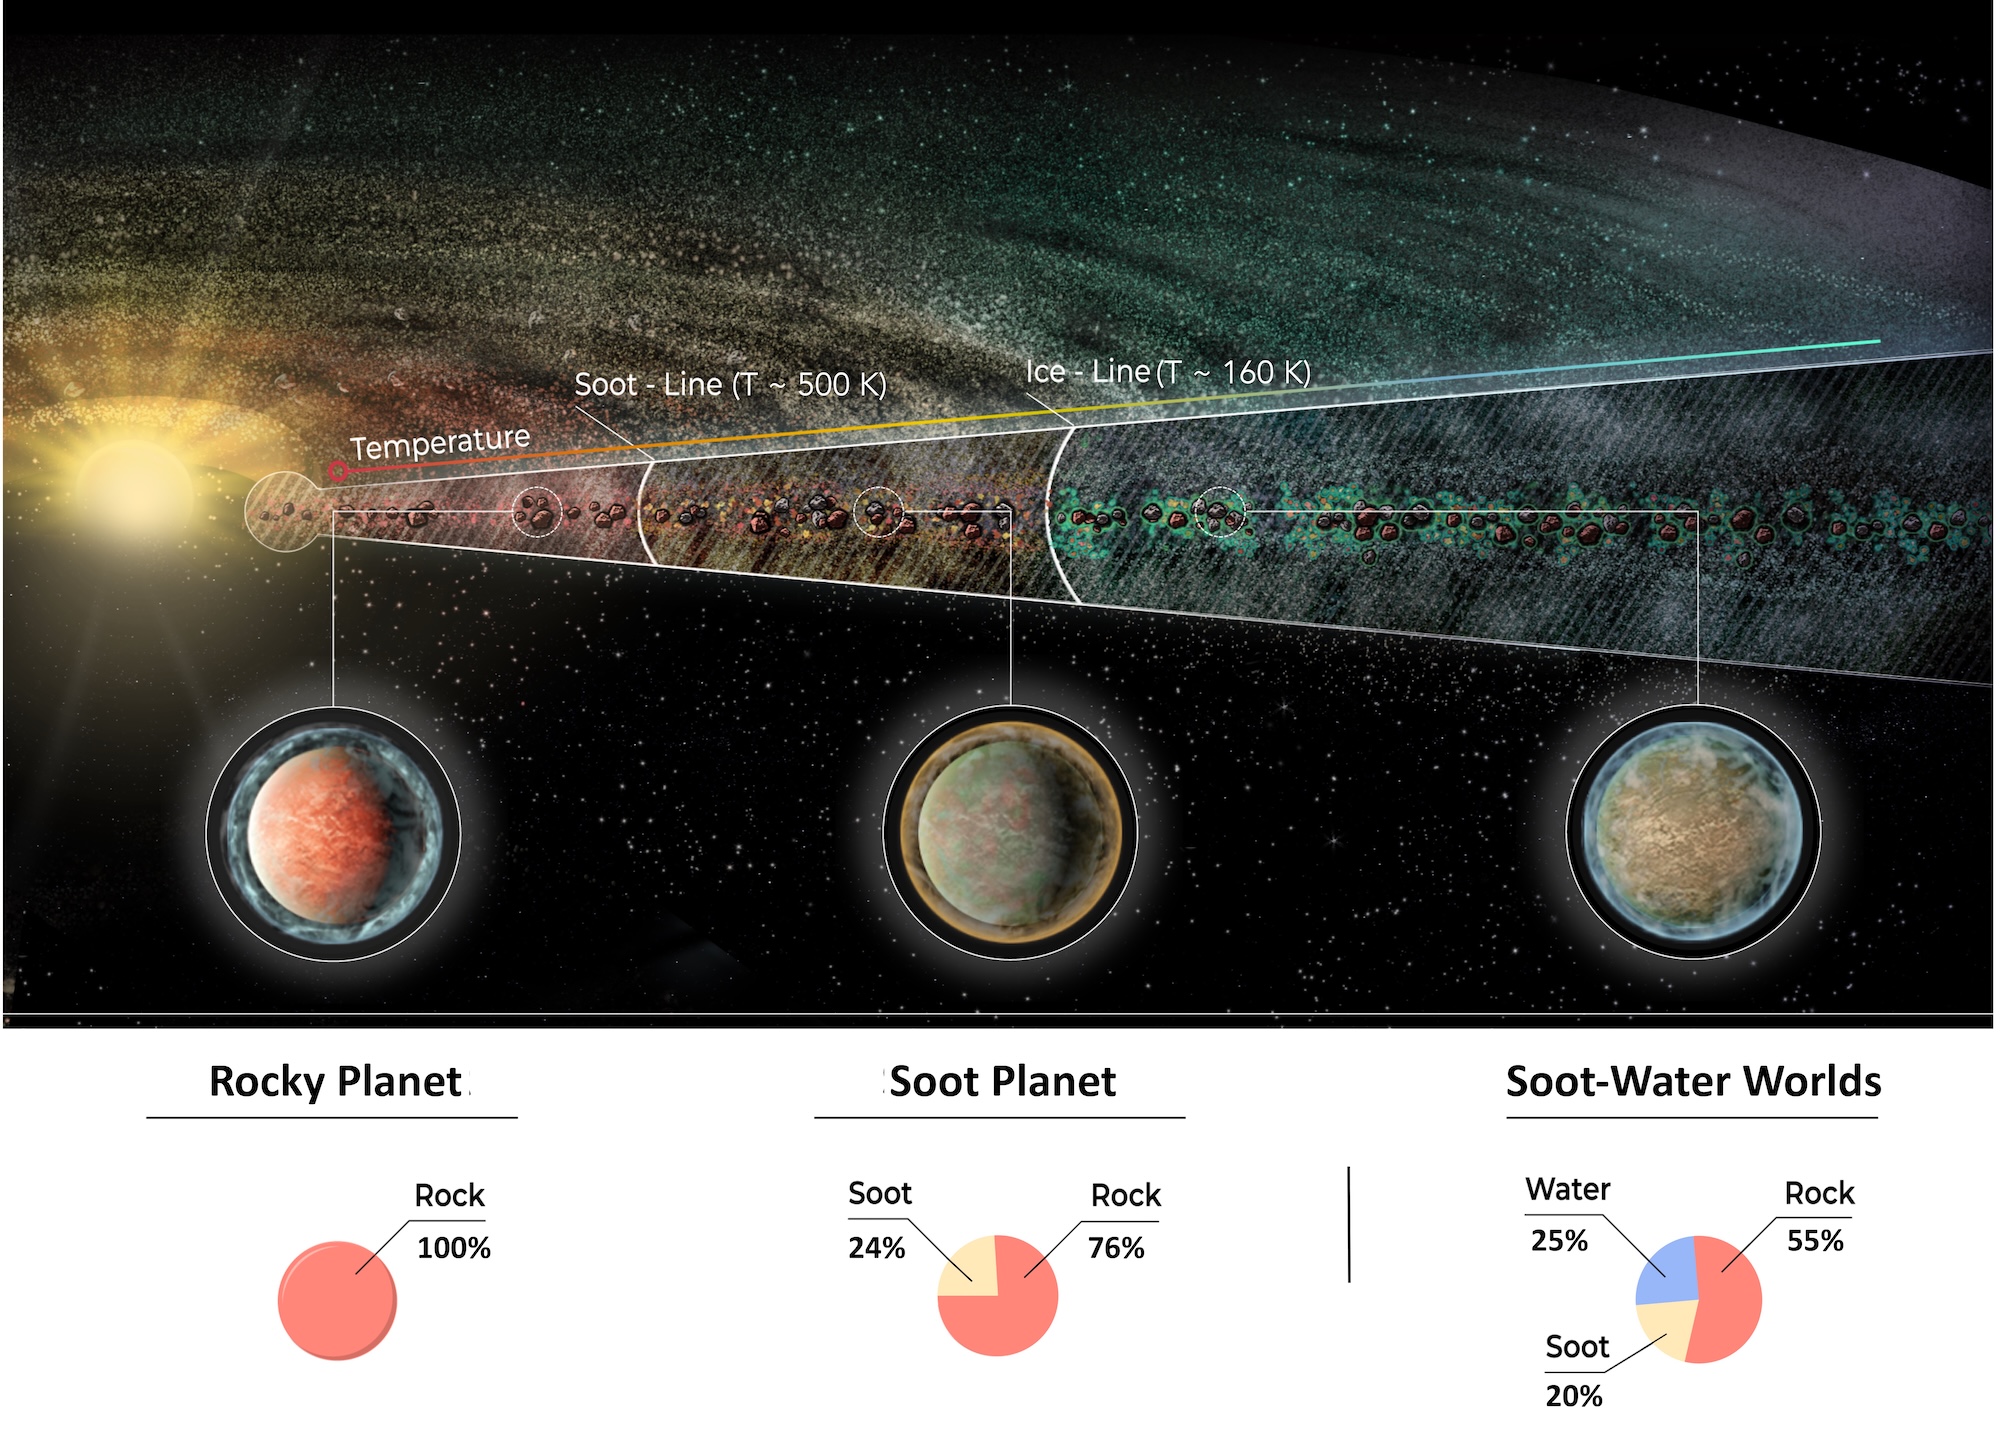
Soot is stable and remains in the solid state to much greater temperatures (∼500K) than water ice (∼160K), so the authors argue that there should be regions in the protoplanetary disk where planets accrete both rock and soot but little water. They define a “soot line” akin to the snow line and look at three archetypical planets that may form, shown in Figure 1.

illustration of rocky planets, soot planets, and soot-water planets based on their formation location

Figure 1: Illustration of a protoplanetary disk and three chemically distinct planet types that may form as the distance from the host star increases. Close in, the temperature in the disk is too high for volatiles to exist in the solid state, but farther out, the temperature drops to allow for water to freeze into ice beyond the water ice line, also known as the snow line. Between the two regions lies another where it’s cool enough for carbonaceous materials or “soot” to avoid destruction via thermally driven reactions. Depending on where planets form, they may contain a varying amount of astrophysical soot. [Li et al. 2026]

Inside the soot line, planets would be rock-rich worlds with low carbon or water content (e.g., terrestrial planets) because it is just too hot for any soot to stay together. Beyond the soot line but before the snow line, you would find carbon-rich rocky worlds (soot planets). They have low water content, as it is still too hot for water ice to exist, but these planets are rich in CHON. Beyond the snow line, a combination of rock/carbon/water worlds becomes possible, here labelled as soot-water worlds. The authors note that even though the last one has a significant fraction of water, it is distinct from traditional “water worlds” because it includes a significant component of hydrocarbon-rich material. Again, it is also important to remember that a soot world wouldn’t mean a black powder ball hanging in space, but rather a world that is composed of a lot of CHON, like Saturn’s moon Titan.

What Do the Models Say?

The authors got down to modelling planet compositions based on both observations of protoplanetary disks and the distribution of solid materials found in comets.

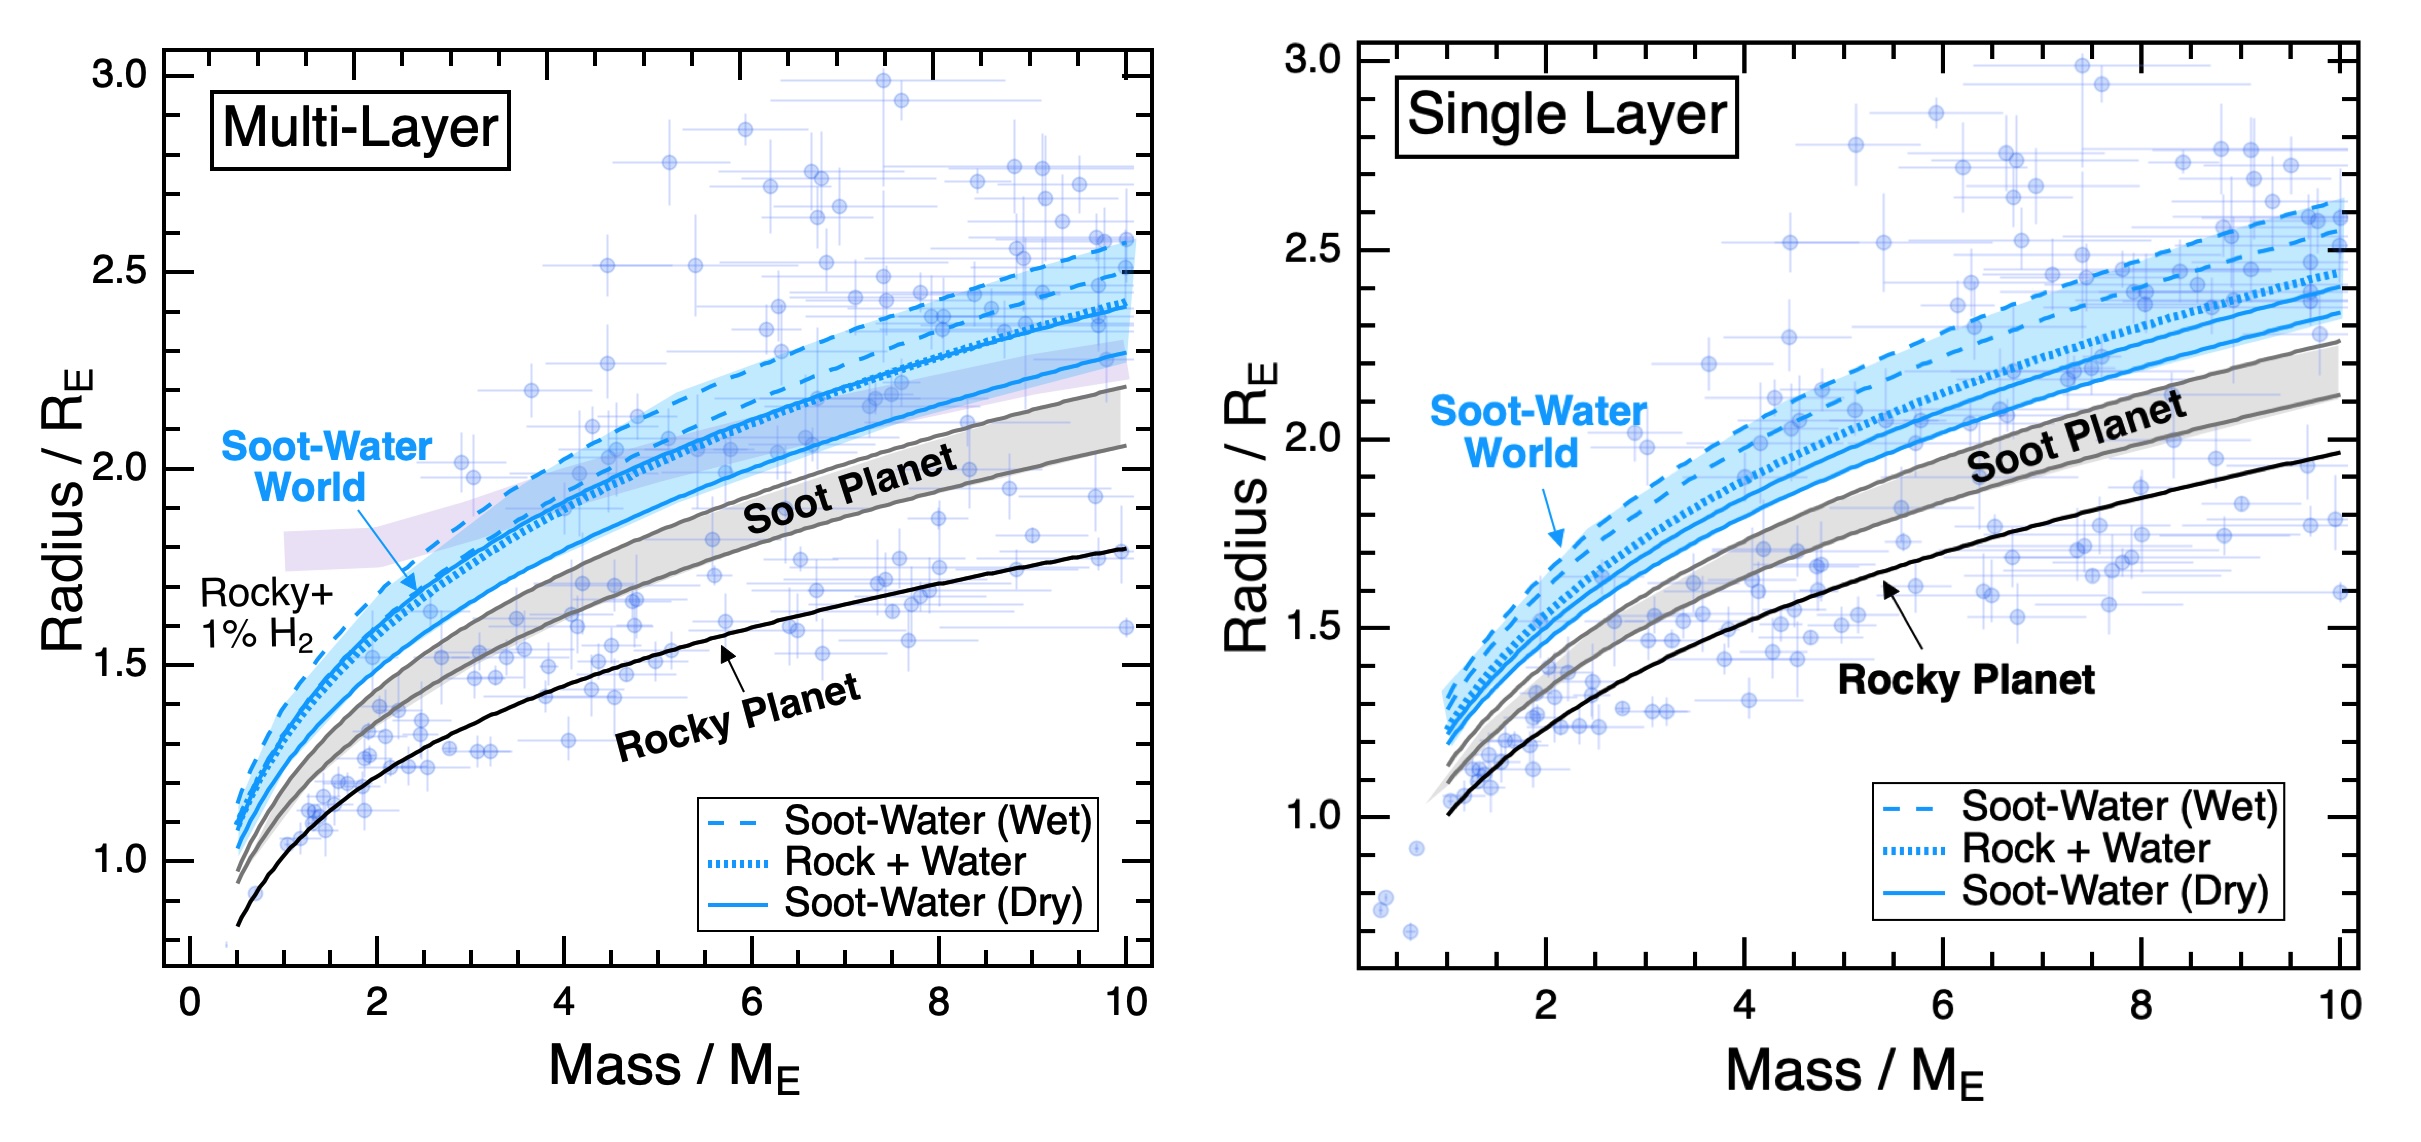
They considered two model planets. One is fully stratified, i.e., with a metallic core enclosed in a silicate mantle overlain by a hydrocarbon-rich layer and then a water-ice surface layer. The other, a single-layer mixed planet, is a hypothesised scenario where iron, silicate, soot, and water are fully mixed throughout the planet as a result of exotic chemistry from the high temperature inside the sub-Neptune planet. They expect any potential real planets to lie somewhere between the two extremes. The mass–radius relations for these models can be seen in Figure 2, where they are also compared to a number of known exoplanets, of which several fall within the models’ parameter spaces.

Mass–radius relations for model Earth-like rocky planets

Figure 2: Mass–radius relations for model Earth-like rocky planets (black curves), soot planets (gray bands), and soot-water worlds (blue bands). On the left are multi-layer planets, while on the right are single-layer planets. Overlaid are a number of exoplanets along with their respective uncertainties. Also shown as dashed lines are models for Earth-like planets with 50% rock and 50% water. These fall squarely within the same region as soot-water worlds, making the two indistinguishable from each other. [Li et al. 2026

A particularly interesting result that the authors note is that the predicted mass–radius relationship for the water worlds, which incorporates soot, is similar to that predicted previously for a 50% water planet with no carbon. That is, if you base your interpretation on the mass–radius relationship alone, it is impossible to distinguish between a world made of rock and water and a water-rich planet that incorporates a significant amount of soot.

We Might Have a Telescope That Can Help

How might we break through this impasse? Well, because significant fractions of methane and other simple hydrocarbons are expected to be released from the interior, the soot-rich planets may feature methane-rich atmospheres. These may naturally lead to the formation of hydrocarbon hazes, akin to the tholins in Titan’s atmosphere.

Looking at the atmospheres of exoplanets is one of the main mission goals of JWST. Many of the spectra from sub-Neptunes have so far been featureless, which may indicate the presence of clouds or photochemical haze. The telescope also has the ability to detect carbon-bearing species in the atmospheres of other sub-Neptunes, like with the discovery of CO2 and CH4 in the atmospheres of K2-18b and TOI-270d. Although these planets currently orbit interior to the soot lines of their respective stars, they may have originally formed farther out and later migrated inward during their evolution. Of particular interest is TOI-270d. Aside from also showing signs of water, it has a carbon-to-oxygen ratio that is moderately high for the planet, hinting that it could be a world with a considerable amount of soot.

The presence of soot may have significant implications when it comes to habitability. The planet’s core may be rich in diamond, which would impede the movement of volatiles in the mantle. This would make it challenging for the planet to generate a magnetic field and thus leaving any potential life vulnerable to cosmic radiation. However, they could also be abundant in methane and other volatile organic compounds, substances thought to be crucial for the development of prebiotic chemistry. Regardless, it is interesting that there might be something out there that is not so unlike something we know from our own solar system, a hazy supersized Titan. While the frigid moon is unlikely to show signs of life, a temperate soot-water world might be one place to look in the future.

Original astrobite edited by Sowkhya Shanbhog.

About the author, Kasper Zoellner:

I have a Master of Science in astronomy and I am currently working towards a PhD in physics and educational science. My greatest passion is the search for exoplanets and how stellar variability may influence the possibility of life. I am also interested in science outreach, education and discussing what sci-fi novel to read next!

The post Are Water Worlds Just Made of Soot? appeared first on AAS Nova.

Looking for a Single Stellar Ancestor: Mono-Enriched Stars in Zoom-In Simulations

17 September 2025 at 17:00

supernova remnant N49

Editor’s Note: Astrobites is a graduate-student-run organization that digests astrophysical literature for undergraduate students. As part of the partnership between the AAS and astrobites, we occasionally repost astrobites content here at AAS Nova. We hope you enjoy this post from astrobites; the original can be viewed at astrobites.org.

Title: SIRIUS: Identifying Metal-Poor Stars Enriched by a Single Supernova in a Dwarf Galaxy Cosmological Zoom-In Simulation Resolving Individual Massive Stars
Authors: Yutaka Hirai et al.
First Author’s Institution: Tohoku University
Status: Published in ApJL

All of the elements in stars come from, well, other stars. Each star has its own unique makeup of elements, kind of like our own DNA. Just like genes passing down generation after generation, elements in stars can be passed down to newly forming stars after the previous generation has died. So, if you’re looking at the chemical makeup of a particular star, what you’re really seeing is all the elements that were created after another star in the region exploded (went supernova) and enriched the gas (that the new star formed from) around it with elements like oxygen, nitrogen, iron, and more.

Like genealogy for stars, astronomers can use stellar enrichment to work their way back from a star they observe to its potential predecessors. It’s a bit trickier for stars that have a lot of elements, dubbed “metal-rich” stars, because there’s no way to tell which star contributed what mixture of elements at what point in time. However, scientists have recently been observing “extremely metal-poor” stars, which are stars with only small amounts of elements like oxygen, nitrogen, or carbon. Because there are so few of these elements, it’s safe to assume that these stars formed out of gas that didn’t have many predecessor stars enriching it — in fact, astronomers are hoping to find stars that only ever had one ancestor, calling them “mono-enriched” stars. Finding a mono-enriched star would tell us exactly what elements were produced in the supernova — aka in supernova nucleosynthesis.

However, how many of these metal-poor stars are mono-enriched is unknown. Estimating this fraction could help researchers identify more of them. The authors of this study tackle this problem by examining how many might exist in dwarf galaxies and what kind of chemical signatures they could produce.

Simulating Mono-Enriched Stars

To do this, they simulate a dwarf galaxy with the hydrodynamic code ASURA and model the gas physics in the galaxy with CLOUDY. In this method, stars form once the density of hydrogen gas in a region exceeds a certain threshold at a temperature that is cool enough for the gas to clump together. Pockets of this simulated region are then randomly assigned a stellar mass from the initial mass function, and eventually explode, diffusing elements into the gas particles around it.

Finding Mono-Enriched Stars in the Simulated Stellar Haystack

plot showing stellar metallicity, carbon enhancement, and mass of simulated stars in a dwarf galaxy

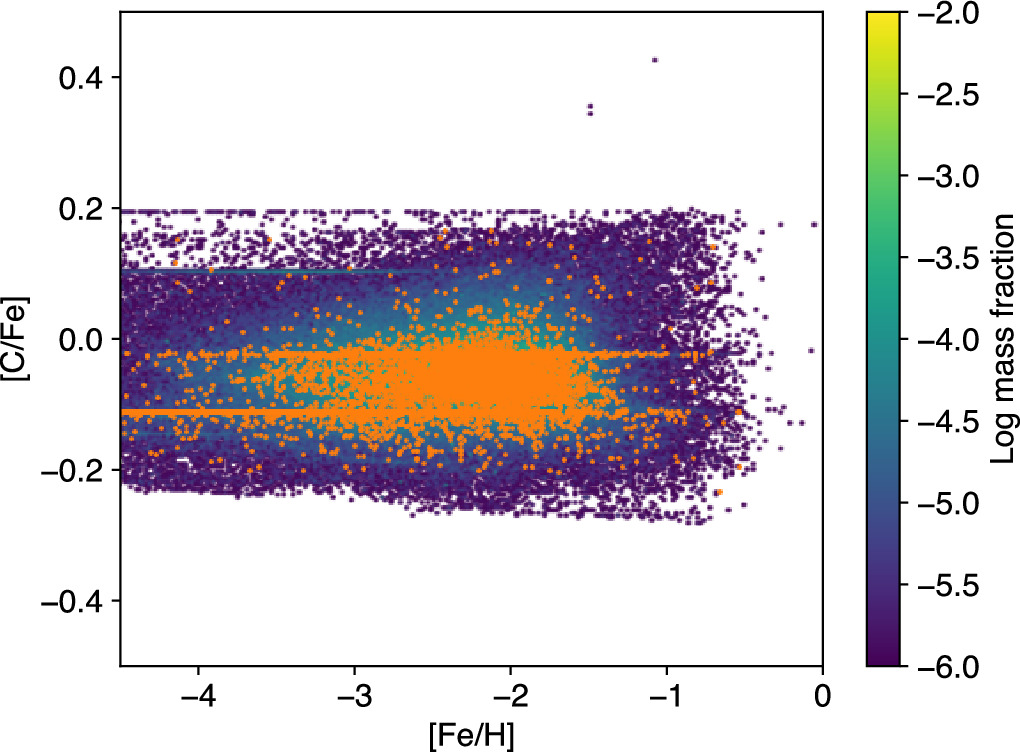
Figure 1: Every simulated star in the dwarf galaxy, shown as a function of their stellar metallicity, [Fe/H], carbon enhancement, [C/Fe], and their mass. Orange points are identified as mono-enriched stars. Click to enlarge. [Hirai et al. 2025]

The authors define a mono-enriched star as one with a carbon-to-iron ratio (denoted [C/Fe]) similar to that expected of a core-collapse supernova in their model. They identify a portion of the stars created as being mono-enriched, shown in orange in Figure 1. In total, this makes up about 1.5% of stars in this simulated dwarf galaxy.

Once these data points are collected, the authors investigate the fraction of mono-enriched stars at different metallicities. The authors essentially ask, are mono-enriched stars more likely to occur at lower metallicities? They find that, indeed, stars that are lower metallicity (and thus have lower [Fe/H]) are more likely to be mono-enriched (Figure 2). For stars with exceedingly low metallicities, [Fe/H] < −5, about 11% of them in this simulated dwarf galaxy have formed out of gas enriched by only one supernova.

Fraction of mono-enriched stars in the stellar population depending on the stellar metallicity

Figure 2: Fraction of mono-enriched stars in the stellar population depending on the stellar metallicity ([Fe/H]) of the population. Stars with much lower metallicities ([Fe/H] < 2.5) are more likely to be mono-enriched. [Hirai et al. 2025]

Finding Mono-Enriched Stars in the Observed Stellar Haystack

These theoretical predictions help observers prepare what to look for when they want to find a mono-enriched star. These predictions seem to suggest that astronomers should keep looking for these extremely metal-poor stars if we want to find these unique stars that tell us about what elements are made in core-collapse supernovae. There is currently a decently large database of extremely metal-poor stars found with photometry, and if observers could follow up with the most ideal candidates spectroscopically we could really test what kind of elements are in these stars. Further, the upcoming Subaru Prime Focus Spectrograph will take many spectroscopic observations of close-by dwarf galaxies, which may contain more extremely metal-poor stars.

The authors note there is more work to be done in simulations, as they are interested in testing how extremely metal-poor stars, specifically ones with enhanced carbon, form. All of this will hopefully lead to a better understanding of how elements are made when stars explode, perhaps leading us to how some of the earliest elements formed in the early universe.

Original astrobite edited by Diana Solano-Oropeza.

About the author, Caroline von Raesfeld:

I’m a third-year PhD student at Northwestern University. My research explores how we can better understand high-redshift galaxy spectra using observations and modeling. In my free time, I love to read, write, and learn about history.

The post Looking for a Single Stellar Ancestor: Mono-Enriched Stars in Zoom-In Simulations appeared first on AAS Nova.

A Close Look at an Ancient Moon

5 September 2025 at 17:00

A photograph of a heavily cratered moon on a black background.

By piecing together observations from dozens of radio telescopes in Chile, planetary scientists recently completed the first-ever map of Callisto’s emission at millimeter wavelengths.

Old and Cold

In striking contrast to Io’s frenzied volcanism and Europa’s cracking ice shell, Jupiter’s moon Callisto is much quieter and colder than its Galilean siblings. Though a liquid water ocean hypothetically sloshes beneath its frigid surface, it’d be hard to infer that just by looking at the moon. Callisto’s terrain is ancient, static, and bears the scars of the millennia of exposure to space. There are no volcanoes, plate tectonics, or any other features to disturb what researchers call “evolved ruins” of the numerous craters. These have names like Valhalla, Asgard, and Lofn, since Callisto’s geologic features are named after settings and characters in Norse mythology to further reinforce their freezing existence.

This never-reset canvas makes Callisto an ideal laboratory for studying the long-term effects of asteroid impacts, dust accumulation from nearby natural satellites, and other processes that modify a planetary surface over time. One way to infer the composition and structure of the first few meters of material is to observe the way the temperature changes over the course of a day. For example, ice and rock respond differently to temperature changes; similarly, small-grains of either material warm up and cool down at different speeds than their larger-grain counterparts.

An image of a purple-orange blob against a black background.

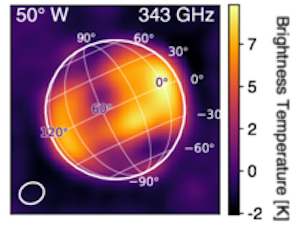
The residuals from one of ALMA’s observations of Callisto. [Adapted from Camarca et al. 2025]

In theory, planetary scientists can measure the temperature of a moon by noting how bright each patch of its surface appears in millimeter-wavelength observations. However, this is easier said than done, as only a handful of telescopes are capable of seeing Callisto as anything more than a fuzzy blob at those wavelengths. Back in 2016–2017, planetary scientists used the Atacama Large Millimeter/submillimeter Array (ALMA), a radio interferometer in Chile, to attempt the challenging feat of making a map of Callisto’s surface.

Mapping from Afar

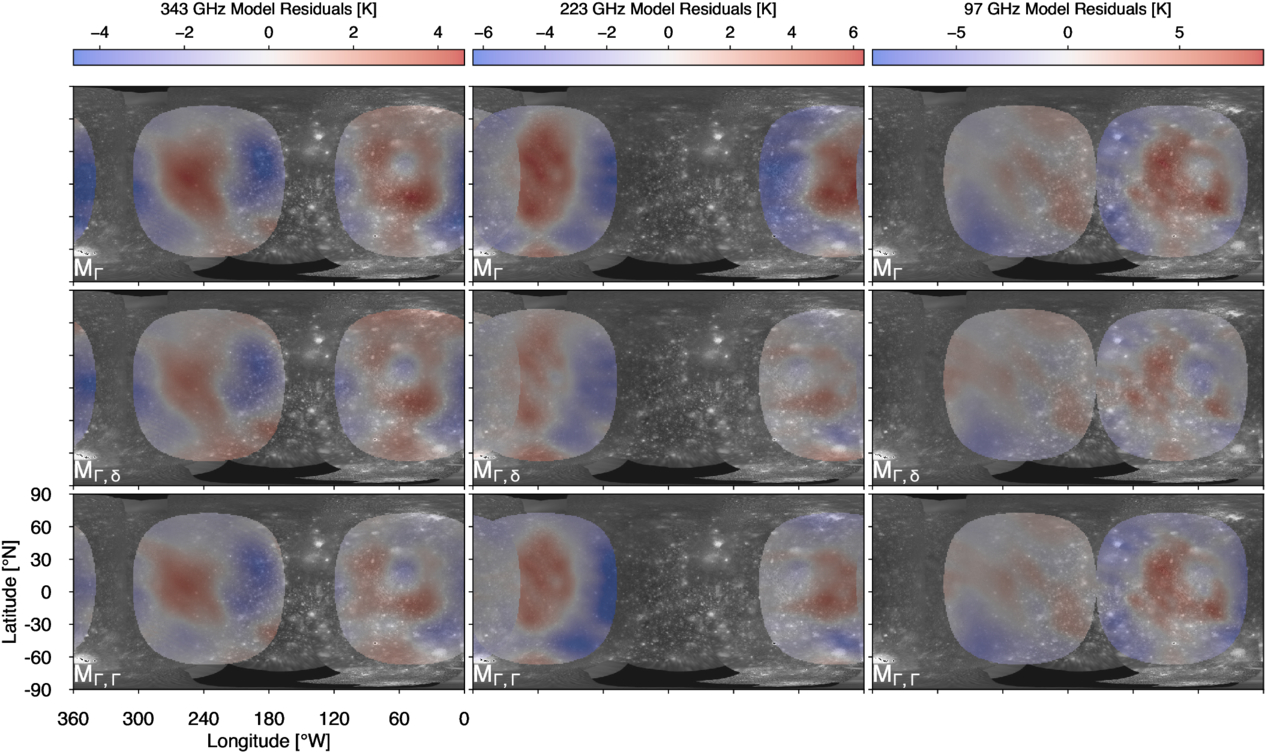
A team led by Maria Camarca, California Institute of Technology, just finished churning through all of the data and assembling their map of Callisto’s temperature residuals. Though the final spatial resolution was at best a few hundred kilometers, meaning a comparable map of Earth would blur all of New England together, this represents the most detailed thermal map of Callisto yet. The map was detailed enough to easily spot the largest craters, and several impact craters including Valhalla stood out as being 3–5K colder than all of the surrounding terrain. The team spotted another anomalously cold region that coincides with the location of maximum carbon dioxide gas density recently seen with JWST.

A multi-panel figure of a black and white surface beneath transparent red and blue blobs.

A map of Callisto’s thermal emission (red/blue) overlaid atop visible images of the surface collected by spacecraft. Click to enlarge. [Camarca et al. 2025]

The team also found that their data could not be explained by a simple model for Callisto’s surface that assumed one dominant material and structure. Instead, their images were better explained by more complex simulations that use two different thermal inertias. Though they are not sure yet why this may be, it is clear that Callisto, often overlooked compared to its flashier siblings, is a complex world worthy of further study. Luckily, the upcoming Jupiter Icy Moons Explorer mission and ALMA’s Wideband Sensitivity Upgrade will bring new knowledge of Callisto’s ancient surface.

Citation

“A Multifrequency Global View of Callisto’s Thermal Properties from ALMA,” Maria Camarca et al 2025 Planet. Sci. J. 6 183. doi:10.3847/PSJ/ade7ee

The post A Close Look at an Ancient Moon appeared first on AAS Nova.

Sun Glitter and Sunglint on Titan’s Hydrocarbon Seas

25 April 2025 at 17:00

Titan sunglint

Earthlike yet alien, Titan is the only solar system body other than Earth known to host persistent liquid on its surface. The glint of sunlight on this surface liquid provides a means to study the complex interplay between Titan’s seas, shorelines, and atmosphere.

When the Sun Hits the Sea as Seen by Cassini, That’s a Mare

specular reflection on Titan

The first image of specular reflection of sunlight off Titan’s hydrocarbon seas, taken on 8 July 2009 by Cassini. [NASA/JPL/University of Arizona/DLR]

In 2009, the Saturn-orbiting Cassini spacecraft spotted the glare of sunlight reflecting off a sea of liquid on the surface of Titan, Saturn’s largest moon. This observation of specular (i.e., “mirror-like”) reflection, or sunglint, confirmed the presence of liquid on Titan’s surface — what researchers now know to be oily lakes and seas of liquid hydrocarbons like methane and ethane.

A recent research article from Michael Heslar and Jason Barnes (University of Idaho) yields new insight into the behavior of Titan’s seas and coastal regions in Punga Mare. Punga Mare, located nearly at the north pole, is the smallest of Titan’s named seas and holds the distinction of being the first place where extraterrestrial waves were definitively identified.

Summering at Punga Mare

In the Cassini observation selected for this study, it’s summertime in the northern hemisphere, with balmy temperatures hovering just above 90K (−298℉/−183℃). Cassini viewed Punga Mare from an altitude of roughly 6,000 kilometers and at an oblique angle of 126 degrees. From this angle, Titan’s landmasses appear dark and the sea appears bright.

diagram of the geometry of specular reflection and sun glitter

The geometry of specular reflection (sunglint) and sun glitter. The incidence and emission angles, i and e, are equal. Click to enlarge. [Heslar et al. 2020]

Several anomalously bright features, collectively called specular features, appear in and near Punga Mare. These features are examples of sunglint and sun glitter. Sunglint occurs when sunlight reflects off a smooth surface as light reflects off a mirror, with the angle of the incoming sunlight equal to the observer’s viewing angle. Sun glitter is a related phenomenon that occurs outside the sunglint zone, where localized changes in the angle of the surface — from waves, for example — reflect sunlight toward the observer.

Coasts, Islands, and Inlets

Punga Mare sunglint and sun glitter

Cassini Visual and Infrared Mapping Spectrometer observation of Punga Mare at wavelengths of 5.0 (red), 2.8 (green), and 2.0 (blue) μm. Click to enlarge. [Adapted from Heslar & Barnes 2025]

Heslar and Barnes identified specular features along the coastline, bordering a chain of islands, out at sea, and in coastal inlets.

The bright areas along the coast appear to overlap both the sea surface and the land surface. While it’s not yet clear exactly what causes this brilliant coastal outline, Heslar and Barnes speculated that it may be evidence for waves along the coastline; rough seas may also be the cause of the sun glitter illuminating the Hawaiki island chain and out at sea.

The specular features associated with inlets may mark where rivers flow into or out of Punga Mare. Rather than wave activity, these bright areas might mark where nitrogen has bubbled up to the surface.

Altogether, this study demonstrated the variety and depth of information that can be gleaned from a single sunglint observation — and the authors closed by noting how effective an orbiter would be for studying ocean behavior on Titan. NASA’s upcoming Dragonfly mission may also be able to capture sunglint as the spacecraft leapfrogs across Titan’s surface.

Citation

“Sea Surface and Hydrological Activity Observed in Titan’s Punga Mare,” Michael F. Heslar and Jason W. Barnes 2025 Planet. Sci. J. 6 74. doi:10.3847/PSJ/adbc9e

The post Sun Glitter and Sunglint on Titan’s Hydrocarbon Seas appeared first on AAS Nova.

Ocean Monitoring Cuts Threaten Weather Forecasting While Helicopters Deliver 100 Tonnes for Mountain Trail Repairs — Today’s Environmental Briefing for Sat, Jun 6 2026

6 June 2026 at 14:01
Ocean monitoring buoy floating in blue water with scientific equipment visible above surface

Across the stories today, a common thread emerges around the growing tension between humanity’s expanding footprint and the natural world’s capacity to sustain it — and the innovative ways communities are responding to that pressure.

From Nepal’s sleepless farmers standing guard against crop-raiding elephants to New York’s groundbreaking moratorium on data centers, the day’s coverage points to growing momentum around a fundamental question: How do we balance human needs with environmental limits? In Nepal’s fertile plains, farmer Dhruba Prasai embodies this struggle in the most personal terms, spending nights protecting his livelihood from wildlife that has nowhere else to go as habitats shrink. His story reflects a global pattern where conservation success — healthy animal populations — creates new challenges for the communities living alongside recovering ecosystems.

Meanwhile, the United States is grappling with its own version of this tension through energy infrastructure. New York’s proposed data center freeze represents the first state-level recognition that the digital economy’s physical infrastructure carries real environmental costs. As artificial intelligence development accelerates — highlighted by upcoming presidential meetings with tech leaders — states are being forced to confront whether unlimited growth in energy-hungry facilities aligns with climate commitments.

The policy landscape reveals a surprising role reversal that challenges conventional wisdom about climate action. While traditionally blue states like California retreat from aggressive environmental policies, red states are surging ahead in renewable energy development. This shift suggests that economic opportunity, not political ideology, may increasingly drive clean energy adoption. Virtual power plants are gaining traction in states like Massachusetts and Minnesota, signaling that grid modernization is becoming a bipartisan priority as electricity demand soars.

But perhaps the most encouraging thread running through today’s stories is the remarkable capacity for recovery when protection efforts succeed. Tanzania’s turquoise dwarf gecko has rebounded from near-extinction after trade bans halted the illegal capture of 40,000 individuals. Mangrove forests worldwide are staging unexpected comebacks after decades of destruction. Even in crisis, there are signs of resilience: curlew chicks successfully hatched from eggs rescued during wildfires, and New Mexico’s “reforestation pipeline” is training climate-resilient seedlings to heal wildfire-devastated landscapes.

It’s a reminder that progress and pressure often arrive together. The same technological advances driving data center construction are also enabling virtual power plants to balance renewable energy. Conservation successes that allow wildlife populations to recover create new management challenges for rural communities.

Behind the numbers are real communities adapting in real time. From Nepalese farmers developing night watch systems to Native American tribes seeing their bison restoration efforts threatened by new federal grazing rules, the human dimension of environmental change continues to play out in deeply personal ways.

The contrast between immediate local impacts and longer-term recovery stories suggests we’re in a pivotal moment where short-term adaptation strategies must align with longer-term restoration goals. As the week unfolds, all eyes will be on how policymakers balance competing demands — from Alaska’s Arctic refuge lease sale to Albania’s luxury resort controversy — while communities continue innovating at the intersection of human needs and environmental health.

The post Ocean Monitoring Cuts Threaten Weather Forecasting While Helicopters Deliver 100 Tonnes for Mountain Trail Repairs — Today’s Environmental Briefing for Sat, Jun 6 2026 first appeared on EnviroLink Network.

AWS targets a longtime cloud migration blocker with SQL Server license portability

6 June 2026 at 00:29

Licensing can be complicated, particularly when enterprises are forced to double-pay because the software they already own is only licensed for a specific environment, and moving it requires a whole different licensing model. Without proper portability rights, they need to make additional financial investments to run the same workloads in a different home.

AWS says its new Bring Your Own Media (BYOM) service eliminates this duplication. Customers can now reuse their existing Microsoft SQL Server media and licenses on Amazon Relational Database Service (RDS) with no additional licensing fees.

This means enterprises no longer have to justify workload migrations to the cloud against existing licensing commitments and infrastructure investments, AWS said.

“What used to be a licensing barrier between operational SQL Server data and agentic AI is now gone,” AWS data engineer Srikanth Katakam and product marketing manager Colleen Betik wrote in a blog post announcing the service.

Avoiding the double-licensing problem

To drive true value, agentic AI apps must have access to elastic GPU capacity as well as direct, low-latency access to the data they need to reason and make decisions. But, AWS argued, that can be difficult in self-managed data centers and on premises infrastructure with limited access to agentic AI cloud-native services. But a lot of enterprise data lives in Microsoft SQL Server, and until now customers have had to pay for a second license to use a fully managed cloud service like RDS.

Now, with BYOM on Amazon RDS for SQL Server, enterprises can reuse their existing SQL Server Enterprise Edition or Standard Edition licenses through a “lift-and-shift” model. This brings their data into a fully-managed environment.

According to the licensing distribution terms, enterprises must provide their licensed SQL Server Release to Manufacturing (RTM) media to Amazon RDS. They can then upload that media to Amazon S3 and launch BYOM instances. Enterprises must configure AWS License Manager to perform automatic instance tracking.

From there, RDS automates patching, backups, high availability, and monitoring, while providing direct access to agentic AI and analytics services native to AWS. The platform also reports vCPU usage to provide visibility into SQL Server license usage, Katakam and Betik wrote.

“You do not need to choose between protecting your SQL Server licensing investments and giving your data a path to the AWS analytics and agentic AI services redefining what’s possible in the cloud,” they said. 

It’s important to note that this service is only available to enterprises with Microsoft Software Assurance (SA), an add-on which supports mobility and rehosting of existing licenses. Enterprises must verify that their SQL Server licenses comply with Microsoft’s licensing agreement, and that they have a SQL Server License (Standard or Enterprise) with SA. They also must submit a License Mobility Verification Form to Microsoft; it, in turn, will notify AWS once verification is complete.

AWS emphasized that enterprises remain responsible for compliance; it does not block operations if license limits are exceeded.

More control over workloads, loosening Microsoft’s grip

The advantage of this service, explained Mike Leone, principal analyst at Moor Insights & Strategy, is that enterprises can get a Microsoft SQL Server workload onto a managed AWS service without rewriting it for Aurora or paying for the license twice. This means they can modernize on their own schedule rather than being forced into rewrites before they’re ready.

“For a lot of shops, that control over timing is worth more than the license saving itself,” Leone said.

This also loosens Microsoft’s grip on enterprise workloads, because organizations finally have somewhere else to run SQL Server using licenses they already own, he noted. Realistically, their dependency shifts to AWS rather than disappearing entirely, as their data ends up living next to AWS’s AI services.

“For a lot of teams, that’s a trade they’re glad to make for the managed infrastructure and the AI tooling they get in return,” Leone said.

Yaz Palanichamy, a senior advisory analyst at Info-Tech Research Group, also pointed to significant improvements stemming from the migration. Notably, it allows organizations to transition away from static, linear, or reactive storage capabilities towards more dynamically intelligent environments.

“The key is to balance the unification of transactional data towards managed AI and machine learning pipelines,” he said.

Enterprises take on new responsibilities

The catch? Leone noted that enterprises now own the task of licensing compliance. Staying current on SA, the Microsoft maintenance contract that makes any of this legal, and the license mobility rules, “become your headache instead of something baked into the bill,” he said.

Furthermore, he added, lift-and-shift has a way of turning into “lift-and-forget” when enterprises move SQL Server as-is and never actually modernize, “so you end up carrying all the old baggage onto a shinier platform.”

Palanichamy also pointed to skyrocketing AWS costs, since operationalizing AI agents requires a considerable amount of data ingestion and querying. This can potentially be cost prohibitive on RDS for SQL Server.

“One aspect to consider would be the relative time to production value, so that enterprises can better handle the management of volatile AI workloads,” he said.

Just one challenge in the AI race

Although AWS frames licensing complexity as a roadblock to agentic AI, analysts say it’s really just one piece of the puzzle.

Organizations are not in an AI-ready state due to a number of factors, Palanichamy noted. This could be total cost of ownership (TCO)-related, a lack of appropriate acceptable use policies (AUPs), or concerns around security and compliance.

If and when enterprises are ready to adopt AI, they must perform thorough needs analysis/process optimization benchmarking exercises to determine what workflows could benefit from the technology, he said, and, conversely, flag workflows where AI could prove “an impediment or potential disservice.”

Leone also pointed out that moving SQL Server onto RDS doesn’t “magically make your data agent-ready,” nor does it make it smarter. The data proximity and managed plumbing are what actually support agents. Sitting data next to Bedrock and the rest of AWS’s AI services means builders “stop wasting time shipping the data around or building one-off integrations every time an agent needs it.”

Ultimately, though, licensing isn’t the real issue when it comes to AI; it’s more of a migration problem. The real roadblocks are messy data, questionable governance, and teams that aren’t ready to run it in production, and, Leone said, “no change to a license bill touches a single one of them.”

NASA’s Artemis II Moon Mission Research Continues on Earth

5 June 2026 at 20:16

5 min read

NASA’s Artemis II Moon Mission Research Continues on Earth

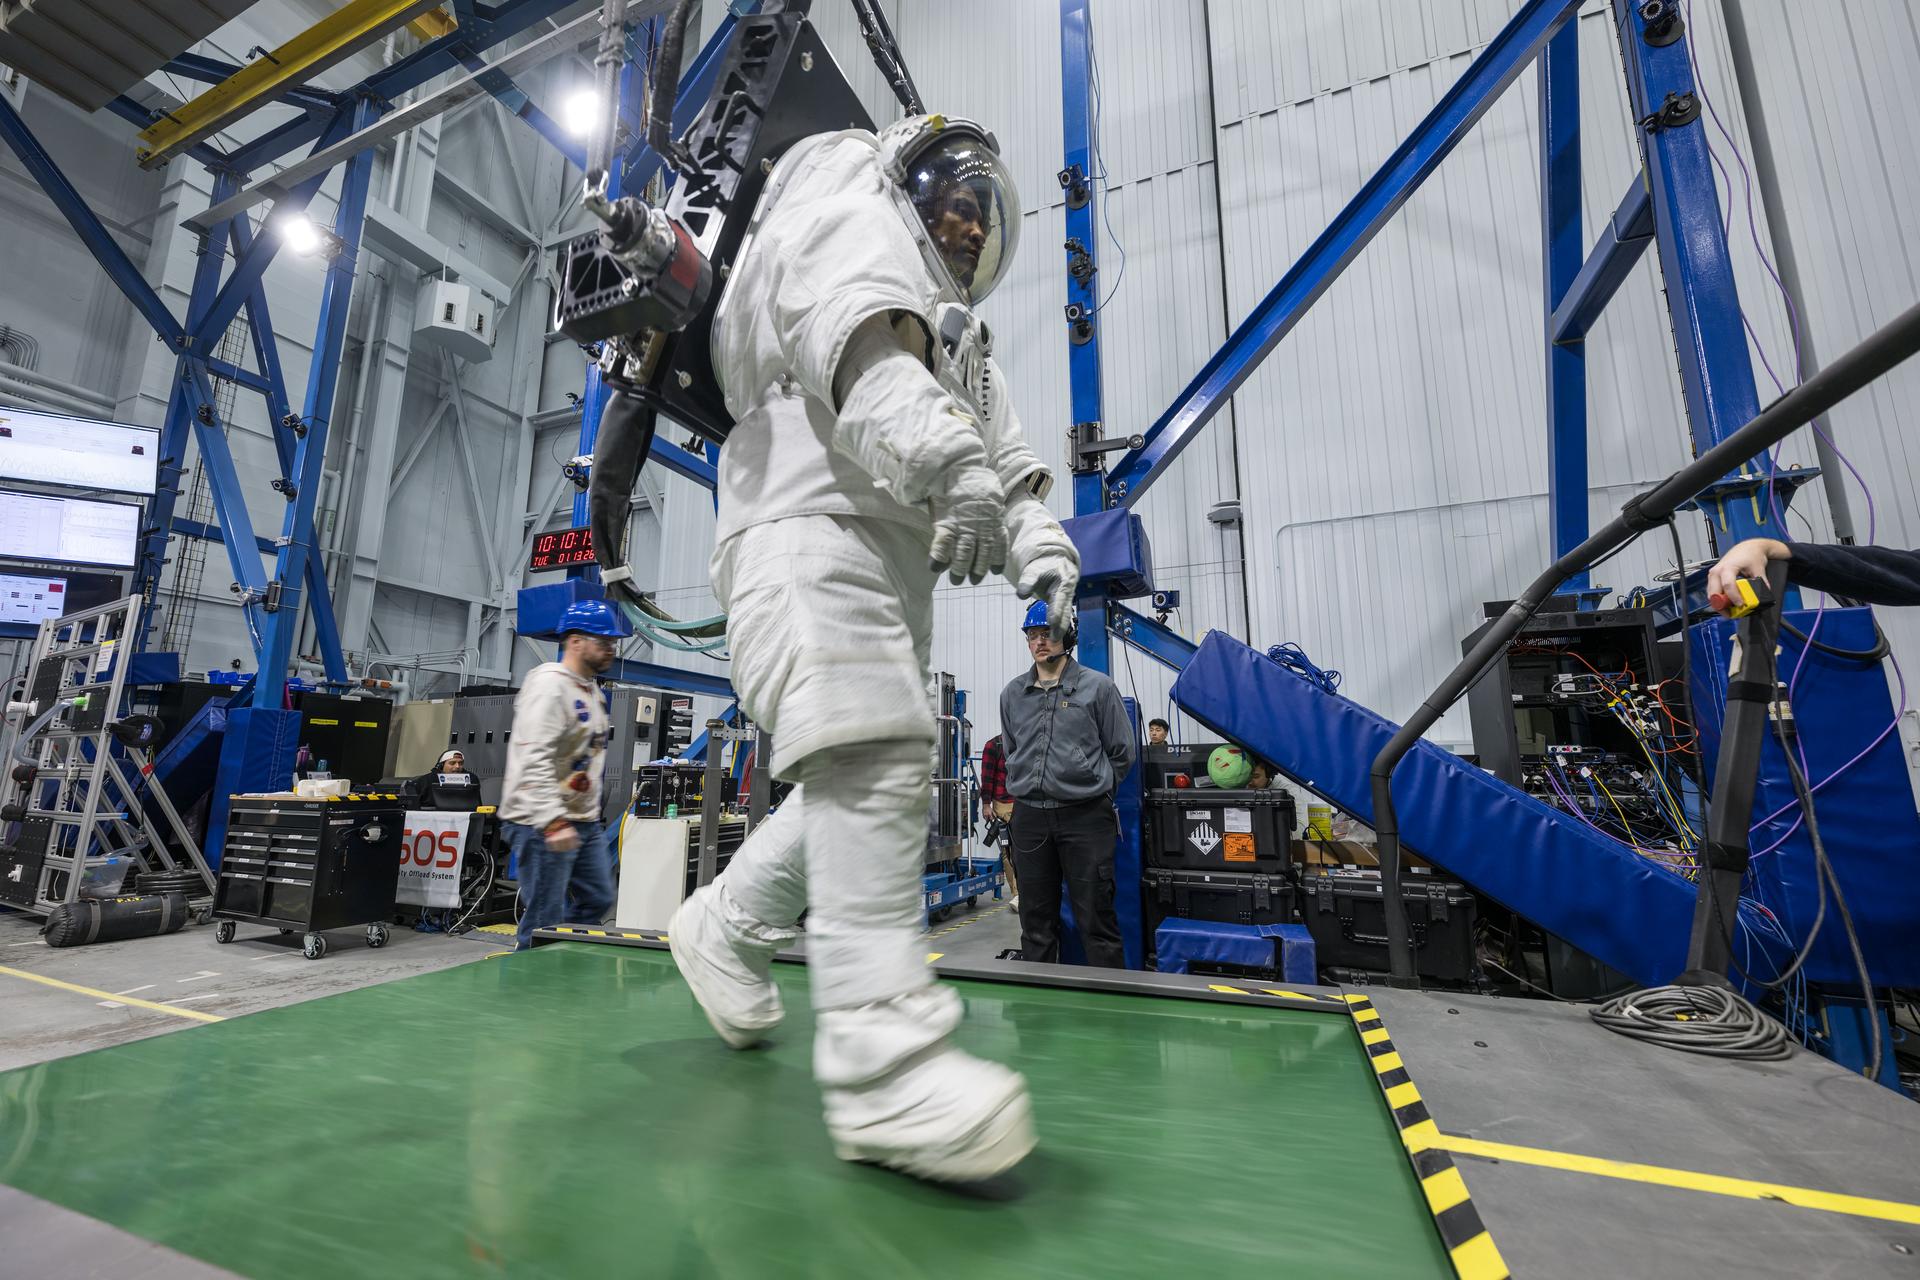
Dressed in a white space suit—with hands gloved, feet booted and head in a helmet with a clear visor—Artemis II astronaut Victor Glover walks on a wide green treadmill. His suit is harnessed to a black machine that is taking the weight off Glover such that, while in the suit, he experiences forces equivalent to lunar gravity. Two people wearing casual clothes and blue hard hats stand in the background, waiting to support Glover and the experiment, should the need arise.  Behind Glover are crisscrossing blue iron beams that stretch to a high ceiling in this industrial building at NASA’s Johnson Space Center.
Artemis II astronaut Victor Glover walks on a treadmill while in a space suit harnessed to NASA’s Active Response Gravity Offload System at NASA’s Johnson Space Center. Glover is simulating a walk on a planetary surface while in a suit that has been offloaded to lunar gravity. Artemis II astronauts completed this and other suited tasks before their mission launched and within a few days of landing, giving researchers a chance to assess how quickly upon landing crews’ bodies adapt to a different gravity. Results will help scientists better understand how soon after landing crews can complete mission-critical tasks on the surface of the Moon or Mars.
NASA/Robert Markowitz

Since NASA’s Artemis II crew members safely splashed down in the Pacific Ocean on April 10 after their record-setting mission around the Moon, science teams have been busy collecting more data and combing through observations collected on the test flight. Results from these science investigations will help support safe human exploration of deep space and provide a blueprint for how future missions will conduct science on the lunar surface as NASA builds a Moon Base and develops an enduring human presence there.

Postflight crew health, performance data

In the hours, days, and weeks after landing, the Artemis II crew members, NASA astronauts Reid Wiseman, Victor Glover, Christina Koch, and CSA (Canadian Space Agency) astronaut Jeremy Hansen, contributed critical data to help the agency understand how the human body reacts to spaceflight. Collecting this data as soon as possible after landing was important to understand how the body adapts from microgravity to Earth’s gravity. The data will inform NASA’s understanding of how quickly crews can complete mission-critical tasks after landing on a planetary surface like the Moon or Mars, where there won’t be landing support personnel to assist.  

Within a day of splashdown, researchers collected a suite of data for the Artemis II Spaceflight Standard Measures study, which is part of a larger effort across the astronaut corps to gather a baseline set of health measurements on blood pressure, heart rate, eye health, and motor control. Crew members also completed a mini obstacle course, which included lying down, standing up, unfurling a rope ladder, ladder climbing, and more, to assess how their bodies were adapting to Earth’s gravity.

Once the crew returned to NASA’s Johnson Space Center in Houston, researchers guided them through further medical check-ups and tests of motor control. Over the next several days, the crew completed obstacle courses wearing spacesuits offloaded to lunar gravity, which is roughly one-sixth the force of Earth’s gravity. Researchers are now analyzing this data to gain insight into how crews may perform as they adapt to the gravity of a planetary surface.

As part of the Immune Biomarkers study, researchers are comparing blood and saliva samples collected after the Artemis II splashdown with samples collected preflight and during the mission. Among other topics, the study investigates whether and how dormant viruses reawaken in astronauts’ bodies while in space.

Some crew members completed postflight cognition tests and a simulated manual spacecraft docking task to assess motor control for the ARCHeR (Artemis Research for Crew Health & Readiness) study. This, combined with data collected through a wrist-worn device while crew members were in space, is used to understand the effect of space hazards on well-being and performance.

Initial data collections for Artemis II health studies concluded 45 days after splashdown. However, medical teams will continually monitor astronaut health throughout the Artemis II crew members’ lifetimes.

Once this data is processed and anonymized, information will be available for scientists to study the effects of spaceflight via a request to NASA’s Life Sciences Data Archive. The results from this work could lead to new technologies and studies that help predict the adaptability of crews on future missions to the Moon and Mars.

Analyzing astronaut-derived organ chips flown around Moon

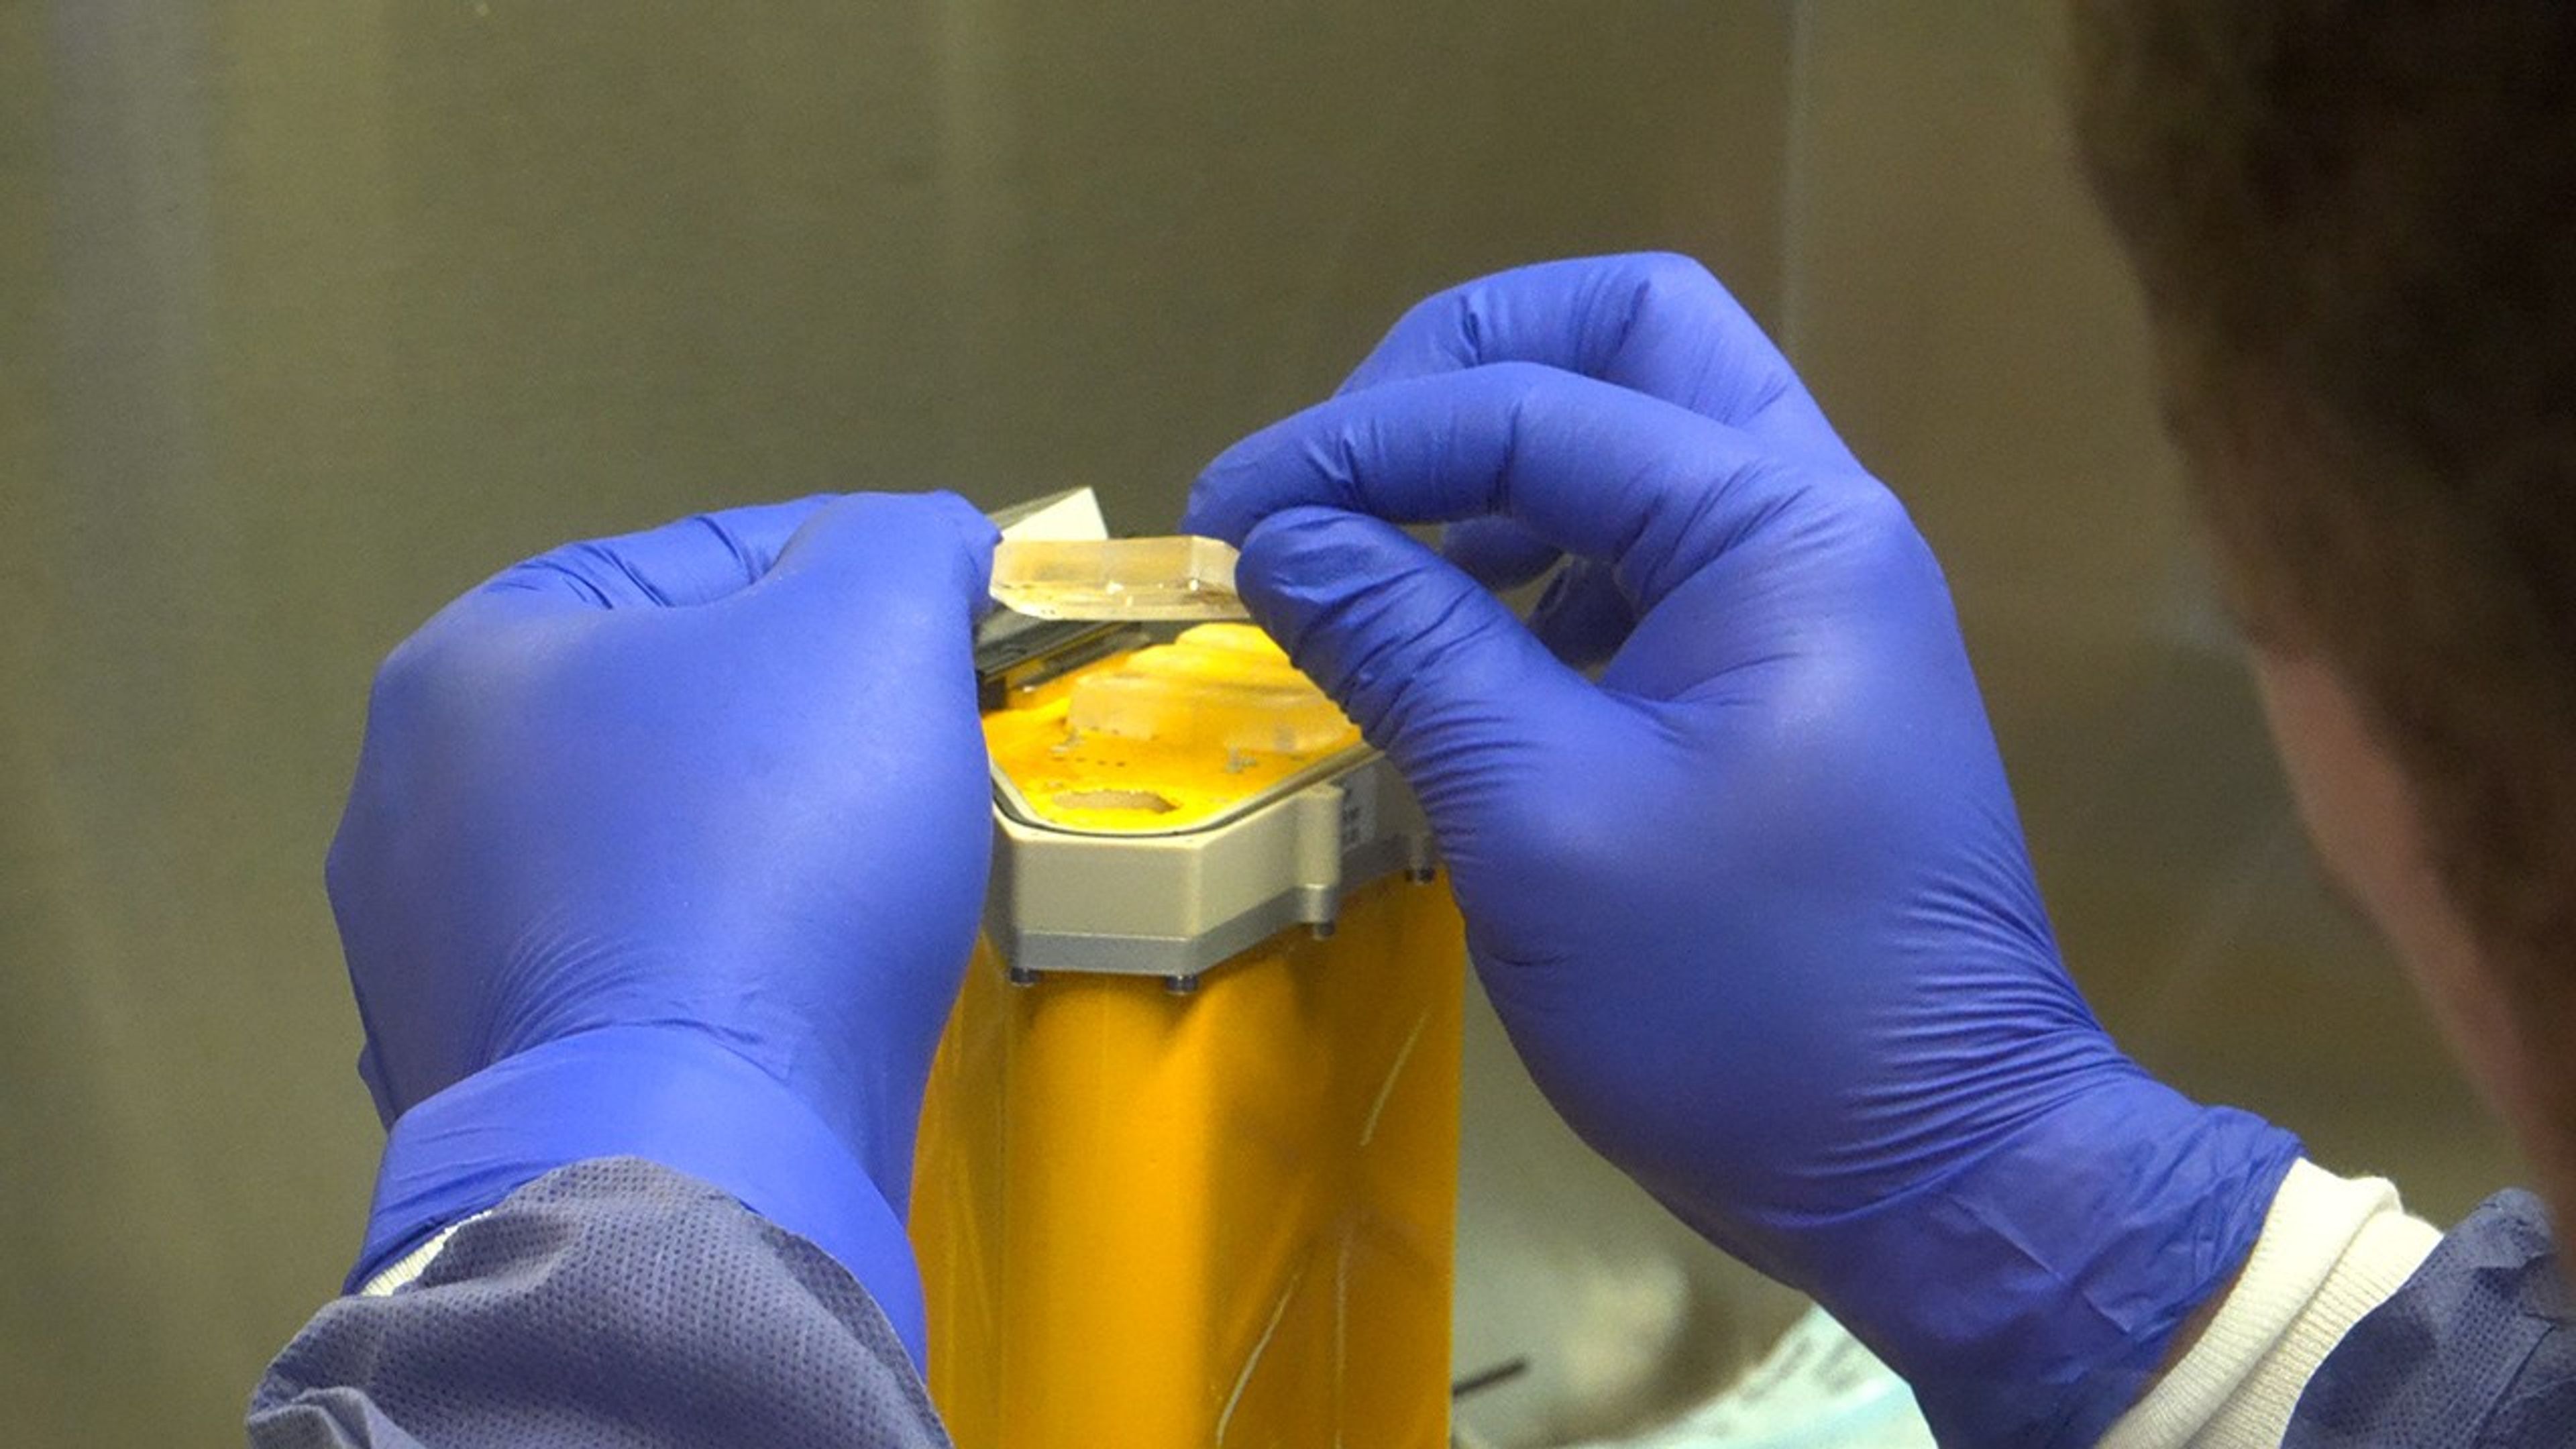
A person wearing blue gloves holds a small cylindrical organ chip.
A scientist handles AVATAR organ chips following their journey around the Moon aboard Orion. The chips contain cells from each astronaut and are being prepared for detailed analysis.
NASA

Organ chips from NASA’s AVATAR (A Virtual Astronaut Tissue Analog Response) investigation are being analyzed at chip developer Emulate’s laboratory in Boston. The organ chips included bone marrow cells from each Artemis II astronaut. They flew around the Moon with the astronauts, and now researchers are studying these organ chips to determine how deep space radiation and microgravity affect human health at the molecular level.

Scientists are comparing the chips flown aboard the spacecraft to ground controls and crew blood samples using advanced techniques, including single-cell RNA sequencing. The analysis will characterize how organ chips model individual responses to spaceflight, which is data that could allow NASA to send future astronauts’ AVATAR chips ahead on missions to develop personalized medical kits. The researchers plan to share early findings at scientific conferences while full analysis continues.

Lunar imagery, audio for data release

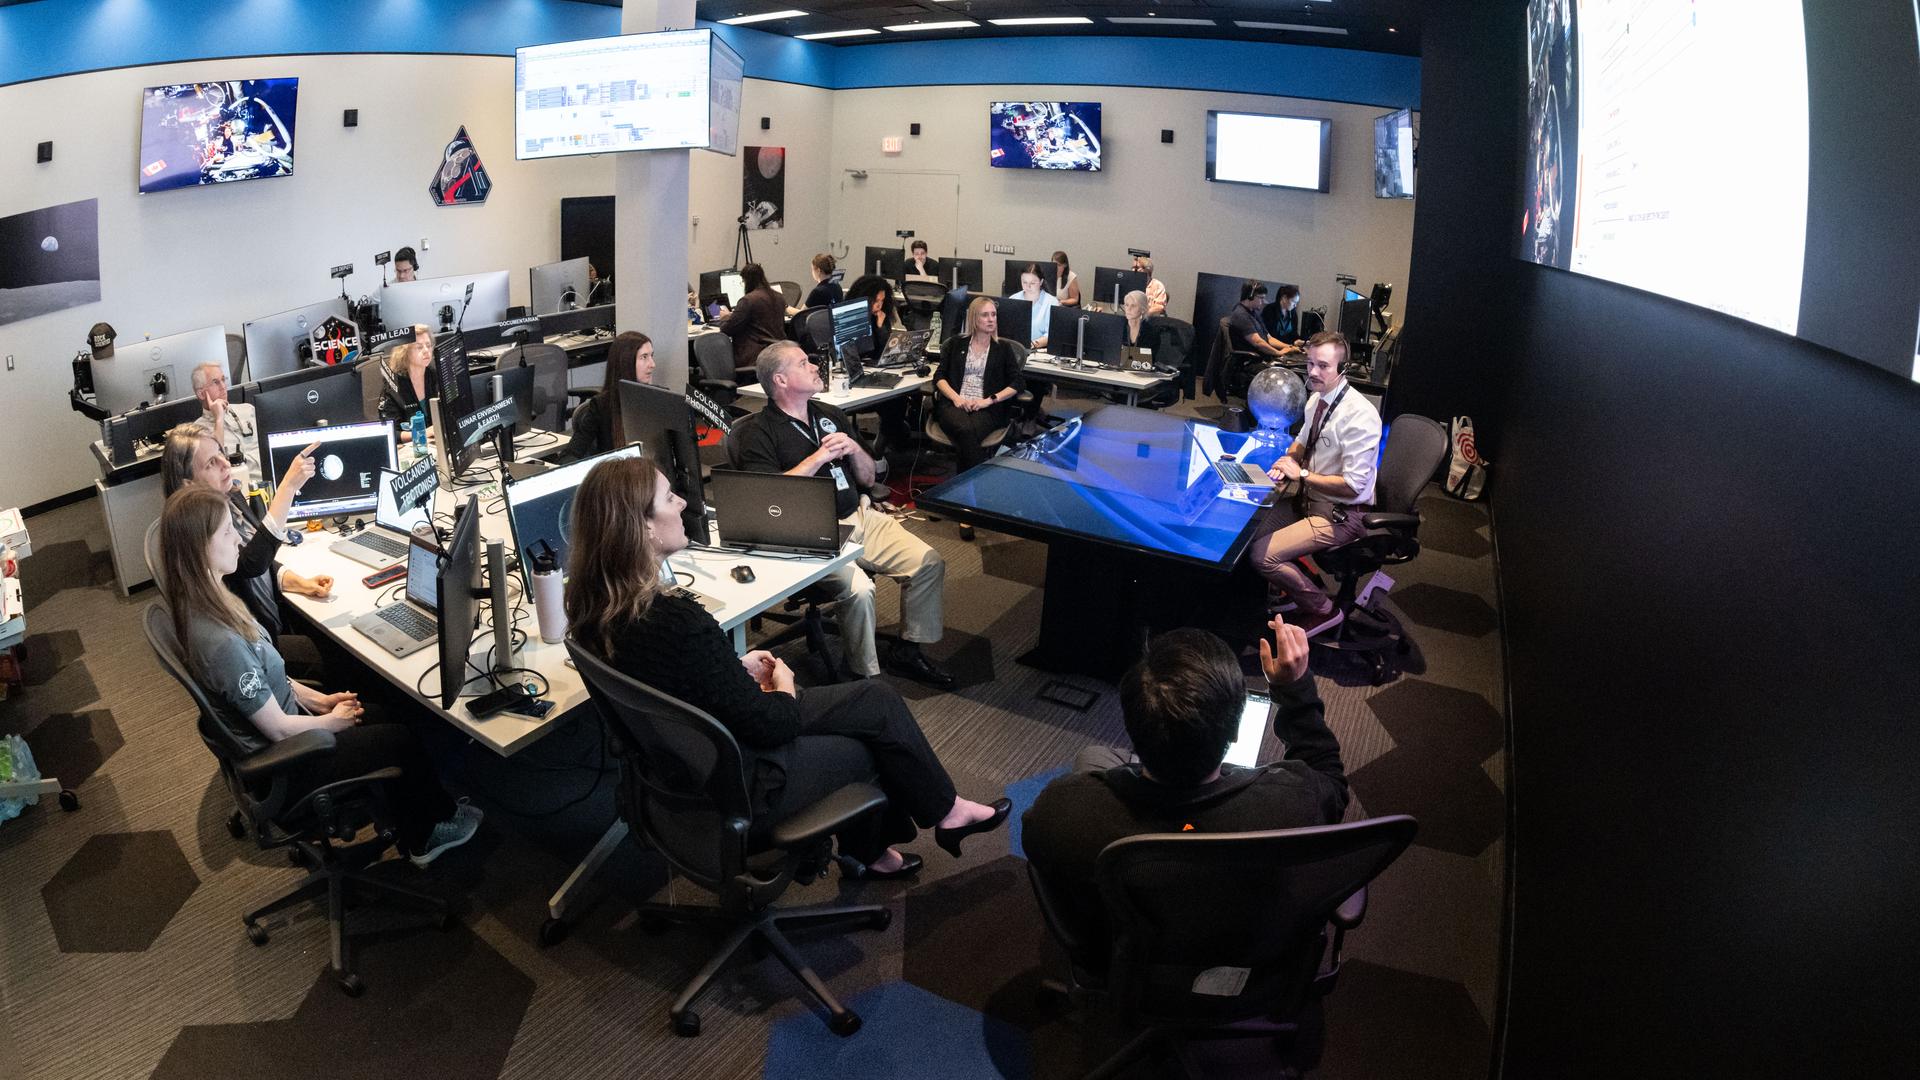
A large operations room filled with about two dozen staff members seated at computer workstations. Rows of desks with multiple monitors face a central area where a person sitting at a glass-topped desk appears to be speaking to the group. Large screens mounted on the walls display space-related imagery and data. Several people are looking towards a large screen hanging on a wall on the right of the image, while others work at their computers. The room is brightly lit, with blue accents along the walls, creating the atmosphere of a space operations or flight control center.
In this April 3, 2026, image, the Artemis II lunar science team is shown working in the Science Evaluation Room in the Mission Control Center at NASA’s Johnson Space Center in Houston. The team is putting together a plan of science observations for the Artemis II crew, which was headed toward the Moon aboard Orion. As they passed the Moon at closest approach on April 6, the crew applied the geology skills they learned in the classroom and in Moon-like environments on Earth as they photographed and described nuances of geologic features such as impact craters, ancient lava flows, and surface cracks and ridges. The crew noted differences in color, brightness, and texture — details that provide clues to surface composition and history.
NASA/Bill Stafford

On April 6, the Artemis II crew members studied features on and around the Moon for nearly seven hours during Orion’s closest approach to the lunar surface. Their work was guided by a minute-by-minute observation plan developed by the Artemis II lunar science team.

Scientists are reviewing the data collected from the mission, which includes images, video, and audio files, to release a report of their initial data interpretations later this year. The report will cover observations of impact flashes, variations in color on the lunar surface, and the shape and texture of faults and ridges. The team also will publish a report on how Artemis II lunar science observations were planned, organized, and executed for the benefit of future Artemis missions.

NASA will publish more than 100 science-related audio recordings with transcripts, as well as approximately 11,500 Earth and Moon image and video files from the mission science campaign, with accompanying data. While many of these images already are public, these records will be available through NASA’s Planetary Data System, a public archive of data from all of NASA’s planetary missions. To get the data ready, the team is converting files into standard formats that anyone can easily open and add information to make the data searchable in NASA’s archive for generations to come.

For more information on NASA’s Artemis II science efforts, visit:

https://www.nasa.gov/humans-in-space/artemis-ii-science/

Karen Fox / Molly Wasser

Headquarters, Washington

240-285-5155 / 240-419-1732

karen.c.fox@nasa.gov / molly.l.wasser@nasa.gov

The post NASA’s Artemis II Moon Mission Research Continues on Earth appeared first on NASA Science.

NASA’s Artemis II Moon Mission Research Continues on Earth

5 June 2026 at 20:16

5 min read

NASA’s Artemis II Moon Mission Research Continues on Earth

Dressed in a white space suit—with hands gloved, feet booted and head in a helmet with a clear visor—Artemis II astronaut Victor Glover walks on a wide green treadmill. His suit is harnessed to a black machine that is taking the weight off Glover such that, while in the suit, he experiences forces equivalent to lunar gravity. Two people wearing casual clothes and blue hard hats stand in the background, waiting to support Glover and the experiment, should the need arise.  Behind Glover are crisscrossing blue iron beams that stretch to a high ceiling in this industrial building at NASA’s Johnson Space Center.
Artemis II astronaut Victor Glover walks on a treadmill while in a space suit harnessed to NASA’s Active Response Gravity Offload System at NASA’s Johnson Space Center. Glover is simulating a walk on a planetary surface while in a suit that has been offloaded to lunar gravity. Artemis II astronauts completed this and other suited tasks before their mission launched and within a few days of landing, giving researchers a chance to assess how quickly upon landing crews’ bodies adapt to a different gravity. Results will help scientists better understand how soon after landing crews can complete mission-critical tasks on the surface of the Moon or Mars.
NASA/Robert Markowitz

Since NASA’s Artemis II crew members safely splashed down in the Pacific Ocean on April 10 after their record-setting mission around the Moon, science teams have been busy collecting more data and combing through observations collected on the test flight. Results from these science investigations will help support safe human exploration of deep space and provide a blueprint for how future missions will conduct science on the lunar surface as NASA builds a Moon Base and develops an enduring human presence there.

Postflight crew health, performance data

In the hours, days, and weeks after landing, the Artemis II crew members, NASA astronauts Reid Wiseman, Victor Glover, Christina Koch, and CSA (Canadian Space Agency) astronaut Jeremy Hansen, contributed critical data to help the agency understand how the human body reacts to spaceflight. Collecting this data as soon as possible after landing was important to understand how the body adapts from microgravity to Earth’s gravity. The data will inform NASA’s understanding of how quickly crews can complete mission-critical tasks after landing on a planetary surface like the Moon or Mars, where there won’t be landing support personnel to assist.  

Within a day of splashdown, researchers collected a suite of data for the Artemis II Spaceflight Standard Measures study, which is part of a larger effort across the astronaut corps to gather a baseline set of health measurements on blood pressure, heart rate, eye health, and motor control. Crew members also completed a mini obstacle course, which included lying down, standing up, unfurling a rope ladder, ladder climbing, and more, to assess how their bodies were adapting to Earth’s gravity.

Once the crew returned to NASA’s Johnson Space Center in Houston, researchers guided them through further medical check-ups and tests of motor control. Over the next several days, the crew completed obstacle courses wearing spacesuits offloaded to lunar gravity, which is roughly one-sixth the force of Earth’s gravity. Researchers are now analyzing this data to gain insight into how crews may perform as they adapt to the gravity of a planetary surface.

As part of the Immune Biomarkers study, researchers are comparing blood and saliva samples collected after the Artemis II splashdown with samples collected preflight and during the mission. Among other topics, the study investigates whether and how dormant viruses reawaken in astronauts’ bodies while in space.

Some crew members completed postflight cognition tests and a simulated manual spacecraft docking task to assess motor control for the ARCHeR (Artemis Research for Crew Health & Readiness) study. This, combined with data collected through a wrist-worn device while crew members were in space, is used to understand the effect of space hazards on well-being and performance.

Initial data collections for Artemis II health studies concluded 45 days after splashdown. However, medical teams will continually monitor astronaut health throughout the Artemis II crew members’ lifetimes.

Once this data is processed and anonymized, information will be available for scientists to study the effects of spaceflight via a request to NASA’s Life Sciences Data Archive. The results from this work could lead to new technologies and studies that help predict the adaptability of crews on future missions to the Moon and Mars.

Analyzing astronaut-derived organ chips flown around Moon

A person wearing blue gloves holds a small cylindrical organ chip.
A scientist handles AVATAR organ chips following their journey around the Moon aboard Orion. The chips contain cells from each astronaut and are being prepared for detailed analysis.
NASA

Organ chips from NASA’s AVATAR (A Virtual Astronaut Tissue Analog Response) investigation are being analyzed at chip developer Emulate’s laboratory in Boston. The organ chips included bone marrow cells from each Artemis II astronaut. They flew around the Moon with the astronauts, and now researchers are studying these organ chips to determine how deep space radiation and microgravity affect human health at the molecular level.

Scientists are comparing the chips flown aboard the spacecraft to ground controls and crew blood samples using advanced techniques, including single-cell RNA sequencing. The analysis will characterize how organ chips model individual responses to spaceflight, which is data that could allow NASA to send future astronauts’ AVATAR chips ahead on missions to develop personalized medical kits. The researchers plan to share early findings at scientific conferences while full analysis continues.

Lunar imagery, audio for data release

A large operations room filled with about two dozen staff members seated at computer workstations. Rows of desks with multiple monitors face a central area where a person sitting at a glass-topped desk appears to be speaking to the group. Large screens mounted on the walls display space-related imagery and data. Several people are looking towards a large screen hanging on a wall on the right of the image, while others work at their computers. The room is brightly lit, with blue accents along the walls, creating the atmosphere of a space operations or flight control center.
In this April 3, 2026, image, the Artemis II lunar science team is shown working in the Science Evaluation Room in the Mission Control Center at NASA’s Johnson Space Center in Houston. The team is putting together a plan of science observations for the Artemis II crew, which was headed toward the Moon aboard Orion. As they passed the Moon at closest approach on April 6, the crew applied the geology skills they learned in the classroom and in Moon-like environments on Earth as they photographed and described nuances of geologic features such as impact craters, ancient lava flows, and surface cracks and ridges. The crew noted differences in color, brightness, and texture — details that provide clues to surface composition and history.
NASA/Bill Stafford

On April 6, the Artemis II crew members studied features on and around the Moon for nearly seven hours during Orion’s closest approach to the lunar surface. Their work was guided by a minute-by-minute observation plan developed by the Artemis II lunar science team.

Scientists are reviewing the data collected from the mission, which includes images, video, and audio files, to release a report of their initial data interpretations later this year. The report will cover observations of impact flashes, variations in color on the lunar surface, and the shape and texture of faults and ridges. The team also will publish a report on how Artemis II lunar science observations were planned, organized, and executed for the benefit of future Artemis missions.

NASA will publish more than 100 science-related audio recordings with transcripts, as well as approximately 11,500 Earth and Moon image and video files from the mission science campaign, with accompanying data. While many of these images already are public, these records will be available through NASA’s Planetary Data System, a public archive of data from all of NASA’s planetary missions. To get the data ready, the team is converting files into standard formats that anyone can easily open and add information to make the data searchable in NASA’s archive for generations to come.

For more information on NASA’s Artemis II science efforts, visit:

https://www.nasa.gov/humans-in-space/artemis-ii-science/

Karen Fox / Molly Wasser

Headquarters, Washington

240-285-5155 / 240-419-1732

karen.c.fox@nasa.gov / molly.l.wasser@nasa.gov

❌