Kristi West, a lead researcher from the University of Hawaiʻi at Mānoa's Health and Stranding Lab, found that 23% of the pilot whales she examined over a 13-year period had plastic in their stomachs.
Imaginez un monde dans lequel nous pourrions émettre autant de CO2 que nous le voulons, sans crainte des conséquences, puisque tous ces gaz à effet de serre seront ensuite stockés dans un endroit sûr. Cela paraît trop beau pour être vrai, et pourtant, c'est ce qu’essaye de faire l’entreprise...
The morning of October 29, 2020, was cool and clear in Nazaré. This coastal town in Portugal is famous for its beaches and vibrant nightlife. It’s also known for its waves. They’re among the largest surfable ones anywhere. Every year, surfers flock here to ride down the monsters that rise out of the sea, especially off the north end of the beach. On this day, conditions were perfect for record-breaking waves.
In the early morning, a jet ski towed German surfer Sebastian Steudtner away from shore to where he met a towering wall of water. The jet ski zipped away to safety in one direction as Steudtner coasted right up to the breaking point.
For 25 seconds, he tore down the wave. As the water broke above him, he raced to the side. Tears streamed out of his eyes because of the wind. “My face was melting,” he later told a Spanish newspaper. He had never felt faster on a surfboard.
A surfer rides a huge wave off the coast of Hawaii. DAVID FLEETHAM/ALAMY
Even for Nazaré, this wave had been a colossus. After Steudtner’s ride, scientists and surfing officials studied footage. They determined this wave had roared in at 26.21 meters (85.99 feet) tall. He had set a new record for the tallest wave ever surfed.
The previous record — 24.38 meters — was also set at Nazaré, in 2017. Steudtner may have since broken his own record. In February 2024, he surfed a wave estimated to be 28.57 meters (93.73 feet) tall. Drone-mounted cameras gauged that height (which hasn’t been formally confirmed) using tech designed in part by Porsche, the German sports car company.
Extreme waves rise from waters around the world. In some places, like the coast of Portugal, they’re the norm. On average, Nazaré’s waves measure 15 to 20 meters (50 to 65 feet) tall.
But those aren’t even the biggest or most dangerous waves known. Enormous waves called tsunamis can cause widespread destruction when they reach shore. Then there are rogue waves: unusual, solitary waves that rise higher than all the waves around them. These can be particularly dangerous for ships that don’t see them coming.
Scientists have found other unusual, risky waves. So-called “sneaker waves,” for instance, can sweep into a beach much farther than expected. People die every year off the U.S. Pacific coast and elsewhere as such sneakers pull them out to sea.
Big waves aren’t limited to oceans, either. Earthquakes or storms can cause seiches (saysh-əs) in an enclosed body of water, such as a lake. These waves roll back and forth like water splashing in a bathtub. Some waves we can’t even see. Internal waves can move below the surface of a waterway, for example.
Wind blowing over an ocean or lake nudges the water to roll in circular motions. When those circular flows near the shore, their bottoms catch on the seafloor and slow down. The faster-moving water on top tips over and curls into a wave that crashes on the beach.BlueRingMedia/Shutterstock
Some scientists study waves because they’re simply fascinating.
But waves are important in many areas of science. Climate researchers are curious about waves that form where air and water meet. Oceanographers study them to understand how energy moves through water and to find ways to better protect coastlines. Knowing more about waves can help navigators find safer shipping routes. Physicists study waves to understand how moving fluids behave. And watery waves can provide insight into the movement of light and sound.
Tori Tomiczek is an ocean engineer at the U.S. Naval Academy in Annapolis, Md. By learning what types of waves cause the most destruction after hurricanes and other big storms, she hopes to design buildings that will better survive them. But, she adds, there’s another reason to study waves. They’re inherently captivating, she says. “I have always just loved the ocean.”
A wave represents pure energy moving through a fluid. Sometimes it’s a lot of energy. The largest wave ever recorded slammed into the protected Lituya Bay in southeast Alaska in 1958. This wave reached a towering 524 meters (1,720 feet).
Scientists determined its height by observing that all trees and loose soil lower than that height had vanished. It created a new treeline. The bay itself was only about 220 meters (720 feet) deep, which means the wave was more than twice as tall. Imagine standing on the shore and seeing an approaching wall of water that was far taller than the Empire State Building.
On July 9, 1958, an earthquake set off rockfall into the ocean near Lituya Bay, Alaska, which created a wave 524 meters (1,720 feet) tall. Spots along the shore that appear lighter are where trees were stripped from the ground.Don J. Miller/USGS
Three fishing boats had anchored in that bay on the night of July 9. Just after 10:15 p.m., a wave about 30 meters (98 feet) high began moving into the bay. One boat lifted its anchor and tried to escape. Its two occupants were never seen again. A second boat, crewed by a man and his seven-year-old son, made it over the crest of the wave and skated down the other side. The captain of the third boat later reported that when his boat was lifted by the wave, he found himself looking down at the trees on the rugged hillsides. His boat was destroyed. He and his wife survived by holding on to debris.
How does a wave get to be so mammoth? The 1958 monster began with a powerful magnitude 7.8 earthquake. It shook the area for a few minutes. Some 90 million tons of rock plunged into the ocean. This released a tremendous amount of energy, causing big waves to rise and race away.
Earthquakes often give rise to big waves. On December 26, 2004, a magnitude 9.1 earthquake rocked Southeast Asia. The tsunami it unleashed reached 30 meters (98 feet) tall by the time it hit Indonesia. More than 200,000 people across the Indian Ocean died, making this one of the deadliest natural disasters in history.
On March 11, 2011, another magnitude 9.1 quake triggered a tsunami off the coast of Japan. It swept ashore killing about 18,000 people there — and caused the meltdown of three nuclear reactors.
Powerful tsunamis are rare, but some, like the 2011 Japan tsunami, can pull buildings out to sea.Pictura Collectus/Alamy
From seasonal to surprising
Storms, too, whip up big waves. So can the shape of the seafloor. Geologists have traced the big surfing waves off Nazaré, for instance, to a deep undersea canyon — one of the largest in Europe.
That narrow canyon runs east to west. It stretches from near the coast to about 210 kilometers (130 miles) offshore. Waves streaming in over the canyon pile up higher and higher. When they merge with waves coming from other directions, they can produce true monsters. The October 2020 Nazaré wave had yet another contributor: energy from the remnants of a hurricane that had recently passed through. By the time Steudtner took to the water, the waves had become ginormous.
Waves coming into Nazaré Bay get magnified by a 210-kilometer-long (130-mile-long) canyon offshore. On a typical winter day (left), the waves measure around 15 meters (about 50 feet) high, making this shore a popular spot for big-wave surfers. On October 29, 2020 (right), a distant hurricane sent much larger waves toward shore and kicked up sediment from the seafloor. The massive waves hitting Nazaré’s North Beach also created a thick band of white foam along the shoreline.Left: NASARight: NASA
Weather and earthquakes can’t explain every type of wave. Consider rogues, which were once the stuff of legends.
More than 500 years ago, Christopher Columbus reported a giant wave nearly swamped his ship as it sailed through a strait off the coast of present-day Venezuela. And in 1826, French explorer Jules Dumont d’Urville described a huge, catastrophic wave in the Indian Ocean. At the time, almost no one believed him.
Today, oceanographers define rogue waves as those at least twice the average height of the waves around them. And they can emerge without warning.
The first rogue wave ever observed by scientists, known as the Draupner Wave, hit an oil platform in the North Sea on January 1, 1995. It damaged railings and equipment. Laser sensors mounted on the platform revealed the wave reached 25.6 meters (84 feet) tall.
This wave didn’t injure anyone. But that wasn’t true for three rogue waves in 2010, each less than half the Draupner’s height. After leaving Barcelona, Spain, the cruise ship Louis Majesty was headed for Genoa, Italy. But somewhere off the French coast, a giant rogue wave pummeled the ship, tossing it around and breaking windows. Two passengers died.
Physicists do not agree on how rogues form. Some have investigated the idea of “crossing waves.”
When lines of waves intersect, they can pile up on each other, boosting their height. Two waves with the same height can combine to form one far taller wave. This is called constructive interference. The energy from individual waves gets concentrated into a larger wave that stands taller, explains Francesco Fedele. He’s an engineer at the Georgia Institute of Technology in Atlanta.
“When you have an intensification of waves, they can grow up more and more,” he says.
But that’s not the whole story.
Waves are complicated. They are shaped both by the water and the air. When they collide, something called “second order” effects may develop. These are like side effects of side effects. You can get unexpected behaviors and unexpected heights not predicted by just adding individual waves together.
In recent work, Fedele showed how second-order effects can give rise to rogue waves. This work may not only help scientists better understand waves but also assist navigators who steer ships through rough waters. Energy companies and government agencies have used his models to help forecast where these waves will emerge and how to withstand them.
How to measure a big wave
Miguel Onorato is an oceanographer at the University of Torino in Italy. He’s studied the behaviors of rogues and other waves for more than two decades. In June 2018, he boarded the S. A. Agulhas II, a ship designed to support scientific research. It was headed from Cape Town, South Africa, to Antarctica.
This was winter in the Southern Hemisphere. Some scientists on board planned to study birds, including albatrosses and penguins. Others wanted to measure pollution in the water. An artist came along looking for inspiration. Onorato was part of a team that came to study waves.
Winds are relentless and strong in this part of the world. They whip through the Southern Ocean at the highest average speeds on the planet. Storms rage all the time. In 2022, scientists found two sources of tempests here. They’re so strong partly because of how energy travels through the ocean, and partly because there are fewer mountains in the Southern Hemisphere. Mountains can break up storm systems and winds.
Strong winds mean big waves. And waves here can be enormous. “The boat was rolling. I got so sick,” Onorato recalls. “It was incredible.” The artist was seasick almost the entire voyage. But once Onorato was back on his feet, his team set up its equipment on deck.
In the past, he says, scientists measured big waves with floating buoys. Their instruments can track how far up and down the water’s surface moves them. By tracking the rise and fall of these buoys, scientists had a pretty good idea of a wave’s shape.
But the buoys gave only one point of information. They didn’t show how the waves were changing as they moved. To overcome that problem, one of Onorato’s colleagues developed a new system. It uses stereoscopic vision.
The idea was inspired by human vision, Onorato says. Because the brain combines signals from two eyes, people can see in three dimensions. (It’s why someone with only one functional eye will struggle with depth perception.)
Training its two cameras on the same patch of sea gave their new system 3-D vision. A computer helped analyze the resulting video and determine wave heights, as well as other behaviors of the sea.
Rogue waves can form when strong winds cause steep waves to form and intersect, measurements by Onorato’s team showed. These rogues can rise higher than would be predicted just by adding two waves together.
Researchers at Oregon State University run a laboratory equipped with large water tanks and machines that produce waves. Here, researchers can explore how tsunamis and other waves interact with buildings, bridges and other structures.Oregon State University
Protecting people
Knowing how and when big waves form offers benefits beyond satisfying scientific curiosity. For instance, Tomiczek at the U.S. Naval Academy wants to help make coastlines safer.
She’s run some of her experiments in an unusual laboratory at Oregon State University in Corvallis. Its long, narrow tank of water — a wave flume — produces big waves. Scientists study how those waves form and what slows them. Tomiczek was part of a group studying how the plume’s waves damaged a house that had been built at one-tenth scale. Learning which types of waves are the most destructive may help her design structures that will better withstand them.
Scale-model buildings are subjected to simulated waves to test how the structures react to water forces. Oregon State University
That research calculated how much force a wave exerts on a structure horizontally. This can help engineers figure out the best way to build and which materials to use. These studies could also show how to improve other structures battered by waves, such as bridges and highways.
In other work, Tomiczek is studying how natural features — such as mangrove trees and coral reefs — can buffer waves. Nature may help us find ways to better protect coastlines, she says.
Such data may also help at-risk communities. If people better understand the local threat that big waves pose, they can prepare. Tomiczek says they can build stronger structures and plan how to help each other when a destructive one hits. This could build “kind of a community resilience,” she says.
Her wave research was launched by her love of the ocean. But Tomiczek also enjoys thinking about how the ocean connects people around the world. At one beach, she says, people can surf or bodysurf or enjoy the waves. Somewhere on the other side of the country or world, the waves might be too powerful for swimming.
“When I was living on the West Coast, we called [the ocean] the mighty Pacific because it’s this different, untamable, incredible thing,” she says. If you love the ocean, Tomiczek says, it’s hard not to wonder about what makes a big wave. “It’s just so cool to me to think about all of the incredible processes that are behind that.”
The Caspian Sea, the world's largest inland body of water, is in major trouble. Since the mid-1990s, this saline lake, located between Europe and Asia, has lost an area nearly the size of Sicily. But until now, it wasn't clear why.
Researchers finally provided answers in a study published June 5 in the journal Earth's Future. Using ground- and satellite-based observations, they connected falling water levels to a drastic drop in river inputs from Iran, Turkmenistan, Azerbaijan, Kazakhstan and Russia, all of which border the Caspian Sea.
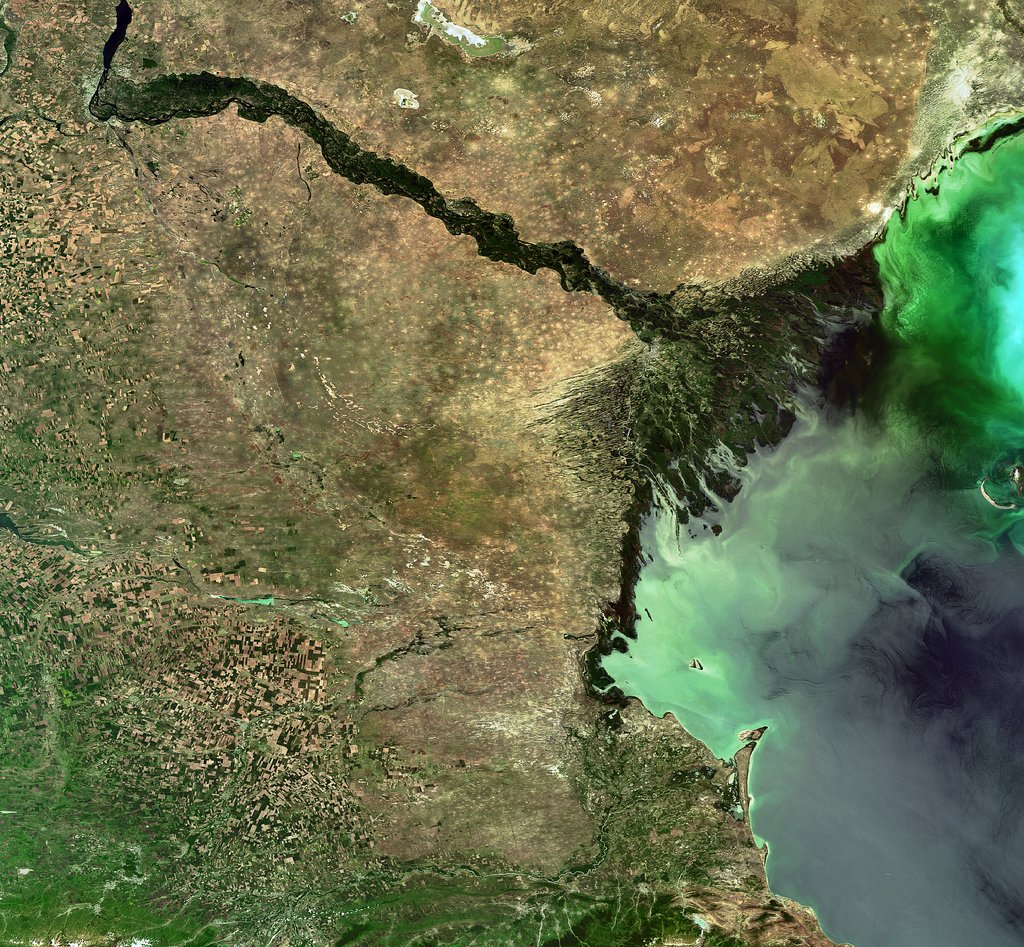
The team particularly highlighted losses from Russia's Volga River, the longest river in Europe, which supplies roughly 80% of the Caspian's inflow.
To find out why the Volga is discharging less water into the Caspian Sea now than it did 30 years ago, we spoke with Amir AghaKouchak, a co-author of the study and professor of civil and environmental engineering at the University of California, Irvine.
AghaKouchak, who directs UC Irvine's Center for Hydrometeorology and Remote Sensing, explained why river inputs have dropped and how decades of water withdrawals have put the Caspian Sea on a path to collapse. He also touched on a solution to this crisis — and revealed why Russia's hunger for ammunition to attack Ukraine is making it harder to save the Caspian Sea.
Sascha Pare: Falling water levels in the Caspian Sea have been attributed to natural variability, and more recently, there's been a focus on climate change and increased evaporation due to rising temperatures. But what did the results of your study show?
Amir AghaKouchak: People quickly jump to conclusions about climate change. Of course, that is important, but it cannot explain the change that we have observed. Over the last 30 years, water levels in the Caspian Sea have shrunk by around 2 meters [6.5 feet] or so. Just to put things in perspective, this translates to about 24,000 square kilometers [9,300 square miles] of sea area loss — about 5%. When we look at drivers, we notice that rainfall hasn't changed significantly over the lake and upstream, so the decline cannot be explained simply by changes in rain.
Evaporation has increased, so it explains maybe about one-third of the change. There is less water in the lake, and that indicates there's probably some water lost along the way. We don't have a lot of human-related data — for example, water withdrawal for irrigation or groundwater wells. That area is very difficult; the countries are not open to sharing data. A lot of our results are based on looking at proxies. Our interpretation is that temperature caused about 30% of the change and the rest is probably because of human activities.
SP: Which human activities does your research suggest are responsible for the Caspian Sea's decline?
AA: Several of the countries on the Caspian Sea have built large dams — Russia, for example. They are all desperate for hydropower. All of the countries around the lake [have also built infrastructure to supply agriculture], and one reason is that they want to create jobs and improve the local economy. Water demand is increasing in all those countries around the Caspian Sea. It's not surprising to see lakes drying or groundwater levels falling.
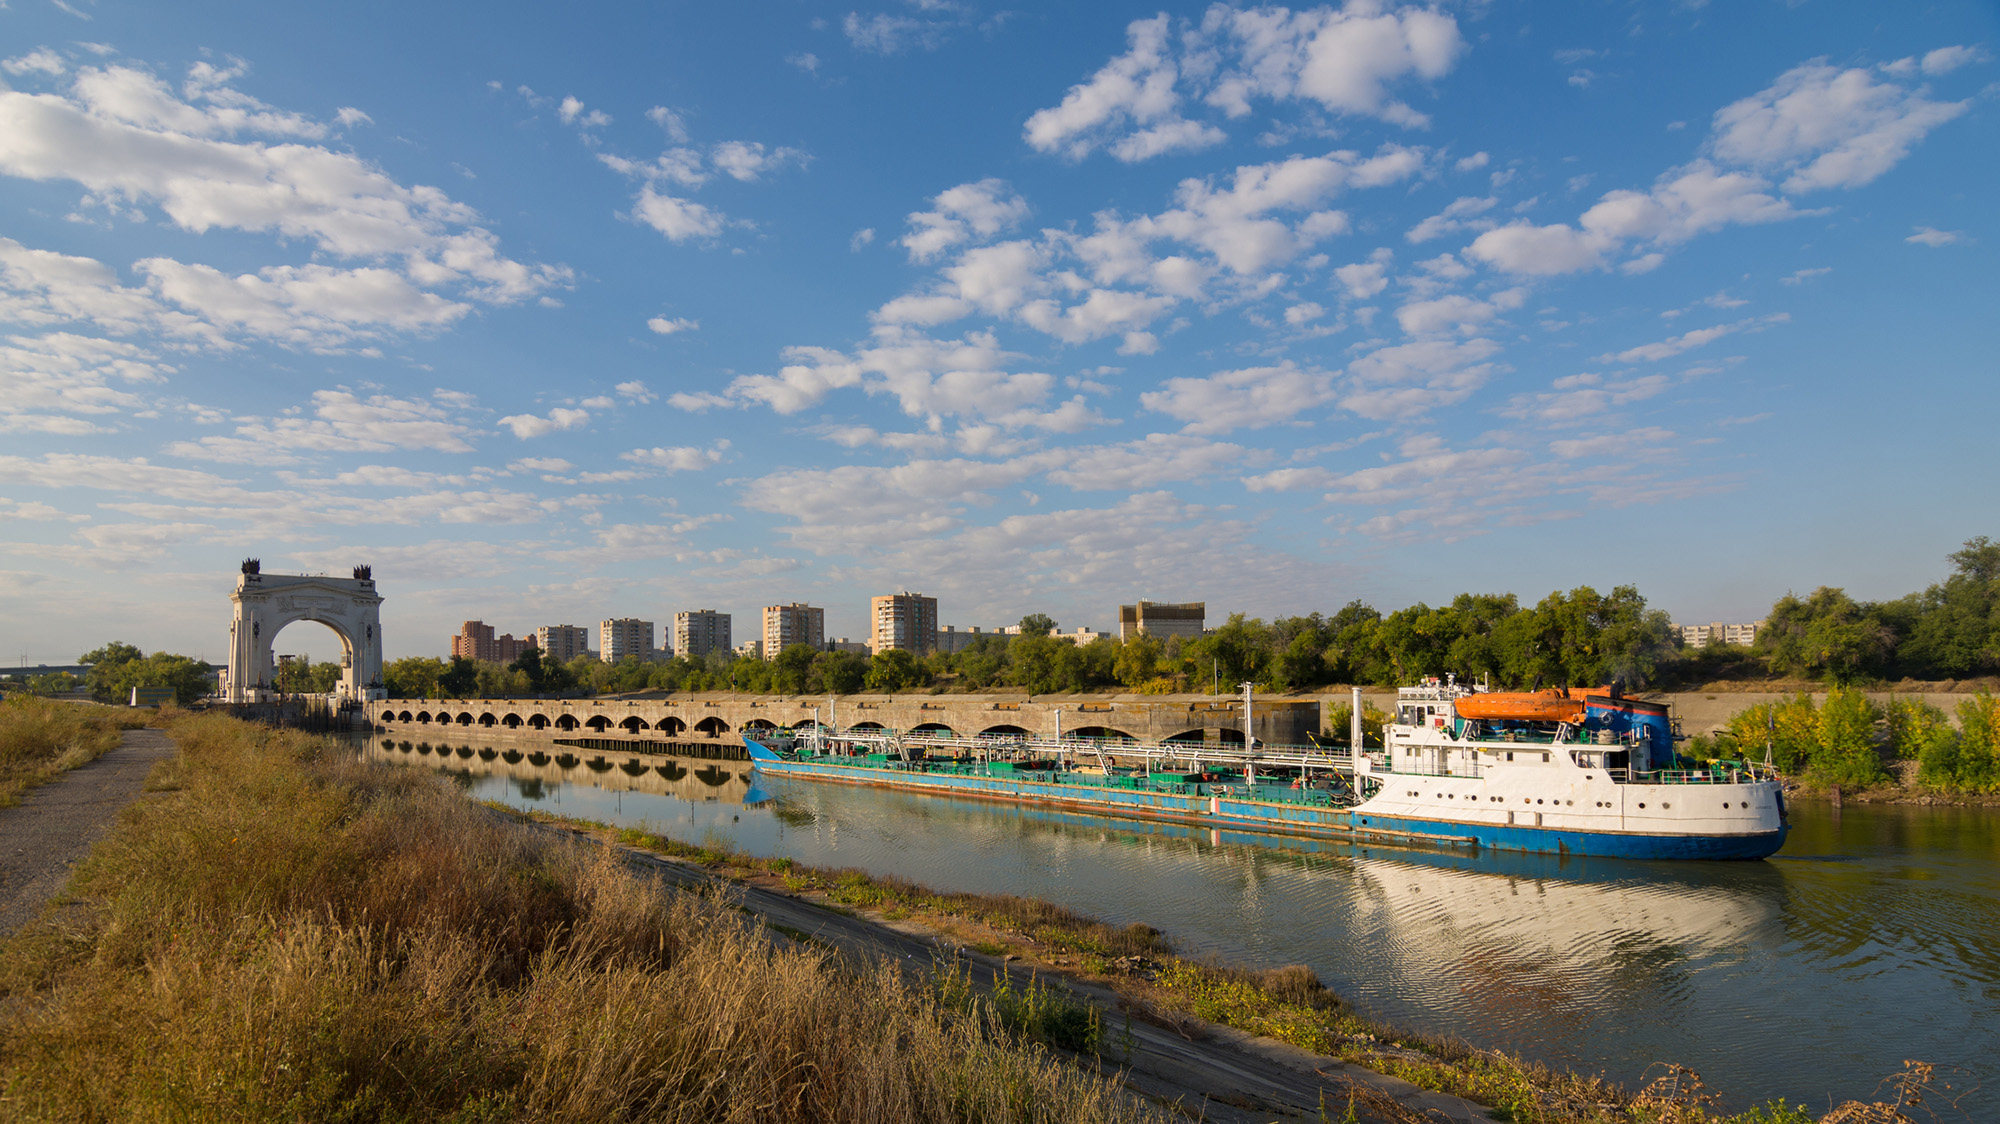
It's hard to find data about how much water countries are using; they keep data very private, especially places like Russia. We don't have detailed information, but the Volga-Don Canal in Russia is one of the projects that is contributing to this crisis. [Editor's note: The Volga-Don Canal is a ship canal that connects the Volga and Don rivers at their closest points.]
Opened in 1952, the Volga-Don Canal connects the Volga, which flows into the Caspian Sea, and the Don, which empties into the Sea of Azov (a northern extension of the Black Sea). (Image credit: Gaika102 via Getty Images)
But we cannot blame this whole thing on that. We have to be careful with our language; we can't say one project is responsible. Most likely, this is the collective impact of many different small withdrawals from here and there, overall contributing to a significant decline in the Volga River outflow into the lake. In the paper, we have different rivers, but the Volga dominates because it's the largest river. The Volga has a higher impact than all the other rivers combined. There are lots of demands along that river basin.
SP: Did you expect human activities to play such a big role, or were you surprised?
AA: We did not have any expectations at the beginning. In fact, when we started this project, I reached out to a lot of colleagues from neighboring countries around the Caspian Sea. We didn't want to do it on our own, sitting in California, looking at another area of the world, without having local people involved. If you look at the co-authors, you see people from Azerbaijan, Iran, Kazakhstan — so, we have local experts. We thought this was really important to have those perspectives. I didn't want to reflect the opinions of only one research group. What we have here is the collective opinion of people who have not met in person; we only exchanged emails to look at the results, and then we came up with those conclusions.
We do have a Russian involved, but not from an official Russian institution. I thought this was really important, because there's more back-and-forth [with a large group of people]. If two people have to convince themselves of an idea, it's much easier than with 20. Also, we brought in people from other countries who had projects in the area; for example, there is one group from Finland and another group from Germany. We tried to come up with something that this large group of people could agree on. It was not easy, but it worked out.
The Volga River supplies roughly 80% of the Caspian Sea's inflow, but huge water demands have decreased its flow. (Image credit: ESA, CC BY-SA 3.0 IGO )
SP: What is the worst-case future scenario for the Caspian Sea if shoreline countries fail to decrease their water demands?
AA: My concern is that, in the same general area, we have the Aral Sea, which is now about 5% to 10% of what it used to be, and Lake Urmia, in northwest Iran, that has also shrunk really fast and is now very small, with low levels of ecological activity. So we have two smaller lakes in a very similar climate that, from an ecological perspective, are dead. Because we have seen those degrade, we have to consider that this is the worst-case scenario for the Caspian Sea, too.
The Caspian Sea is much, much bigger. I hope it doesn't happen, but it's on the same path. Again, it's much larger, so it would probably take 100 years [to shrink as much as the Aral Sea and Lake Urmia], even with the current trend. But because we have seen those lakes shrink really fast, it deserves attention. Due to the size of this lake, the potential impacts will be huge. Even if 20% of the Caspian Sea dries out, the consequences will be very significant. It would be a disaster.
SP: You mentioned that drying lakes can become ecologically "dead." What other impacts could the Caspian Sea's falling water levels have on the surrounding landscape and people?
AA: The lake's retreat will expose the lake bed, and because it's saline, you have all kinds of minerals that will be exposed. With the next strong wind, they will go into the air. The health impacts include respiratory diseases, and even eye diseases, that are linked to salt minerals in the atmosphere. Those are the immediate consequences. Additionally, those minerals can travel long distances. In general, salt deposition on agricultural land reduces productivity. It takes a while, but if those lands are exposed for a long time, this will have an impact on the agricultural sector in those areas, which means potential food security issues. We don't exactly know what those materials are on the lake bed, so it's hard to know precisely what the consequences will be.
There is also serious shipping happening in this region. Right now, most of the shrinking is happening in the Caspian Sea's northern part, which is shallower [than the rest of the lake]. The drop in water levels is about 2 meters, and you can imagine that if you have a port and water levels drop more, you won't be able to operate. You'll need to extend your shipping routes southward; you'll need to invest and spend a lot of money to use other ports and docking sites. We have evidence of that around the Aral Sea and also Lake Urmia. There used to be these docking sites and ports, but those are now far away from the water.
SP: What must bordering countries do to save the Caspian Sea and prevent these negative effects?
AA: Demand management is absolutely critical. Demand management doesn't get a lot of attention, because unlike big projects that make the news, management means you have to cut things and do things that people don't notice. Some people argue that politicians don't show a lot of interest in demand management, but it's something that we have control over. The technological opportunities are there.
But when you look at that area, there is a big war — so probably it's not the priority to invest in management. There are a lot of things that we don't talk about in the paper that are relevant. I recently learned through discussions with people from the region — this is something that came to us from co-authors and collaborators — that many countries in that area grow cotton, which uses a lot of water. It has a lot of applications, but apparently, one of them is military. Cotton is used to produce ammunition. Russia needs a lot of ammunition, so not only are they growing it themselves, but they also bought neighboring reserves from Uzbekistan and Kazakhstan. So now, even those countries have an incentive to grow more cotton. This is driving more irrigation, more groundwater extraction, more surface water depletion, and probably more impacts on the Caspian Sea.
This interview has been condensed and edited lightly for clarity.
Each year, tons of soil, silt and rocks flow into reservoirs in the U.S. and get stuck there, creating a "ticking time bomb" that threatens lives and livelihoods. According to a new study, around a fifth of the world's reservoirs are currently at high risk of filling with sediment, and by 2060, half could be inoperable as a result.
The sediment takes up space meant for water, putting additional pressure on structures that were not built to contain large quantities of sand and sludge. As the reservoir fills with the material instead of water, sediment-filled reservoirs pose a serious threat to water security and the safety of people living near or downstream of them — and as the climate changes, scientists expect the problem to worsen.
"We are losing storage space in our reservoirs faster from sediment accumulation than we gain space from new dam construction," Amy East, a geologist at the U.S. Geological Survey, told Live Science.
What is dam sedimentation?
Dam sedimentation is not a uniquely U.S. problem. Rain pulls sediment down slopes into waterways. Normally, this sediment would travel through the river system, shaping the water flow, creating habitats, and fortifying coastal wetlands and estuaries against erosion. In many parts of the world, this sediment is also a vital natural fertilizer for crops. But after a river is dammed, this sediment can collect in the reservoir.
A 2023 study published in the journal Science found that sediment buildup was the greatest threat to global water storage in existing reservoirs — even more than drought.
New research, which includes smaller reservoirs, has offered a more nuanced and concerning picture. In the study, published June 5 in the journal Nature Sustainability, researchers assessed the state of reservoir sedimentation globally. They looked at more than 550,000 reservoirs, most of which spanned less than 0.4 square miles (1 square kilometre). They found that almost 1 in 5 of reservoirs globally are at high risk of filling up with sediment.
The researchers found that sedimentation is eating into global reservoir storage capacity at about 7.3% every decade. There are 16 global hotspots that are at high risk of reservoir sedimentation, threatening water supplies to more than 2 billion people and impacting more than a quarter of global irrigated land. One of these hotspots includes the western U.S.
The authors found that sedimentation risk was especially pronounced in regions with dense small-reservoir networks supporting key crop systems.
"Without intervention, we project that, by 2060, more than half of all reservoirs could become functionally inoperable," the authors wrote. This includes more than half of all small reservoirs and more than a third of large reservoirs globally.
Where is it a problem in the U.S.?
North America has the second largest number of reservoirs, after Asia, according to the global survey. And at 7.8%, its sedimentation rate is higher than the global average, ranking it third after Oceania (9.9%) and South America (8.1%),
The U.S. is home to many small dams, said Matthias Kondolf, a geomorphologist at the University of California, Berkeley who wasn't involved in the study. "All the focus tends to be on the big dams, and these many, many small ones have been neglected," he told Live Science.
From the 1940s to 1970s, there was a big push by the U.S. government to build "farm ponds," he said. In western Oklahoma, for example, "all these dams are now filling up with sediment, and there's nothing in place to assess the safety of these features, which have now become threats."
Reservoirs in some regions are more at risk than others. The western U.S. is a natural hotspot because it has a steeper topography, meaning more sediment naturally ends up in watersheds, East, who wasn't involved in the new research, said.
And in areas where human activities like farming or logging disrupt the landscape, rainfall is likely to drag even more sediment into reservoirs, East said. "Those types of land use can create sediment-producing hotspots almost anywhere."
In California, for example, more than half of small reservoirs in maize-growing areas are filling up with sediment at a rate of more than 10% a year, which threatens local maize production.
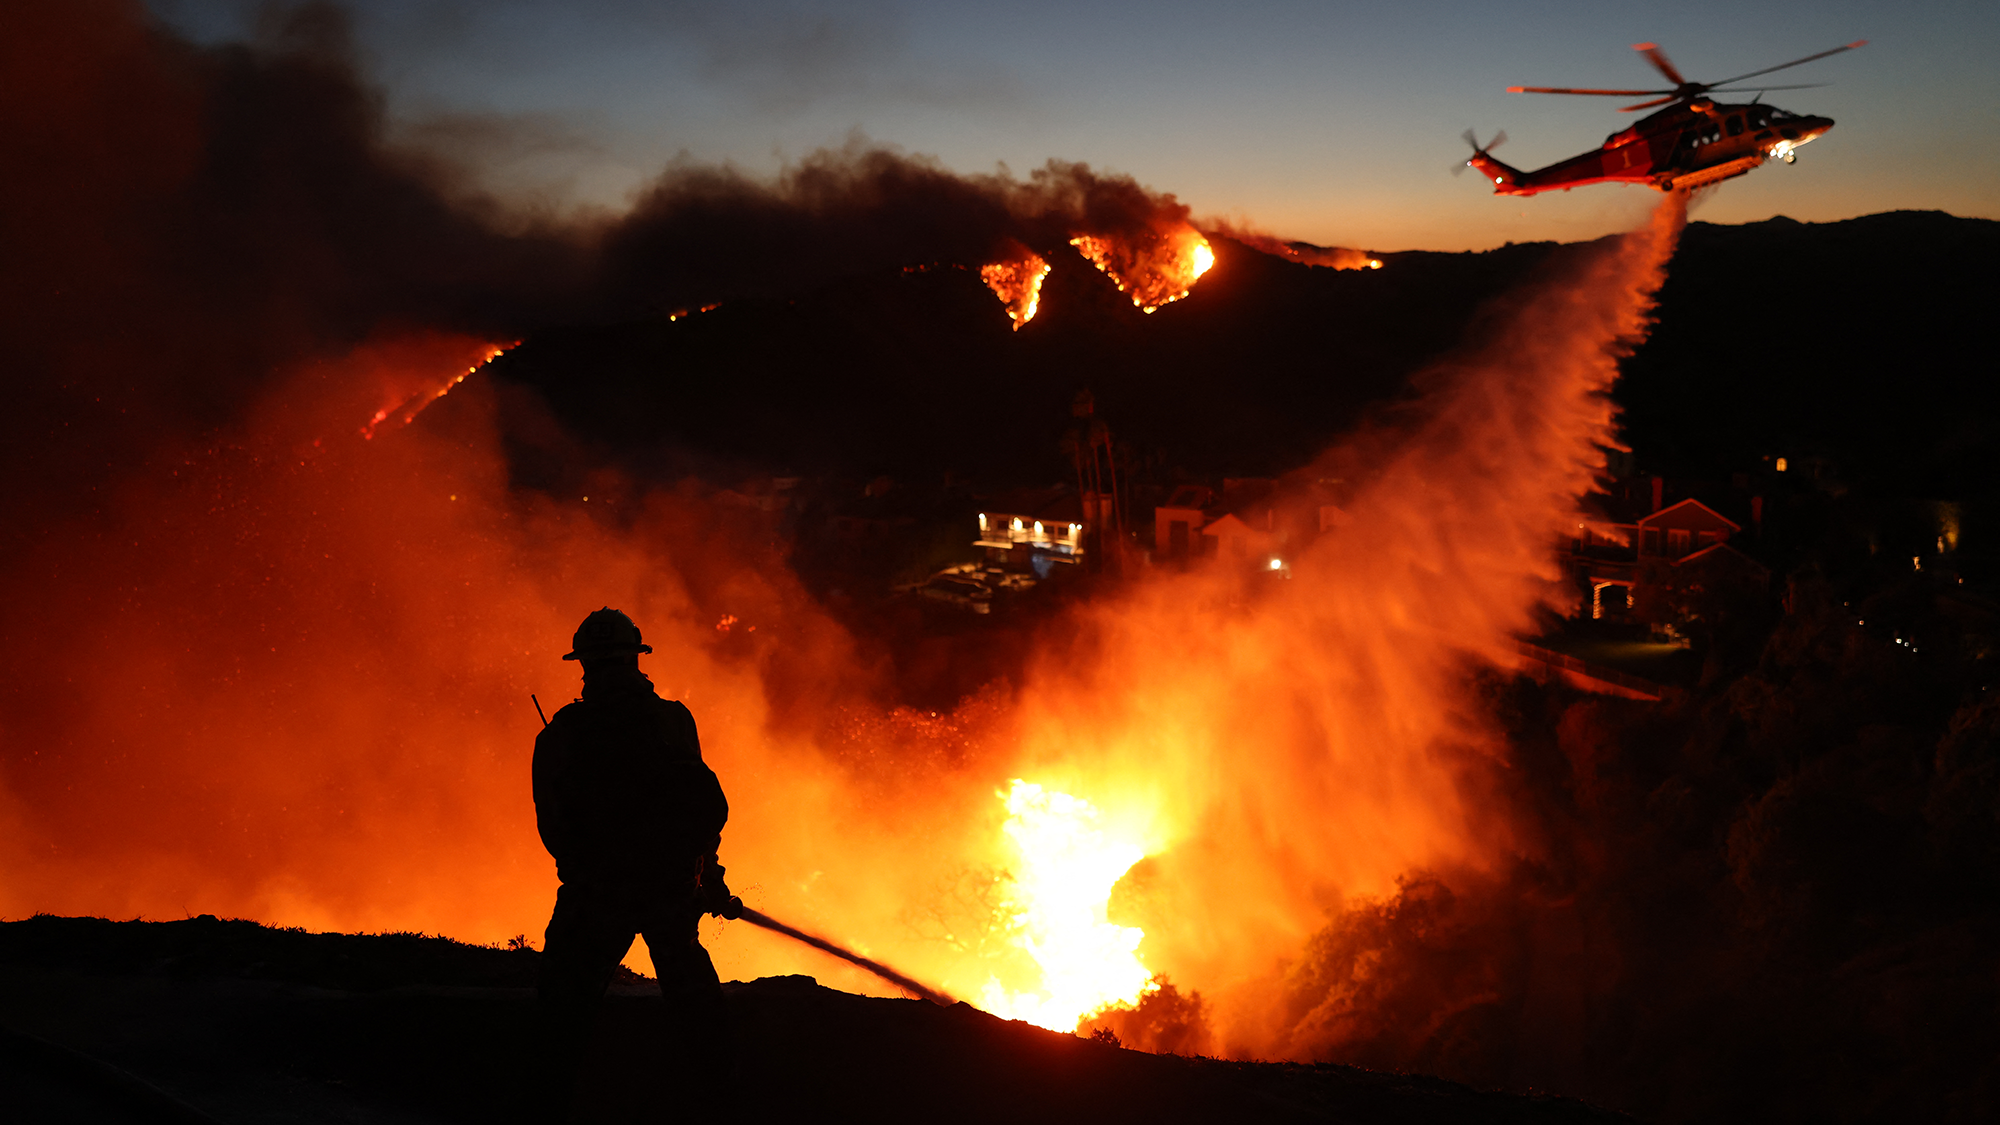
Wildfires also increase the amount of sediment flowing into rivers. (Image credit: DAVID SWANSON via Getty Images)
The threat to water security will be particularly acute in places struggling with wildfires, such as the western U.S. After fires, rain washes the debris and sediment into watersheds. A 2024 study in California found that most of this post-fire sediment erosion occurred upstream of reservoirs, rather than in places where sediment would move downstream directly to the ocean.
The dam-sedimentation situation is likely to get worse as the climate changes, researchers said. As the climate changes, there will be more extreme weather events, such as droughts and wildfires, adding more sediment to watersheds. Dams are designed to cope with the pressure of water, not sediment which exerts more force on dam walls. Moreover, in seismically active areas, the sediment vibrates at a different frequency than the concrete of the dam, which creates further impact against the structure. Additionally, the dams are just getting older.
"What do we do 50 or 100 years from now when we have all these reservoirs across the landscape filled with sediment, sitting there as ticking time bombs?" Kondolf said.
What can be done about it?
For a reservoir to be sustainable long-term, the amount of sediment entering it and leaving it should be the same.
"A big part of preventing reservoir sedimentation problems is upstream soil conservation in the watershed," East said. Interventions include ensuring that land use, such as agriculture or timber harvesting, follow best practice to reduce the amount of sediment washing off the landscapes.
If sediment is already in the dam, it can be difficult to manage and expensive to remediate, Kondolf said. Some dams, such as Fall Creek Dam in Oregon, have mechanisms that enable engineers to release sediment. But in the past, reservoirs were not designed to manage sediment and little thought was given to how to decommission them.
"This is one of those issues that falls in the cracks between different agencies and responsibilities," Kondolf said. Some larger facilities fall under the remit of the federal government. Other dams fall under state governments. California, for example, recently launched a state-sponsored program to future-proof the state's dams.
But smaller dams often get overlooked, Kondolf said.
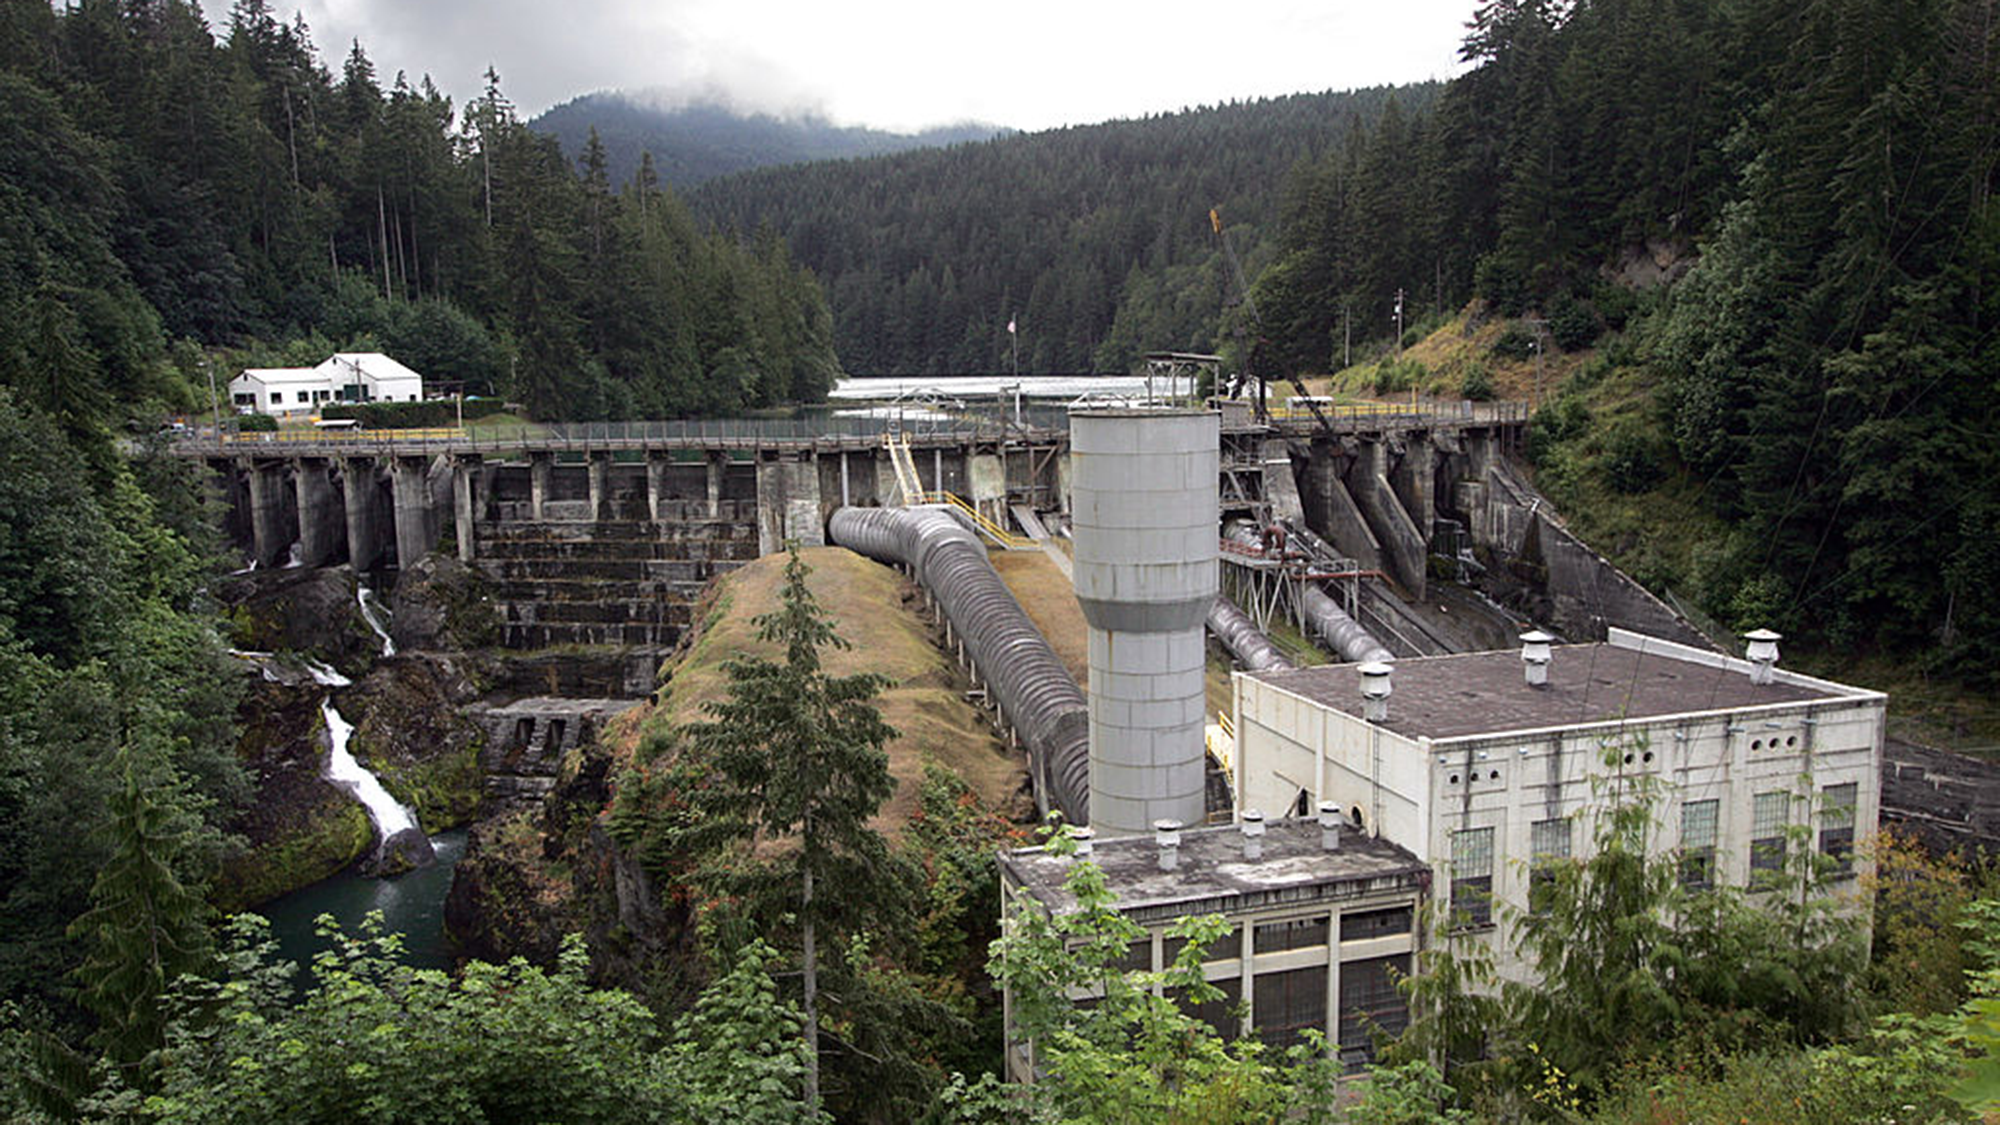
The Elwha Dam in Washington state which was removed around a decade ago. (Image credit: Tacoma News Tribune via Getty Images)
For smaller dams with a relatively small amount of sediment, "you just blow up the dam and let the sediment work its way downstream", Kondolf said.
There are other technological solutions, but they are expensive, such as retrofitting dams to enable them to pass sediment; creating a bypass to route sediment-heavy water around the dam; and mechanical dredging.
"The economics of managing reservoir sediment long-term were not generally incorporated into dam design and planning in the last century when many western-U.S. water projects began," East said. This has "pushed the cost burden on future generations."
But the reality is that reservoirs around the country are filling with sediment. It is reducing their ability to store water and potentially endangering the communities living downstream of them — and unless addressed, the problem will only get worse.
What it means: A seamount is an undersea mountain that rises at least 3,300 feet (1,000 meters) above the seafloor but does not come close to breaking the surface. According to the National Oceanic and Atmospheric Administration, there are at least 100,000 seamounts in the oceans, and less than 0.1% of them have been explored. Seamounts typically form from volcanic activity, and many host dramatic communities of sea life — from coral, to sharks, to an assortment of weird jellyfish-looking things.
How to use it in a sentence: Every time marine biologists explore a seamount with their remotely operated vehicles, they seem to discover a new universe of strange and blobby deep-sea creatures.
Can you crack our science word of the day puzzle, Chain Word?
Runoff from Greenland's rapidly melting ice sheet could severely disrupt currents in the Atlantic Ocean that regulate the global climate, researchers say. But the fresh water won't trigger the complete and irreversible collapse of the circulation that some research predicts, a new study suggests.
By 2100, Greenland meltwater could cause a reduction in the strength of the Atlantic Meridional Overturning Circulation (AMOC) equivalent to an additional 10% to 20% on top of the weakening that many scientists already expect for this huge system of currents, researchers found.
Previous research suggests the AMOC, which moves heat from the tropics to the Northern Hemisphere and cold water back south toward Antarctica, is at its weakest in more than 1,000 years due to Arctic ice melt and soaring ocean temperatures. Models indicate that the circulation will continue to weaken for decades to come, potentially unleashing freezing weather in Northwest Europe, additional sea-level rise along the U.S. East Coast and droughts around the equator.
The AMOC loops around the Atlantic Ocean, bringing warm waters north along the ocean's surface and cold waters south along the ocean floor. (Image credit: NASA/Goddard Space Flight Center Scientific Visualization Studio)
The new study revealed that by 2300, Greenland's ice sheet could cause a whopping 40% of AMOC weakening on top of the declines projected by some climate models if we continue to cook the planet. The results highlight the effects on the AMOC of a growing freshwater pulse from Greenland that most climate models currently don't take into account, the authors said.
"By the year 2100, yes, we have something, but the greatest fraction is what we add later," study co-author Jost von Hardenberg, a professor in the Department of Environment, Land and Infrastructure Engineering at the Polytechnic University of Turin in Italy, told Live Science.
Meltwater from the Arctic and Greenland slows the AMOC by preventing the formation of deep currents in the North Atlantic that drive the circulation south toward Antarctica. Deep currents form when masses of cold, salty water sink to the seabed, but inputs of fresh water and rising water temperatures are blocking this step by diluting and warming surface waters.
While Arctic meltwater is commonly integrated into climate simulations, researchers have been slower to include runoff from the Greenland ice sheet in models, partly because this runoff may not be as disruptive as Arctic meltwater on shorter timescales, von Hardenberg said.
"In order to represent correctly the Greenland melt, you need a specific, dynamic model for the Greenland ice sheet. It's nice to have, but it requires a lot of resources to develop," von Hardenberg said
The Community Ice Sheet Model version 2 (CESM2) is one of the few available simulations of the Greenland ice sheet. For the study, von Hardenberg and his colleagues used a global climate model called EC-Earth3, which does not include the Greenland ice sheet. The team added the ice sheet from CESM2 to explore how it might affect the AMOC over the next few centuries. Adding the ice sheet separately enabled them to compare AMOC weakening with and without Greenland, clearly revealing the impact of the ice sheet on the AMOC's strength.
The results, published June 19 in the journal Science Advances, suggest the Greenland ice sheet will have a big influence on Atlantic ocean currents, especially after 2100.
"Greenland starts really melting strongly only after that date," von Hardenberg said. "If you go farther in our simulation — we go up to the year 2300 — that is also when this meltwater really becomes extremely strong."
Yet unlike other studies that show the AMOC collapsing irreversibly under climate change, in this model, the circulation recovered once the team switched off the meltwater or dialed down greenhouse gas emissions. Both the simulations that didn't include the Greenland ice sheet and those that did had similar results, recovering partially when the meltwater was turned off and fully when greenhouse gas emissions were stopped.
The recovery in the model suggests that the AMOC is more stable than previously thought and doesn't suddenly flip from an active state into a collapsed one, von Hardenberg said. "It's consistent with a strong weakening, but not a shutdown," he said.
Overall, the findings show that it is important to include the Greenland ice sheet in climate models — something von Hardenberg and his colleagues are planning to do in the next version of the EC-Earth3 model.
"It's really something which is worthwhile doing to better constrain the uncertainty of these future simulations," von Hardenberg said. "If we have a larger set of models which include this component, we will be in a better position to try to answer the question, 'How much do we expect AMOC to decrease in different scenarios?'"
Other experts agreed that integrating the Greenland ice sheet in climate models will increase the accuracy of AMOC predictions.
"What makes the study particularly interesting is that it directly tests a process that has often been highlighted as an important source of uncertainty in future AMOC projections," said Jonathan Baker, a senior climate scientist at the Met Office in the U.K. who was not involved in the study.
The results are consistent with previous research showing that Greenland meltwater causes additional AMOC weakening, but whether the system could collapse is still uncertain, given that the team used only one model, Baker told Live Science in an email. "Repeating these experiments across a wider range of models will be important to assess how robust the findings are," he said.
Nicholas Foukal, an assistant professor at the University of Georgia's Skidaway Institute of Oceanography who was not involved in the study, said he doesn't think the use of a single model limits the analysis.
"I think this result is robust and I am glad to see the authors come to this conclusion in such a high-resolution and realistic coupled climate model," Foukal told Live Science in an email. "This finding also agrees with other modeling results that require immense amounts of fresh water, much more fresh water than is available on Greenland, to cause irreversible change in the AMOC."
However, a third expert said the model used in the study is unrealistic, because its parameters make the AMOC more resilient than those of other models. Therefore, the study should be replicated in other models to draw unbiased conclusions.
"While the experiment reported is interesting, its outcomes are neither surprising nor should be interpreted as exemplary for the whole model ensemble," Sybren Drijfhout, a professor of physical oceanography at the University of Southampton in the U.K., told Live Science in an email.
Researchers should investigate the impact of the Greenland ice sheet on the AMOC further, von Hardenberg said. "It would be interesting in the future to check it [the AMOC's recovery with Greenland meltwater] with other models, but of course it's encouraging to see it in one case," he added.
Uncrewed systems are the future for armed forces and the Netherlands is leading the way ‘to keep people out of danger zones’
On each side of the target ship, a black vessel keeps a watchful distance. Defender 1 and Defender 2 are the eyes and ears of the navy – but they have nobody onboard, and their paths are controlled by a computer system.
This is the future of the Royal Netherlands Navy, according to Capt Sjoerd Feenstra, head of the expertise centre for unmanned systems. He is leading a five-week mission, off the coast of Den Helder in the north of the country, to test the limits of systems that operate without the human touch.
Professional surfer and scientist Cliff Kapono gets his best ideas when he’s in the ocean. “The thinking turns off, but the ideas start to pour in,” he says. To him, the connection makes complete sense because the native Hawaiian word for “idea” is the same as “wave” — nalu.
Kapono is a native Hawaiian; these are the Indigenous people of Hawaii. He grew up in Hilo, Hawaii, where he is based today, blending his lifelong passions for surfing and science daily. “I want to understand how waves move across our planet, so I can be better at catching these waves,” he says.
As a kid, all he wanted to do was surf every day, all day long. He practiced until he could surf at a professional level. “That’s the same thing that I did in science. It started off where I just wanted to take science classes and get A’s. With surfing, the equivalent is catching nice waves,” Kapono says.
Kapono is now a professional free surfer. These athletes chase the best swells around the world to earn sponsorships and media exposure. He also has time to do scientific research. For Arizona State University’s Center for Global Discovery and Conservation Science in Hilo, he studies how humans and ocean environments interact, from molecular to macro scales, through the lens of a surfer. In this interview, he shares his experience and advice with Science News Explores. (This interview has been edited for content and readability.)
How do you balance professional careers in surfing and science?
When I was younger, I didn’t think I could put the two together. But if I were to pursue a full-time career in either, I would be unhappy. So I figured out a path where I could spend just as much time inside the science lab as I am in the ocean. The Western world defines your job based upon what you get paid to do, not about what you invest your time into. I totally departed from that idea. My job is to be the best version of me. The best version of me is surfing good waves every day and understanding about the natural world through a scientific lens.
“The best version of me is surfing good waves every day,” Kapono says, “and understanding about the natural world through a scientific lens.”Nani Welch Keliʻihoʻomalu
What does surfing mean to the Native Hawaiian community?
The clearest example of a productive society is the amount of leisure time they have. If you have a highly functioning system, you have surplus time. Our society was able to invest that time into the cultural arts, such as surfing.
Surfing has been documented within our histories for close to 2,000 years. It’s not just recreation. Surfing is so deeply embedded into the Hawaiian culture. It’s in the stories, the chants and the songs. It was celebrated tremendously by all peoples — from folks who were fisher people, farmers, basket weavers, cooks, to the royalty. In the late 1800s, it began being sort of exported outside of Hawaii and demonstrated at different locations around the world. By the 1950s, it reached global fame.
What would you consider one of your biggest successes?
A success for me is elevating scientific literacy within the surf community. As a scientist, I represent an identity in the surf community that I didn’t see growing up. I can play that role for the next surfer scientist — or maybe it’s a surfer chef or surfer lawyer — to show that you can still contribute on a professional level to multiple communities within society at the same time.
Describe a research breakthrough moment you’ve had.
I’m currently trying to identify the structural complexity of reefs at some of the best, most iconic waves around the world. It’s known as bathymetry, the study of the seafloor. I’m looking specifically at where certain famous waves break. Over the last five years, I’ve been traveling around mapping the characteristics of these different reefs. I’m seeing similarities between these waves based upon their reef structure. A personal interest and curiosity is now supported by research — that keeps me excited. Finding out that, by learning more about the reef, I can be a better surfer is a breakthrough for me.
Kapono studies the structural complexity of reefs at some of the best, most iconic wave spots around the world.Sarah Lee
What’s one of your biggest failures, and how did you get past that?
I have gotten a lot of F’s in my academic career, but I’ve never felt like getting an F was a failure. My dad would always tell me that failure is an event, not a person. It’s just a moment that passes, so it’s not going to stay with you very long. So, I’ve actually embraced a lot of failures. I failed at many science experiments. I failed at catching a wave. I fail to ride the wave all the way to the shore. Sometimes I fail to even stand up. I fail in obtaining resources to do my science. I fail in knowing what the right answer is. I fail daily. But failing is not a bad thing if it helps you to find the successes. I don’t feel embarrassed or ashamed to fail anymore. I just tell myself that it’s all going to work out in the end if I don’t let the failure stop me.
I always looked up to elders in the Hawaiian community that maybe aren’t super famous but, within our communities, really treated me kindly and shared knowledge with me. Whether they were teachers, family members or professional surfers, I always looked up to people who were willing to share what knowledge they had with me. Anybody who helped me to navigate the difficulties of being on an island in a small community and feeling like there’s a bigger world out there. Anybody who helped me to get to a higher level of thinking and develop my intelligence, from my academic intelligence to my emotional intelligence. The people who helped me understand more about the world and myself.
As a professional surfer and professor, Kapono has always pushed himself to succeed in both fields. “The better I got in science, I wanted to make sure I got better at surfing,” he says.
What do you do in your spare time?
I volunteer for a scientific group called Mega Lab that is trying to develop technology to protect the ocean and give it to communities who need it the most. The biggest project we have going on right now is mapping a million reefs by 2030. We’re teaching 10,000 citizen scientists how to map the reef with their GoPro, cell phone or camera. The program is called Map to Adapt. Anyone can join the Mega Lab — artists, skaters, ballerinas or firefighters. There are no requirements, you just come by and start doing science together. We just want to have a good time and party for the planet.
Why do science and surfing fit together so well?
Having an interest in science really has helped me to be a better surfer. And my interest in surfing has helped me to become a better scientist. Science is like a superpower for me. It’s really fun to be able to jump from a community that is so focused on riding a wave into one that wonders about how that wave moves. To me, that’s a pretty epic way to live.
What's in the photo? Submerged sandbanks and seagrass beds in shallow water
Which satellite took the photo? Landsat 8
When was it taken? Feb. 15, 2020
This ethereal satellite snap shows beautiful, "painting-like" folds within an ancient underwater structure in the Bahamas.
The Great Bahama Bank (GBB) is a massive submerged platform stretching around 330 miles (530 kilometers) across a shallow ocean channel between Andros Island and the Exuma islands, according to Britannica. The crescent-shaped bank surrounds a darkly colored ocean drop-off known as "The Tongue of the Ocean," which plunges to depths of 6,500 feet (2,000 meters), according to NASA's Earth Observatory.
The photographed section of the GBB is around 23 miles (37 km) across and features a series of submerged sandbanks — most of which are covered with dense seagrass beds — that lie between 7 and 40 feet (2 to 12 m) below the ocean's surface.
The varying water depth and seagrass concentration cause multiple hues of green and blue to shine across the sandbanks, which have been carved into smooth, folding ribbons by ocean currents over thousands of years.
"The varying colors and curves remind us of graceful strokes on a painting," Earth Observatory representatives wrote.
The Great Bahama Bank is a crescent-shaped structure spanning around 330 miles (530 kilometers) between Andros Island and the Exuma islands. (Image credit: NASA/Landsat)
"There are many nice seagrass and sand patterns worldwide, but none like this anywhere on Earth," Serge Andréfouet, an oceanographer at the French National Research Institute for Sustainable Development who first shared the 2001 image, told the Earth Observatory. "I am not surprised it is still a favorite, especially for people who see it for the first time."
The sandbanks are like giant underwater dunes carved out by ocean currents.
"Tides and ocean currents in the Bahamas sculpted the sand and seaweed beds into these multicolored, fluted patterns in much the same way that winds sculpted the vast sand dunes in the Sahara Desert," Earth Observatory representatives wrote in 2001.
The GBB lies atop a roughly 3-mile-thick (5 km) bed of limestone dating to the age of the dinosaurs, more than 65 million years ago. This hefty mass, made up of the remains of long-dead coral reefs, is so large that Earth's crust directly below the GBB has "sagged under the weight," according to the University of Texas at Austin's Marine Science Institute.
The Great Bahama Bank surrounds the edge of a deep sea drop-off known as the "Tongue of the Ocean," creating a striking contrast when viewed from above. (Image credit: USGS/ESA)
Before the end of the last ice age, around 12,000 years ago, this limestone slab had risen to more than 400 feet (120 m) above sea level and only resubmerged as global sea levels rose due to the melting of glaciers, according to the Marine Science Institute.
A 2026 satellite photo captured a gleaming halo of phytoplankton encircling the remote Chatham Islands. The stunning sight is the result of a hidden underwater structure, which has also helped kill hundreds of cetaceans.
A 2026 satellite photo captured a stunning scene of sediment swirling across the West Florida Shelf after an extreme cold snap that covered large parts of the eastern U.S. in snow.
A 2020 astronaut photo shows the unusual cetacean-like shape of Belize's Lighthouse Reef. It's home to the famous Great Blue Hole, which doubles as the island's "blowhole" when viewed from space.
A giant blob of abnormally cold water in the North Atlantic Ocean is shifting the Indian summer monsoon, threatening the livelihoods of more than 1 billion people, new research suggests.
The link between these two systems highlights a previously unrecognized connection that could inform weather forecasts in South Asia and shed light on climatic events elsewhere, scientists say.
The Indian summer monsoon is a rainfall pattern that lasts from June to September and is driven by temperature differences between the warm northern Indian Ocean and cooler seawater below the equator. Historically, the monsoon triggered heavy rainfall along the west coast of India and a huge region of northern India called the Indo-Gangetic Plain. But since 1999, this pattern has changed dramatically, the researchers reported in a new study.
Northwest India now receives about 25% more rain during the monsoon season than it did before 1999, while the Indo-Gangetic Plain gets roughly 4% less, the team found. This is disastrous for farmers, in particular, because their soils and crops are adapted to the old rainfall pattern, said study first author Mahendra Nimmakanti, a climate scientist at the Indian Institute of Science's Centre for Atmospheric and Oceanic Sciences.
"India is largely dependent on agriculture," Nimmakanti told Live Science in a joint interview with study co-author Matthew Huber, a professor in the Department of Earth, Atmospheric, and Planetary Sciences at Purdue University in Indiana. Higher-than-normal precipitation in northwest India is causing flash floods and crop losses, because agriculture in this region is adapted to dry conditions. Meanwhile, the Indo-Gangetic Plain has seen periods of drought that also caused crop declines and impacted farmers' livelihoods, Nimmakanti said.
Previous studies have linked shifts in the Indian summer monsoon to changes in the Atlantic Meridional Overturning Circulation (AMOC), a giant web of ocean currents in the Atlantic that regulates the global climate and carries heat to the Northern Hemisphere. Data suggests the AMOC is slowing due to climate change and releasing less heat in the North Atlantic Ocean than it did before. This may be causing a southward shift of the Intertropical Convergence Zone, a band of low-pressure atmospheric conditions around the equator that drives tropical monsoons, including the Indian summer monsoon.
But these studies didn't specify how the Indian monsoon might shift or explain the underlying mechanism in detail, Nimmakanti said. "They generally explain that if there is a weakening of AMOC, that suppresses the Indian summer monsoon," he said.
One part of the problem is that current climate models do not show the changes in the Indian monsoon that have happened in real life, possibly because they also don't fully capture shifts in North Atlantic sea surface temperatures. This is especially true for a region southeast of Greenland known as the "cold blob," where the water was colder between 1901 and 2021 than it was in the late 1800s, even as the ocean around it heated up.
To pinpoint how and why the Indian monsoon has changed, the researchers fed precipitation data, sea surface temperature records and other real-life observations into dozens of climate models. This reproduced the shifts observed over the past 27 years. However, the results only implied a correlation between shifts in the North Atlantic and changes in the monsoon, not that the former directly caused the latter.
Northwest India now gets 25% more rain during the monsoon season than it did before 1999, and this shift has also increased flooding risk in Pakistan. (Image credit: Sabir Mazhar/Anadolu via Getty Images)
To figure out if North Atlantic sea surface temperatures caused the Indian monsoon to behave strangely, the team added and removed the cold blob in a simulation. The results showed that the cold blob has shifted the Indian monsoon by creating a strong temperature gradient over the North Atlantic, which, in turn, affects jet stream winds and pressure systems in the atmosphere above Eurasia.
Specifically, the jet stream above the North Atlantic has intensified, and a "blocking" system over the Ural Mountains in western Russia has strengthened, Huber said. As a result, weather systems in India have changed, sucking moist air toward the country's northwest and away from other regions.
"It's a shifting of the high- and low-pressure systems," Huber said. "Realizing that these two systems were directly linked through this wave train coming off the North Atlantic, that was novel."
More than 1 billion people in India and other parts of South Asia depend on the monsoon for food security and economic stability. The new results, published April 27 in the journal AGU Advances, could help forecasters predict extreme rainfall and drought events in India and neighboring countries like Pakistan during the monsoon season.
Some researchers think the Indian monsoon is a key tipping point within the global climate, and the findings suggest the system crossed a threshold in 1999. Since then, the cold blob has caused a "persistent jet stream reorganization," leading to abrupt shifts in the monsoon, according to the study.
It's unclear how the Indian monsoon will evolve under intensifying climate change, because climate models produce different predictions of what will happen in the North Atlantic, and other drivers may come into play as the world changes, Huber said.
"What we do now know is that this is one of the key building blocks of formulating a theory for what will happen in the future," he said.
In the profound depths of rocky planets like Earth and Mars, the precise chemical states of mantle minerals play a foundational role in shaping planetary evolution. Among these chemical states, the oxidation state of iron profoundly influences mantle melting behaviors, volcanic gas compositions, and ultimately, the nature of a planet’s surface environment. While the elemental presence of iron in the mantle is well-known, the subtle balance between its ferrous (Fe²⁺) and ferric (Fe³⁺) forms remains a challenging frontier to unravel, particularly under the extreme pressures and temperatures encountered in planetary interiors.
The early stages of planetary formation are marked by the existence of a vast magma ocean—a molten silicate layer blanketing the young Earth and Mars. During this epoch, the oxidation state at which iron integrates into forming minerals dictates subsequent mantle properties and evolution. Accurately determining the Fe³⁺ content in minerals crystallized within this magma ocean stands as a critical step toward understanding the oxidation dynamics that influenced core-mantle differentiation and surface volatile release in nascent planets.
A mineral of prime relevance in this context is majorite, a high-pressure silicate phase stable at depths ranging roughly from 500 to 600 kilometers within Earth’s mantle and near the base of the Martian mantle. Its stability under simultaneously high-pressure and high-temperature conditions makes majorite a significant reservoir for iron deep within these planetary interiors. Therefore, quantifying the Fe³⁺ concentration hosted within majorite under early magma ocean conditions bears directly on models of mantle redox evolution and volatile mobility.
Researchers at Ehime University’s Geodynamics Research Center have pioneered the synthesis of Fe³⁺-rich majorite coexisting with molten silicate magma at pressures around 18 gigapascals and temperatures between 2150 and 2200 degrees Celsius. Utilizing a multi-anvil apparatus capable of reproducing these extreme conditions, the team closely simulated the environment of the early magma ocean. High-precision X-ray Absorption Near Edge Structure (XANES) spectroscopy was then employed at the renowned SPring-8 synchrotron facility to accurately assess the valence state of iron within the synthesized majorite crystals.
The findings reveal an unexpectedly high Fe³⁺ content in majorite crystallized from the magma ocean, second only to bridgmanite, Earth’s most abundant lower mantle mineral. This marked enrichment in ferric iron suggests that early mantle minerals could accommodate significant oxidation capacity, challenging earlier assumptions that high-pressure silicates predominantly contain iron in the ferrous state. The implication is that the early mantle harbored more oxidized iron species than previously anticipated, impacting mantle viscosity, melting relations, and the capacity to store volatile elements.
Importantly, as mantle solids ascend toward shallower depths, phase transitions or mineral decompositions can liberate excess Fe³⁺ that no longer fits within the crystal structures. This released ferric iron potentially contributes to the generation of oxidized magmas, influencing volcanic gas emissions and surface oxidation states. Such a mechanism presents a plausible link between deep mantle oxidation states and the chemical makeup of magmas erupted at the surface, offering fresh insights into the geological histories of both Earth and Mars.
The study’s revelations offer a new lens through which to interpret the evolution of mantle oxidation state gradients over geological time. Understanding how iron’s valence shifts across depth-dependent mineralogical boundaries and during mantle convection cycles will refine planetary differentiation models and volatile cycling frameworks. The presence of Fe³⁺-rich majorite highlights a previously underappreciated redox reservoir deep within planetary interiors.
These results not only enhance our appreciation of Earth’s early differentiated mantle but also extend to Mars, where recent seismic and geochemical data point to a similarly complex mantle composition. The redox state plays an outsize role in Martian volcanic outgassing and atmospheric evolution, making this research vital for reconstructing Mars’ geochemical past and assessing its potential habitability.
From a methodological standpoint, the study exemplifies the power of integrating high-pressure experimental petrology with cutting-edge synchrotron techniques. The ability to recreate extreme planetary interior conditions and directly probe valence states in situ offers a transformative approach to addressing longstanding questions about deep Earth and planetary chemistry.
Furthermore, the recognition that Fe³⁺ can be abundant in magma ocean-derived minerals necessitates revisiting thermodynamic and geochemical models of mantle melting and evolution. Oxidation state strongly influences melting temperatures and mantle rheology, thereby controlling convection patterns and surface tectonics. Such feedbacks are essential to comprehend in the broader context of planetary habitability and evolution.
Ultimately, these insights pave the way for multidisciplinary endeavors bridging mineral physics, planetary science, and geochemistry. They underscore the dynamic interplay between deep Earth processes and surface conditions, revealing how the smallest changes in iron’s electron configuration resonate across planetary systems.
This breakthrough in understanding iron’s complex behavior under extreme conditions promises to guide future explorations of terrestrial and extraterrestrial geology. It sets new constraints on the interior states of rocky planets and sharpens our vision of how early planetary environments were sculpted by subtle shifts deep within.
Subject of Research: High-pressure mineralogy and mantle oxidation states in terrestrial and Martian planets.
Article Title: (Not explicitly provided in the original content.)
News Publication Date: (Not indicated in the original content.)
Web References: http://dx.doi.org/10.1029/2025JB033231
References: Journal of Geophysical Research Solid Earth
Image Credits: Hideharu Kuwahara
Keywords:
– Fe³⁺ in mantle minerals
– Majorite synthesis under high pressure
– Magma ocean oxidation states
– Mantle redox evolution
– XANES spectroscopy at SPring-8
– High-pressure experimental petrology
– Earth and Mars mantle comparison
– Ferric iron incorporation in majorite
– Oxidized magma generation
– Planetary interior chemistry
– Lower mantle mineralogy
– Planetary differentiation processes

 Login