❌

Normal view

Sensing the Poles’ Hidden Heat

7 August 2026 at 05:00
Surface temperatures across Earth’s poles pulse with the seasons, as seen in this animation based on two years of data collected by NASA’s PREFIRE (Polar Radiant Energy in the Far-InfraRed Experiment) mission.
NASA/Chad Greene

At the top and bottom of the planet, the seasons arrive on a schedule all their own. Satellite data from a mission measuring infrared energy reveal just how differently—and how dramatically—surface temperatures swing across two full years at the poles.

In this animation, surface temperatures across the Arctic and Antarctic pulse between cold (dark blue) and milder to warm (lighter blue to red). Data for the animation come from NASA’s PREFIRE (Polar Radiant Energy in the Far-InfraRed Experiment) satellites. The mission’s twin CubeSats began collecting science data in July 2024 and have now captured two complete seasonal cycles at each pole.

Because the two poles sit in opposite hemispheres, their seasons occur at opposite times—and the swing between seasons differs, too. In the Arctic, cold, dark winters give way to summers warm enough to thaw vast stretches of tundra and sea ice. In Antarctica, Earth’s coldest continent, summer temperatures rarely climb above freezing before the bitter cold of winter returns.

Surface temperatures, and how they fluctuate, offer a window into Earth’s energy budget, the net flow of energy into and out of the Earth system. Sunlight absorbed by the surface is re-radiated as infrared heat, which bounces between Earth’s surface and atmosphere before escaping to space. The poles play an important role in this process. Atmospheric and ocean circulation carries excess heat absorbed in the tropics toward the poles, where it radiates away to space, helping regulate the planet’s temperature.

“By measuring invisible heat radiating from Earth’s coldest places, PREFIRE is helping scientists understand why the poles are changing so rapidly, and what those changes might mean for the rest of the planet,” said Chad Greene, a glaciologist at NASA’s Jet Propulsion Laboratory.

Scientists have long known that far-infrared radiation accounts for nearly 60 percent of the energy Earth loses to space, but that portion of the spectrum—invisible to human eyes—had never been comprehensively measured on a global scale. By directly tracking this invisible energy in near-real-time, the PREFIRE mission is helping scientists refine models and gain a better understanding of the Earth system.

“Weather systems, river flows, shipping routes, and ice sheet stability are all influenced by energy movement in a part of the spectrum that only PREFIRE can see,” said Tristan L’Ecuyer, an atmospheric scientist at the University of Wisconsin-Madison and principal investigator of the PREFIRE mission. “Now that the invisible has been made visible, we can begin to improve weather and climate predictions that industries, our national defense, and Arctic communities rely on.”

Maps courtesy of Chad Greene, NASA/JPL, using data from NASA’s PREFIRE mission. Story by Kathryn Hansen.

References & Resources

You may also be interested in:

Stay up-to-date with the latest content from NASA as we explore the universe and discover more about our home planet.

A Moonlit Earth as Seen From Artemis II

4 min read

An astronaut’s photo, taken en route to the Moon, reveals our planet and its place in space in a novel…

Article

Earthset From the Lunar Far Side

2 min read

The crew of NASA’s Artemis II mission captured extraordinary images of our home planet during their journey around the far…

Article

June 2026 Satellite Puzzler

2 min read

Your challenge is to tell us the location of the satellite image and why it is interesting.

Article

Can melting ice increase glacial hazards?

6 August 2026 at 12:00

Globally, about 1 billion people live near glaciers and depend on glacial water. As temperatures continue to climb due to global warming, glaciers can become unstable and hazardous to nearby communities. These communities risk exposure to a series of linked processes, like ice collapse, flooding, and landslides, which could have life-threatening consequences. Scientists call these events catastrophic glacier hazard chains, or CGHC. So, a team of scientists in China sought to understand the driving forces behind these dangerous phenomena. 

The team focused on a CGHC event that occurred in 2018 at the Sedongpu Glacier, located in the Eastern Himalayas. During this event, the glacier obstructed the flow of 30 million square meters (more than 300 million square feet) of the Yarlung Tsanpo River, one of the main rivers within the region. 

To reconstruct the event, the team observed satellite images of the Sedongpu glacier over time, using a process called remote sensing. They used the images to calculate ice volumes, glacier velocities, and glacier movement between 1961 and 2018, to determine the glacier’s long-term physical properties and how they changed over time. They found that from 1968 to 2013, the Sedongpu Glacier shrank, or retreated, by over 6 football fields. It also lost ice and water volume and increased its velocity.

The scientists also measured earthquake waves on the Earth’s surface, or seismicity, to characterize any downslope rock or debris movements caused by the glacial retreat. They measured seismicity across 11 different seismic stations within 580 kilometers (about 350 miles) of the glacier. Then, they used this data to identify 2 distinct phases of the CGHC event on Sedongpu Glacier: the ice-rock avalanche and the debris flow.

When the ice-rock avalanche occurred, the team detected noticeable increases in seismicity, suggesting it lasted over 30 seconds. During those 30 seconds, over 8 million cubic meters (more than 280 million cubic feet) of ice fell onto the main glacier. The team recorded even more increases in seismicity during the debris flow, which lasted nearly 5 minutes. The debris from the avalanche hit the main valley glacier at nearly 300 kilometers (200 miles) per hour.

The researchers combined these data to describe how the 2018 CGHC event unfolded. First, the backward movement and shrinkage of the glacier produced an unstable sheet of ice hanging over a cliff face. The steep slope and large cracks in the ice caused an ice-rock avalanche. Debris from the avalanche then accumulated on the main glacier, causing it to move faster. As the main valley glacier moved downslope, it picked up even more debris from the bottom and sides of the glacial valley. The melting ice also increased the glacier’s velocity, and its movement eventually transitioned into a debris flow, which obstructed the Yarlung Tsangpo River. 

In total, the CGHC event in the Sedongpu Glacier travelled over 10 kilometers (6 miles) and moved down in elevation for over 3 kilometers (about 2 miles) at a velocity of about 100 kilometers (about 70 miles) per hour. The glacier accumulated enough debris and ice to fill thousands of Olympic-sized swimming pools. Imagine what this could do to a nearby village!

It’s difficult for scientists to estimate when CGHC events will occur, but this team proposed several factors that could help predict them. These factors included the size of the ice-rock avalanche and the glacier velocity, as well as the occurrence of earthquakes, temperature changes, and the melting of the glacier’s underside. They stated that these factors can combine to create a domino effect that drives the CGHC process. They recommended consistent glacial monitoring as temperatures continue to climb, in the Himalayas and globally. 

The team concluded that understanding CGHC events can help scientists mitigate glacial hazards and keep people safe, especially in mountainous areas such as the Eastern Himalayas. They stated that their findings illustrate the dangerous processes behind glacial melting, but further research is needed to accurately assess those processes and ensure nearby communities remain safe.

The post Can melting ice increase glacial hazards? appeared first on Sciworthy.

New NASA Earth Missions Gear Up to Start Science Flights  

20 July 2026 at 19:25
6 Min Read

New NASA Earth Missions Gear Up to Start Science Flights  

Satellite imagery captured wildfires burning hot enough to generate pyrocumulonimbus clouds north of Lake Superior in July 2026. NASA aircraft will help scientists study the powerful storms as they develop.
Credits:
CSU/CIRA & NOAA

Landslides in Alaska. Air quality in Atlanta. Fire clouds out West. From the Arctic fringes to farm country, NASA’s newest class of suborbital Earth Venture missions is gearing up to deliver science that will benefit communities in the United States and beyond. 

The six projects will mobilize hundreds of scientists and pilots from NASA, the U.S. Navy, universities, and other institutions over the next several years. While the investigations range across topics, a defining feature of suborbital missions is the use of sensors mounted on aircraft. 

Airborne remote sensing serves as a bridge between ground-based instruments and satellites. Data collected via planes, helicopters, drones, and balloons can fill in gaps in computer models used by weather forecasters, city planners, and others.  

When wildfires create their own weather 

The first project to take wing this summer is Injected Smoke and PYRocumulonimbus Experiment (INSPYRE), led by the Naval Research Laboratory. From mission headquarters in Colorado, the team will chase one of the least understood forms of severe weather on Earth: towering “fire clouds” generated when extreme wildfires burn hot enough to brew their own thunderstorms.  

Pyrocumulonimbus clouds crackle with lighting in imagery captured over Utah and Colorado by the GOES-18 satellite in early July 2026.
CSU/CIRA & NOAA

Smoky and crackling with lightning, these unique storms can create blind spots for aviators above and spark new blazes below. Measuring and mapping the dangerous storms as they develop in real-time will help scientists forecast them in the future. Several aircraft, including NASA’s high-altitude ER-2, flying out of Montana, will carry a large suite of instruments over wildfire-generated storm systems. Among them will be two state-of-the-art infrared wildfire trackers, which were developed at NASA’s Jet Propulsion Laboratory (JPL) in Southern California and will be flying as part of the agency’s FireSense program.  

Testing the air over farmland, megacities 

Agricultural emissions represent an important and understudied part of Earth’s land and atmosphere systems. The FarmFlux mission, which kicks off this year, will deploy more than a dozen sensors to measure ozone, methane, ammonia, particulates, and other pollutants rising from agricultural lands and animal farms stretching from the Midwest to California’s Central Valley. These emissions affect human health, global climate, and stratospheric ozone. The mission is led by NASA’s Goddard Space Flight Center in Greenbelt, Maryland, along with Colorado State University, and Boston University. 

A Boeing 777 wide-body twin-engine aircraft looms on a taxiway, viewed directly from the front.
NASA’s 777 aircraft is gearing up to start science flights. Structural modifications – like enlarged cabin windows and instrument portals – have transformed the former passenger plane into a flying laboratory. It’s seen here at Langley Research Center in Hampton, Virginia, in April 2026.
NASA/Ryan Hill

Two North American cities with air quality concerns are Atlanta and Mexico City. But the causes differ, with weather and terrain playing a role. To explore these differences, the Hemispheric Airborne Measurements of Air Quality (HAMAQ) mission will investigate areas of poor air in the two capitals and test how satellite information can help forecasting and mitigation efforts. The team will deploy two aircraft at different altitudes: NASA’s P-3B will fly close to the surface, directly measuring fine particle and gaseous pollutants, while the recently acquired 777 science jet will soar high above, mapping pollution with remote sensors.  NASA’s Langley Research Center in Hampton, Virginia, is leading the mission. 

Fast-changing north 

As the Arctic warms at least twice as fast as the rest of Earth, data collected today can help guide communities on the front lines of change.  

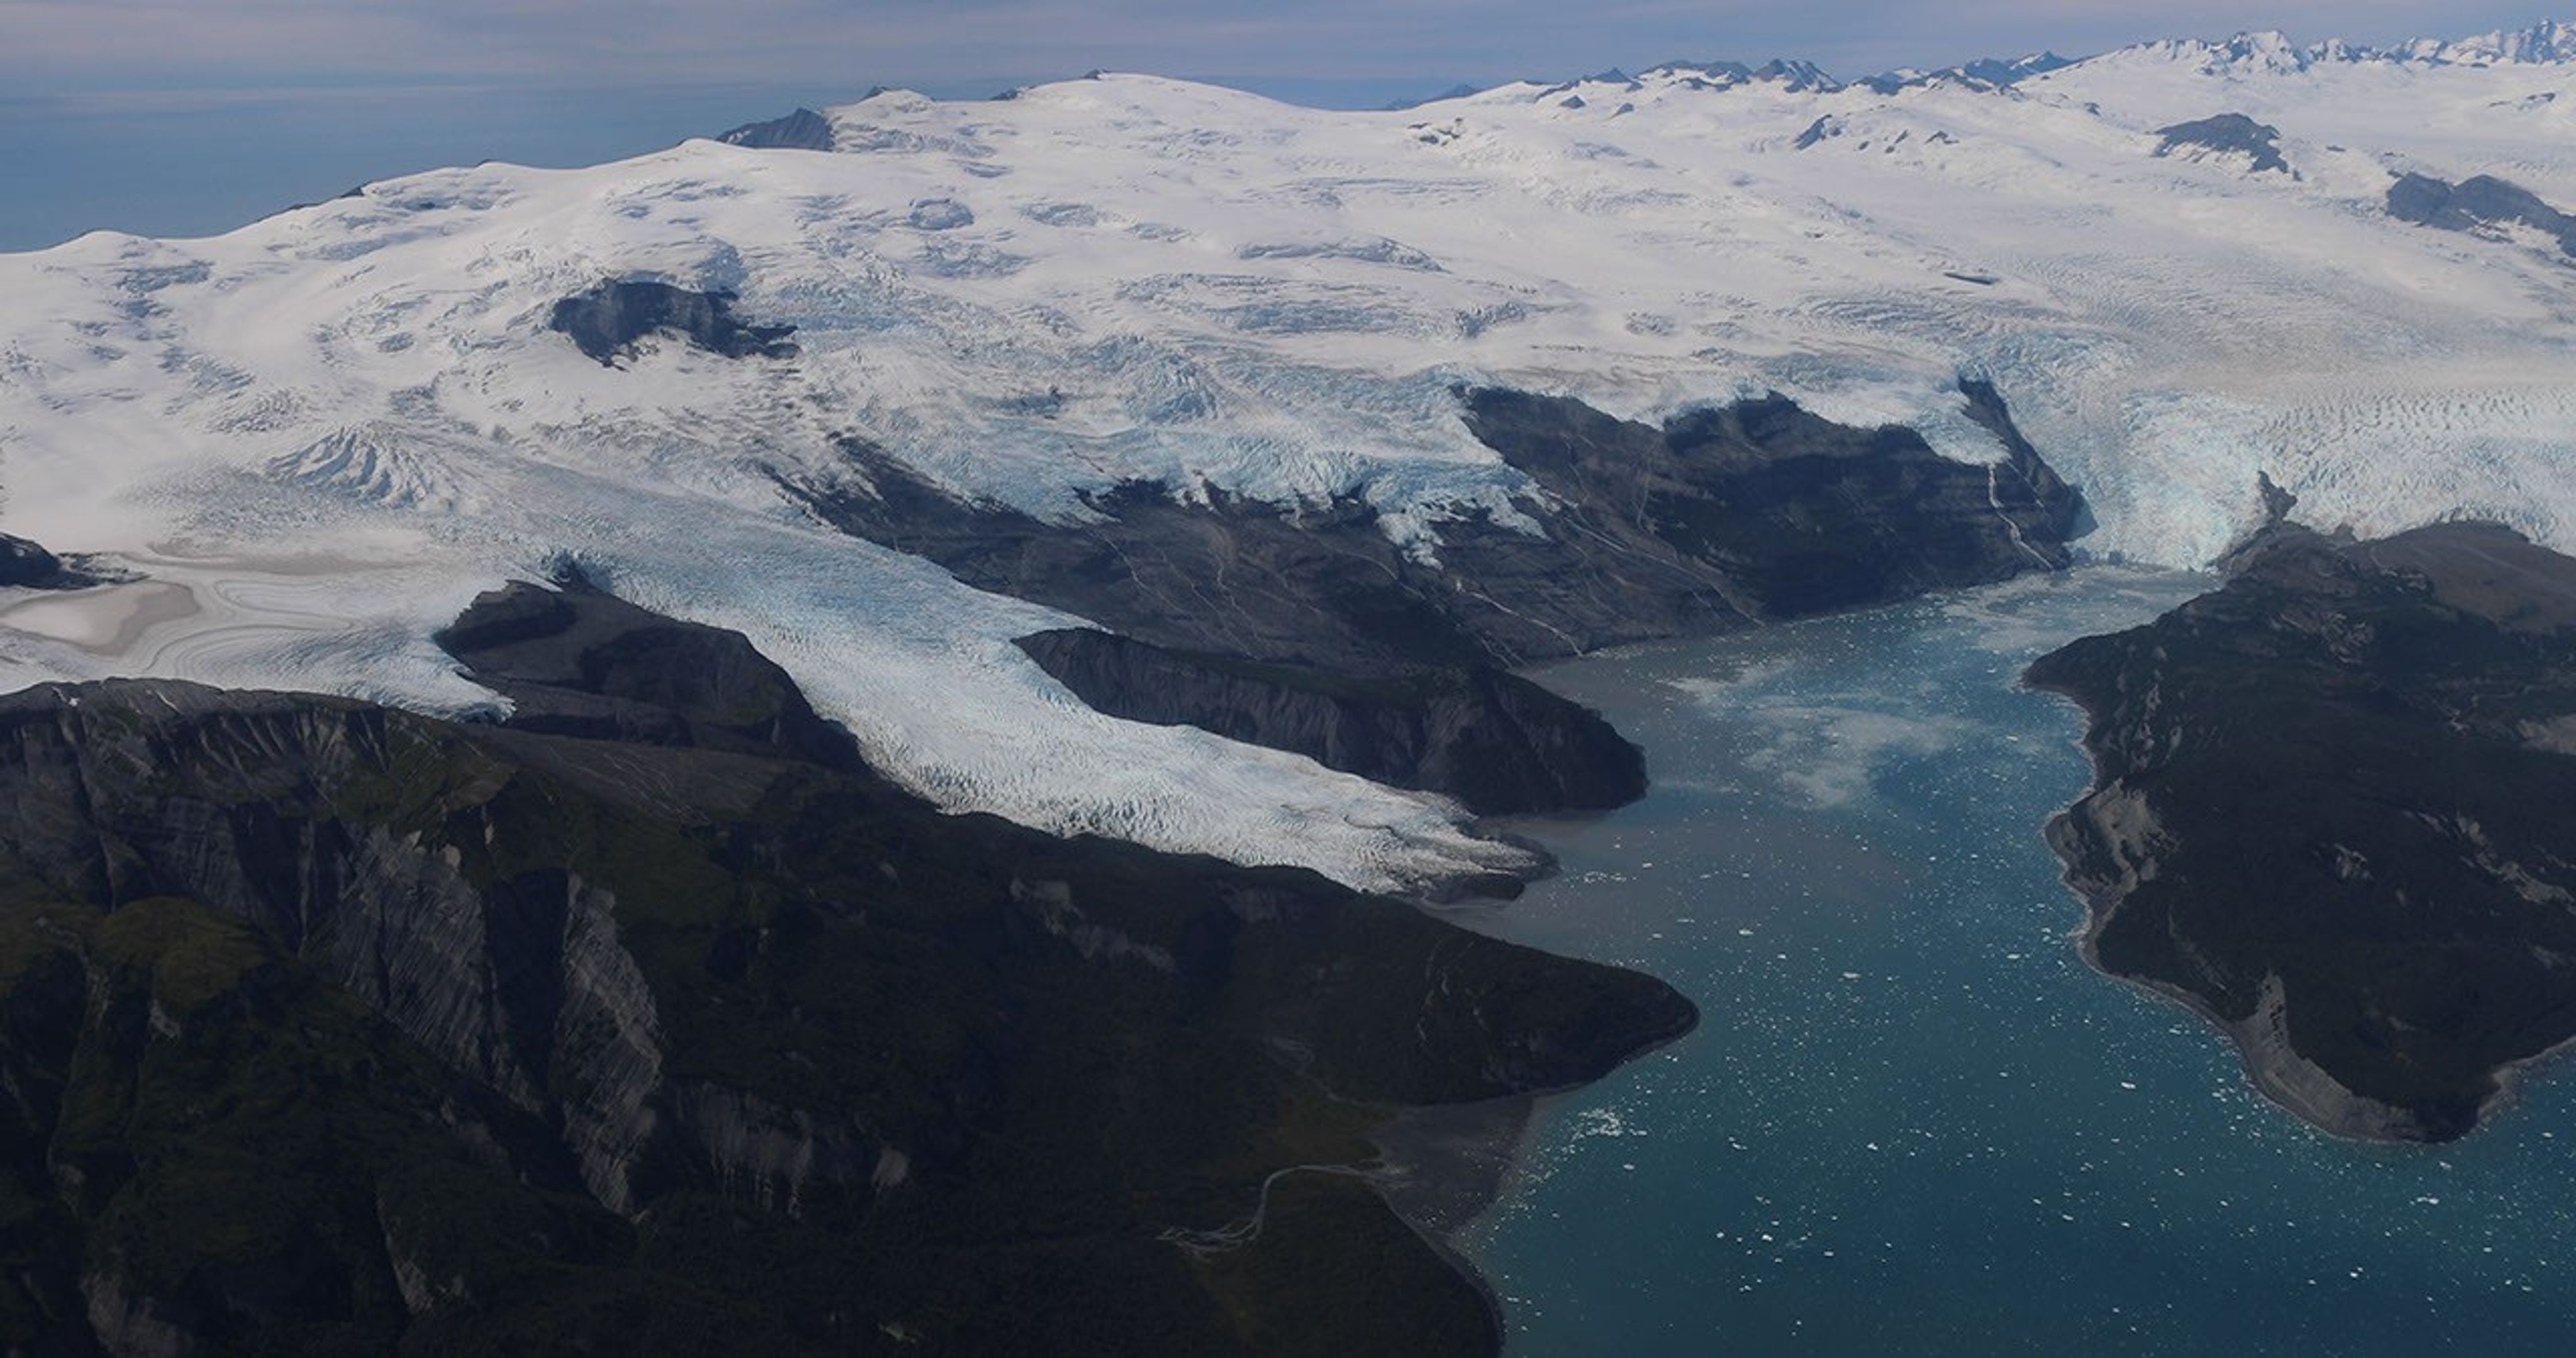
Amid a rugged landscape, a snow-white glacier spills into dark blue water.
Alaska’s glaciers are losing ice and contributing to sea level rise. NASA is tracking the changes from land, air, and space.
NASA

The Snow4Flow campaign, led by the University of Arizona, seeks to measure and model how far and fast glaciers are retreating in the far north. Traversing remote icescapes across Alaska, the Yukon, Arctic Canada, Greenland, and Svalbard, Norway, they’ll sound both the near-surface and frozen depths of hundreds of glaciers while flying over in a modernized WWII-era aircraft outfitted with a scanning laser altimeter and two custom radars. Their observations, combined with satellite data and advanced models of snowfall and glacier flow, will advance our understanding of how glaciers behave in different regions of the Arctic. The mission seeks to uncover not just what these glaciers look like beneath the surface today, but the processes that will drive changes in the future. 

As permafrost thaws, rivers on the doorstep of the Arctic become conveyor belts of carbon and sediment. NASA Goddard, and the City College of New York lead a multidisciplinary team studying how rivers, lagoons, and estuaries across Alaska’s North Slope interact with the Arctic Ocean. The project, called Frontlines of Rapidly Transforming Ecosystems (FORTE) will combine optical and radar measurements from satellites, planes, high-tech research vessels, drones, and underwater autonomous systems to track microscopic marine life, water flow, and chemistry. The team will collaborate with local and tribal communities to sustain observations over time and apply NASA assets to address emerging local needs and decision-making priorities.  

Landslide triggers 

When a slow-moving landslide in California suddenly collapsed and buried a section of coastal highway in 2017, scientists at NASA JPL wanted to know how precipitation swings played a role. JPL studies how water infiltrates and destabilizes hillslopes all over the world. The Landslide Change Characterization Experiment (LACCE) project will combine airborne synthetic aperture radar with land-based sensors to track how slopes in California are responding to a world of intensifying droughts and downpours. The project also takes aim at emerging landslide hazards in Alaska, where rapidly retreating glaciers are accelerating slope movements that have the potential to create mega-tsunamis.  

This series of images shows the collapse of the Mud Creek landslide in May 2017 along the Big Sur coast in Central California, and the subsequent repairs to Highway 1, which was damaged during the event.
Andy Ritchie/USGS Pacific Coastal and Marine Science Center

NASA’s Earth Venture Suborbital program, designed to be nimble and high impact, was established following a recommendation by the National Research Council in 2007. In the decades since, teams have studied phenomena, including blizzards, coral reefs, and ocean whirlpools.  

About the Author

Sally Younger

Share

Details

Last Updated
Jul 20, 2026

How do ice sheets melt?

29 June 2026 at 12:00

Nearly 170 billion tons of ice melt off the Greenland Ice Sheet every year, but scientists don’t fully understand the process by which this melting occurs. Researchers in the past suggested that liquid water forms at the glacier’s surface, where warm air and sunlight melt the ice. This meltwater travels down through cracks in the glacier and along the bedrock beneath it and flows out to sea. 

However, some scientists view this model as too simple because it assumes water only flows downward and ignores how temperature affects water movement. They argue that an oversimplified melting model is unreliable for predicting how future ice sheets will behave.

One group of researchers tested this by investigating how water movement across Greenland is controlled by lakes beneath the ice sheet, called subglacial lakes. They monitored a newly discovered subglacial lake using high-resolution satellite images taken from 2012 to 2019 and 3D surface maps generated from the images. They focused on ice sheet changes from July 22 to August 1, 2014, during a suspected subglacial lake drainage event. A drainage event is like a water balloon that’s too full, bursting from excess pressure. 

They examined images of the Greenland ice sheet taken from Landsat-8, 3D surface maps from the Polar Geospatial Center, and data from ICESat and ICESat-2 taken in the summer of 2014. Based on these data, the researchers identified a 2-square-kilometer (0.8-square-mile) region of ice rising 10 to 15 meters (about 30 to 50 feet), forming a dome on the ice sheet’s surface. They suggested that this dome formed when a large, meltwater-fed lake developed on the bedrock beneath the ice sheet, pushing the ice upward. 

They also saw that on July 22, 2014, the dome began to collapse. Over the next 10 days, it dropped by 85 meters (about 280 feet), forming a basin. Using the dome’s dimensions, the researchers estimated that 90 million cubic meters, or about 3 billion cubic feet, of water drained from the lake at an average rate of 100 cubic meters, or about 3500 cubic feet, per second over the 10 days. This is roughly equivalent to 36,000 Olympic swimming pools draining at a rate of 1 pool every 25 seconds! 

The researchers also found that during the collapse, 40-meter-high (130-foot) ice blocks were uprooted about 1 kilometer (0.6 mile) downstream from the basin, followed by 6 square kilometers (about 2 square miles) of smooth ice. The researchers hypothesized that these features formed when water burst through the ice, flowed along its surface, and then reentered the ice sheet.

Next, they used data from Landsat 5, Landsat 9, the National Snow and Ice Data Center, and the U.S. Geological Survey to demonstrate that the drainage event also affected the surrounding environment. When the water reentered the ice sheet, it flowed beneath the Harding Glacier downstream. This influx of fast-moving water reduced pressure at the glacier’s base, slowing its movement. Simultaneously, the increased drainage beneath the Harding Glacier caused 500 to 600 meters (about 1,600 to 2,000 feet) of ice to break off its end. 

In response to these changes, the researchers hypothesized that subglacial waters rose to the surface rather than sinking to the bedrock because the ice sheet was frozen to it. To test this, they simulated temperatures at the base of the ice sheet using computer-generated thermal models. They input a range of likely bedrock temperatures and ice thicknesses to simulate possible conditions under the ice sheet. They found that all the simulations predicted the glacier’s base would remain below -5°C (23°F). At such low temperatures, the ice would be frozen to the bedrock before subglacial water could drain out. Since water couldn’t flow under the glacier, it was forced to travel upward. 

The researchers used these findings to develop a new conceptual model of how glacial meltwater moves. First, surface ice melts and flows into a subglacial lake. As meltwater accumulates, pressure builds at the base of the ice sheet, forming a dome on the surface. A drainage event causes the dome to collapse. As water moves downward through the glacier, it is blocked from reaching the base because the ice is frozen to the bedrock. The water then moves upward, bursts through the surface, travels across it, and eventually reenters the glacier before draining to the ocean.

The team concluded that water movement above, through, and below glaciers is interconnected. Destructive upward flow of meltwater, followed by downward flow beneath glaciers, can weaken ice sheet structure and alter downstream glacier dynamics. Their work highlights the need for more scientists to consider the processes driving glacial ice loss.

The post How do ice sheets melt? appeared first on Sciworthy.

When glaciers retreat, microbes take over

15 June 2026 at 12:00

As our world is rapidly reshaped by climate change, glaciers have retreated and revealed new swaths of bare land. Throughout the coming decades to centuries, this rocky ground will become dappled with lichens and scrub, eventually giving rise to newborn forests in a process known as ecological succession. 

Ecologists have mapped out the stages of ecological succession for plant communities, observing which species are the first to colonize land and how these pioneer species promote secondary growth. Yet before any plants sink their roots into the soil, it is populated by thriving communities of single-celled microbes that prepare it for further habitation. Scientists study how these microbial communities arise to understand how healthy ecosystems develop.

Newly exposed land is nutrient-poor and subject to large temperature fluctuations, so the first species to settle there must overcome these challenges. Pioneer plant species are often habitat generalists, meaning they can thrive under a variety of environmental conditions. However, all plants convert water and sunlight into carbon and energy. Microbes can use many different energy sources, and often contain genes for multiple metabolisms in their genomes. Therefore, researchers wondered whether pioneer microbes could also be defined by their metabolic flexibility. 

A team of scientists based at Monash University in Australia tested this hypothesis by studying land left in the wake of 2 retreating glaciers: one on an island off the coast of Antarctica and one in the Swiss Alps. The researchers sampled soils along a path from the tip of the glacier outward, which had been exposed to the air for different amounts of time. By comparing the microbial communities within these soils, the researchers could track the different stages of ecological succession after glacial retreat.

The researchers extracted DNA from the soils and analyzed it using 2 sequencing methods. First, they sequenced a gene called 16S rRNA, which is like a microbial fingerprint for the different species present. They used this method to understand the diversity of these communities and track their species overlap, helping them to identify habitat generalists that thrived under different soil conditions. 

To understand the metabolic flexibility of these microbes, the researchers used a second method, known as metagenomics, which sequences all of the DNA in a sample rather than just a single gene. They used these data to reconstruct the entire genomes of microbes present in the soils, providing information on what kinds of metabolic activities they were capable of. The team also measured chemicals like ammonium and sulfide in the soils, as well as atmospheric gases like methane and carbon monoxide, to assess how the microbes used these compounds for growth.

The researchers found microbes inhabiting even the youngest soils, demonstrating the speed at which life takes hold in new environments. The abundance of microbes increased by approximately 8-fold in older soils, alongside a similar rise in species diversity, indicating that complex communities persisted over time. They also found the metabolic capabilities of microbes inhabiting Antarctic and Swiss glacial soils to be remarkably similar, suggesting common selective pressures drove the establishment of these new ecosystems.

They were surprised to discover that the most abundant microbes in younger soils were habitat specialists that were rare in older soils. These pioneer microbes, while still metabolically flexible, had adapted to utilize meager energy sources like atmospheric trace gases, including hydrogen, methane, and carbon monoxide. Many of these microbes could also derive energy from chemicals that dissolved out of rocks, like inorganic sulfur compounds. The researchers proposed that pioneer microbes could quickly take advantage of newly opened ecological niches, like soils exposed during a glacier’s retreat, because of their efficiency at using scant resources. 

They found that habitat generalists, on the other hand, tended to dominate older soils.  This result suggested that the habitat specialists were eventually outcompeted by the slow and steady growth of the habitat generalists in a real-life turtle-and-hare race.

The team concluded that using multiple growth strategies helps microbes adapt to new environments. However, they acknowledged that ecological succession could occur differently in other landscapes, such as in the aftermath of volcanic eruptions, meteorite impacts, or forest fires. They suggested that future researchers work to uncover how microbial communities lay the groundwork across these diverse ecosystems. 

The post When glaciers retreat, microbes take over appeared first on Sciworthy.

Tyndall’s Trail of Bergs

10 June 2026 at 05:01
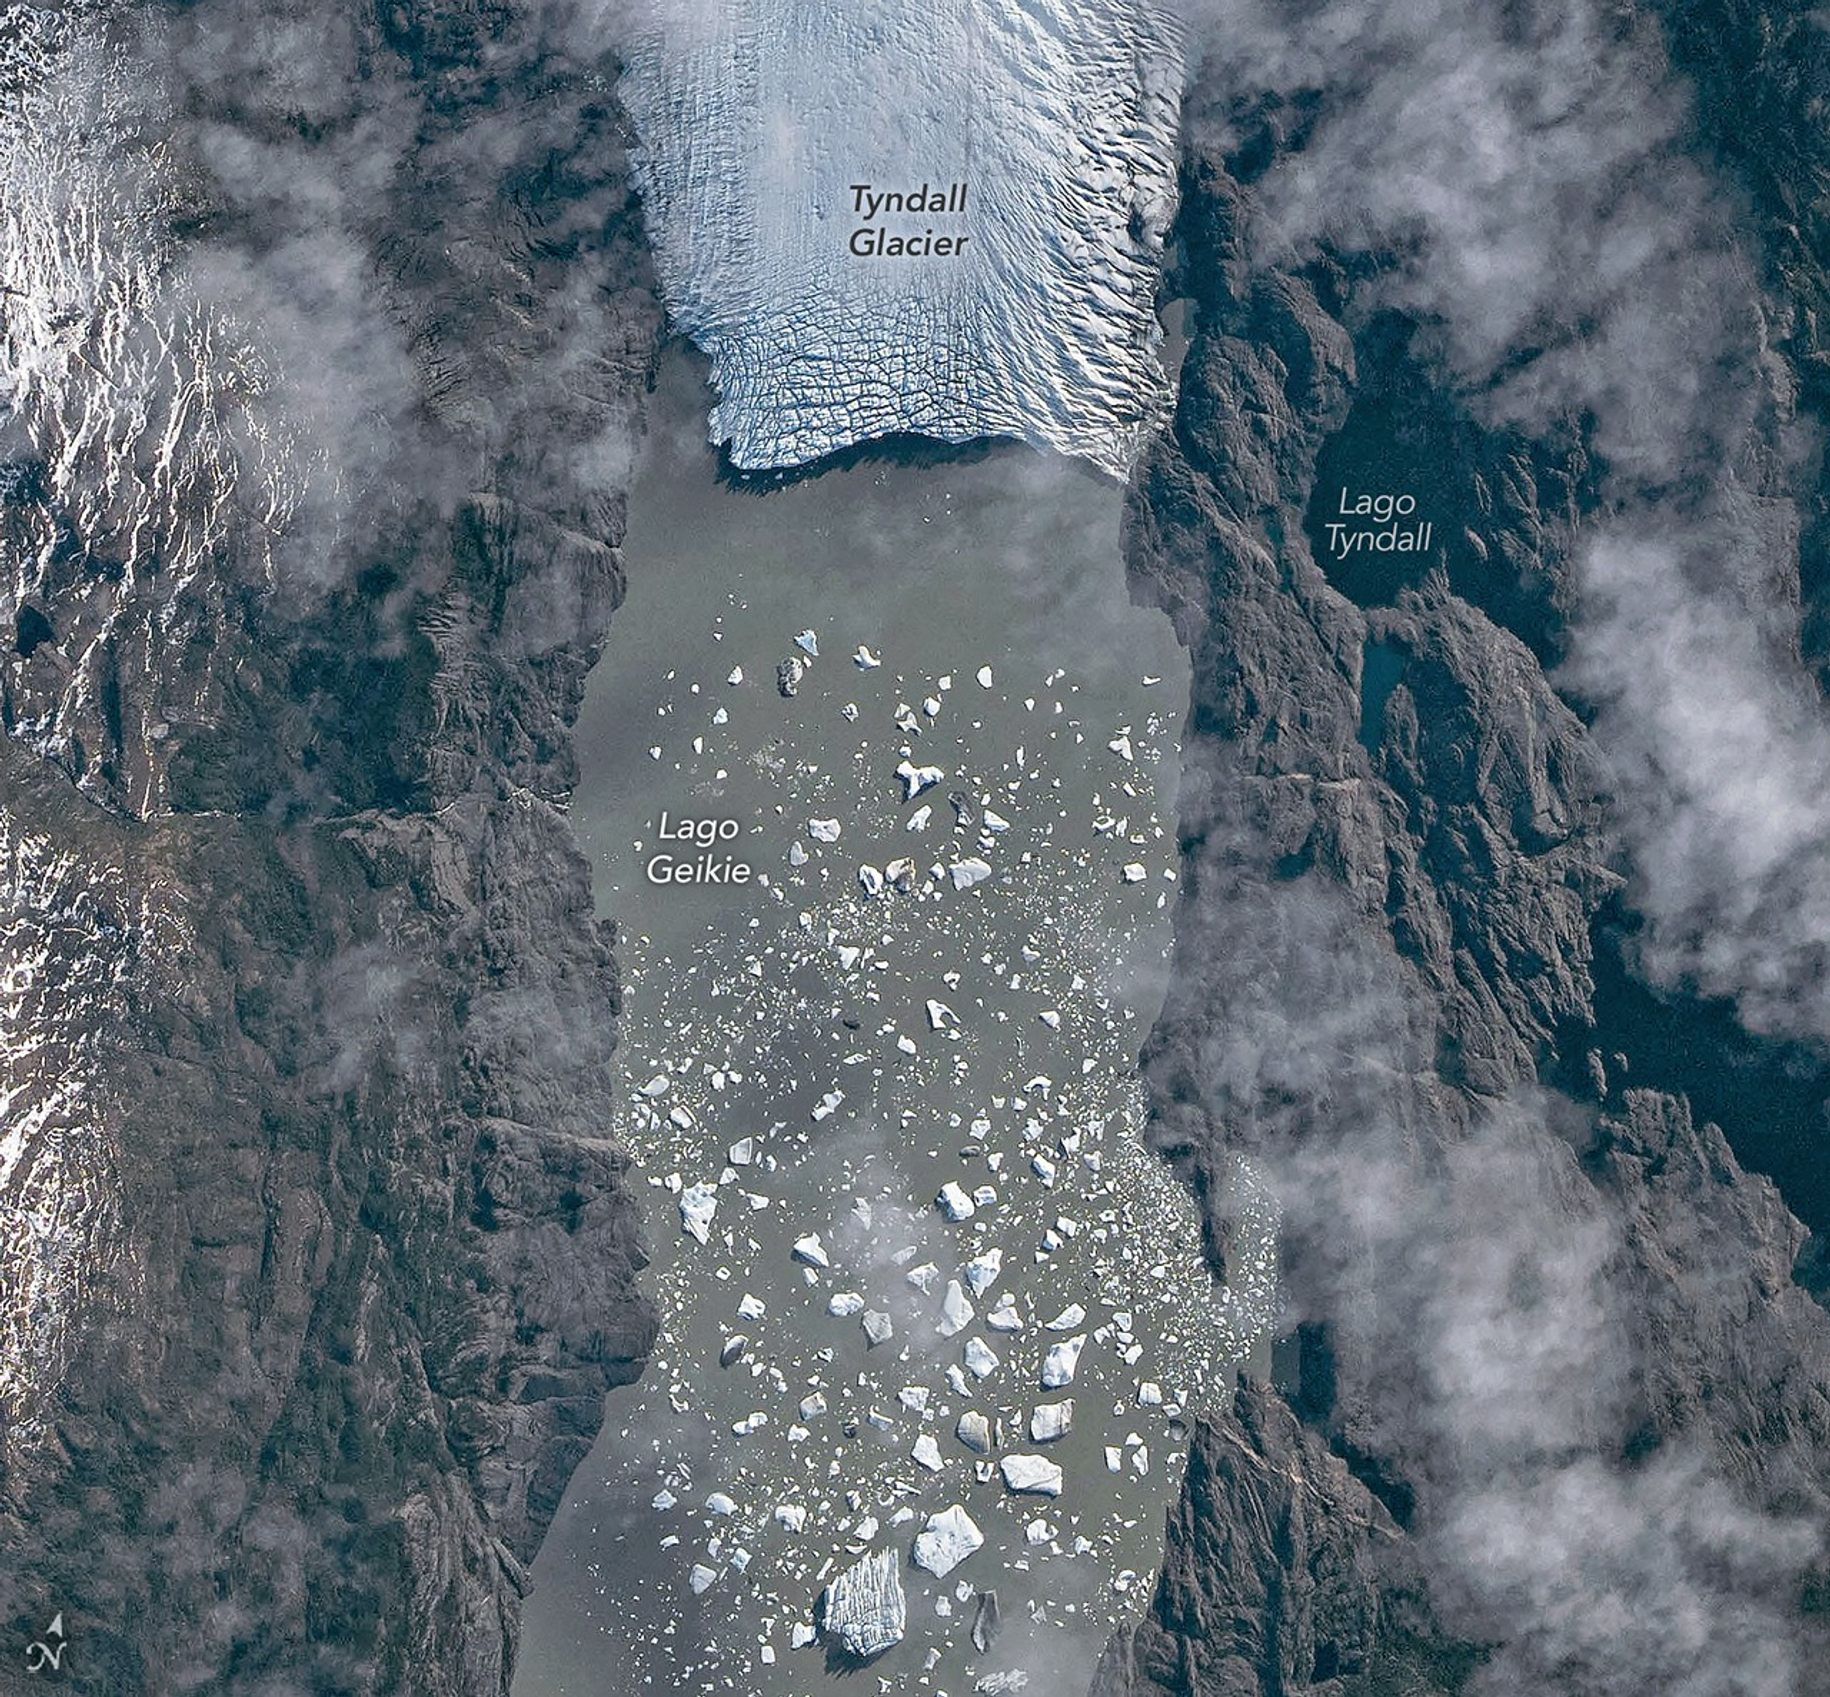
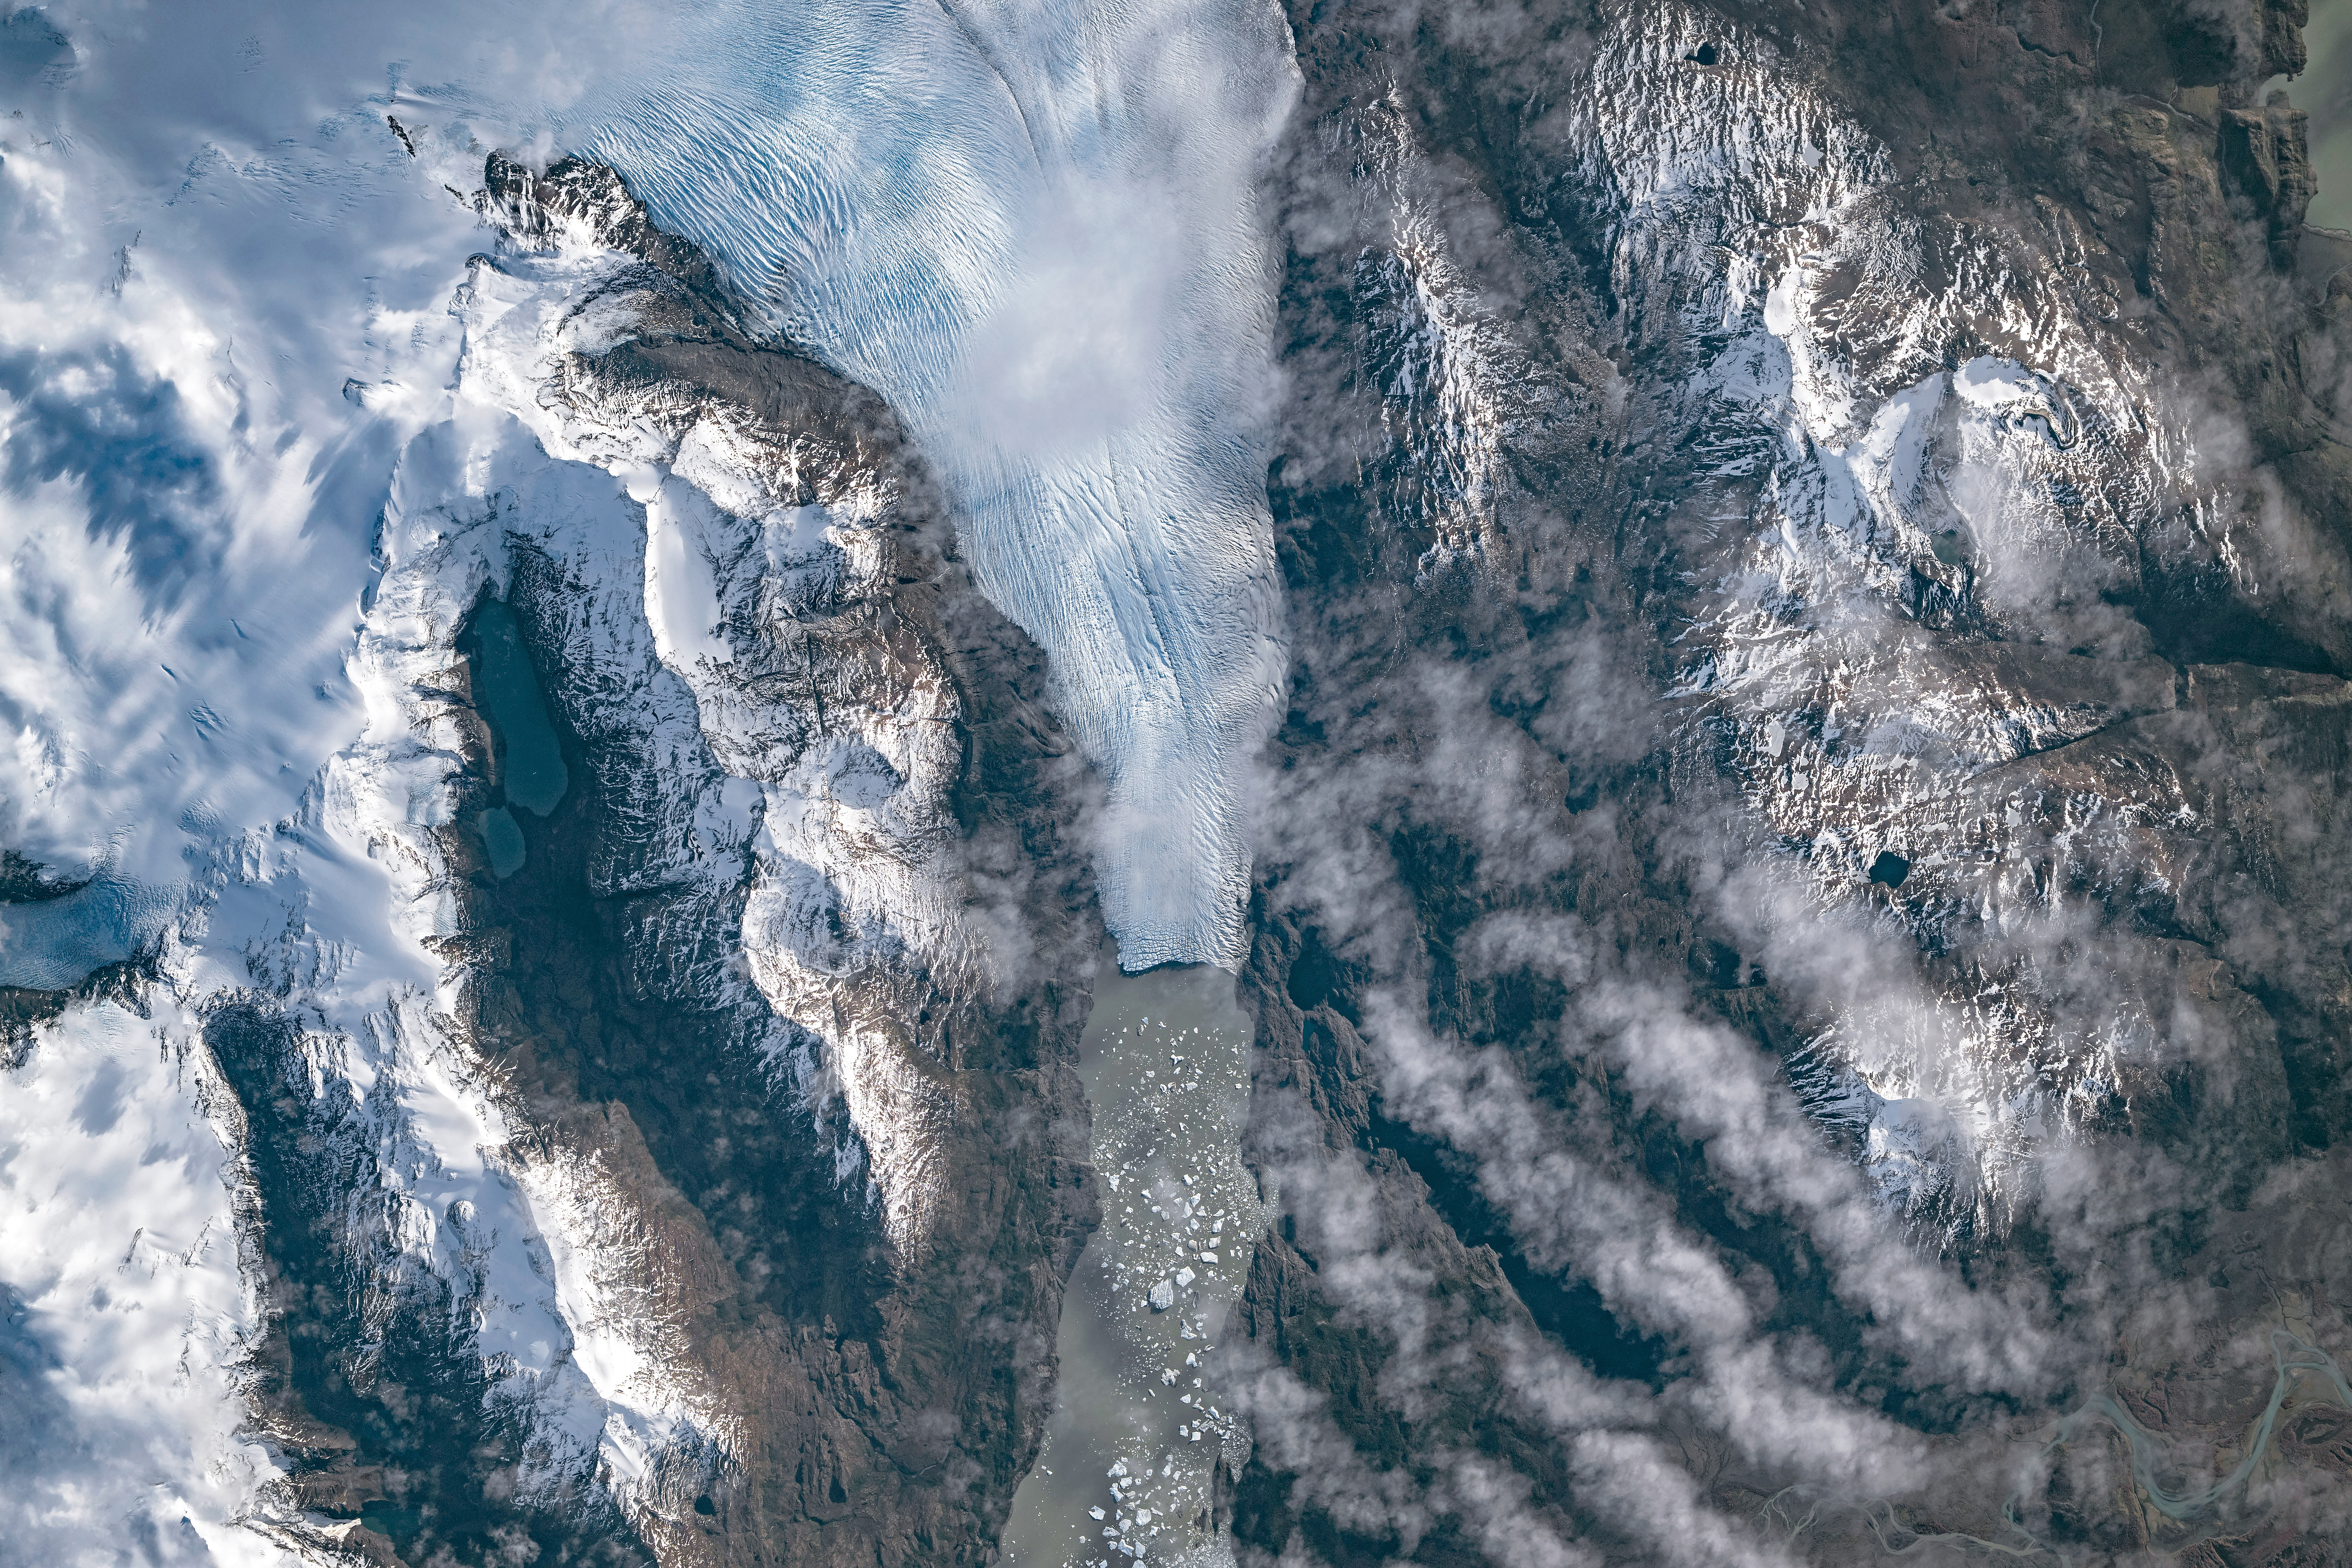
A top-down photo shows a glacier running from north to south amid snowy, mountainous terrain. The glacier flows into a narrow lake where many small icebergs are visible floating on the water.
May 10, 2026

The Southern Patagonian Icefield is the largest expanse of ice in the Southern Hemisphere outside of Antarctica. The mass of glacial ice extends hundreds of kilometers along the spine of the Andes, feeding dozens of dynamic outlet glaciers that grind their way down from higher elevations. Many of these rivers of ice terminate in the sea or in proglacial lakes.

An astronaut aboard the International Space Station photographed one of these glaciers—Tyndall Glacier in southern Chile—through a layer of ethereal clouds on May 10, 2026. Fragments of ice that had calved off its terminus were visible floating on Lago Geikie.

Like most Patagonian glaciers, Tyndall has been shrinking since the end of the Little Ice Age about 150 years ago. Lago Geikie formed at Tyndall’s terminus around 1940, according to glaciologist Mauri Pelto of Nichols College, and gradually expanded as the ice retreated. Part of the glacier previously terminated in Lago Tyndall to the east, but thinning ice cut off that outlet by 2010, Pelto said. (The ice’s retreat also exposed bedrock along its eastern edge that contains scores of ichthyosaur fossils.)

Along with thinning, ice calving off the glacier’s front has reduced its volume. Tyndall has lost 2.2 kilometers (1.4 miles) in length since November 2022, Pelto said, following about a decade of limited retreat with considerable thinning. A significant calving event in March and April 2023 contributed to the recent uptick in ice retreat. During that time, satellites observed several large icebergs breaking away from Tyndall’s terminus.

Austral autumn in 2026 was a time of active calving retreat at Tyndall (and some neighboring glaciers), Pelto said, albeit more incremental than three years prior. “The substantial crevasses crisscrossing the glacier near the calving front lead to many smaller icebergs,” he said. On the other hand, larger tabular icebergs tend to form when there are fewer deep crevasses near the terminus and the glacier’s ice is thinner.

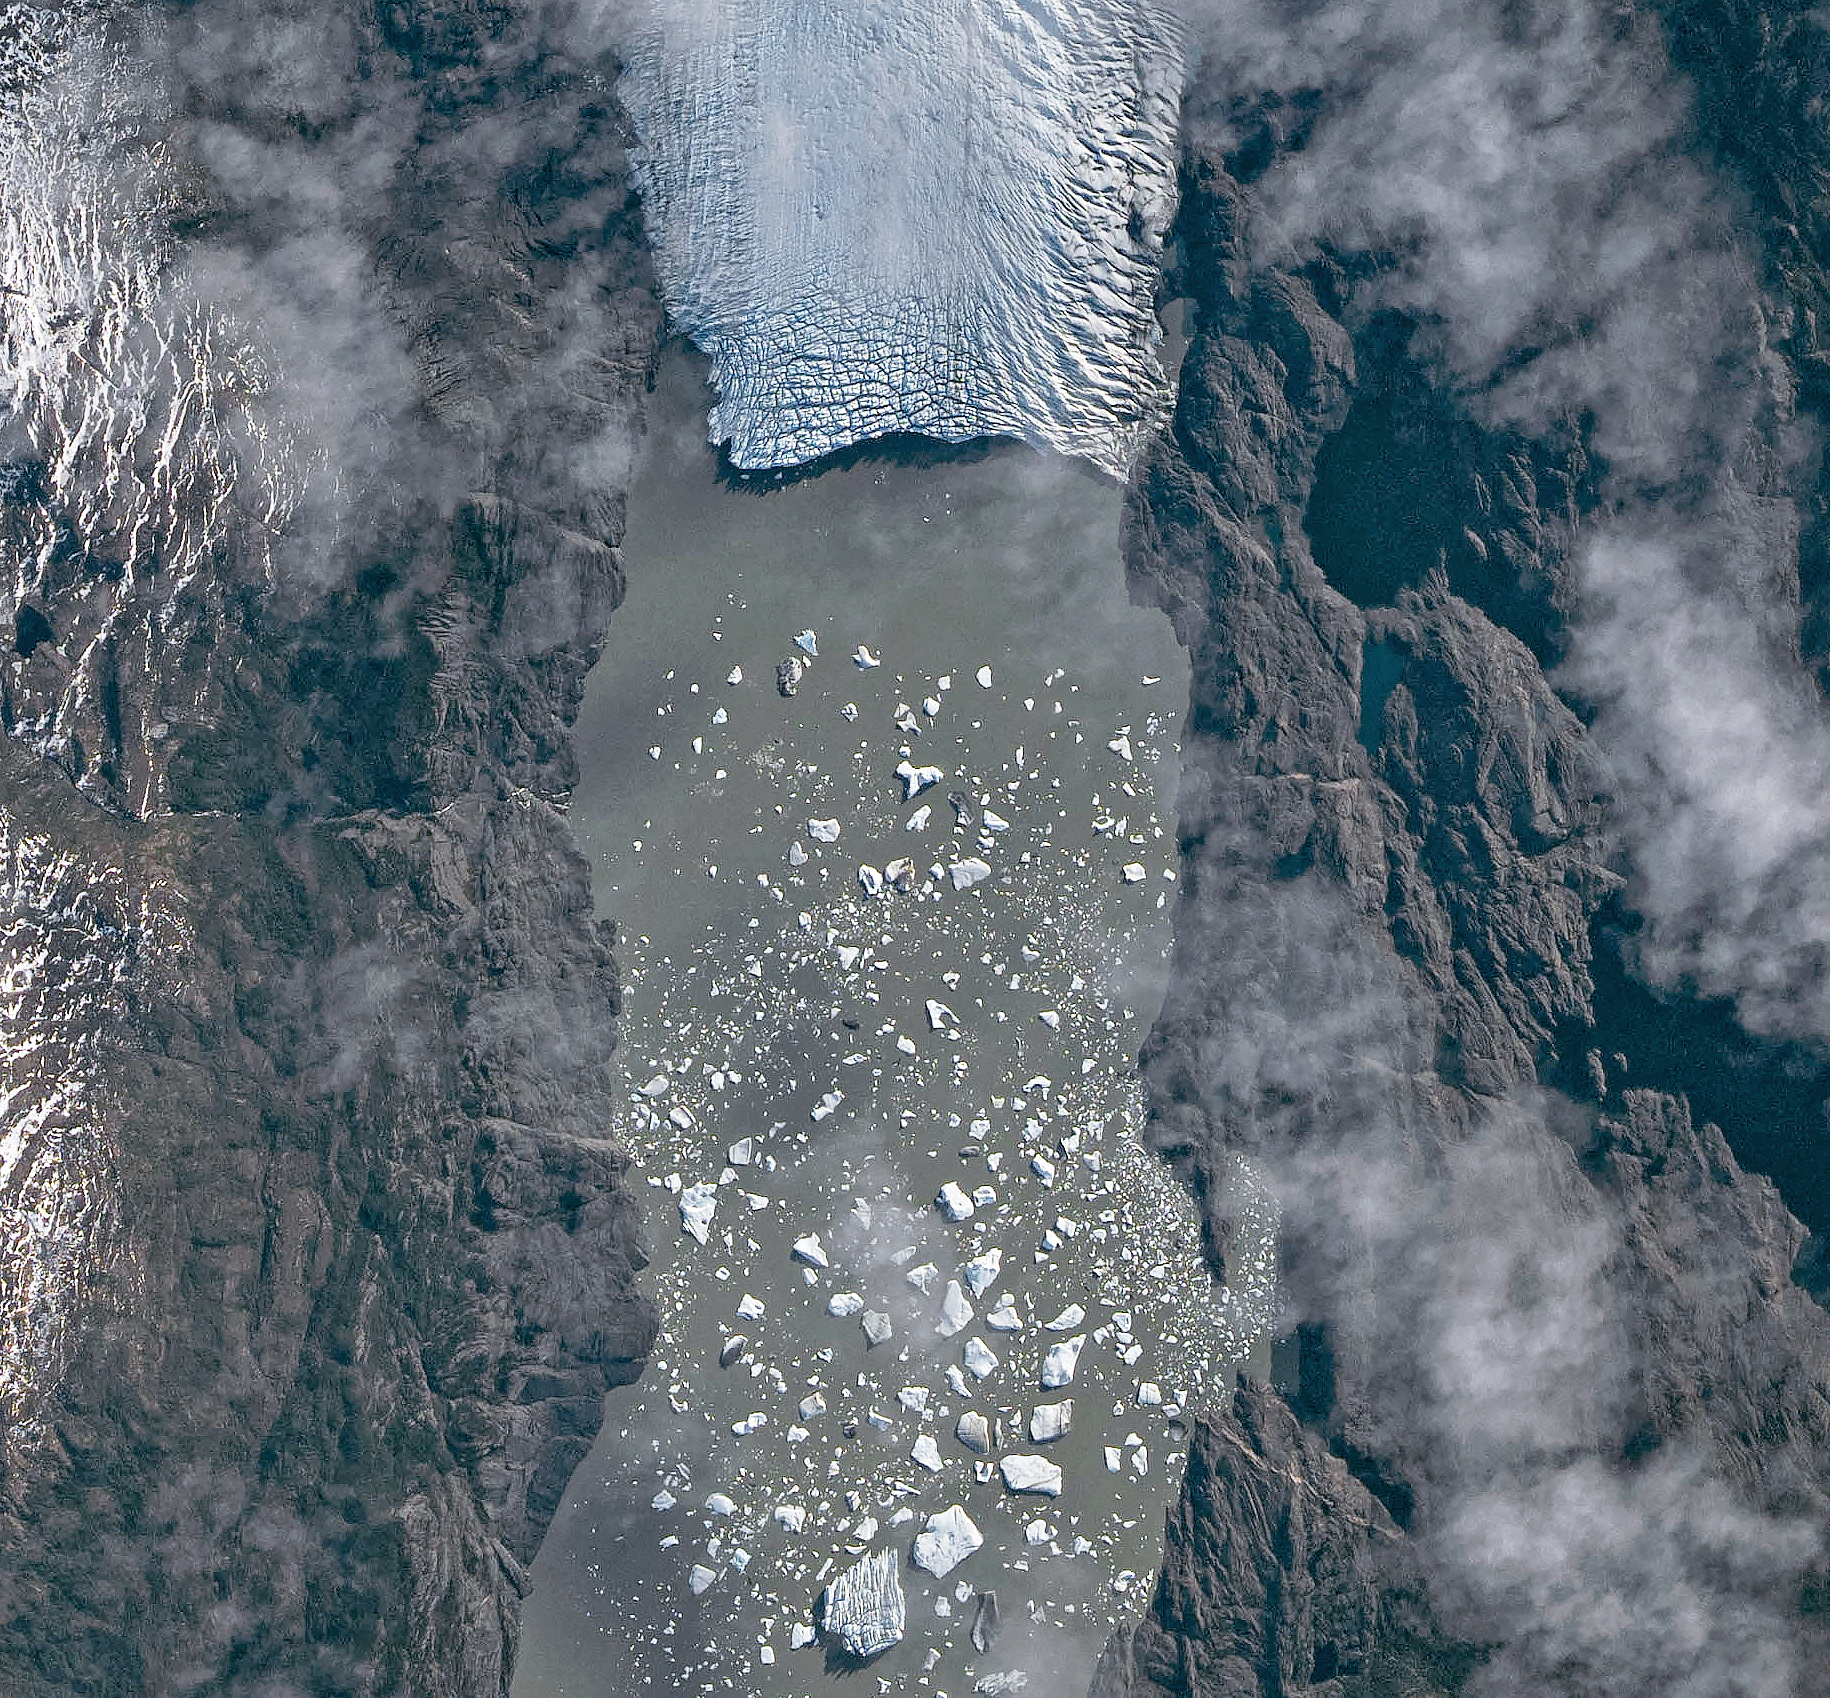
A top-down photo shows a detailed view of the leading edge of a glacier terminating in a lake. The glacial ice is heavily crevassed with intersecting linear features.
May 10, 2026

The ice cliff at the terminus casts a substantial shadow, which can help scientists estimate the height of the glacier’s front. Pelto’s calculations, using information about the Sun’s position provided with the image, indicate that Tyndall’s front loomed 30–40 meters (100–130 feet) above the lake surface in May 2026. Observations from orbit, including astronaut photographs, can help scientists monitor and understand glaciers in remote regions where ground-based observations are scarce.

As for what comes next for Tyndall, Pelto expects many more small icebergs to continue breaking off, given the heavily crevassed appearance of the calving front. “Look for a burst of iceberg production next fall.”

Astronaut photograph ISS074-E-582898 was acquired on May 10, 2026, with a Nikon Z9 digital camera using a focal length of 560 millimeters. It is provided by the ISS Crew Earth Observations Facility and the Earth Science and Remote Sensing Unit at NASA Johnson Space Center. The image was taken by a member of the Expedition 74 crew. The image has been cropped and enhanced to improve contrast, and lens artifacts have been removed. The International Space Station Program supports the laboratory as part of the ISS National Lab to help astronauts take pictures of Earth that will be of the greatest value to scientists and the public, and to make those images freely available on the Internet. Additional images taken by astronauts and cosmonauts can be viewed at the NASA/JSC Gateway to Astronaut Photography of Earth. Story by Lindsey Doermann.

Downloads

A top-down photo shows a glacier running from north to south amid snowy, mountainous terrain. The glacier flows into a narrow lake where many small icebergs are visible floating on the water.

May 10, 2026 (wide)

JPEG (11.19 MB)

A top-down photo shows a detailed view of the leading edge of a glacier terminating in a lake. The glacial ice is heavily crevassed with intersecting linear features.

May 10, 2026 (detailed)

JPEG (3.43 MB)

References & Resources

You may also be interested in:

Stay up-to-date with the latest content from NASA as we explore the universe and discover more about our home planet.

Record-Setting Retreat of Hektoria Glacier
5 min read

Scientists relied on satellite data to understand how the Antarctic glacier lost so much ice so rapidly.

Article
Stonebreen’s Beating Heart
3 min read

The glacier in southeastern Svalbard pulses with the changing seasons, speeding up and slowing its flow toward the sea.

Article
Cañon Fiord’s Whirling Waters
3 min read

During the 2022 summer melt season, sediment plumes and fractured sea ice traced swirling eddies in a branch of the…

Article

The post Tyndall’s Trail of Bergs appeared first on NASA Science.

Tyndall’s Trail of Bergs

10 June 2026 at 05:01
A top-down photo shows a glacier running from north to south amid snowy, mountainous terrain. The glacier flows into a narrow lake where many small icebergs are visible floating on the water.
May 10, 2026

The Southern Patagonian Icefield is the largest expanse of ice in the Southern Hemisphere outside of Antarctica. The mass of glacial ice extends hundreds of kilometers along the spine of the Andes, feeding dozens of dynamic outlet glaciers that grind their way down from higher elevations. Many of these rivers of ice terminate in the sea or in proglacial lakes.

An astronaut aboard the International Space Station photographed one of these glaciers—Tyndall Glacier in southern Chile—through a layer of ethereal clouds on May 10, 2026. Fragments of ice that had calved off its terminus were visible floating on Lago Geikie.

Like most Patagonian glaciers, Tyndall has been shrinking since the end of the Little Ice Age about 150 years ago. Lago Geikie formed at Tyndall’s terminus around 1940, according to glaciologist Mauri Pelto of Nichols College, and gradually expanded as the ice retreated. Part of the glacier previously terminated in Lago Tyndall to the east, but thinning ice cut off that outlet by 2010, Pelto said. (The ice’s retreat also exposed bedrock along its eastern edge that contains scores of ichthyosaur fossils.)

Along with thinning, ice calving off the glacier’s front has reduced its volume. Tyndall has lost 2.2 kilometers (1.4 miles) in length since November 2022, Pelto said, following about a decade of limited retreat with considerable thinning. A significant calving event in March and April 2023 contributed to the recent uptick in ice retreat. During that time, satellites observed several large icebergs breaking away from Tyndall’s terminus.

Austral autumn in 2026 was a time of active calving retreat at Tyndall (and some neighboring glaciers), Pelto said, albeit more incremental than three years prior. “The substantial crevasses crisscrossing the glacier near the calving front lead to many smaller icebergs,” he said. On the other hand, larger tabular icebergs tend to form when there are fewer deep crevasses near the terminus and the glacier’s ice is thinner.

A top-down photo shows a detailed view of the leading edge of a glacier terminating in a lake. The glacial ice is heavily crevassed with intersecting linear features.
May 10, 2026

The ice cliff at the terminus casts a substantial shadow, which can help scientists estimate the height of the glacier’s front. Pelto’s calculations, using information about the Sun’s position provided with the image, indicate that Tyndall’s front loomed 30–40 meters (100–130 feet) above the lake surface in May 2026. Observations from orbit, including astronaut photographs, can help scientists monitor and understand glaciers in remote regions where ground-based observations are scarce.

As for what comes next for Tyndall, Pelto expects many more small icebergs to continue breaking off, given the heavily crevassed appearance of the calving front. “Look for a burst of iceberg production next fall.”

Astronaut photograph ISS074-E-582898 was acquired on May 10, 2026, with a Nikon Z9 digital camera using a focal length of 560 millimeters. It is provided by the ISS Crew Earth Observations Facility and the Earth Science and Remote Sensing Unit at NASA Johnson Space Center. The image was taken by a member of the Expedition 74 crew. The image has been cropped and enhanced to improve contrast, and lens artifacts have been removed. The International Space Station Program supports the laboratory as part of the ISS National Lab to help astronauts take pictures of Earth that will be of the greatest value to scientists and the public, and to make those images freely available on the Internet. Additional images taken by astronauts and cosmonauts can be viewed at the NASA/JSC Gateway to Astronaut Photography of Earth. Story by Lindsey Doermann.

Downloads

A top-down photo shows a glacier running from north to south amid snowy, mountainous terrain. The glacier flows into a narrow lake where many small icebergs are visible floating on the water.

May 10, 2026 (wide)

JPEG (11.19 MB)

A top-down photo shows a detailed view of the leading edge of a glacier terminating in a lake. The glacial ice is heavily crevassed with intersecting linear features.

May 10, 2026 (detailed)

JPEG (3.43 MB)

References & Resources

You may also be interested in:

Stay up-to-date with the latest content from NASA as we explore the universe and discover more about our home planet.

Record-Setting Retreat of Hektoria Glacier

5 min read

Scientists relied on satellite data to understand how the Antarctic glacier lost so much ice so rapidly.

Article

Stonebreen’s Beating Heart

3 min read

The glacier in southeastern Svalbard pulses with the changing seasons, speeding up and slowing its flow toward the sea.

Article

Cañon Fiord’s Whirling Waters

3 min read

During the 2022 summer melt season, sediment plumes and fractured sea ice traced swirling eddies in a branch of the…

Article
❌