❌

Normal view

A New View of the Spectroscopic Universe

8 May 2026 at 17:00

A photograph of a telescope opened at dusk.

The Sloan Digital Sky Survey (SDSS) fundamentally changed the way modern astronomy research is done. This “grand and bold thing” is not frozen in a museum exhibit, however: instead, the SDSS telescopes and team have continued to iterate. The collaboration recently described the fifth generation of this groundbreaking survey in The Astronomical Journal.

Roots in History

Astronomy is now without question a “big data” science. While a lucky few researchers still occasionally travel to distant mountaintops to sojourn with the stars, most astronomers who can describe their work as “observational” rarely ever leave their laptops. Petabytes of historical data, including images, spectra, enormous simulation archives, and more, are available the instant one’s fingers touch a keyboard. As a result, the speed of discovery has increased exponentially, and the barriers to cutting-edge research have dramatically shrunk.

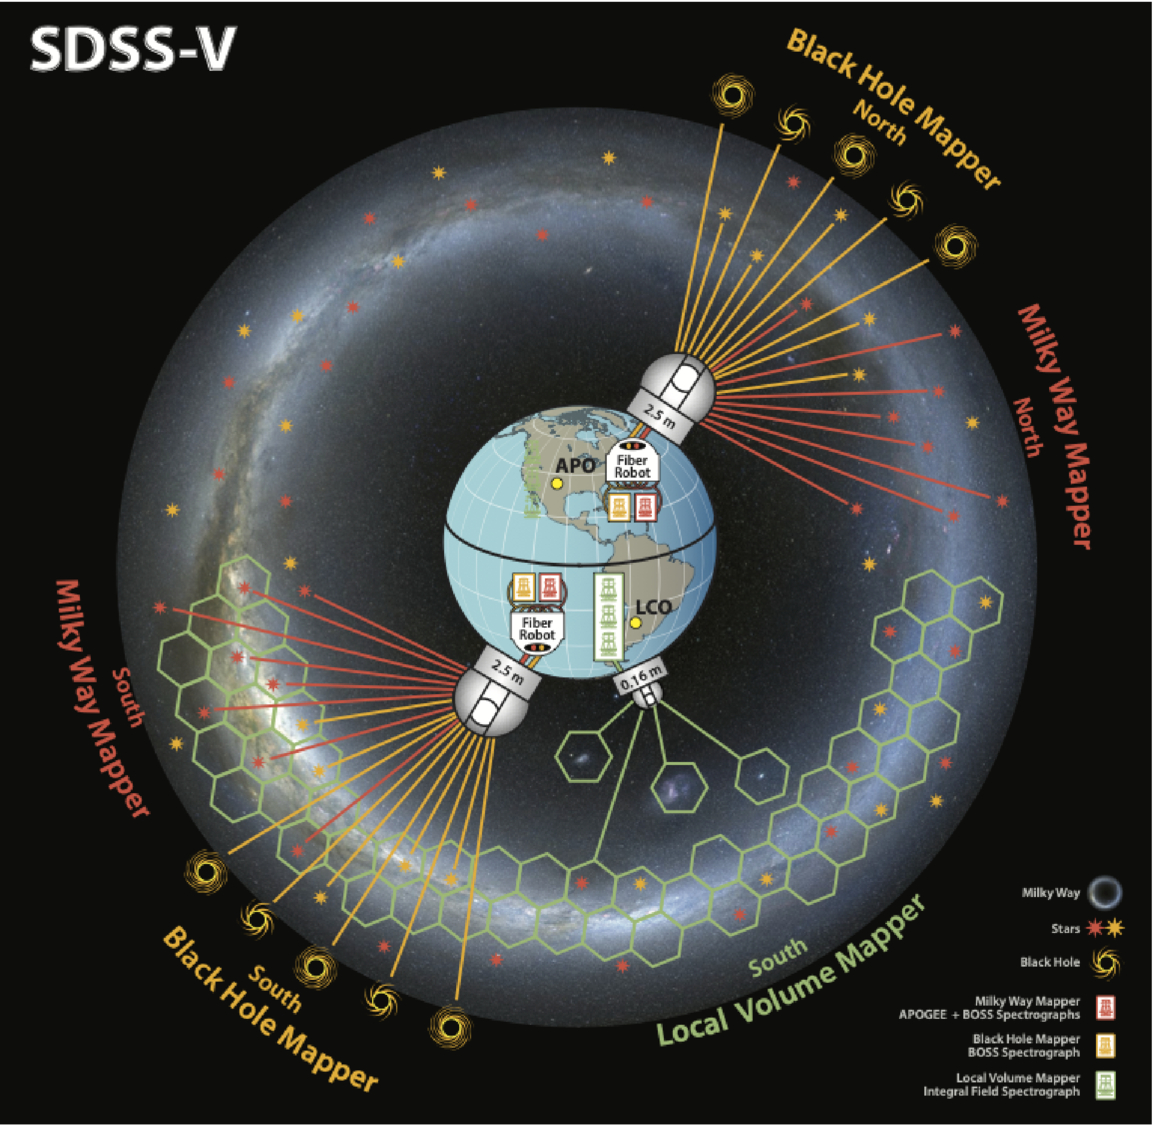
A cartoon of the Earth with three telescopes roughly geographically distributed as they are for the SDSS V survey.

A schematic of the SDSS-V survey facilities and targets. Click to enlarge. [Kollmeier et al. 2026]

While no paradigm shift can be pinned to an exact date, astronomy’s turn towards the data-rich era arguably began in 1998 when SDSS first began collecting data. This was among the first of the “industrial” surveys that observed large swaths of the sky with electronic detectors and used automated pipelines for bulk data processing. In the years since, larger robotic telescopes have begun to mimic the SDSS strategy of “mowing the sky.” The latest of these successors, which itself may usher in another paradigm shift in terms of data volume and availability, is the soon-to-begin Legacy Survey of Space and Time at the Vera C. Rubin Observatory.

While SDSS’s twin 2.5-meter telescopes (one in New Mexico and one in Chile, allowing the survey to observe the entire sky) are dwarfed by Rubin’s 8-meter mirror, there is still thrilling science to be done with these moderate-sized observatories. This is especially true after a series of upgrades to the spectrographs and thanks to a deep expertise in not only survey-style science, but also in project management and survey planning. In 2021, in the middle of COVID-19 delays and distancing requirements, the team began upgrades to their existing facilities and construction of a brand new telescope to kick off the latest survey, SDSS-V.

The Next Generation

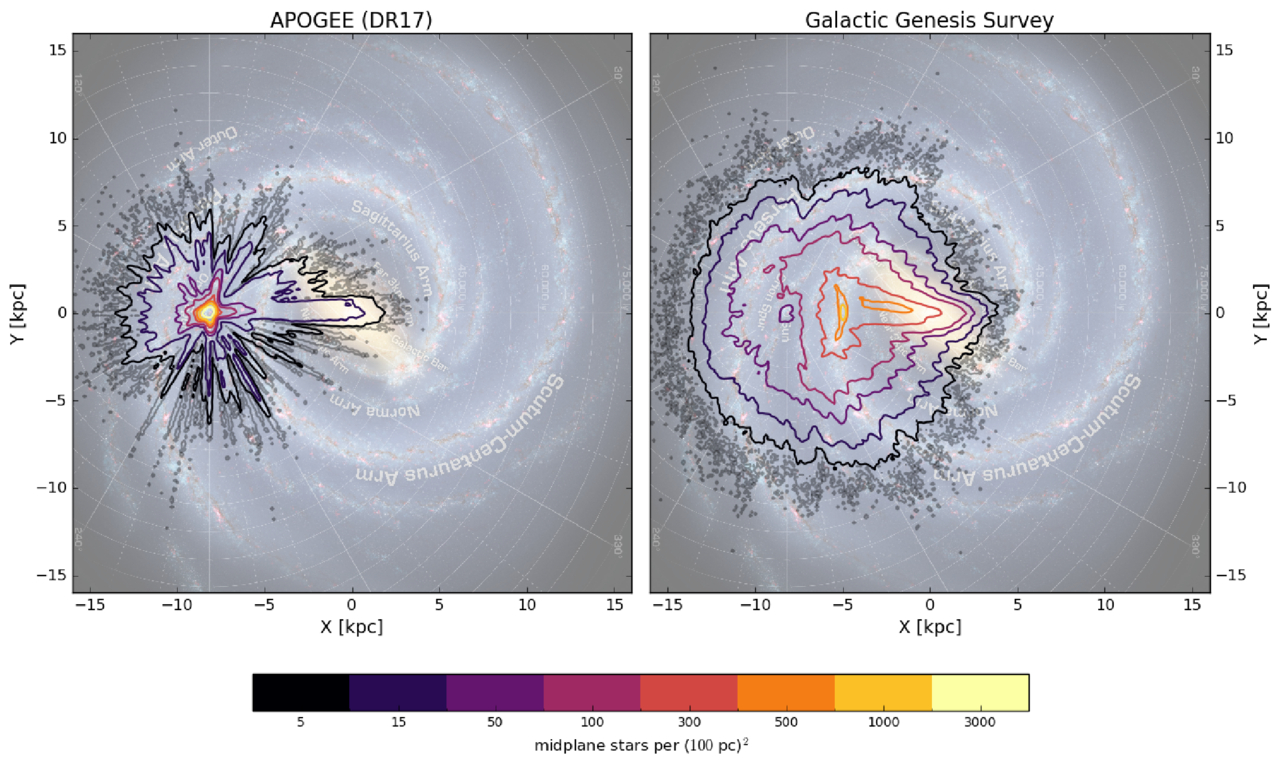
A two-panel figure showing top-down views of the milky way galaxy with different density contours overlaid.

The density of target stars for the SDSS-V survey compared to a previous spectroscopic survey. Click to enlarge. [Kollmeier et al. 2026]

In a wide-ranging publication that references not only astronomy research articles but also Plato, the Bhagavad Gita, an Egyptian tomb, and Tolstoy, the large collaboration describes that this latest survey is divided into three parts: the Milky Way Mapper, the Black Hole Mapper, and the Local Volume Mapper. The preexisting telescopes, which are outfitted with hundreds of tiny robots that can swivel fiber optic cables into place to collect spectra of up to 500 objects at a time, will handle the first two of these “mappers.” A brand-new facility in Chile that’s specifically designed to map the structure of nearby gas will handle the last mapper. Instead of aiming the fibers at a known star or galaxy, this telescope will instead collect a spectrum for every point across an area the size of the full Moon with every exposure.

By the end of the survey, SDSS-V will have collected optical and near-infrared spectra for roughly 6 million objects spread across the whole sky, as well as time-series spectra from about a million of these sources. This dataset, which is unprecedented in both its spatial and temporal coverage, will allow researchers to probe questions ranging from how quasars evolve over time to how commonly young stars have brown-dwarf companions. Long since SDSS initiated the era of industrial survey astronomy, this latest publication shows how the survey continues to lead the way.

Citation

“Sloan Digital Sky Survey. V. Pioneering Panoptic Spectroscopy,” Juna A. Kollmeier et al 2026 AJ 171 52. doi:10.3847/1538-3881/ae0576

The post A New View of the Spectroscopic Universe appeared first on AAS Nova.

Featured Image: Disequilibrium on Display

20 April 2026 at 17:00

eight images from the Hubble Arp Galaxy Survey

Notice anything unusual about these galaxies? Each of the scenes above is crafted from observations from the Hubble Arp Galaxy Survey, which turned the talents of the Hubble Space Telescope toward 216 targets in the Arp and Arp–Madore catalogs. These catalogs contain galaxies that are visibly out of equilibrium, either caught in the middle of an interaction with another galaxy, sporting strange structures, or illuminated by brilliant starbursts. Julianne Dalcanton (Flatiron Institute; University of Washington), Meredith Durbin (University of Washington; University of California, Berkeley), and Benjamin Williams (University of Washington) designed the survey to create an archive of previously unobserved sources in these catalogs of peculiar galaxies. In addition to providing a new high-resolution view of these sources, the team hopes that the survey will serve as a launchpad for new investigations and complementary observations from facilities like JWST and the Atacama Large Millimeter/submillimeter Array. To learn more about the Hubble Arp Galaxy Survey and see more of the new images, be sure to check out the full article linked below.

Citation

“The Hubble Arp Galaxy Survey,” Julianne J. Dalcanton et al 2026 ApJS 283 25. doi:10.3847/1538-4365/adfc67

The post Featured Image: Disequilibrium on Display appeared first on AAS Nova.

How Many Kilonovae Will Rubin Observatory Help Us Spot?

4 February 2026 at 17:00

Vera Rubin Observatory

The detection of gravitational waves and light from a single source was one of the most important discoveries of the gravitational wave era. Can upcoming data from Vera C. Rubin Observatory help astronomers repeat that feat?

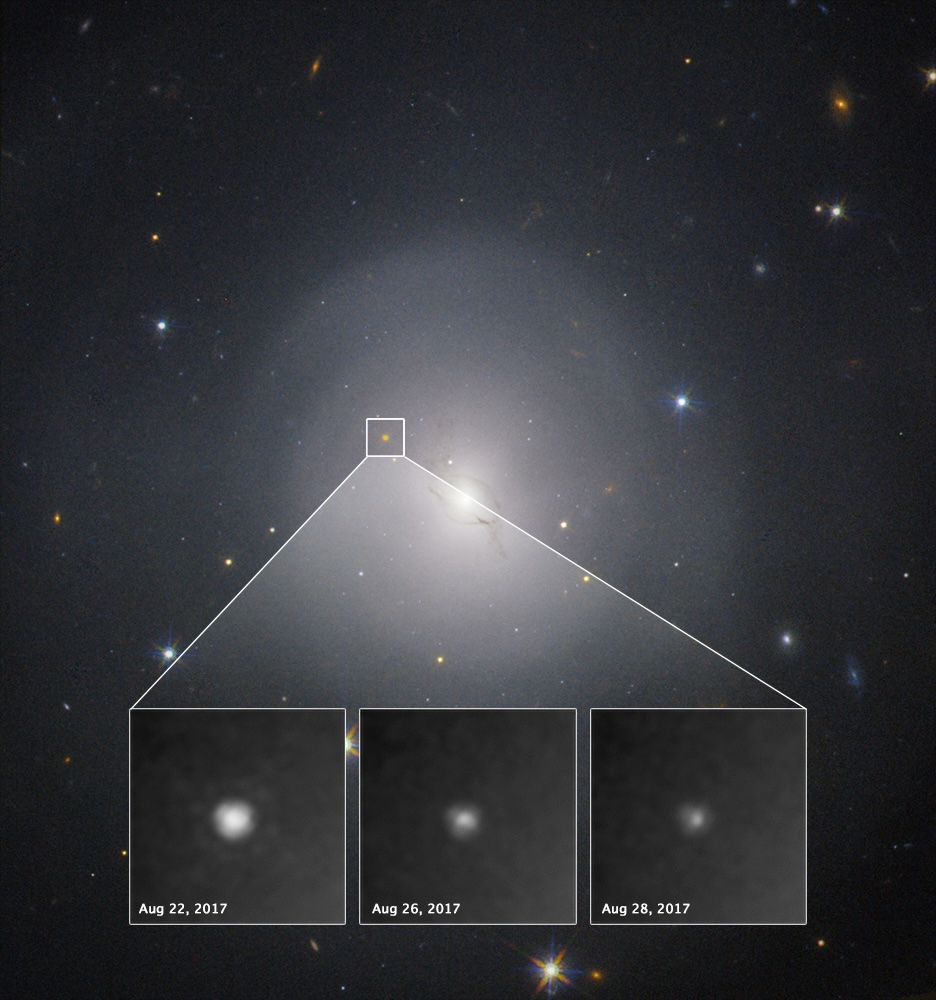
kilonova as seen by Hubble

These images from the Hubble Space Telescope show the fading light of the kilonova associated with the gravitational wave event GW170817. [NASA and ESA Acknowledgment: A. Levan (U. Warwick), N. Tanvir (U. Leicester), and A. Fruchter and O. Fox (STScI)]

Not Yet Repeated

When two neutron stars merge, the collision sends ripples through spacetime and generates an electromagnetic signal called a kilonova. In 2017, researchers detected gravitational waves and kilonova emission from colliding neutron stars — the first and, to date, only electromagnetic signal definitively associated with a gravitational wave event.

In a research article published this week, a team led by Simon Stevenson (Swinburne University of Technology; OzGrav) considered how the much-anticipated Legacy Survey of Space and Time (LSST), carried out by Rubin Observatory, can enhance our ability to detect kilonovae and pair them with their gravitational wave counterparts.

Survey Simulations

When a new gravitational wave signal is detected, researchers rush to search for an electromagnetic counterpart to the signal. While Rubin Observatory can aid this type of reactive search, Stevenson’s team focused on a different strategy: spotting kilonovae during routine survey operations and using these detections to trigger a targeted hunt through gravitational wave data, searching for signals missed by automated detection algorithms.

Over the 10-year course of LSST, Rubin will scan the visible southern sky every few days, uncovering a wide variety of transient sources such as supernovae, novae, and tidal disruption events. Because Rubin will amass a huge amount of data each night, astronomers worldwide will use data brokers to pass along the most promising signals. Stevenson’s team used for their analysis a bespoke and modular data broker called Fink. Fink currently handles 200,000 alerts per night from the Zwicky Transient Facility and will be scaled up to handle 10 million alerts per night as Rubin requires.

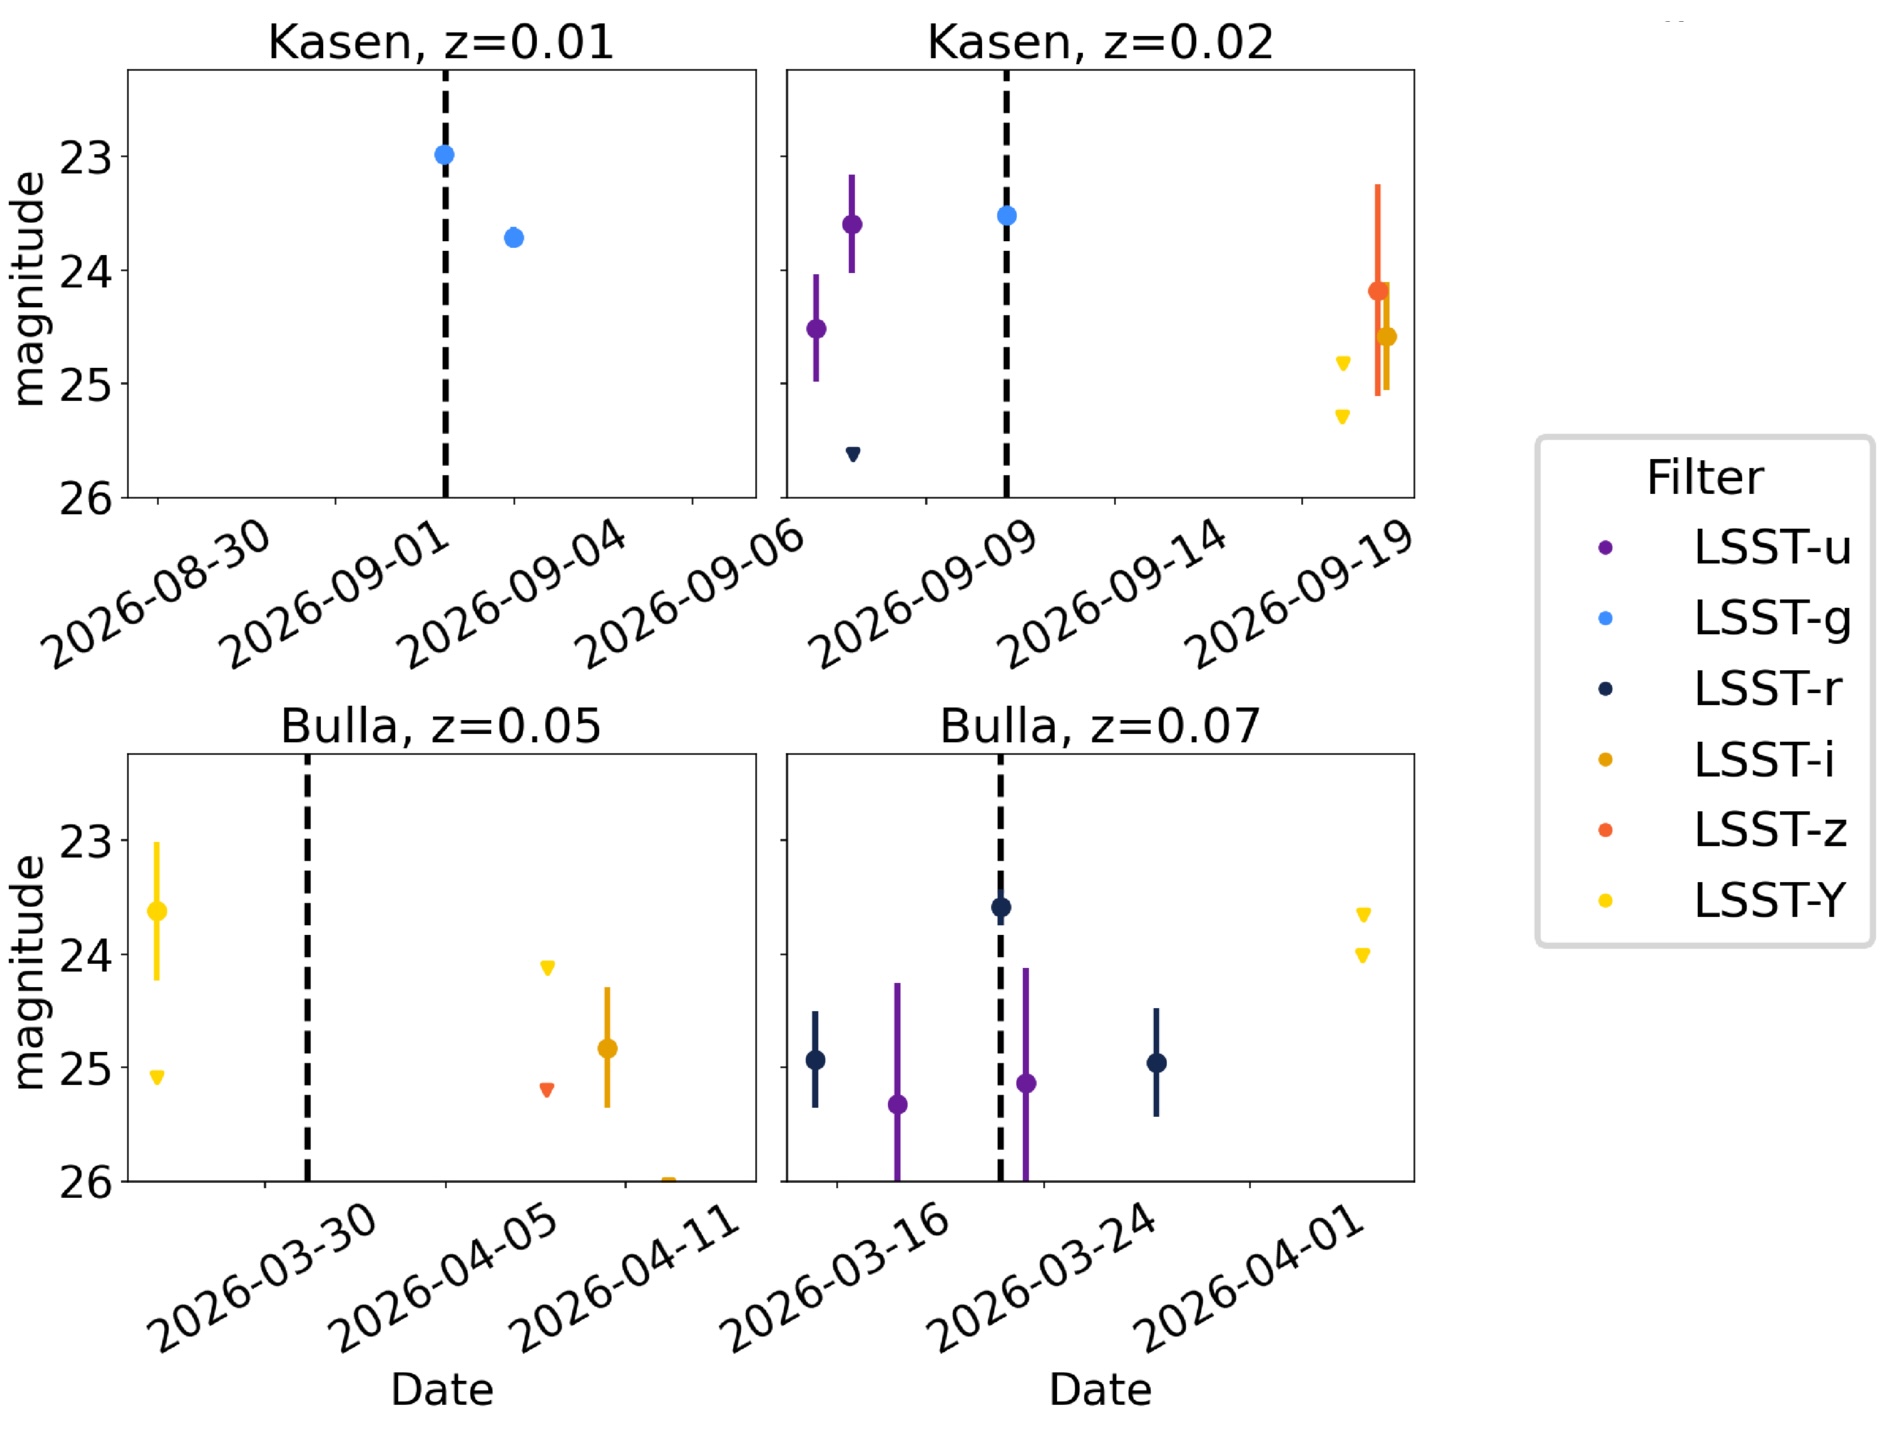
simulated kilonova light curves

Examples of simulated kilonova light curves for different redshifts and models (Kasen and Bulla). Click to enlarge. [Adapted from Stevenson et al. 2026]

Searching for Signals

Though Rubin is a transient-tracking powerhouse, it’s not ideally suited to discovering kilonovae specifically; these events evolve so rapidly that Rubin may only be able to collect a few data points before the event fades from its view. To gauge Rubin’s efficacy as a kilonova detector, Stevenson and collaborators simulated kilonova light curves and identified detections with a signal-to-noise ratio greater than 5; these detections will be passed to the data broker. They found that Rubin will detect about 42 kilonovae per year, but only a few will have a strong enough signal to be passed to the broker.

For the handful of detections that are passed to the broker, what are the prospects for tracking down the associated gravitational wave signals? Due to the survey cadence, most kilonova detections occurred 1–2 days after the gravitational waves from the neutron star collision would have reached Earth, but delays of up to 5 days were possible. This means that searches for gravitational wave signals must sift through multiple days of data — a computationally intensive prospect that might require the development of new search techniques. The computational requirements of this search are increased by the possibility of contaminants (signals misclassified as kilonovae and passed on by the data broker), which will require additional followup.

Despite these challenges, it’s clear that Rubin’s upcoming detections of kilonovae will advance our study of these rare events. With LSST expected to get underway early this year, the next multi-messenger signal may be just around the corner.

Citation

“Strategy for Identifying Vera C. Rubin Observatory Kilonova Candidates for Targeted Gravitational-Wave Searches,” Simon Stevenson et al 2026 ApJ 998 8. doi:10.3847/1538-4357/ae244e

The post How Many Kilonovae Will Rubin Observatory Help Us Spot? appeared first on AAS Nova.

Featured Image: Galaxy Cluster in Technicolor

12 January 2026 at 17:00

galaxy cluster MACS0416

The expansive collection of galaxies pictured here is MACS J0416, a galaxy cluster located about 4.3 billion light-years away. (Click the image for the full view!) MACS J0416 is one of five clusters targeted by the Canadian NIRISS Unbiased Cluster Survey (CANUCS). This survey takes advantage of the spacetime-bending abilities of massive galaxy clusters and uses JWST’s Near-Infrared Imager and Slitless Spectrograph (NIRISS) and Near-Infrared Camera (NIRCam) to paint a detailed multi-wavelength portrait of galaxies in the early universe. Three of the CANUCS galaxy clusters, including MACS J0416, were investigated even more closely in the follow-up JWST in Technicolor program, which added precise spectroscopic redshifts and broadened the wavelength coverage of parallel fields of view. In a recent publication led by Ghassan Sarrouh (York University), the CANUCS team outlined the design of these programs and their data products, which enabled the study of roughly 53,000 galaxies within the galaxy cluster fields and an additional 44,000 galaxies in adjacent fields. To learn more about the CANUCS and JWST in Technicolor programs, be sure to check out the full research article linked below.

Citation

“CANUCS/Technicolor Data Release 1: Imaging, Photometry, Slit Spectroscopy, and Stellar Population Parameters,” Ghassan T. E. Sarrouh et al 2026 ApJS 282 3. doi:10.3847/1538-4365/ae1611

The post Featured Image: Galaxy Cluster in Technicolor appeared first on AAS Nova.

Featured Image: Studying the Space Weather of Young Suns

8 December 2025 at 17:00

radio antennae in front of a mountain background

This image shows the Owens Valley Radio Observatory Long Wavelength Array (OVRO-LWA), a recently upgraded collection of 352 antennas spanning 2.4 kilometers east of the Sierra Nevada mountain range in California. A research team led by Ivey Davis (California Institute of Technology) recently outlined their survey that uses OVRO-LWA to study space weather on young Sun-like stars. The Study of Space Weather Around Young Suns (SWAYS) uses both OVRO-LWA and a 0.5-meter optical telescope to observe white-light stellar flares and any accompanying low-frequency radio emission from five stars with temperatures of 5000–6000K and ages of 100–800 million years. Though detections of stellar flares are common, the bursts of radio emission associated with flares and coronal mass ejections have yet to be identified conclusively on other stars. Previous studies have focused on M-dwarf stars, whose strong magnetic fields and plasma environments might limit the production of radio bursts, and have lacked the dedicated monitoring needed to detect transient bursts — problems that SWAYS has solved. To learn more about the instrumentation and design behind SWAYS, be sure to check out the research article linked below.

Citation

“A Dedicated System for Coordinated Radio and Optical Monitoring of the Space Weather of Young, Solar-Type Stars,” Ivey Davis et al 2025 ApJ 993 82. doi:10.3847/1538-4357/adfbe9

The post Featured Image: Studying the Space Weather of Young Suns appeared first on AAS Nova.

Do You Have This Andromeda Galaxy in Extra-Extra-Extra Small?

12 November 2025 at 17:00

Andromeda Galaxy

Editor’s Note: Astrobites is a graduate-student-run organization that digests astrophysical literature for undergraduate students. As part of the partnership between the AAS and astrobites, we occasionally repost astrobites content here at AAS Nova. We hope you enjoy this post from astrobites; the original can be viewed at astrobites.org.

Title: Deep in the Fields of the Andromeda Halo: Discovery of the Pegasus VII Dwarf Galaxy in UNIONS
Authors: Simon E. T. Smith et al.
First Author’s Institution: University of Victoria
Status: Published in ApJ

Picture a galaxy. It’s big, right? Unfathomably big, huge even! But galaxies aren’t all extremely massive; they come in a variety of sizes and luminosities, and some galaxies are so small and so dim that astronomers may not even know they’re there, even when they’re basically in our backyard. The hunt for the smallest galaxies is an important one, as these systems give us extreme environments where we can test theories of dark matter and galaxy evolution. The authors of this article present a newly discovered ultra-faint dwarf galaxy dubbed Pegasus VII (Peg VII), found next to our nearest major galactic neighbour: Andromeda.

How Do You Find a Dwarf Galaxy?

Finding ultra-faint dwarf galaxies requires deep, long-exposure imaging across wide swaths of the night sky, something that is only possible through observational surveys. Some telescopes, like JWST, require astronomers to submit an application to point the telescope at a specific, known target and, if approved, will have some amount of “telescope time” to do their imaging. Others, like the Euclid space telescope, are part of large surveys in which an area of the sky is selected and systematically imaged over several years, regardless of if there are known objects there or not. Because of this, surveys are our best bet to discover faint systems like ultra-faint dwarf galaxies.

The survey these authors used is UNIONS (Ultraviolet Near Infrared Optical Northern Survey), which covers the same area of the sky as the Euclid space telescope but is done with three ground-based telescopes: the Canada-France-Hawaii Telescope, Pan-STARRS, and Subaru, all located on Maunakea in Hawaiʻi. The authors were originally focused on finding satellite galaxies in the outskirts of Andromeda’s gravitational influence and during their search were able to identify an overdensity of bright stars. They then applied for and were awarded telescope time with both the Canada-France-Hawaii Telescope and the Gemini Observatory to perform deeper follow-up imaging of the system to figure out what exactly it was.

Optical Illusion or Optical Observation?

With this deeper follow-up imaging they could confirm if these stars were really one coherent system or if they just appeared to be clumped together on the sky. When they plotted the stars on a colour–magnitude diagram (Figure 1) they were able to identify a main sequence, horizontal branch, and red giant branch, as would be expected if these stars all formed at roughly the same time and were allowed to evolve over billions of years. Congratulations, it’s a dwarf galaxy!

color–magnitude diagrams for stars identified as being within or outside of Peg VII

Figure 1: Left: The colour–magnitude diagram for all stars within 2 half-light radii of Peg VII. Those inside the orange dashed lines are identified members of Peg VII, and the red lines are the best-fit isochrones. The vertical red line is the main sequence, the curve at the top is the red giant branch, and the horizontal line is the horizontal branch. Below the black dashed lines are stars that are too dim to be reliably used in the analysis. Right: The colour–magnitude diagram for stars that appear to be around Peg VII that are not actually members. These stars don’t follow the main sequence at all. [Adapted from Smith et al. 2025]

All together, Peg VII only hosts around 82 stars and is physically 129 times smaller than Andromeda. This results in an absolute magnitude of −5.7 (in astronomy, the more negative the absolute magnitude, the greater the object’s intrinsic brightness). For context, Andromeda hosts more than 1 trillion stars resulting in an absolute magnitude of −21.5, making Peg VII 2 million times dimmer than its massive neighbour. This definitively makes Peg VII the dimmest known Andromeda satellite galaxy. See Figure 2 for more about Andromeda’s satellites.
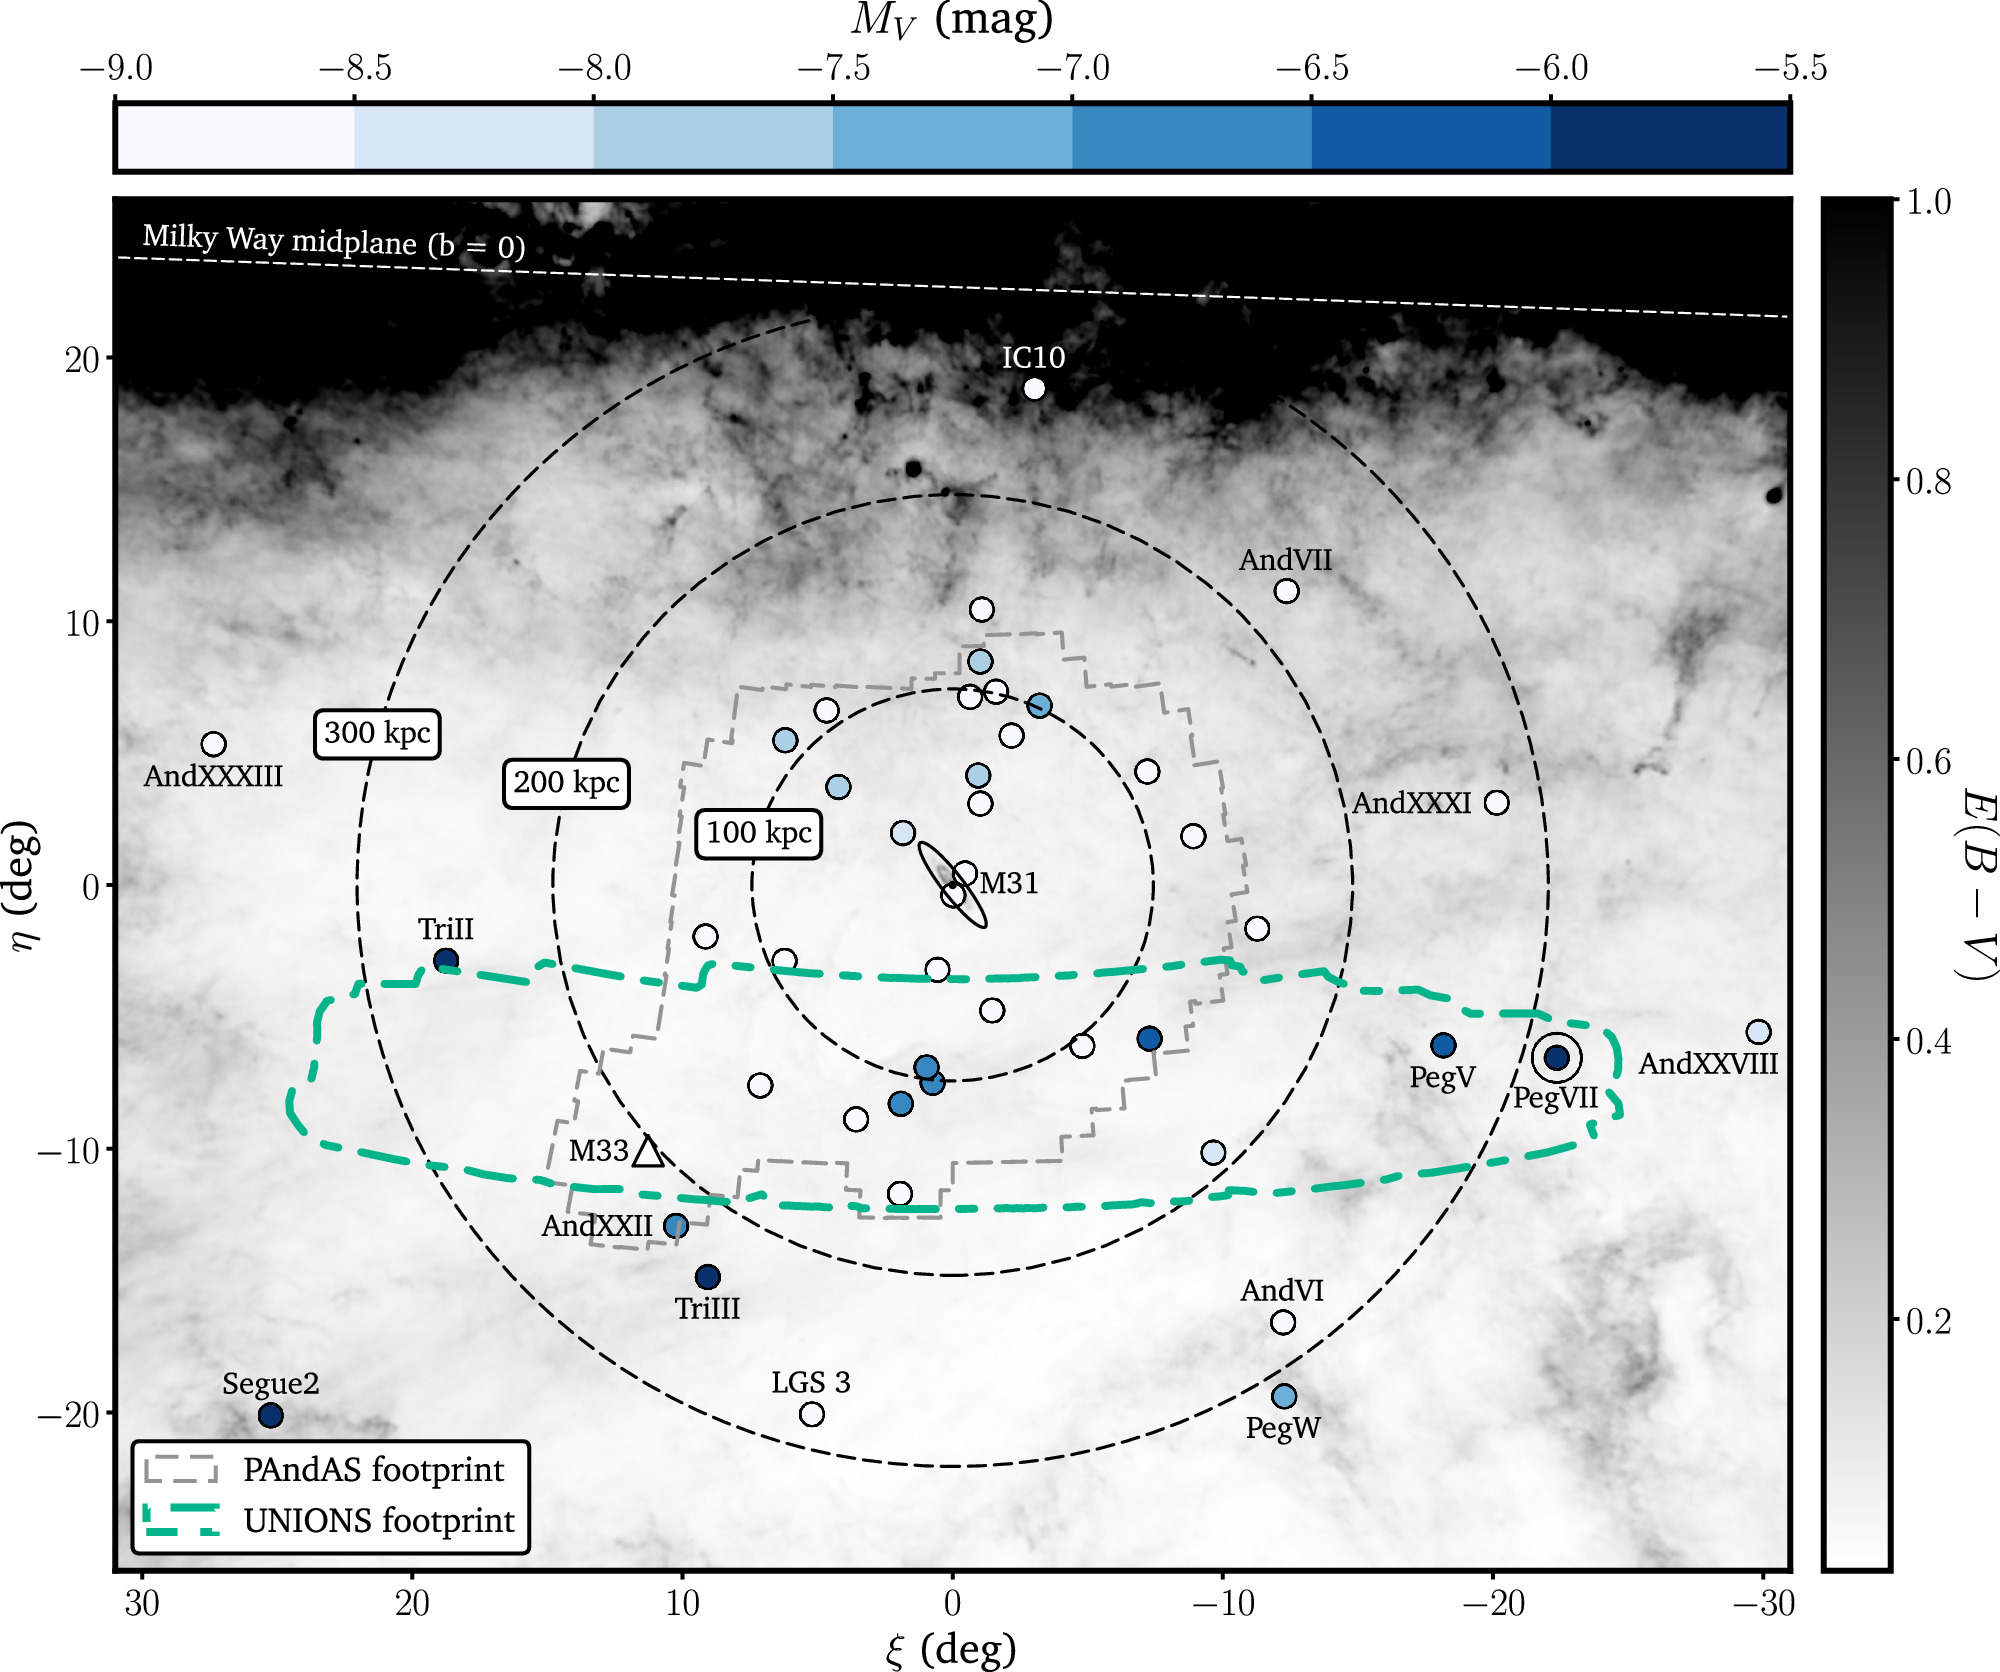
locations of Andromeda Galaxy satellites and survey footprints

Figure 2: The spatial distribution of the Andromeda (M31) satellite galaxy system. Galaxies are coloured based on how bright they are (darker means dimmer). The dashed grey line denotes the area covered by PAndAS, a survey focused on Andromeda satellites that are more centrally concentrated. The dashed green line denotes the area covered by the UNIONS survey, with Peg VII on the right-hand side, more than 978,000 light-years from Andromeda. [Smith et al. 2025]

With their colour–magnitude diagram, the authors could also fit isochrone models to estimate other properties of the system. Essentially, they performed simulations of systems with a variety of ages and metallicities and determined what the colour–magnitude diagrams of these system would look like and compared them to Peg VII’s. They estimate Peg VII to be around 10 billion years old and very metal-poor, which is expected for a small galaxy like this.

How Are Baby Dwarf Galaxies Made?

The big question surrounding Peg VII is how exactly it got like this. Did it originally form with so few stars, or was it originally bigger and has since had stars stripped away due to tidal forces exerted on it by Andromeda? It’s difficult to answer this right now because the imaging the authors obtained doesn’t allow them to determine Peg VII’s orbital path and speed around Andromeda. But, they can look for indicators of tidal disruption, like spatial elongation of the stars’ distribution, or how “stretched out” the galaxy is.

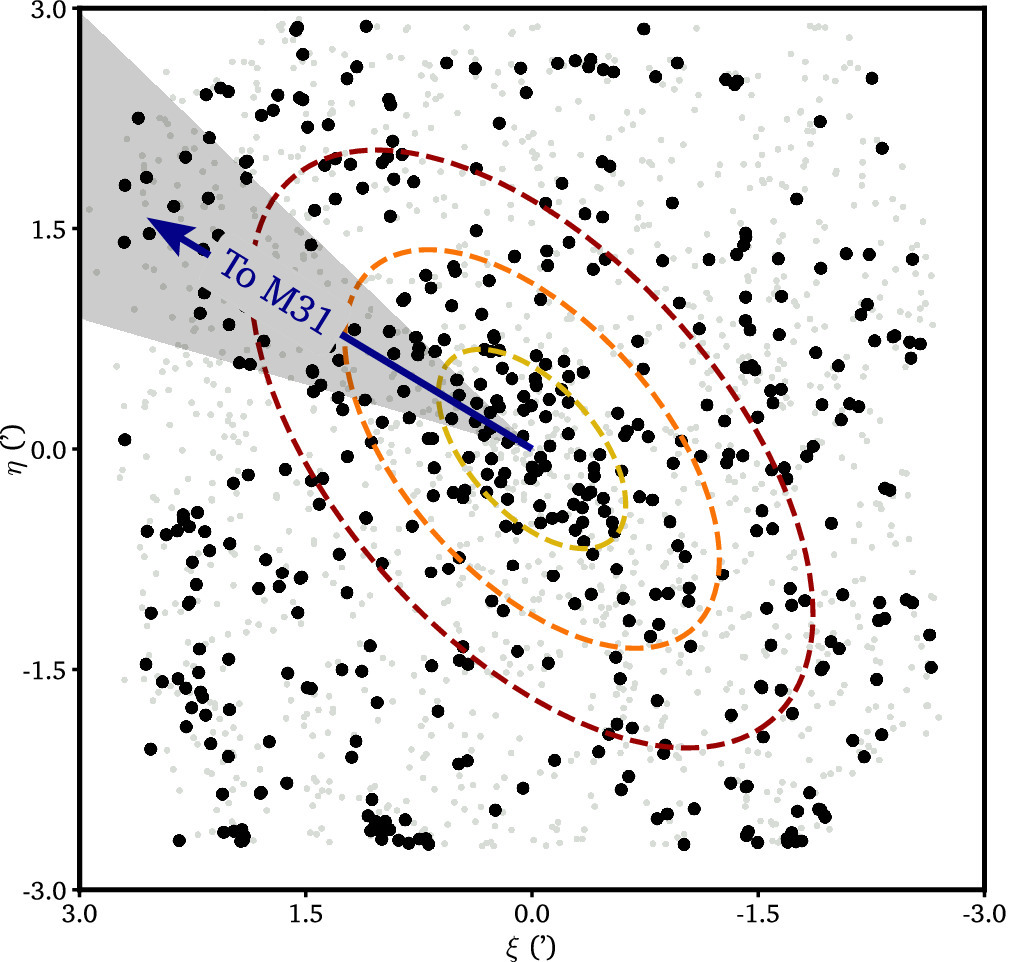
They found that Peg VII is quite elliptical (oval-like) and its major axis is roughly pointed at Andromeda (Figure 3). This could indicate that Peg VII has interacted with Andromeda in the past, and this could have affected its mass and size. However, there are lots of other possibilities for Peg VII’s shape that wouldn’t involve Andromeda at all. Peg VII could have naturally formed like this in isolation and has only just recently been brought into Andromeda’s orbit. It’s also possible Peg VII is the byproduct of a merger between two even smaller dwarf galaxies, which has been shown to result in elliptical distributions.

spatial distribution of Peg VII member stars

Figure 3: The spatial distribution of Peg VII member stars (dark black dots). The dashed lines show where 1, 2, and 3 half-light radii are, showing how elliptical Peg VII is. The blue arrow shows the direction Andromeda is in, which roughly lines up with Peg VII’s major axis. [Adapted from Smith et al. 2025]

To answer all of these questions, more follow-up observations are needed. By combining different wavelengths of light, it will be possible to determine Peg VII’s velocities, its star-formation history, and its hydrogen gas content and distribution. Even without an answer about Peg VII’s evolution, its discovery alone is noteworthy for the Andromeda system. Our theories of galaxy formation predict that Andromeda should have way more small satellite galaxies like Peg VII that we haven’t observed yet, as many as 60! This study of Peg VII highlights the need for large, deep surveys to extend this search for satellites to further distances from Andromeda and perhaps down to dimmer magnitudes.

In the meantime, keep your eye on the sky for more news about Peg VII and its other ultra-faint dwarf galaxy buddies. As big surveys designed for finding faint systems like these start to ramp up, like the Euclid space telescope and the Vera C. Rubin Observatory, we may be hearing more big things about these little galaxies.

Original astrobite edited by Caroline Von Raesfeld.

About the author, Veronika Dornan:

Veronika is a postdoctoral research associate at the University of Edinburgh. Her research is in observations of globular star clusters and how they can be used to study the evolution of their host galaxies.

The post Do You Have This Andromeda Galaxy in Extra-Extra-Extra Small? appeared first on AAS Nova.

Chiming In on the Pulsar Search: Searching for Pulsars with CHIME

12 September 2025 at 17:00

Pulsar diagram

Pulsars, the best timekeepers in the universe, are key to many fields within astronomy. A new survey searching for pulsars has come online and is already making discoveries.

Searching for Pulsars

Pulsars, the extremely dense cores left over from some massive stars’ deaths, act as astronomical lighthouses — spinning fast and emitting jets of light from their magnetic poles, they send steady pulses of light to observers on Earth. Pulsars are particularly intriguing sources, providing insights into multiple areas of astrophysics like gravitational waves, general relativity, and high-density matter properties. While more than 3,700 pulsars have been discovered to date, increasing this number will enable further exciting science. 

Multiple pulsar surveys have utilized single-dish radio telescopes to cover portions of the sky, and to date, these surveys have primarily focused on finding pulsars near the dense stellar population in the Milky Way’s galactic plane. While these surveys have detected many pulsars, they are limited by their small fields of view, taking longer to cover large portions of the sky, and they miss the population of pulsars that must lie within globular clusters orbiting in the galactic halo. Some low-frequency detectors address these limitations but require intense computational resources to sift through the raw data to find pulsars. How can we search for pulsars efficiently across the sky?

Introducing CHAMPSS

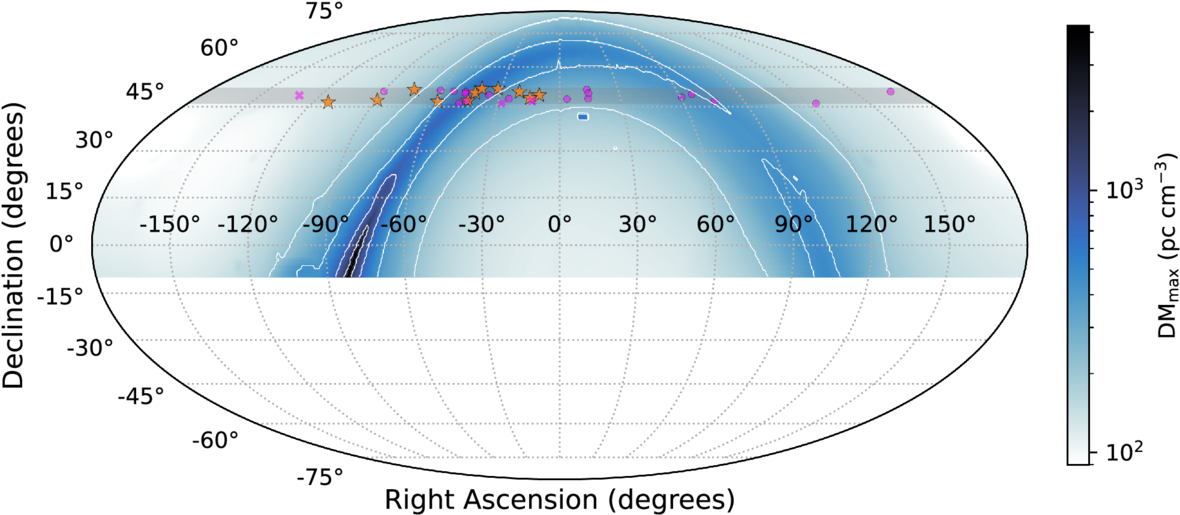
CHAMPSS pointing map

CHAMPSS pointing map showing the survey’s planned sky coverage. The orange stars correspond to the newly discovered pulsar, and the pink points denote known pulsars within the commissioning surveys. Click to enlarge. [Andrade et al 2025]

Hoping to cover the gaps in pulsar surveys thus far, researchers turned to the Canadian Hydrogen Intensity Mapping Experiment (CHIME). CHIME is a unique instrument that utilizes a set of cylindrical antennas to monitor large portions of the sky for radio sources from 400 to 800 MHz. This instrument has already made great strides in detecting transient radio events and has discovered more than 80 pulsars since its first light in 2017. 

With a clear opportunity to advance the pulsar search, a group of scientists developed the CHIME All-sky Multiday Pulsar Stacking Search (CHAMPSS) — a radio pulsar survey that covers the full northern sky daily and uses long-term data stacking to detect irregular and faint sources. Through stacking observations across multiple days, CHAMPSS builds up signals to find faint sources that would otherwise go undetected. The data processing pipeline searches in real time for strong peaks that signify a transient radio event, and follow-up analysis determines if the event is a pulsar candidate. A strong candidate then moves through further stages to confirm it as a pulsar and determine its properties. 

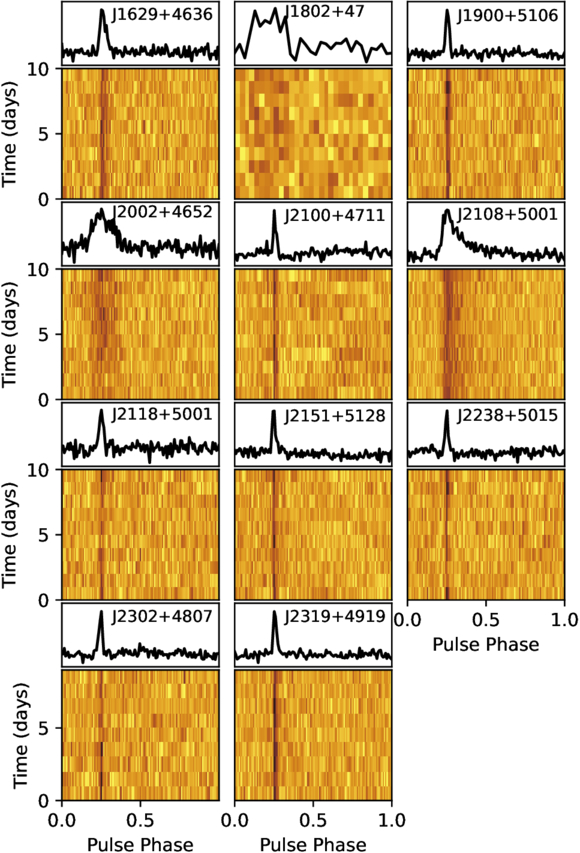
Pulsar discoveries

The 11 pulsars discovered with CHAMPSS. Click to enlarge. [Andrade et al 2025]

First Discoveries and Looking Forward

What has CHAMPSS uncovered thus far? In testing the system through multiple commissioning surveys on a small subset of the sky, the CHAMPSS collaboration has discovered 11 new pulsars with periods ranging from 0.2 to 1.5 seconds. Additionally, the collaboration tested the sensitivity of their survey by searching for known pulsars within the observed area, and they found that their predicted and detected signal-to-noise ratios for known pulsars agree well. This confirmation allows the team to advance to the next phase of the survey, and it will soon be in full swing.

CHAMPSS complements and expands upon other radio pulsar searches, discovering faint and irregular sources that are missed without repeated observations. The future of pulsar astronomy is promising, and with the advent of this survey, a new collection of pulsars will be discovered. 

Citation

“CHIME All-sky Multiday Pulsar Stacking Search (CHAMPSS): System Overview and First Discoveries,” Christopher Andrade et al 2025 ApJ 990 50. doi:10.3847/1538-4357/adeb51

The post Chiming In on the Pulsar Search: Searching for Pulsars with CHIME appeared first on AAS Nova.

Did That Supermassive Black Hole Rip Apart a Star, or Is It Eating Lunch Like Normal?

13 May 2025 at 17:00

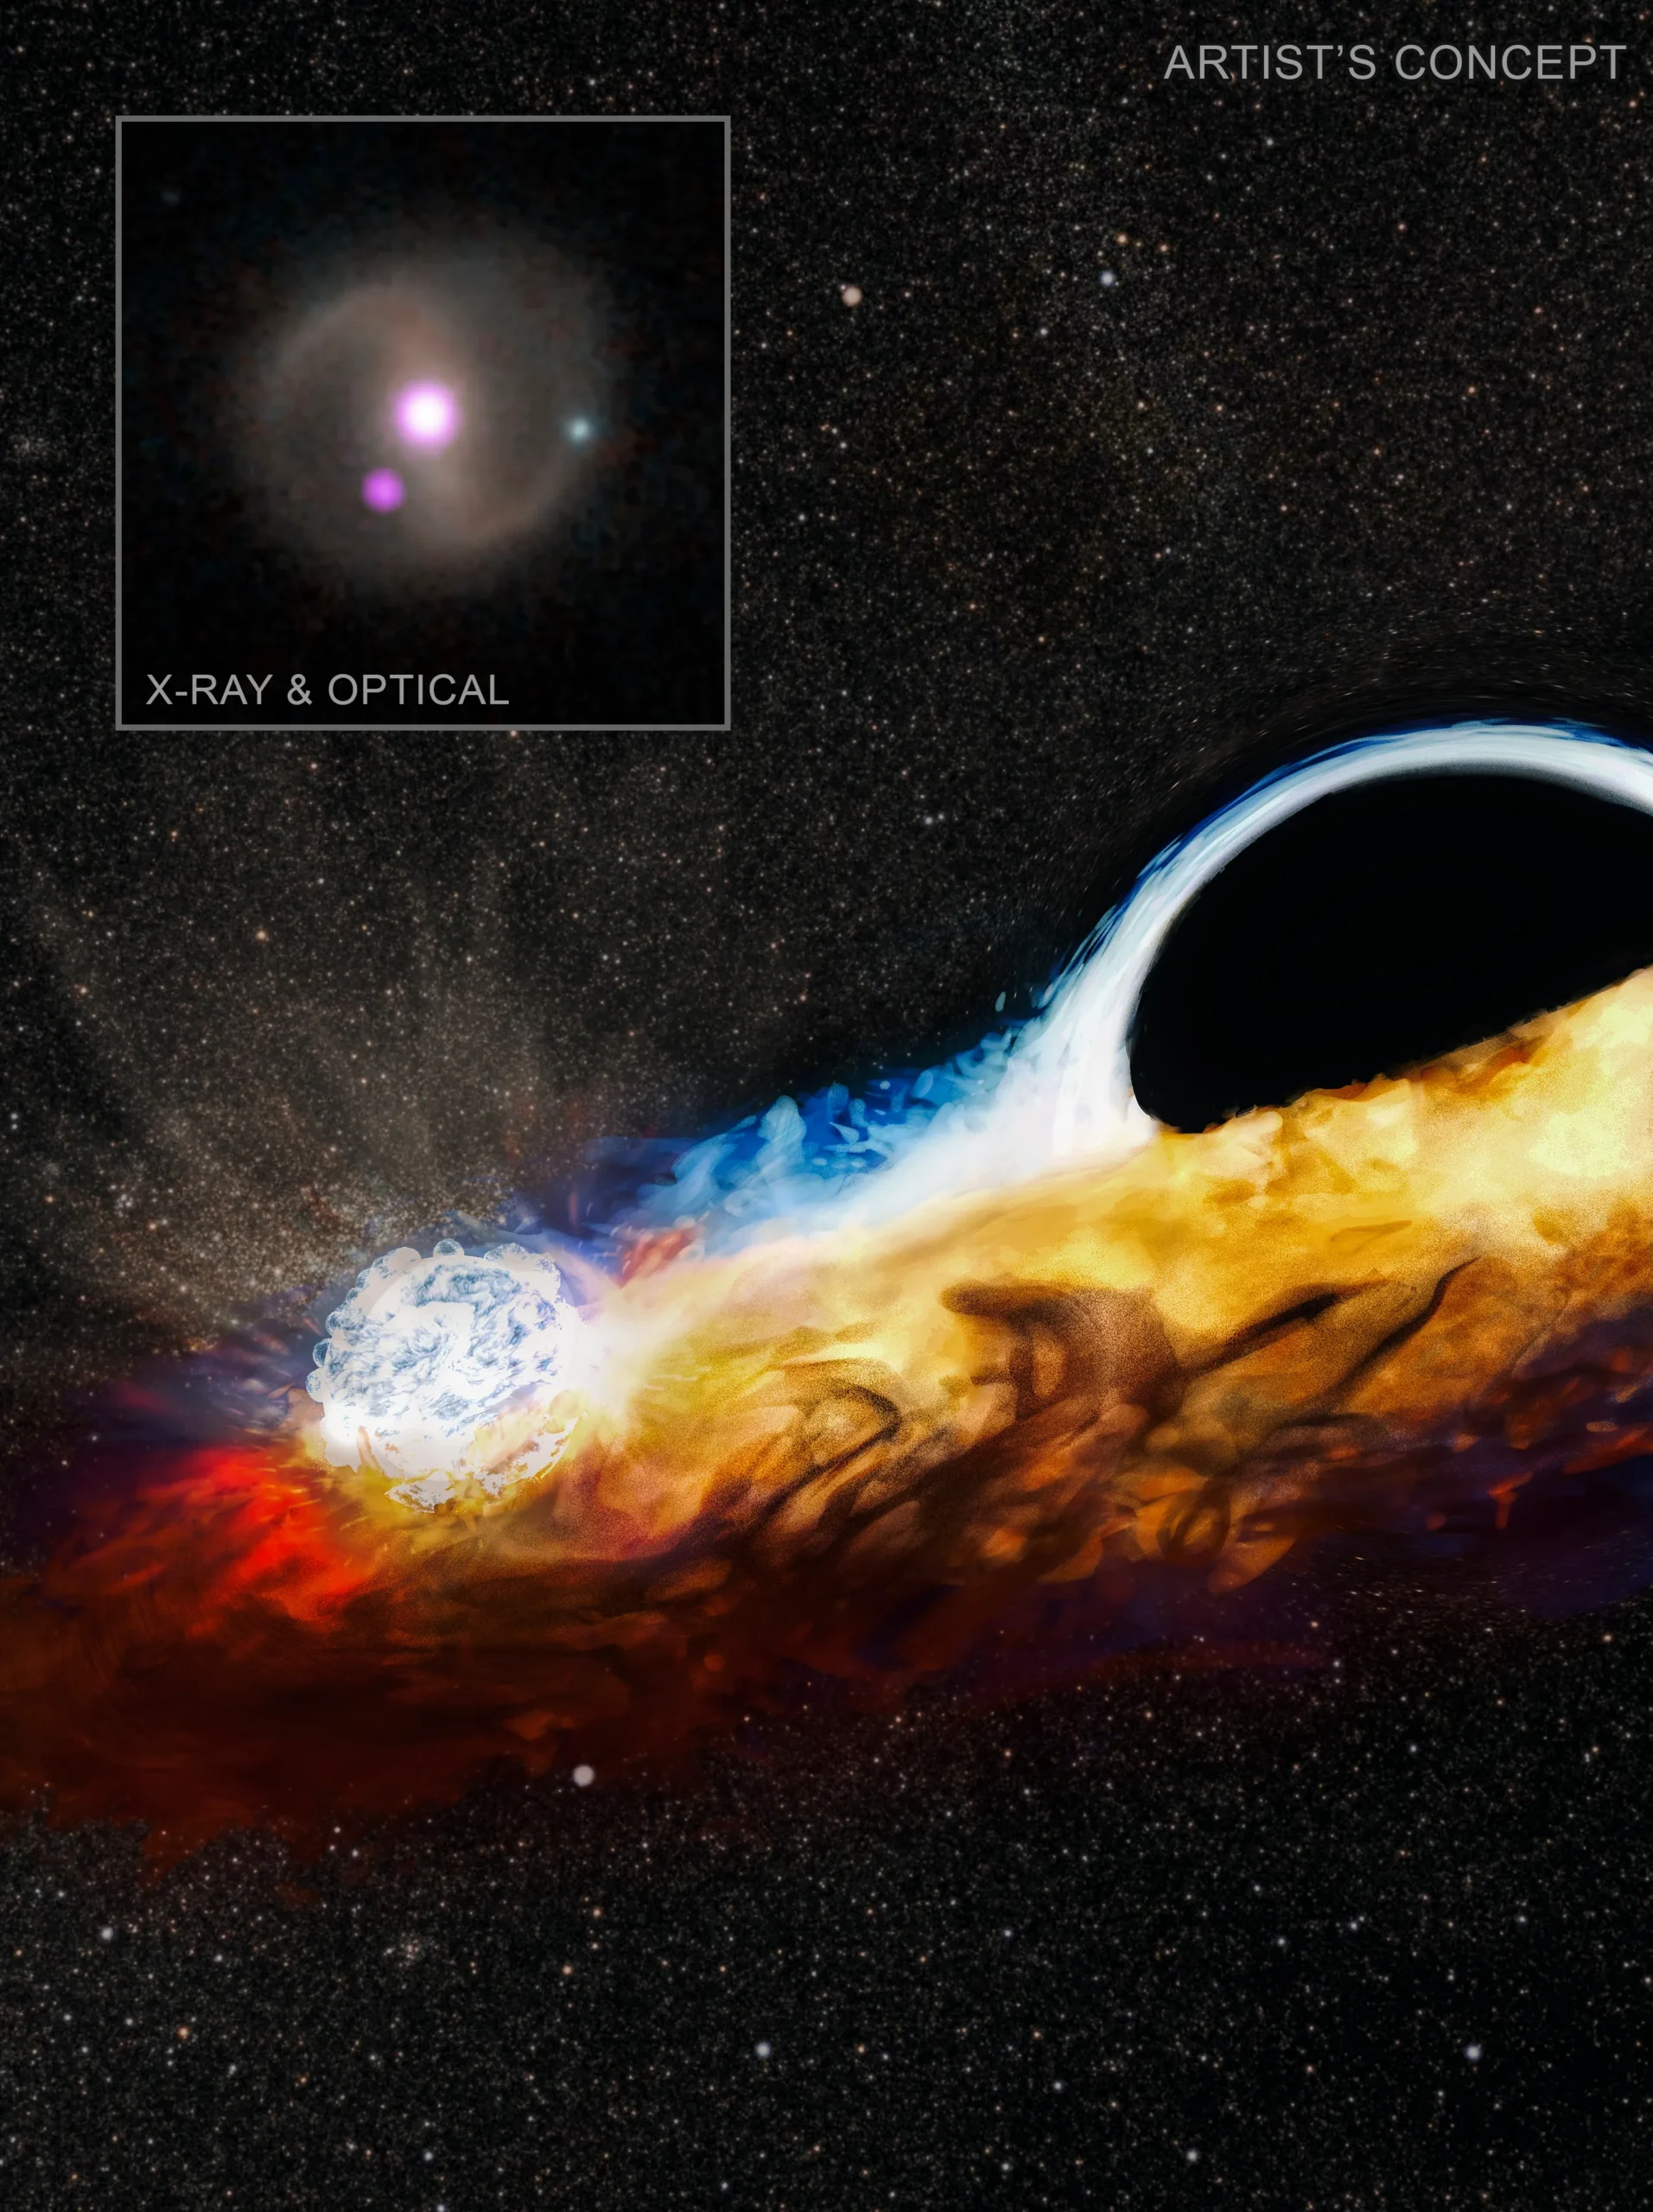
artist's impression of a tidal disruption event

Editor’s Note: Astrobites is a graduate-student-run organization that digests astrophysical literature for undergraduate students. As part of the partnership between the AAS and astrobites, we occasionally repost astrobites content here at AAS Nova. We hope you enjoy this post from astrobites; the original can be viewed at astrobites.org.

Title: An Untargeted Search for Radio-Emitting Tidal Disruption Events in the VAST Pilot Survey
Authors: Hannah Dykaar et al.
First Author’s Institution: University of Toronto
Status:
Published in ApJ

The supermassive black holes in the centers of most galaxies are notoriously, and predictably, violent actors in the universe. While some, classified as active galactic nuclei, act like a drain on their host galaxies, swallowing anything and everything that falls into them, even dormant black holes will react destructively when provoked. Orbit too closely, and any galactic nucleus will break you apart like a first-year chemistry student bumping an unsuspecting beaker off the lab bench.

If an ill-fated star falls into a black hole, the system will briefly glow across the electromagnetic spectrum. When and where these mishaps, known as tidal disruption events (TDEs, shown in Figure 1), occur, as well as the exact physical processes causing the brief glow, are not well understood. TDEs have been detected overwhelmingly in galaxies that do not have active galactic nuclei and are calming down after an era of intense star formation, and current models of the TDE occurrence rate disagree with observations. We expect to see more types of galaxies, such as those with active galactic nuclei, that host TDEs at similar rates, but we don’t — however, we might just be looking in the wrong places, or rather, with the wrong set of eyes.

Traditionally, TDEs have been identified by their optical, ultraviolet, or X-ray emission, but active galactic nuclei are surrounded by dust, which absorbs light at these wavelengths on its way to us. However, at radio wavelengths, the issue of dust obscuration fades, allowing us to uncover the TDEs that may be hiding. While radio emission has been observed from known TDEs, identifying TDEs in the radio comes with a major hurdle, presented by the pesky active galactic nuclei themselves; they are famously variable in radio emission, and they can serve as pretty convincing TDE imposters.

Searching for TDEs at Radio Wavelengths

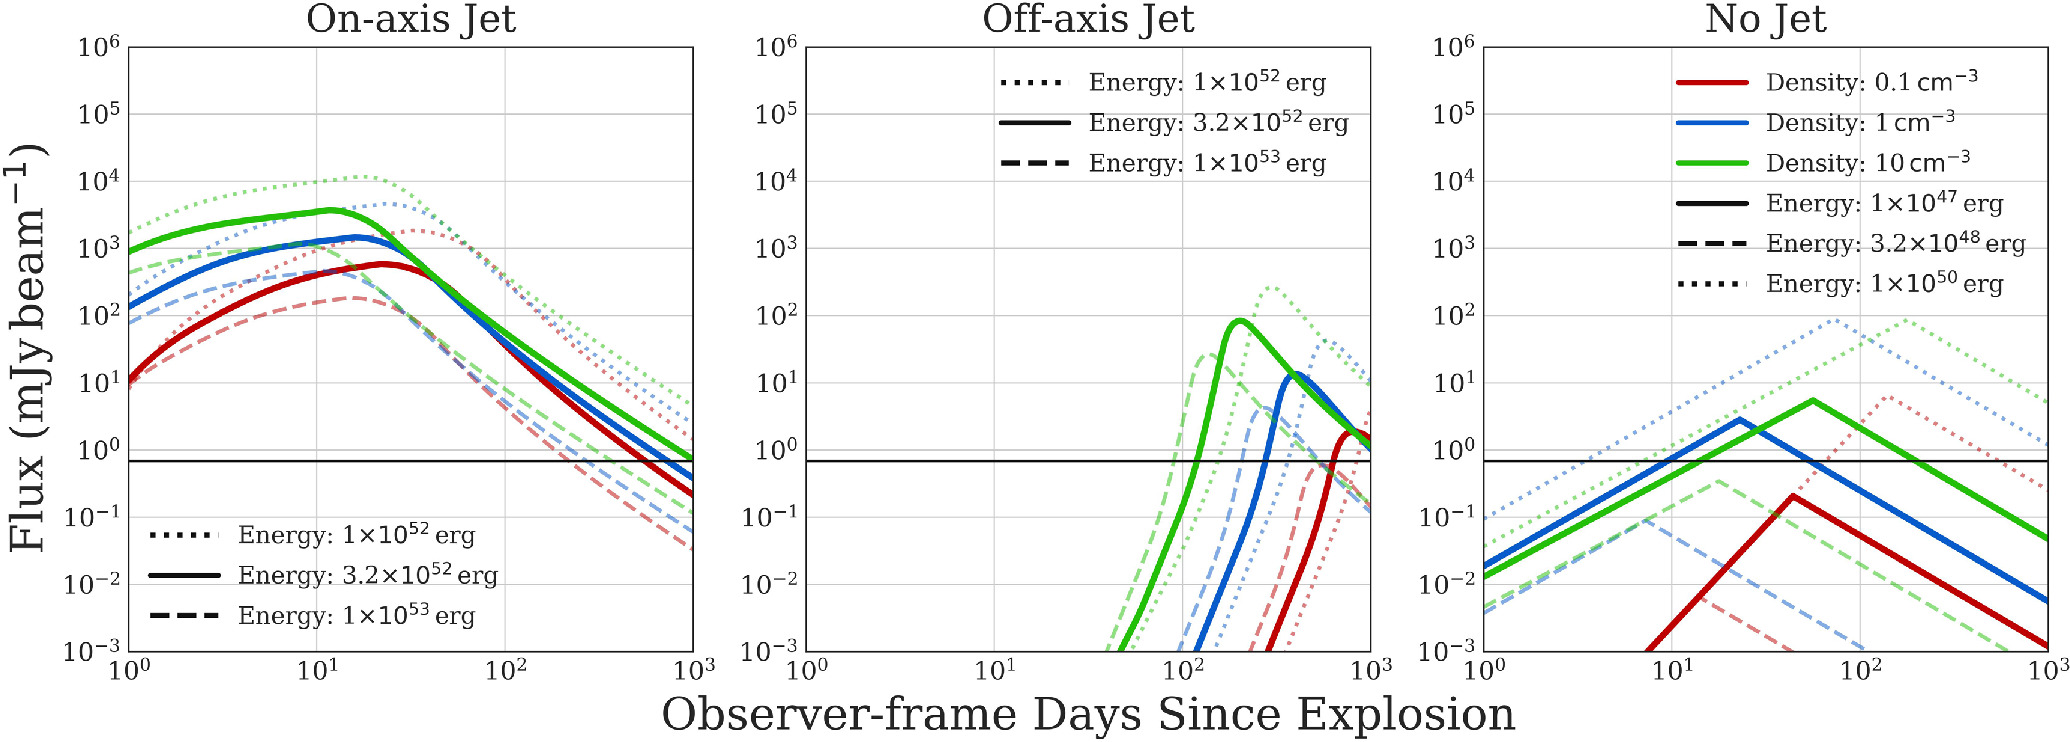
Today’s authors decide to take on this challenge, armed with data from the Variable and Slow Transients (VAST) pilot survey, which observes large swaths of the sky at regular intervals to track variability on the order of days to months. VAST is optimized for observing TDEs, but unfortunately, it is also excellent at finding active galactic nuclei. How do we know what to look for, and how can we distinguish a TDE from an active galactic nucleus? Easy, we can just identify characteristics common to all the known radio-emitting TDEs in the VAST field of view — all one of them, that is. Surely, that won’t do. Instead, our authors simulate the evolution of TDEs as seen by VAST, which can only catch discrete snapshots of light at a specific radio wavelength. Their models of TDE radio emission assume one of three cases: either the TDE produces a relativistic jet directed at us (on-axis), directed away from us (off-axis), or none at all. The presence or absence of a jet, and its direction, determine the shape of the light curve, as shown in Figure 2.

Light curves of simulated TDEs

Figure 2: This figure shows the change in radio brightness over time we expect to see from a galaxy during a TDE given different models. The shape of the radio flare depends strongly on whether the TDE results in a relativistic jet, and if so, whether the jet points toward us (on-axis) or not (off-axis). These simulated light curves were used to establish criteria for TDE candidacy, and compared with observations from the final sample to constrain the incidence rate of TDEs and likelihood of different jet geometries. [Dykaar et al. 2024]

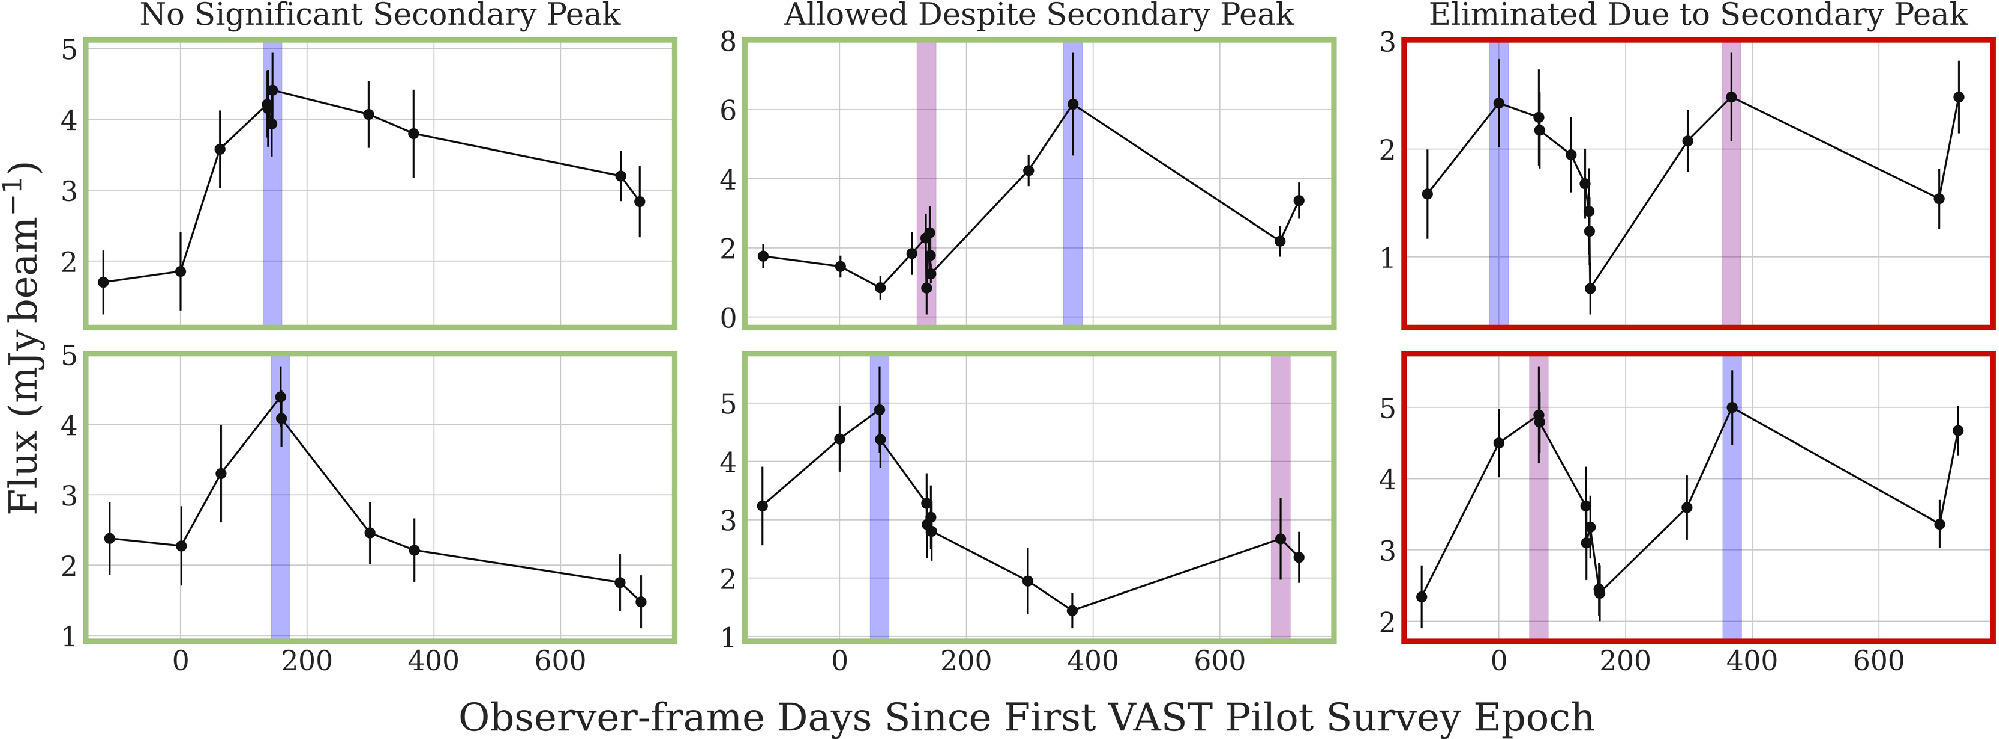
From these simulations, the authors identify three overarching characteristics that wannabe TDEs must exhibit: first, they must be variable, signaling the flare of activity as the star crashes into the black hole; second, the flare should be sufficiently bright compared to the galaxy’s normal brightness; and third, the flare must last for more than one observation, to ensure it is not a spurious detection. Additionally, the authors find that the peak brightness of the TDE must be double the typical galaxy brightness to effectively rule out active galactic nucleus imposters, which do not tend to vary this drastically, as shown in Figure 3. Lastly, the TDE must actually occur near the center of a galaxy (the black hole locale), as confirmed by optical or infrared survey catalogs. In the VAST pilot survey, 12 sources meet these criteria.
Three types of light curves, two of which are considered TDE candidates.

Figure 3: To distinguish TDEs from active galactic nucleus imposters, the authors kept only sources that exhibited one dominant peak in their radio flux, shown by the blue windows. Sources with secondary peaks (shown by the purple windows) that were much smaller than the primary peak were allowed, as the secondary peak could reasonably be due to ambient active galactic nucleus activity. However, multiple comparable peaks are indicative of only intrinsic active galactic nucleus fluctuations, not a TDE. [Dykaar et al. 2024]

Following Up on TDE Candidates at Other Wavelengths

The authors next subject these TDE candidates to thorough multi-wavelength scrutiny using archival survey data. First, they investigated whether the candidates are associated with gamma-ray bursts, which are extremely luminous and energetic events that may accompany TDEs. Unfortunately, gamma rays are easily absorbed, making them notoriously difficult to trace back to their sources. (After all, the journey of a gamma ray through light-years of dust and gas to Earth is not unlike Odysseus’s return to Ithaca, and we all know how many made that journey unscathed.)

The authors found that all 12 sources were coincident with a gamma-ray burst, but all 12 sources were also coincident with multiple gamma-ray bursts (which is unlikely to be physical), as were randomized, TDE-free regions of the VAST sky. In other words, the gamma-ray burst association is inconclusive. Contemporary optical and infrared observations of the candidates revealed no corresponding flares, which leads to more questions. Are the sources simply too far away for their optical and infrared flares to be discernible, or could dust absorption be at play? Additionally, nearly all candidates maintained an increased radio flux after the TDE flare. This may indicate that the TDE occurred within an active galactic nucleus as it was transitioning to a higher radio flux state, that the TDE was followed by intense star formation, or both.

By comparing their candidates to the expected observational manifestations of their TDE models, the authors conclude that the candidate sources are consistent with TDEs that have relativistic jets. They also independently constrain the TDE incidence rate, which agrees with current theory. As our window into the variable radio universe expands with future observations, such as with the ongoing VAST survey, we will have a growing population of such radio-detected TDEs to study, and the ability to distinguish them from regular active galactic nuclei will be ever more valuable in our quest to understand them.

About the author, Chloe Klare:

I’m a PhD student in Astronomy and Astrophysics at Penn State, with a physics doctoral minor. In my research, I’m looking for newly evolving synchrotron jets in active galactic nuclei (in the radio!).

The post Did That Supermassive Black Hole Rip Apart a Star, or Is It Eating Lunch Like Normal? appeared first on AAS Nova.

❌