❌

Normal view

Noble Gases Along for the Ride

24 July 2026 at 17:00

A rendering of an orange and grey planet against a dark background.

What can some neon trapped in a chunk of rock tell us about Earth’s formation and the protosolar nebula? Quite a lot, as detailed in a recent study in The Planetary Science Journal.

Noble Mysteries

By analyzing rocks pulled from mid-ocean ridges, geologists have concluded that there are tiny amounts of noble gases in the deep interior of Earth. That’s a strange statement upon reflection: how did these gases, which are famously apathetic to essentially all other elements, end up embedded within rocks thousands of kilometers underground? Since their passivity rules out the potential of a chemical reaction that formed them in place, they must have been in the mantle since the very beginning of Earth’s history.

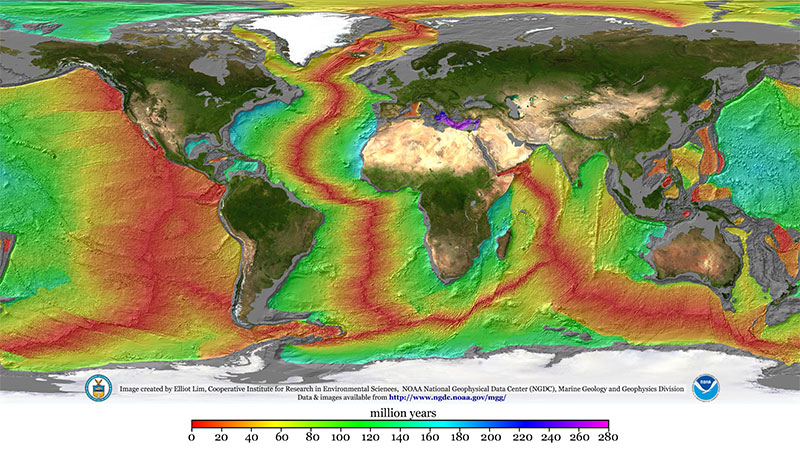
A map of Earth with the continents shown normally but the sea colored according to age.

A map illustrating the age of the seafloor. Mid-ocean ridges stand out clearly in red. By sampling material from these ridges, planetary scientists can infer the composition of Earth’s deep interior. Click to enlarge. [Mr. Elliot Lim, CIRES and NOAA/NCEI]

There are a few scenarios for how this could have happened. Though it’s possible that these inert species were delivered to the early Earth encapsulated within primitive meteorites or in solids contaminated by ions from the solar wind, at least some fraction of these elements likely came directly from the gaseous nebula that surrounded the earliest protoplanets.

That last option is especially exciting to present-day planetary scientists interested in constraining Earth’s formation history because it requires some very specific conditions. Since light noble gases like neon don’t dissolve well in seawater, they must have dissolved into a magma ocean — meaning the nebula was still around when Earth was large enough to have a molten surface. That already restricts us to a very specific time in the solar system’s history, but it doesn’t say much about the specific size of the proto-Earth other than “big,” and it doesn’t say much about the state of the nebula other than “it existed.” Recently, Vincent Savignac and Eve Lee (University of California, San Diego; McGill University) successfully refined these constraints to pin down information about both the early Earth and the nebula that surrounded it.

Infant Earths

Savignac and Lee began by growing a grid of infant Earths on their computers via models of gas accretion and atmosphere–magma interactions. Each simulation started with a different proto-Earth mass and nebular density, and each one yielded a different amount of neon in Earth’s deep interior. Excitingly, only a small handful of the scenarios tested ended up with values similar to those observed.

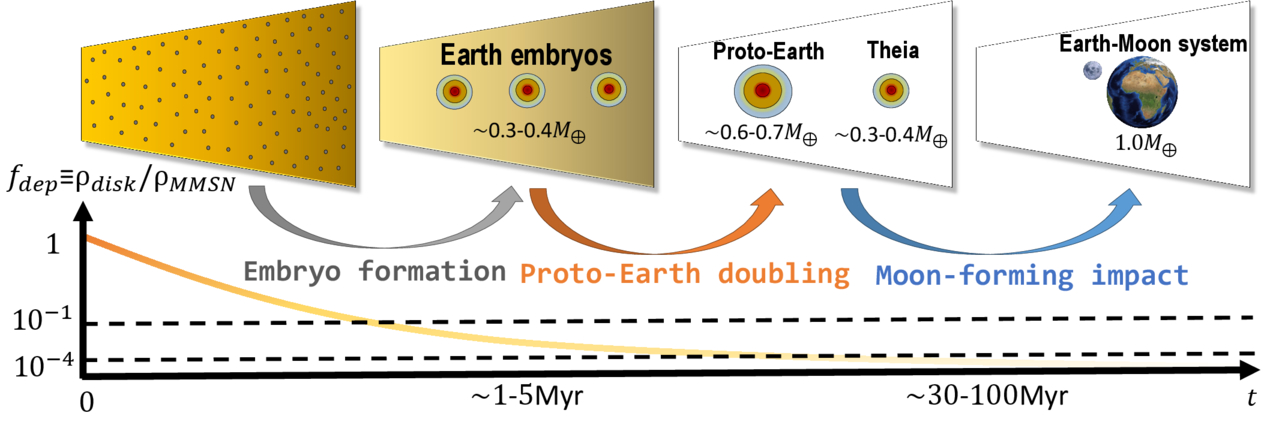
A cartoon of small cores surrounded by gaseous envelopes eventually merging into the Earth.

A schematic of Earth’s formation via embryo formation (when the noble gases enter the mantle) followed by mergers. Click to enlarge. [Savignac & Lee 2026]

On the mass axis, the team found a narrow range of acceptable conditions. If a proto-Earth was less than about 20% of Earth’s present-day mass, it couldn’t accrete much gas. This let it cool rapidly, freezing the magma ocean and shutting down neon dissolution before too much could be trapped inside. On the other hand, if a proto-Earth was more than about 40% of Earth’s present-day mass, it would accrete too much gas, stay molten for too long, and be left with too much neon. On the density axis, the researchers found that when the nebula accreted on to the proto-Earth, it must have been fairly depleted compared to its initial density. This implies that the whole process happened at the end of the nebula’s life, just before it was completely blown away by the proto-Sun.

Savignac and Lee demonstrated that these constraints are robust against the later stages of Earth’s evolution. In its later years, Earth either suffered or benefited from a giant impact, depending on your feelings about the Moon, but the researchers showed that this event doesn’t pose a problem for their models. Overall, this study builds a delightful link between rocks from our deep oceans and the particulars of Earth’s formation, demonstrating the unique power of planetary science to tie together different scientific fields.

Citation

“Constructing the Earth’s Formation History Using Deep Mantle Noble Gas Reservoirs,” Vincent Savignac and Eve J. Lee 2026 Planet Sci. J. 7 135. doi:10.3847/PSJ/ae64f7

The post Noble Gases Along for the Ride appeared first on AAS Nova.

Rare “Super-Jupiter” Discovered on an Extraordinary 180-Day Orbit

24 July 2026 at 12:54
NGTS 38 bScientists discovered a rare planet larger than Jupiter orbiting a distant star once every 180 days. A planet nearly five times as massive as Jupiter circles a distant star once every 180 days. Known as NGTS-38 b, it is an exoplanet, meaning a world that orbits a star outside our solar system. NGTS-38 b is [...]

385-Million-Year-Old Amber Found in China

17 July 2026 at 20:19
The Middle Devonian Hujiersite amber. Image credit: Lu et al., doi: 10.1126/sciadv.aeh1266.

Paleontologists in China have discovered what they say is the earliest confirmed pieces of amber ever found, a fossilized resin roughly 385 million years old (Middle Devonian epoch) that predates the previous record-holder by about 65 million years.

The post 385-Million-Year-Old Amber Found in China appeared first on Sci.News: Breaking Science News.

Cretaceous Bangong–Nujiang closure sustained Tibetan mountain growth through shortening

16 July 2026 at 13:25

A new study published in Communications Earth & Environment reports that central Tibet’s rugged mountain architecture was not built in a single burst. Instead, it was shaped by long-lived crustal shortening that persisted after a major ocean closed during the Cretaceous period—when the Bangong–Nujiang Ocean shut down and the surrounding plates collided.

The research team, led by Zhang, Liu, Lin, and colleagues, examines how tectonic forces transferred through the region during and after ocean closure. Their central finding is that shortening did not simply end when the ocean vanished. Rather, the continental collision continued to drive deformation well beyond the immediate collision event, helping sustain mountain growth over extended geological time.

To reach this conclusion, the authors combine regional tectonic constraints with structural observations that reflect how stress and strain were distributed through the Tibetan crust. They interpret the evolving patterns of deformation as evidence for sustained compression, including the way different crustal levels responded to continued convergence.

The study frames the Bangong–Nujiang Ocean closure as a pivotal tectonic switch: once the ocean disappeared, the mechanical coupling between continental blocks increased. That change allowed compression to remain effective, promoting ongoing uplift and crustal thickening in central Tibet.

Importantly, the paper links this sustained shortening to the broader development of Tibetan topography. Rather than treating uplift as a short-lived response to a single collisional moment, the results support a scenario in which post-closure tectonics kept feeding the mountain belt for millions of years.

By addressing the timing and persistence of shortening, the work helps refine how geologists explain the thick crust beneath Tibet and the coexistence of active deformation with long-term structural inheritance. The authors suggest that the region’s growth reflects both the closure of an ocean basin and the prolonged geodynamic consequences of that closure.

The findings also carry implications for how future modeling efforts should represent continental collisions. They highlight that plate-tectonic reorganizations can create enduring mechanical conditions, sustaining deformation even after the most dramatic phase of convergence has passed.

With the DOI link and citation tied to the 2026 publication, the study—understood through its title and approach—offers a clear, data-driven narrative: central Tibet’s rise reflects sustained shortening following Cretaceous ocean closure, shaping a mountain system that kept growing long after the ocean was gone.

Subject of Research: Tectonics and mountain growth in central Tibet following the Cretaceous closure of the Bangong–Nujiang Ocean

Article Title: Sustained shortening following Cretaceous Bangong–Nujiang Ocean closure shaped central Tibetan mountain growth.

Article References: Zhang, B., Liu, S., Lin, C. et al. Communications Earth & Environment (2026). https://doi.org/10.1038/s43247-026-03830-3

Image Credits: AI Generated

Judge: Trump can’t deport researchers just for working in content moderation

15 July 2026 at 22:26

This week, the Coalition for Independent Technology Research (CITR) won a key battle in its fight to reverse a visa-restriction policy that the Trump administration had used to attempt to revoke green cards and deport non-US citizens who work on misinformation, disinformation, fact-checking, content moderation, compliance, and trust and safety.

In an opinion published Tuesday, US District Judge James Boasberg granted a preliminary injunction blocking the State Department from enforcing the policy until the CITR’s lawsuit is resolved.

On its face, the policy does not require visa denials or deportations. Instead, it authorizes immigration investigations into individuals suspected of helping foreign adversaries attempt to manipulate public opinion by suppressing US speech.

Read full article

Comments

© UCG / Contributor | Universal Images Group

A cloud deal too good to be true

14 July 2026 at 10:00

The model of the forward deployed engineer is sweeping through enterprise IT like a gold rush, and I’m concerned that many companies don’t understand what they’re signing up for.

Let’s start with the headline numbers. AWS announced a $1 billion investment in a new Forward Deployed Engineering organization. Google Cloud committed $750 million to expand similar programs. Microsoft has been running Azure-focused embedded engineering teams for years, including partnerships with Accenture to scale forward deployed engineering practices. All three are pitching the same story: We’ll send engineers to work directly with your teams, help you deploy AI, and accelerate your digital transformation. You get top-tier technical talent for free, and we get to partner with you on your journey.

It sounds reasonable on the surface. It sounds collaborative, even generous. But I’ve been in this industry long enough to know that when a multi-billion-dollar company offers you something for free, they’re sure to get much more than they give.

What you actually get

The forward deployed engineer model isn’t new. The consulting industry has been doing some version of it for decades. What makes this different is the scale and the direct financial incentive behind it.

These engineers work for the cloud provider. They’re not your employees. They’re not independent consultants. They’re technically excellent professionals who are being paid to solve your immediate problems while simultaneously building relationships and architectures that favor their employer’s ecosystem. Think about it from their perspective. Those forward engineers are evaluated on whether customers succeed with their employer’s platform. They’re rewarded when enterprises adopt more services from that platform. Their career advancement depends on making AWS, Google Cloud, or Microsoft Azure the obvious choice for all of your technical decisions.

This isn’t a criticism of the individual engineers. Many of them are genuinely talented and genuinely want to help. But they’re operating within a system that rewards specific outcomes, and those outcomes align with the vendor’s financial interests, not necessarily yours.

The problem no one talks about

Here’s what I see happening at enterprises right now. A company decides they need help deploying AI. A cloud provider offers to embed engineers at no additional cost. Those engineers work alongside internal teams, make architectural recommendations, and help build out systems. Six months later, the company has a production AI system running on a single cloud platform, built by people with deep expertise in that specific platform.

The problem? Nobody evaluated whether that platform was actually the best choice for the business. Nobody looked at alternatives. Nobody asked whether a multicloud architecture or best-of-breed approach might deliver better results at lower cost.

The engineers embedded in these programs are not going to recommend that you split your workloads across providers. They’re not going to suggest you use open source tools where they make sense. They’re not going to point you toward a competitor when their employer’s solution will work well enough. That’s not how these programs are designed to function. What you’re getting is optimized architecture for a single cloud brand, not optimized architecture for your business.

The financial reality will hit

The bills are going to come due, and they’re going to be painful. I’ve watched this pattern play out before. When enterprises lock into a single cloud provider through these embedded engineering programs, they often discover two or three years later that they’re paying premiums that their more independent-thinking competitors avoided.

The reasons are straightforward. When you’re architecting systems around a single platform, you naturally fall into usage patterns that favor that platform’s pricing structures. You use their managed databases instead of portable alternatives. You adopt their AI services instead of evaluating third-party options. You build workflows that only work within their ecosystem. And when it comes time to renegotiate or benchmark against alternatives, you find that migrating would cost more than accepting whatever pricing they offer.

I’ve spent the past decade helping companies untangle from these situations. I’ve seen organizations with cloud bills 15 to 20 times higher than they should be, unable to migrate because their entire AI infrastructure is built on proprietary services that only work on one platform. The forward deployed engineer programs are accelerating this problem. They’re making it easier to get into these situations and harder to get out.

Think before you commit

Before you accept one of these programs, consider these three recommendations.

First, require independent architecture oversight from day one. Hire or engage architects who work for your company, not for your cloud provider. They should evaluate every recommendation made by embedded engineers against business requirements and compare options across providers. This isn’t about being suspicious of the engineers. It’s about ensuring that decisions are made with your interests in mind.

Second, demand a clear exit strategy before you begin. Ask the cloud provider to document which proprietary services you’re using, what migration paths exist, and what the cost would be to move to an alternative platform. If they can’t provide that information, or if the migration costs seem impossibly high, that’s a sign that you’re building technical debt that will be very expensive to service later.

Third, benchmark your costs continuously. Set up internal processes to compare your cloud spending against industry benchmarks and against what your competitors might be paying for similar workloads. Don’t wait until your contract renewal to discover that you’re paying premium prices. Monitor expenses from the beginning, and be willing to challenge your cloud provider if you’re not getting value that justifies the cost.

The bottom line

The forward deployed engineers are solving real problems. Enterprises genuinely struggle with AI deployment, and having experienced engineers available to help is valuable. I’m not suggesting these programs are fundamentally bad. However, they’re being marketed as neutral partnerships when they’re actually strategic sales programs designed to lock enterprises into specific platforms. The helpful engineers showing up at your office are building dependencies that will be very difficult to break. The “free” technical assistance is being funded by margins on services you’ll be buying for years.

Go in with your eyes open. Use these programs but add your own independent oversight. Build architectures that you could leave if you needed to. And don’t let the immediate satisfaction of having problems solved today blind you to the financial consequences that will arrive tomorrow.

Astronomers Probe Chemistry of Giant Exoplanet Beta Pictoris b

9 July 2026 at 16:02
This artist’s impression shows how the gas giant exoplanet inside the disc of Beta Pictoris may look. Image credit: L. Calçada / ESO.

Using the upgraded GRAVITY+ instrument on ESO’s Very Large Telescope Interferometer (VLTI), astronomers have measured the ratio of carbon isotopes in the atmosphere of the young exoplanet Beta Pictoris, offering new insights into how giant planets form.

The post Astronomers Probe Chemistry of Giant Exoplanet Beta Pictoris b appeared first on Sci.News: Breaking Science News.

Gaia Data Show That the Initial Mass Function Is Not Universal

8 July 2026 at 22:48

star-forming cloud OMC-2

Do all star-forming regions birth stars with the same distribution of masses? Theory suggests that they do not, but researchers often assume they do for simplicity. Now, ultra-precise observations from Gaia have demonstrated that the initial mass function varies across star clusters in the Milky Way.

A Universal Initial Mass Function?

JWST image of galaxies in the iconic Hubble Ultra Deep Field

The light from distant galaxies is dominated by high-mass stars, requiring the use of the IMF to estimate the stellar mass of a galaxy. [ESA/Webb, NASA & CSA, G. Östlin, P. G. Perez-Gonzalez, J. Melinder, the JADES Collaboration, the MIDIS collaboration, M. Zamani (ESA/Webb); CC BY 4.0]

When a molecular cloud fragments, collapses, and births a star cluster, how many stars form, and what are their masses? The answer to that question is what astronomers term the initial mass function, or IMF: the distribution of masses of stars born in a cluster.

The IMF is important in many areas of astronomy, and it’s relied on especially heavily in studies of distant galaxies. The light from these galaxies is dominated by high-mass stars, with the emission from lower-mass stars lost in the glare, so astronomers must use the IMF to reconstruct the stellar populations of these far-off locales.

Though theory suggests that the IMF should vary with factors like temperature and metallicity, demonstrating these variations has been difficult, even within our own galaxy. Because of this, researchers often adopt a universal IMF drawn from observations of star clusters in the Milky Way. But is the IMF truly universal?

The More the Slope Changes, the More the Break Mass Stays the Same

Determining whether the IMF is universal is more complicated than simply comparing the stars in one cluster to those in another. That’s because what astronomers measure in present-day star clusters is not the initial mass function, but a version of the IMF that has been skewed by millions to billions of years of evolution; over time, high-mass stars die and low-mass stars get ejected, warping the shape of the mass function.

Plots of the stellar mass function

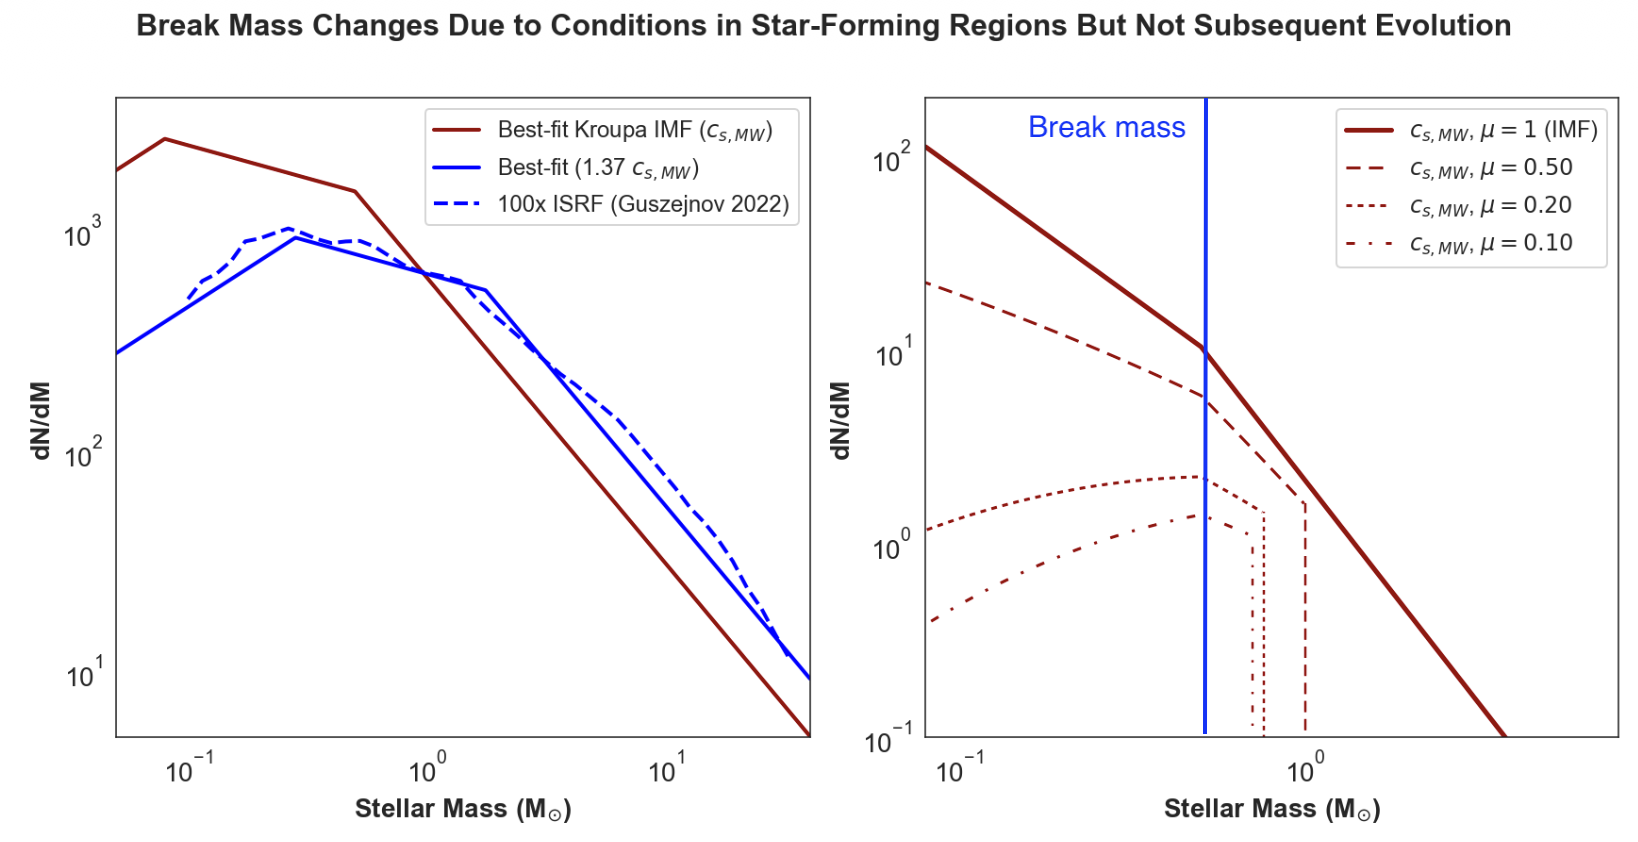
Left: Different break masses arise for different properties (here, the sound speed) of a given star-forming cloud. Right: Evolution of the mass function over time for a single star cluster. Over time, high-mass stars die and low-mass stars are ejected from the cluster, resulting in a decrease in the remaining mass fraction, μ, from 1 to 0.1. The slopes change, but the break mass does not. Click to enlarge. [Adapted from Steinhardt et al. 2026]

However, as demonstrated in a recent research article led by Charles L. Steinhardt (University of Missouri), certain aspects of the IMF may remain unchanged as clusters evolve. When the mass function of a star cluster is described using a broken power law (commonly called a “Kroupa-like” IMF in reference to work by Pavel Kroupa), the slopes of the power-law segments are affected by stellar evolution and dynamical interactions. Crucially, these effects appear not to alter the break mass — the mass at which the IMF transitions from one slope to another. Therefore, differences in the break mass from cluster to cluster reflect differences in the underlying IMF rather than the stellar and dynamical evolution of the clusters.

Insights from Gaia

Thanks to the Gaia spacecraft, which made precise observations of more than 2 billion stars in the Milky Way and beyond, it’s now possible to measure and compare the break masses of individual star clusters. Out of an initial catalog of 7,167 Milky Way clusters observed with Gaia, Steinhardt’s team selected just 110 that were of high enough quality and contained a sufficient number of stars to measure cluster break masses accurately.

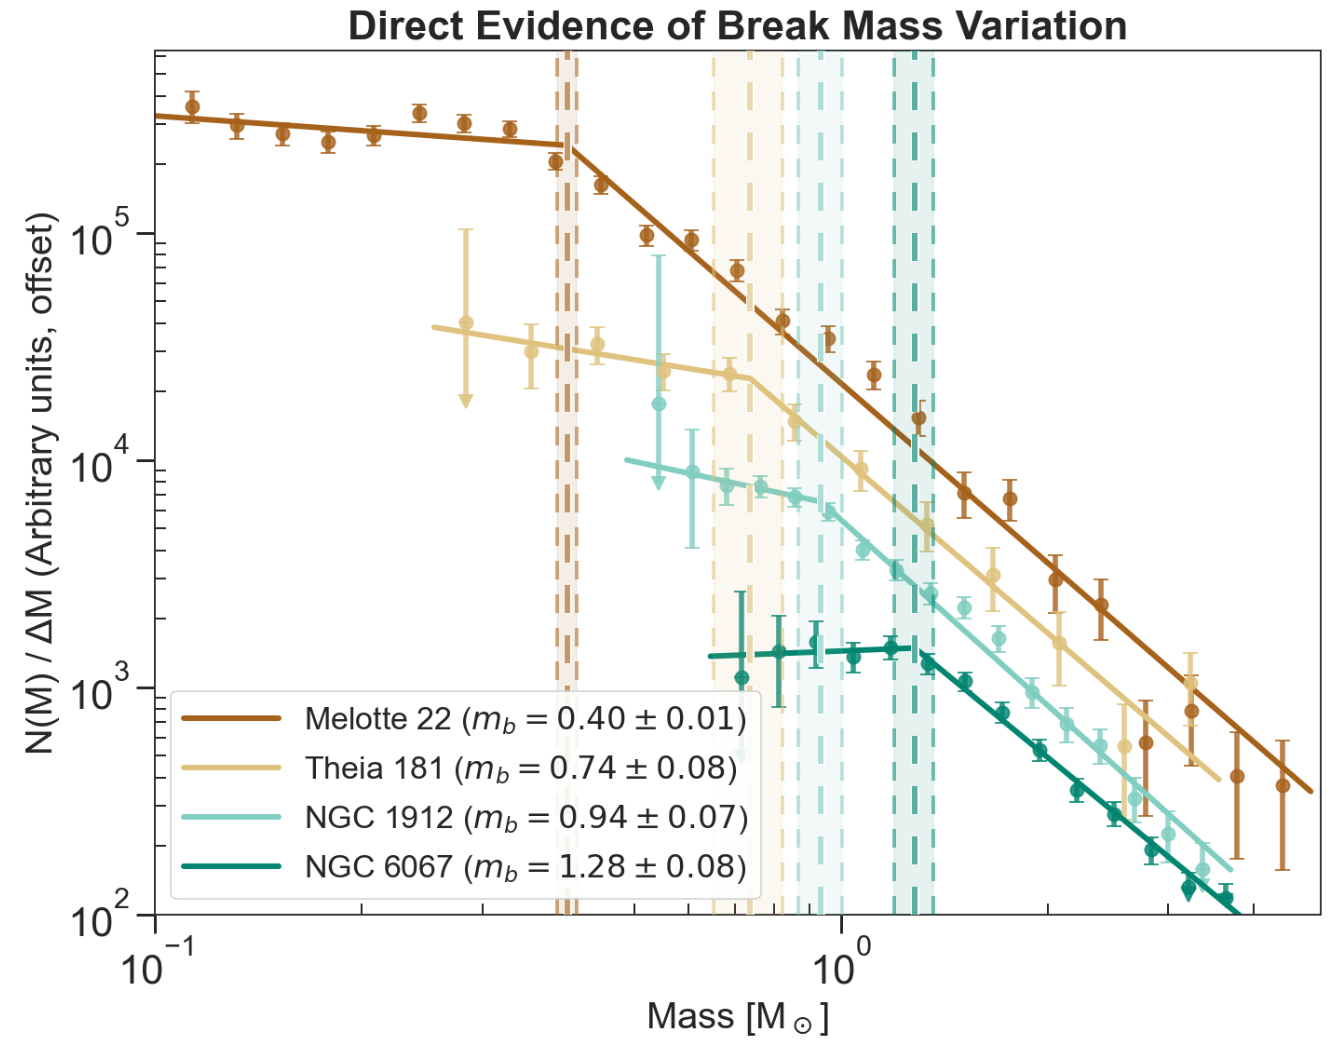
Plot of stellar mass function for four Milky Way clusters

Observed mass functions of four Milky Way star clusters. The break masses are clearly different, showing that the IMF must vary from cluster to cluster. Click to enlarge. [Steinhardt et al. 2026]

The team found that the break mass differs considerably between the clusters in their sample, showing that the IMF is not universal. The observed variety of break masses appears to be linked to the age of the cluster, but instead of reflecting the impact of stellar and dynamical evolution — which have no effect on the break mass — these differences reflect the properties of the clouds in which the clusters were born. This implies that the properties of star-forming clouds in the Milky Way have, on average, changed over cosmic time. Thus, a star cluster that formed billions of years ago would have had a different IMF than one forming today.

This finding has implications for studies of high-redshift galaxies, where the properties of star-forming clouds are markedly different from those in the Milky Way. Going forward, Steinhardt and coauthors recommend developing a flexible parameterization of the IMF to capture how this critical function behaves in environments vastly different from our own.

Citation

“Direct Evidence for Stellar Initial Mass Function Variation in the Milky Way,” Charles L. Steinhardt et al 2026 ApJL 1005 L40. doi:10.3847/2041-8213/ae7444

The post Gaia Data Show That the Initial Mass Function Is Not Universal appeared first on AAS Nova.

Two More Thoughts on Little Red Dots

1 July 2026 at 03:54

little red dots seen with JWST

One of the biggest discoveries from JWST’s tenure is a population of compact reddish objects nicknamed “little red dots.” Numerous theories have been proposed to explain the small sizes, high luminosities, and characteristic “V”-shaped spectra of these objects, and today we’ll examine two recent research articles that have explored the identity of the universe’s most mysterious inhabitants.

Red Dot, Blue Dot

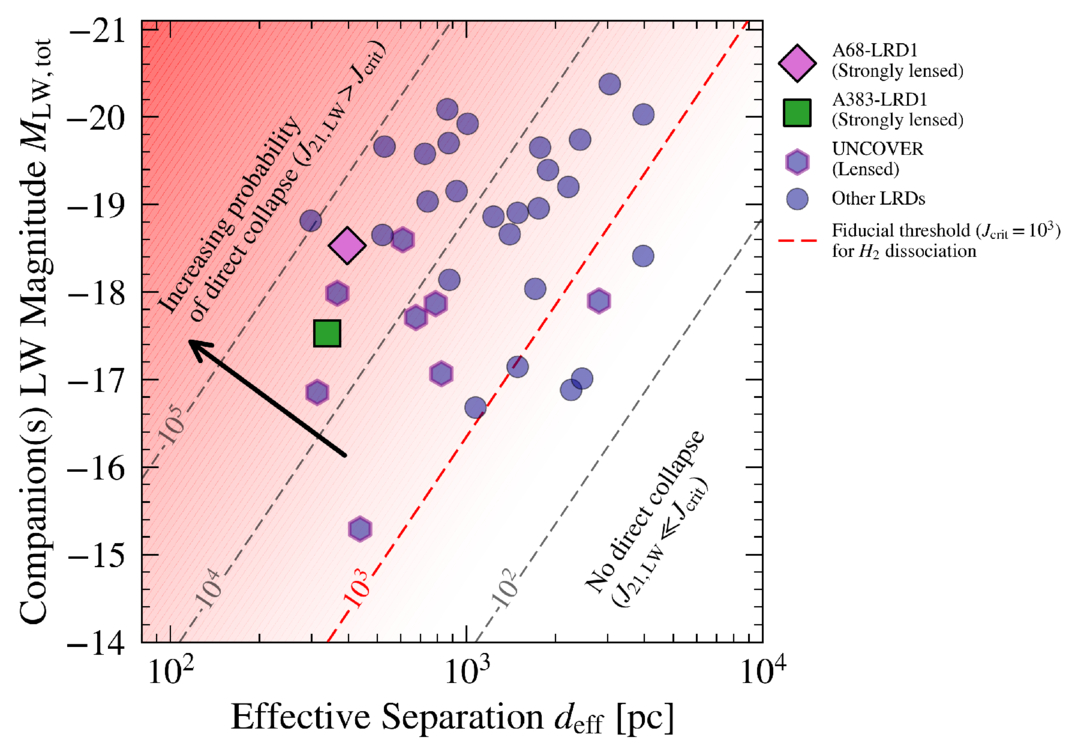
You can tell a lot about a person by looking at their friends — and the same might be true for little red dots. A team led by Josephine Baggen (Yale University) examined a sample of 83 little red dots imaged with JWST. They found that 43% of the little red dots in this sample had a little blue companion: an ultraviolet-bright object within a projected separation of 1,630–16,300 light-years. The brightest little red dots were even more likely to have a blue companion; 80% of the brightest objects in the sample were paired up.

Baggen’s team set out to test the hypothesis that these red–blue pairs are fundamentally linked rather than coincidental. Under this hypothesis, the ultraviolet-bright blue companions were assembled first. The ultraviolet radiation from these objects suppressed the cooling of molecular hydrogen in pristine gas clouds in the early universe, causing the gas to skip the usual star-forming process and instead form a massive compact object such as a black hole star, supermassive star, or quasi-star — which we see as a little red dot.

plot of Lyman-Werner radiation versus projected separation

The companion’s mean flux density from 91.2 to 111 nm versus projected separation between the blue companion and the little red dot. The red dashed line shows the estimated values necessary for gas clouds to collapse. Click to enlarge. [Baggen et al. 2026]

Baggen and coauthors investigated whether the ultraviolet radiation from the blue companions is strong enough to have triggered this transformation. The team used spectral energy distribution modeling to determine the luminosities of the blue companions from 91.2 to 111 nanometers. This analysis showed that the radiation from the blue companions is equal to or greater than the threshold necessary to encourage the direct collapse of a gas cloud into a massive compact object.

If little red dots form thanks to their little blue companions, that would imply that every little red dot has or had such a companion. Though little blue companions weren’t so universal in the sample used in this work, the team noted that their analysis techniques, combined with observational limitations and other factors, likely yielded a smaller number of blue companions than are actually present. Further simulations exploring the collapse of pristine gas clouds into massive compact objects and high-resolution spectroscopic observations of little red dots can illuminate the potential link between these objects.

globular cluster NGC 1851

The densely packed globular cluster NGC 1851, as seen by the Hubble Space Telescope. [NASA, ESA, and G. Piotto (Università degli Studi di Padova); Processing: Gladys Kober (NASA/Catholic University of America)]

Little Red Dots as Young Globular Clusters

John Chisholm (The University of Texas at Austin) and collaborators hypothesized that little red dots represent a brief phase in the formation of globular clusters. In this hypothesis, the rest-frame ultraviolet emission of little red dots comes from the hot young stars of the newborn cluster, while the rest-frame optical emission comes from a single supermassive star at the cluster’s heart. Thus, in this framework, the little red dot phase lasts only as long as the fleeting lifespan of the supermassive star.

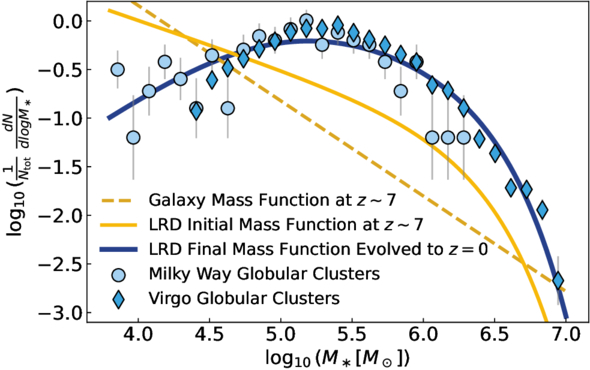
Chisholm’s team first showed that the spectrum of a young globular cluster with a supermassive star at its center is similar to the observed spectrum of a little red dot. But showing that the emission properties of globular clusters in formation and little red dots are similar is not enough — it’s also necessary to investigate whether the numbers and masses of these objects line up.

mass functions of little red dots and globular clusters

Comparison of the mass functions of little red dots evolved forward to the present day (blue line) and globular clusters in the Milky Way and Virgo (blue symbols). The results for both populations have been normalized to emphasize the shape of the distributions. Click to enlarge. [Chisholm et al. 2026]

To do this, the team propagated the observed mass function of little red dots at a redshift of z = 7 forward in time to z = 0. This process accounted for the rapid evolution of the supermassive star into a black hole, as well as the evolution of and feedback from the massive stars in the cluster. Comparing the resulting mass function to the population of present-day globular clusters, the team found that the mass functions had very similar shapes, and the number densities of little red dots and globular clusters in the present day are estimated to be of the same order of magnitude: 0.1–0.3 Mpc-3 and 0.8 Mpc-3, respectively.

In addition to describing how the properties of globular clusters in formation match those of little red dots, Chisholm’s team outlined some testable predictions for this scenario, including formation timescales and chemical abundance patterns. If this hypothesis withstands further scrutiny, little red dots may provide a valuable look at the early years of some of our universe’s oldest star clusters.

Citation

“Connecting the Dots: UV-Bright Companions of Little Red Dots as Lyman–Werner Sources Enabling Direct-Collapse Black Hole Formation,” Josephine F. W. Baggen et al 2026 ApJL 1002 L4. doi:10.3847/2041-8213/ae58a5

“Little Red Dots as Globular Clusters in Formation,” John Chisholm et al 2026 ApJL 1004 L4. doi:10.3847/2041-8213/ae6dae

The post Two More Thoughts on Little Red Dots appeared first on AAS Nova.

❌