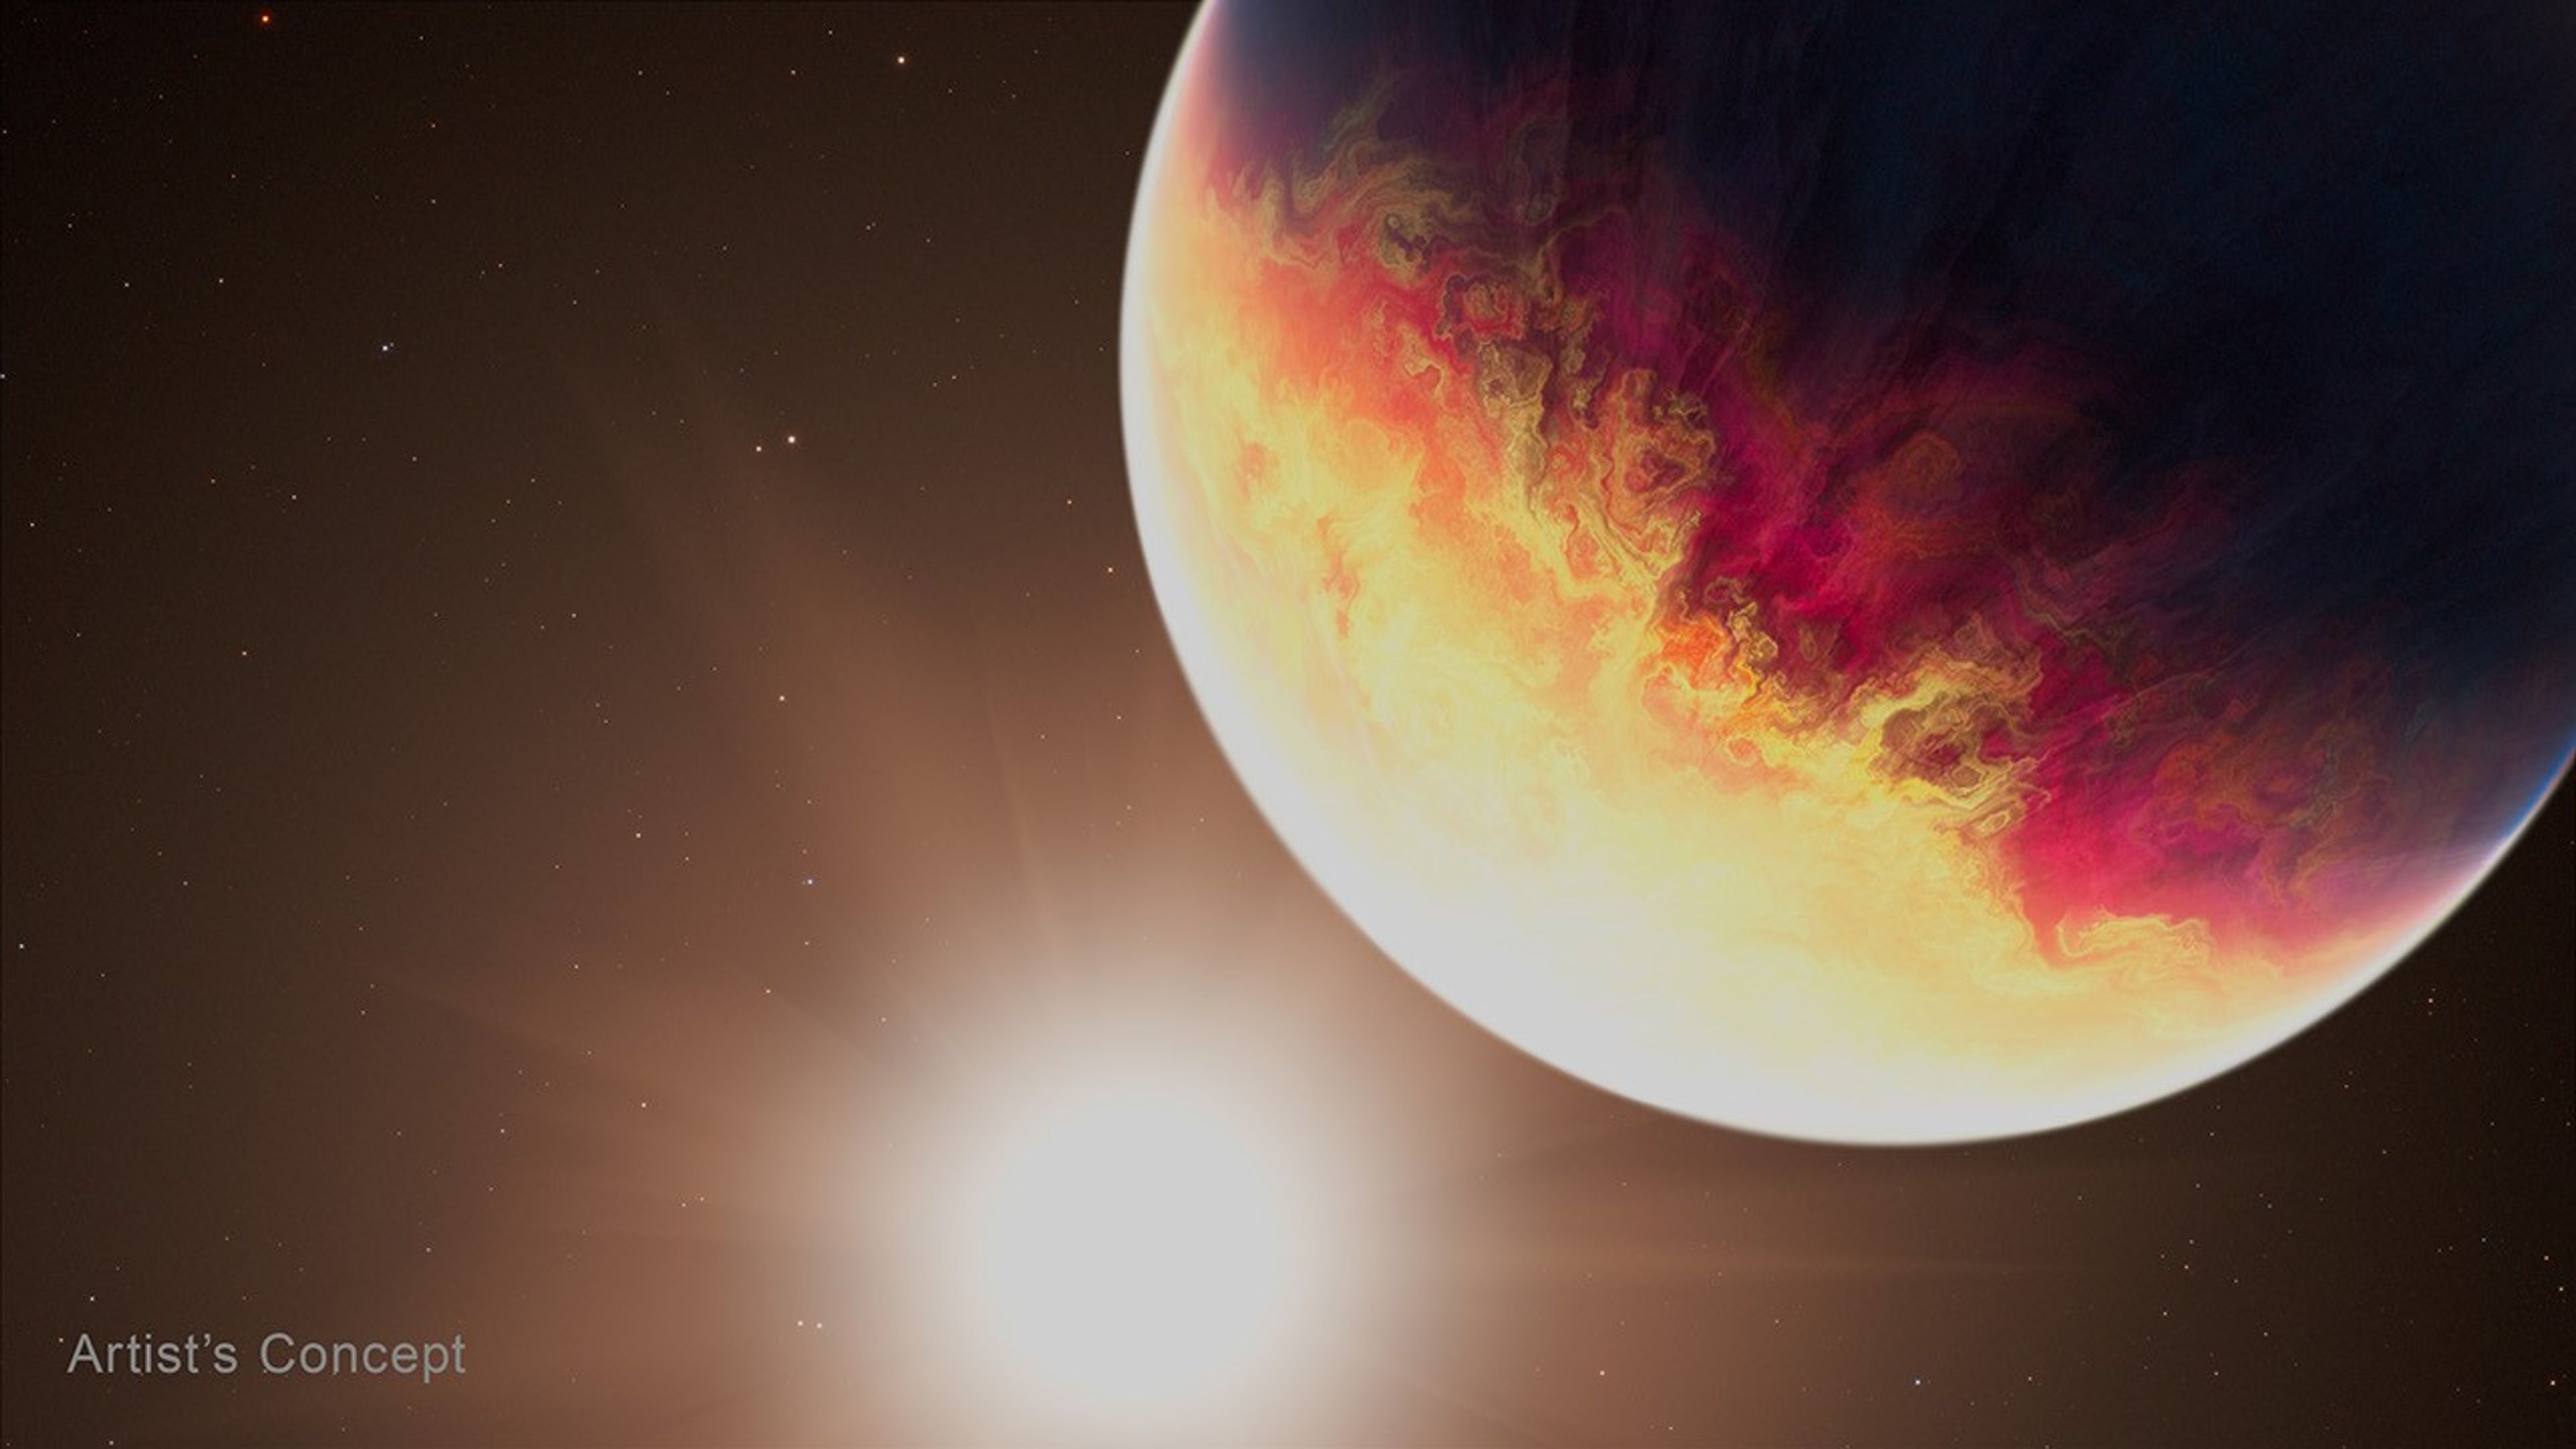
This artist’s concept shows exoplanet HD 80606 b being “roasted” as its orbit approaches periastron, the point at which it is closest to its host star, which is similar to our Sun.
Credits: Artwork: NASA, ESA, CSA, Joseph Olmsted (STScI)
4 min read
NASA’s Webb Catches Exoplanet Getting Roasted
One well-done gas giant, coming right up! That’s the latest from researchers analyzing NASA’s James Webb Space Telescope’s observations of HD 80606 b, an exoplanet four times the mass of Jupiter with an extremely elliptical orbit that sweeps close by its Sun-like star. The research team is presenting their study and preliminary findings Tuesday at the 248th meeting of the American Astronomical Society in Pasadena, California.
“Hot Jupiters are already considered some of the most extreme exoplanets we know of, but even among that population, HD 80606 b is one of the most extreme,” said Tiffany Kataria, the study’s principal investigator at NASA’s Jet Propulsion Laboratory in Southern California. “We typically think of hot Jupiters as hot gas giants sitting right next to their stars, but this planet’s highly eccentric orbit creates a completely different beast.”
As the planet plunges close to its star, Webb shows its temperature skyrockets by 1,100 degrees Fahrenheit. Previous studies have shown that radical temperature swings can cause an exoplanet’s chemistry and clouds to change in real time. According to the research team, the dynamic conditions of HD 80606 b make the planet an ideal target to observe these changes with Webb’s powerful instruments.
Image: Artist’s concept exoplanet HD 80606 b
This artist’s concept shows exoplanet HD 80606 b being “roasted” as its orbit approaches periastron, the point at which it is closest to its host star, which is similar to our Sun.
Artwork: NASA, ESA, CSA, Joseph Olmsted (STScI)
“Observing a planet like HD 80606 b is actually very efficient because its unusual orbit, with the corresponding swings in temperature and chemical composition, allow us to gather data under varying conditions in just hours and apply those findings to other hot Jupiters or more conventional exoplanets,” said Laura C. Mayorga, co-investigator on the study and an exoplanet astronomer at the Johns Hopkins Applied Physics Laboratory in Laurel, Maryland.
Measurements of temperature and chemical composition were done with spectroscopy, a technique scientists use to break light into its component colors to reveal information about the composition, temperature, motion, and physical properties of objects in space. The team used Webb’s MIRI (Mid-Infrared Instrument) for an extended observation of HD 80606 b before, during, and after its periastron, or closest pass by its star. During periastron, the planet also passed behind the star from Webb’s perspective in what’s known as a secondary eclipse. The observation was years in the planning, as scheduling the time to catch the planet at this point was complex given its extremely elliptical 111-day orbit, and Webb’s own restrictions on where it can look during specific times of the year, based on Earth’s position in orbit around the Sun.
Researchers say they have only begun to peel back the layers of an incredibly rich dataset, but they can clearly see a dramatic shift in the exoplanet’s temperature. “Webb has shown that the planet’s increase in temperature was even more extreme than we anticipated based on Spitzer data,” said Kataria.
In fact, the planet had already been dubbed the “roasted exoplanet” and even got its own poster in NASA’s popular series. NASA’s now-retired Spitzer Space Telescope laid the groundwork of infrared observations of HD 80606 b, showing that more detailed spectroscopic data from Webb would be especially compelling.
“Spitzer did amazing work on this exoplanet, and now Webb is building on that legacy by enabling us to drill down to distinguish specific chemical signatures like methane and carbon dioxide, which is just amazing progress,” said Ryan Challener, co-author and research associate at the Cornell Center for Astrophysics and Planetary Science. “There’s so much to learn from this one dataset here — we really are just getting started deciphering what Webb has to tell us.”
The James Webb Space Telescope is the world’s premier space science observatory. Webb is solving mysteries in our solar system, looking beyond to distant worlds around other stars, and probing the mysterious structures and origins of our universe and our place in it. Webb is an international program led by NASA with its partners, ESA (European Space Agency) and CSA (Canadian Space Agency).
The following sections contain links to download this article’s images and videos in all available resolutions followed by related information links, media contacts, and if available, research paper and Spanish translation links.
Related Images & Videos
HD 80606 b (Artist’s Concept)
This artist’s concept shows exoplanet HD 80606 b being “roasted” as its orbit approaches periastron, the point at which it is closest to its host star, which is similar to our Sun.
This artist’s concept shows exoplanet HD 80606 b being “roasted” as its orbit approaches periastron, the point at which it is closest to its host star, which is similar to our Sun.
Credits: Artwork: NASA, ESA, CSA, Joseph Olmsted (STScI)
4 min read
NASA’s Webb Catches Exoplanet Getting Roasted
One well-done gas giant, coming right up! That’s the latest from researchers analyzing NASA’s James Webb Space Telescope’s observations of HD 80606 b, an exoplanet four times the mass of Jupiter with an extremely elliptical orbit that sweeps close by its Sun-like star. The research team is presenting their study and preliminary findings Tuesday at the 248th meeting of the American Astronomical Society in Pasadena, California.
“Hot Jupiters are already considered some of the most extreme exoplanets we know of, but even among that population, HD 80606 b is one of the most extreme,” said Tiffany Kataria, the study’s principal investigator at NASA’s Jet Propulsion Laboratory in Southern California. “We typically think of hot Jupiters as hot gas giants sitting right next to their stars, but this planet’s highly eccentric orbit creates a completely different beast.”
As the planet plunges close to its star, Webb shows its temperature skyrockets by 1,100 degrees Fahrenheit. Previous studies have shown that radical temperature swings can cause an exoplanet’s chemistry and clouds to change in real time. According to the research team, the dynamic conditions of HD 80606 b make the planet an ideal target to observe these changes with Webb’s powerful instruments.
Image: Artist’s concept exoplanet HD 80606 b
This artist’s concept shows exoplanet HD 80606 b being “roasted” as its orbit approaches periastron, the point at which it is closest to its host star, which is similar to our Sun.
Artwork: NASA, ESA, CSA, Joseph Olmsted (STScI)
“Observing a planet like HD 80606 b is actually very efficient because its unusual orbit, with the corresponding swings in temperature and chemical composition, allow us to gather data under varying conditions in just hours and apply those findings to other hot Jupiters or more conventional exoplanets,” said Laura C. Mayorga, co-investigator on the study and an exoplanet astronomer at the Johns Hopkins Applied Physics Laboratory in Laurel, Maryland.
Measurements of temperature and chemical composition were done with spectroscopy, a technique scientists use to break light into its component colors to reveal information about the composition, temperature, motion, and physical properties of objects in space. The team used Webb’s MIRI (Mid-Infrared Instrument) for an extended observation of HD 80606 b before, during, and after its periastron, or closest pass by its star. During periastron, the planet also passed behind the star from Webb’s perspective in what’s known as a secondary eclipse. The observation was years in the planning, as scheduling the time to catch the planet at this point was complex given its extremely elliptical 111-day orbit, and Webb’s own restrictions on where it can look during specific times of the year, based on Earth’s position in orbit around the Sun.
Researchers say they have only begun to peel back the layers of an incredibly rich dataset, but they can clearly see a dramatic shift in the exoplanet’s temperature. “Webb has shown that the planet’s increase in temperature was even more extreme than we anticipated based on Spitzer data,” said Kataria.
In fact, the planet had already been dubbed the “roasted exoplanet” and even got its own poster in NASA’s popular series. NASA’s now-retired Spitzer Space Telescope laid the groundwork of infrared observations of HD 80606 b, showing that more detailed spectroscopic data from Webb would be especially compelling.
“Spitzer did amazing work on this exoplanet, and now Webb is building on that legacy by enabling us to drill down to distinguish specific chemical signatures like methane and carbon dioxide, which is just amazing progress,” said Ryan Challener, co-author and research associate at the Cornell Center for Astrophysics and Planetary Science. “There’s so much to learn from this one dataset here — we really are just getting started deciphering what Webb has to tell us.”
The James Webb Space Telescope is the world’s premier space science observatory. Webb is solving mysteries in our solar system, looking beyond to distant worlds around other stars, and probing the mysterious structures and origins of our universe and our place in it. Webb is an international program led by NASA with its partners, ESA (European Space Agency) and CSA (Canadian Space Agency).
The following sections contain links to download this article’s images and videos in all available resolutions followed by related information links, media contacts, and if available, research paper and Spanish translation links.
Related Images & Videos
HD 80606 b (Artist’s Concept)
This artist’s concept shows exoplanet HD 80606 b being “roasted” as its orbit approaches periastron, the point at which it is closest to its host star, which is similar to our Sun.
NASA Webb, Hubble Reveal History of Relic of Milky Way’s Formation
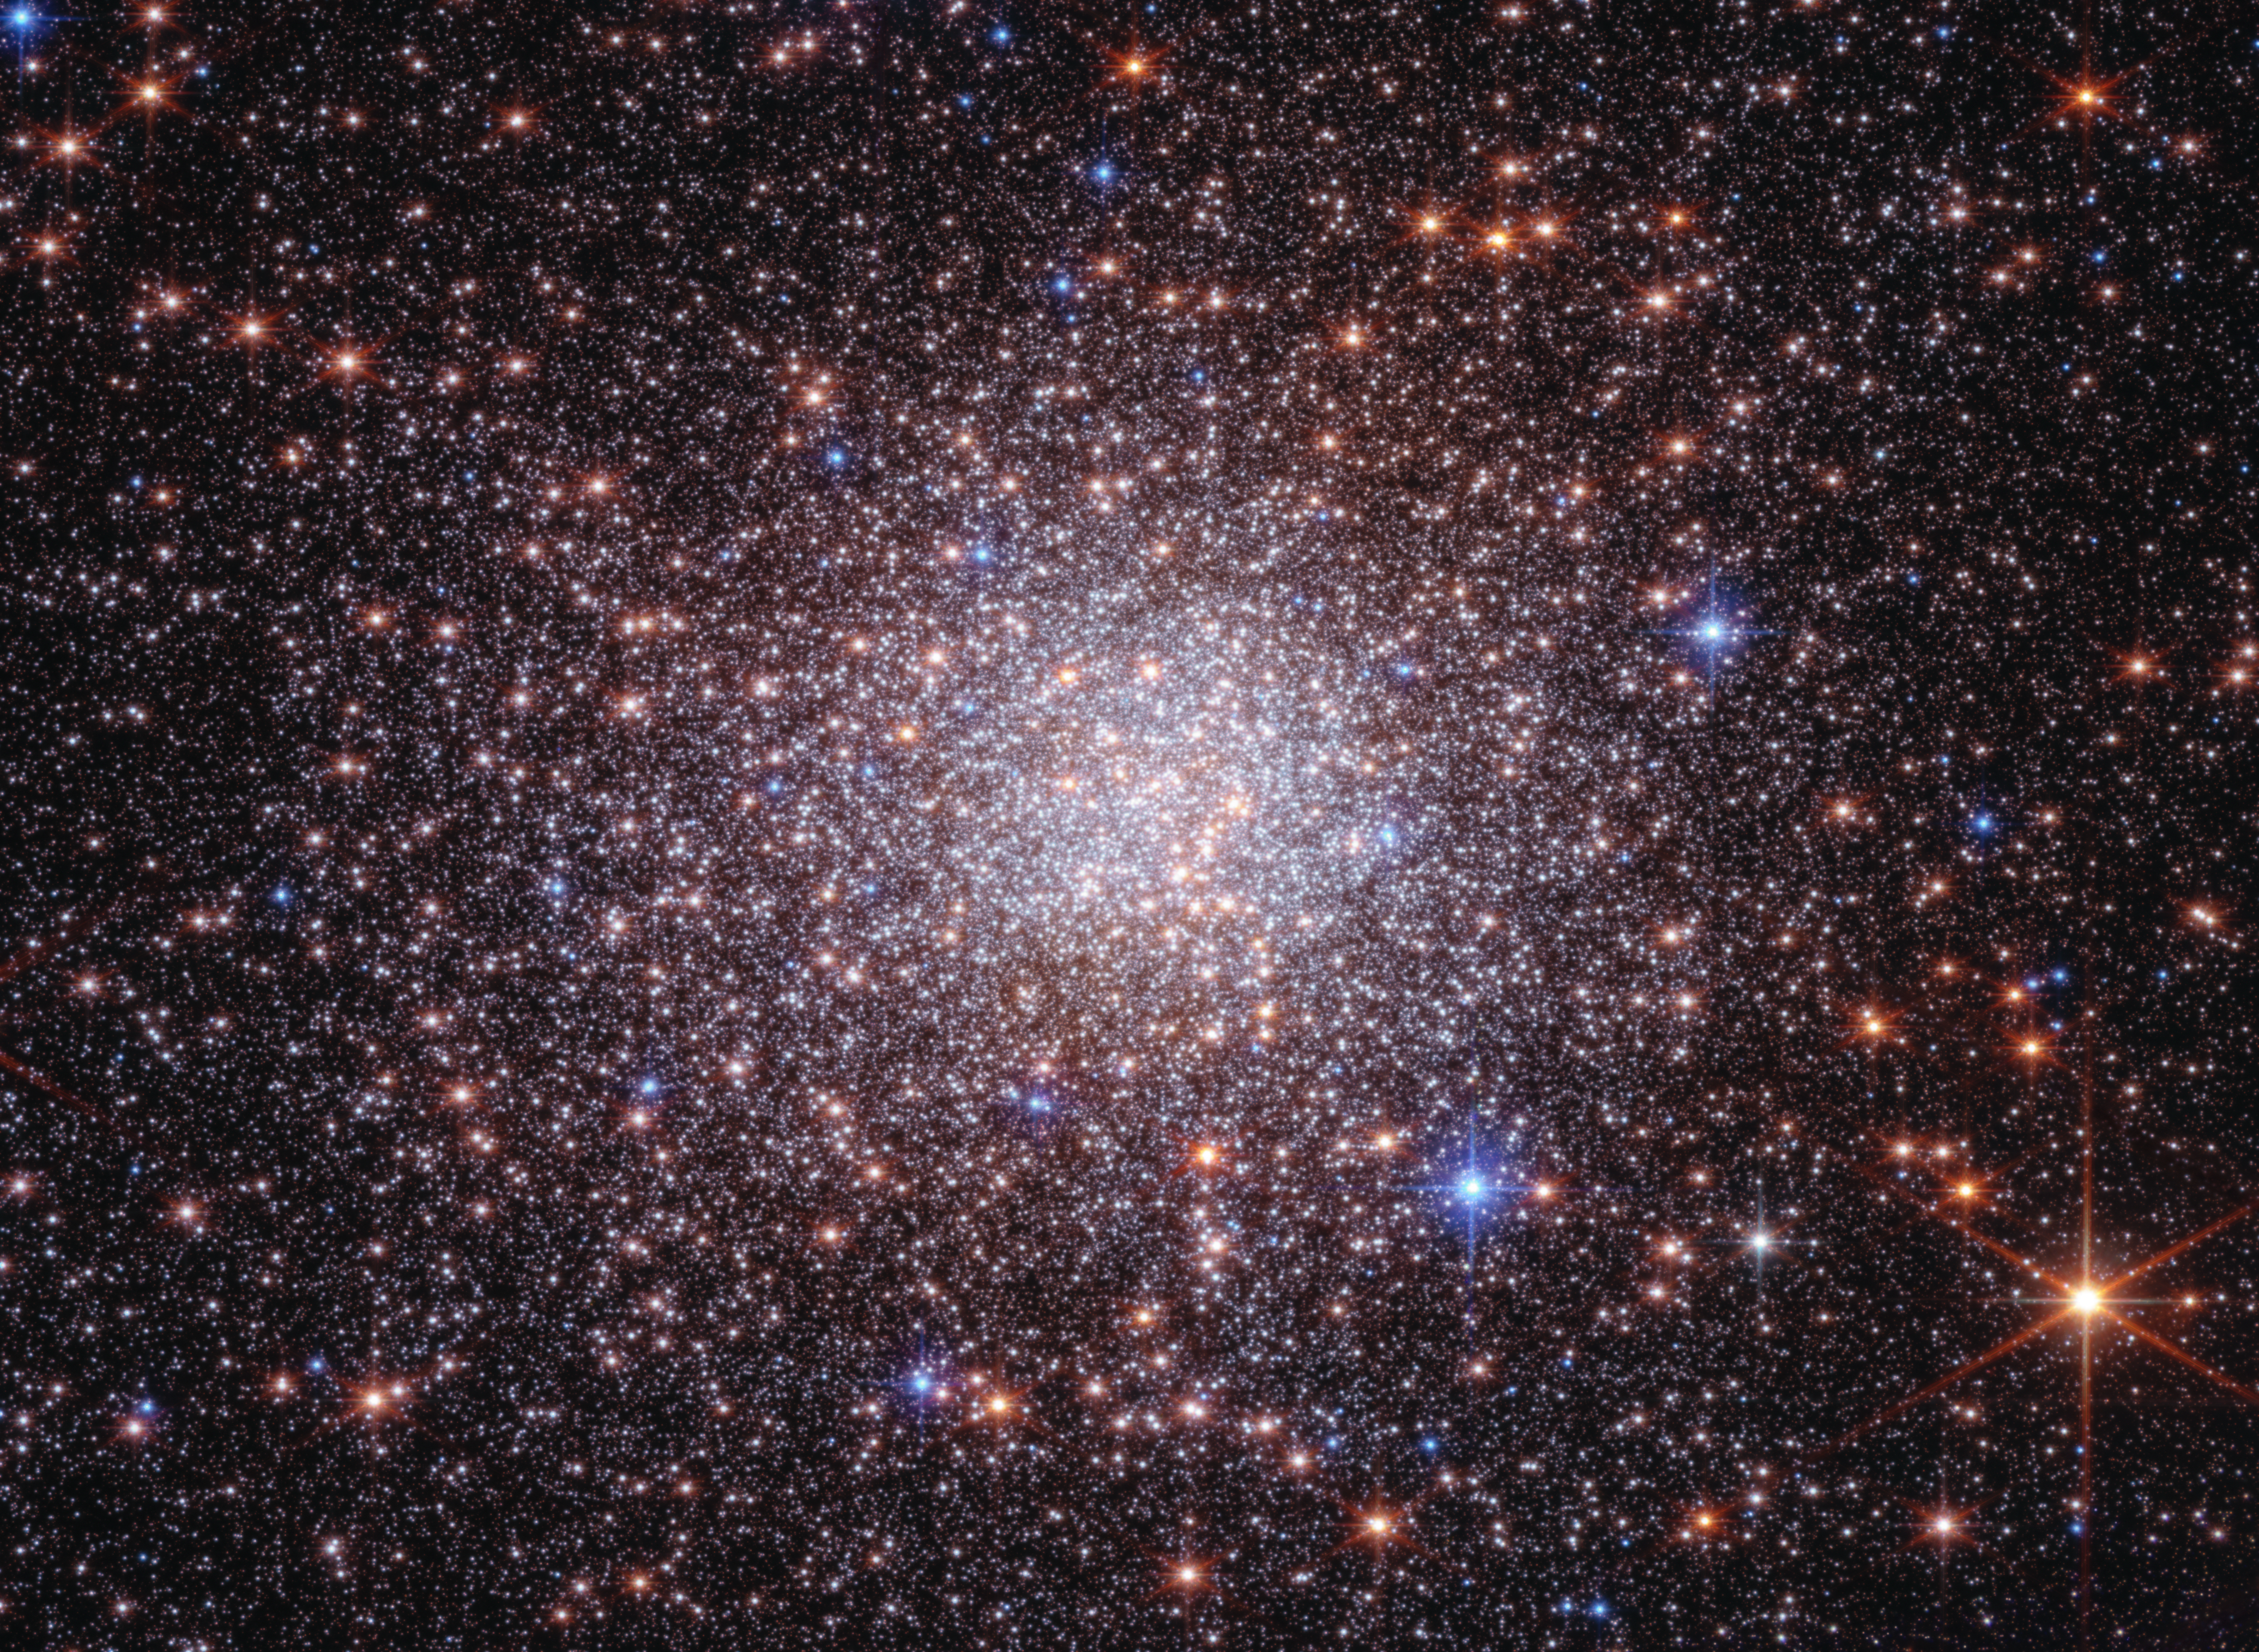
New observations from Webb combined with multiple observations from Hubble prove that Terzan 5 is a self-contained, self-enriching stellar system that contains up to four distinct star populations. It orbits within our Milky Way galaxy’s central bulge.
Credits: Image: NASA, ESA, CSA, STScI, Giorgia Zullo (University of Bologna), Francesco Ferraro (University of Bologna); Image Processing: Alyssa Pagan (STScI)
Researchers using two of humanity’s most powerful observatories — NASA’s James Webb and Hubble Space Telescopes — have definitively shown that Terzan 5 is not a globular star cluster as it was once classified, offering new insight into how galaxies like our own form and evolve over time. A globular star cluster typically has only one ancient star population. New data not only confirms the existence of two distinct populations of stars in Terzan 5, but also provides evidence for two more recent rounds of star formation. Although located within the crowded bulge of our Milky Way, our galaxy’s central, spherical region of older stars, Terzan 5 was massive enough to maintain its separate identity while lighter weight systems spread out and mixed to form the bulge billions of years ago. It’s like a lump in an otherwise well-mixed cake batter.
“Webb’s new near-infrared observations, cross-referenced with Hubble’s archival observations, have given us a much clearer picture of the history of Terzan 5,” said Giorgia Zullo, who led the research and is a PhD student at the University of Bologna in Italy.
These results were presented at a press conference Tuesday at the 248th meeting of the American Astronomical Society in Pasadena, and were published in Astronomy & Astrophysics.
Image: Bulge Fossil Fragment Terzan 5 (Webb and Hubble Image)
New observations from Webb combined with multiple observations from Hubble prove that Terzan 5 is a self-contained, self-enriching stellar system that contains up to four distinct star populations. It orbits within our Milky Way galaxy’s central bulge.
Image: NASA, ESA, CSA, STScI, Giorgia Zullo (University of Bologna), Francesco Ferraro (University of Bologna); Image Processing: Alyssa Pagan (STScI)
Four generations of stars
Discovered in 1968 by astronomer Azop Terzan, Terzan 5 resembles a globular cluster in many ways. However, in 2009 this system was discovered to harbor two distinct populations of stars. In 2016 Hubble provided the first estimate of their ages, showing that one formed roughly 12 billion years ago — as the Milky Way itself was assembling — and the other about 5 billion years ago, just before Earth started forming. This pointed to a more complex history than a typical globular cluster.
Studying Terzan 5 is complicated by its location in a region of our galaxy crowded with stars and heavily obscured by dust. This is where Webb stepped in. Its infrared view allowed the research team to peer through the dust and catalog many more stars, and fainter stars, than previous work. By measuring star colors and brightnesses, astronomers can classify them into populations of different ages and chemistries.
Webb was able to measure these key properties for every star within the field of view in the sky — both stars within Terzan 5 and unrelated foreground stars. To isolate the stars of Terzan 5, the team relied on the power and longevity of Hubble. The 12-year separation allowed the team to measure very small movements of individual stars, known as proper motions, to determine which stars belong to Terzan 5 and which are part of the Milky Way bulge.
By combining data from both Webb and Hubble, the researchers found strong evidence for two more stellar populations, one that formed 3.8 billion years ago and another only 2.5 billion years ago. They also were able to determine the ages of the previously known stellar populations with unprecedented precision, finding that they formed 12.5 billion and 4.7 billion years ago.
With the previously known two generations of stars, astronomers could not rule out the possibility that Terzan 5 interacted with another object, like a globular cluster or a giant molecular cloud, becoming enriched with new gas and dust that set off a second round of star formation. With four stellar generations, those explanations are ruled out.
Measurements of the stellar composition of Terzan 5 populations made at the W. M. Keck Observatory and European Southern Observatory’s Very Large Telescope also point toward very distinct populations. “Along with the ages of these populations, the cluster preserves a fossil record of progressive enrichment of heavy elements by supernovae,” said co-author R. Michael Rich, a research astronomer at the University of California, Los Angeles.
Terzan 5 formed multiple generations of stars because it was able to retain the necessary raw materials. There is evidence of powerful supernova explosions in Terzan 5 that forged heavier elements that were swept up by subsequent generations of stars. In lighter weight systems, the force of the explosions themselves could have ejected the resulting elements as well as sweeping out leftover gas and dust. The progenitor of Terzan 5 had enough mass to retain those stars’ ejections, allowing new generations of stars to form over billions of years.
‘Bulge fossil fragment’
The results show that Terzan 5 is most likely the remnant of a much more massive stellar system that initially formed 12.5 billion years ago. Terzan 5 is extraordinary because it survived — and never merged or fully “mixed in” with the Milky Way’s bulge. “For some reason, this peculiar clump of stars formed separately from the bulge and was not destroyed as the bulge itself formed,” said Francesco R. Ferraro, a professor at the University of Bologna and principal investigator of the Webb observations. “Terzan 5 is what we now call a bulge fossil fragment because it resembles the primordial clumps that contributed to the formation of the bulge.”
To date, there’s one other known cosmic object like Terzan 5. Liller 1 was the second to be reclassified from a globular star cluster to a bulge fossil fragment. It also contains multiple generations of stars. There may be more objects like it. Between 40 to 50 additional globular clusters that orbit within the bulge will be examined by Ferraro’s team to determine if their stellar populations are all the same, like globular clusters, or have several generations, like bulge fossil fragments.
Video: Zoom to See Terzan 5 Near Our Milky Way Galaxy’s Bulge
Zoom in to Terzan 5, a star cluster that lies within the crowded central region of our Milky Way galaxy known as the bulge. The scene starts with a ground-based image of our Milky Way bulge and zooms in on and circles Terzan 5, ending with the composite image of the star system from the James Webb and Hubble Space Telescopes.
Potential parallels for galaxy formation near, far
Ultimately, this research may improve what we know about how the central bulges of galaxies form over hundreds of millions of years. “Based on observations and in-depth simulations, we think that galaxies in the early universe had huge disks of gas that fragmented into clumps and formed stars. These clumps migrated to the center of the galaxies, and many merged to form their bulges,” said Barbara Lanzoni, a co-author and associate professor at the University of Bologna. For example, Webb has turned up several examples of “clumpy” galaxies that were actively forming when the universe was only a few hundred million years old, like the clumps in the Firefly Sparkle galaxy. “Terzan 5 may provide direct evidence that can help explain how bulges formed in galaxies throughout the universe,” Lanzoni said.
The James Webb Space Telescope is the world’s premier space science observatory. Webb is solving mysteries in our solar system, looking beyond to distant worlds around other stars, and probing the mysterious structures and origins of our universe and our place in it. Webb is an international program led by NASA with its partners, ESA (European Space Agency) and CSA (Canadian Space Agency).
The Hubble Space Telescope has been operating for over three decades and continues to make ground-breaking discoveries that shape our fundamental understanding of the universe. Hubble is a project of international cooperation between NASA and ESA (European Space Agency). NASA’s Goddard Space Flight Center in Greenbelt, Maryland, manages the telescope and mission operations. Lockheed Martin Space, based in Denver, also supports mission operations at Goddard. The Space Telescope Science Institute in Baltimore, which is operated by the Association of Universities for Research in Astronomy, conducts Hubble science operations for NASA.
The following sections contain links to download this article’s images and videos in all available resolutions followed by related information links, media contacts, and if available, research paper and Spanish translation links.
Related Images & Videos
Bulge Fossil Fragment Terzan 5 (Webb and Hubble Image)
New observations from Webb combined with multiple observations from Hubble prove that Terzan 5 is a self-contained, self-enriching stellar system that contains up to four distinct star populations. It orbits within our Milky Way galaxy’s central bulge.
Terzan 5 (Webb and Hubble Compass Image)
This image of bulge fossil fragment Terzan 5 was captured by the James Webb and Hubble space telescopes. Webb’s data are from its NIRCam (Near-Infrared Camera) and Hubble’s from its Advanced Camera for Surveys (ACS). The image shows a scale bar, compass arrows, and co…
Zoom to See Terzan 5 Near Our Milky Way Galaxy’s Bulge
Zoom in to Terzan 5, a star cluster that lies within the crowded central region of our Milky Way galaxy known as the bulge. The scene starts with a ground-based image of our Milky Way bulge and zooms in on and circles Terzan 5, ending with the composite image of the star system f…
NASA Webb Finds Strongest Evidence Yet for ‘Black Hole Stars’
While the primary purpose of NASA’s James Webb Space Telescope’s observations of galaxy cluster Abell S1063 was to look for a certain population of stars, scientists obtained a detailed spectrum of GLIMPSE-17775 from the dataset. This little red dot is located behind Abell S1063.
Credits: Image: NASA, ESA, CSA, Vasily Kokorev (UT Austin); Image Processing: Alyssa Pagan (STScI)
The complex puzzle known as little red dots has become more complete since their initial discovery by NASA’s James Webb Space Telescope in 2022. Now a particular little red dot’s spectrum is helping connect many of the pieces.
A team of astronomers led by Vasily Kokorev at the University of Texas at Austin identified the lucky dot in question: GLIMPSE-17775. By carefully analyzing the dot’s spectrum captured by Webb — the deepest spectrum to date of a little red dot — the research team has identified multiple lines of evidence, all of which support the interpretation that GLIMPSE-17775 is a supermassive black hole enveloped in a dense cocoon of partially ionized gas, a model referred to as the BH* (black hole star) scenario. A paper describing the results was published today in The Astrophysical Journal.
“I think part of the scientific community is converging on a singular picture — that little red dots can be explained by black hole star models. But none of the previous little red dots have all of the pieces of evidence in the same place,” said Kokorev, lead author of the study. “With GLIMPSE-17775 we can test these models because of how deep and amazing this source’s spectrum is.”
Image: Abell S1063 with Pullout of GLIMPSE-17775 (NIRCam Image)
While the primary purpose of NASA’s James Webb Space Telescope’s observations of galaxy cluster Abell S1063 was to look for a certain population of stars, scientists obtained a detailed spectrum of GLIMPSE-17775 from the dataset. This little red dot is located behind Abell S1063.
Image: NASA, ESA, CSA, Vasily Kokorev (UT Austin); Image Processing: Alyssa Pagan (STScI)
Connecting puzzle pieces
Soon after Webb first began science operations, it discovered a new, mysterious type of object in the very early universe – abundant red objects that emerged about 600 million years after the big bang. Scientists have explored multiple explanations for these little red dots, including the black hole star scenario.
A set of fortunate circumstances brought about this new, elaborate spectrum of a little red dot. The little red dot that would come to be known as GLIMPSE-17775 was fortunately included in Webb’s imaging and spectroscopy efforts for a project that sought to look for Population III stars and faint galaxies in galaxy cluster Abell S1063. This little red dot is more distant than the galaxy cluster and magnified by gravitational lensing. (GLIMPSE-17775 has a cosmological redshift of 3.5, meaning it existed about 1.8 billion years after the big bang.)
While Webb provided a 30-hour spectrum of the little red dot, the effect of gravitational lensing made it equivalent to 80 hours of telescope time. This combination of Webb’s infrared sensitivity and nature’s own “magnifying glass” amplified the amount of detail that could be gleaned from GLIMPSE-17775. The result was more than 40 spectral lines from this small, red source, which is the most detailed little red dot spectrum to date.
“When we saw the spectrum for the first time, it was like having all the pieces of a puzzle scattered on the floor,” said Kokorev. “We picked up each piece of the puzzle, measured the lines, and started combining the different pieces into a mosaic. Maybe a few pieces looked like nothing at first, but then a couple of them came together, and we realized that there was something there.”
The spectroscopic data collected by Webb contains multiple lines of evidence that support the interpretation that little red dot GLIMPSE-17775 is a black hole star: a rapidly accreting, or growing, black hole enveloped in a dense gas cocoon, which is reprocessing the light emitted from near the black hole and producing the features seen in the spectrum.
Image: Evidence of a ‘Black Hole Star’
NASA’s James Webb Space Telescope captured the deepest spectrum to date of a little red dot. More than 40 spectral lines have been discerned from the data, many of which independently support the theory that GLIMPSE-17775 is a black hole enshrouded by a hot, dense gas cocoon.
Illustration: NASA, ESA, CSA, Vasily Kokorev (UT Austin); Designer: Leah Hustak (STScI)
Lines of evidence
Among the 40-plus lines that the team detected in GLIMPSE-17775’s spectrum were various independent indicators that all align with the BH* scenario. For example, the team found that many of the spectral lines, such as hydrogen, oxygen, and helium, do not fit a simple model of a rotating gas cloud. Instead, the best fit model includes a broadening effect known as electron scattering, a telltale sign that a dense, layered gas cocoon is enshrouding this source.
The strength and ratios of certain lines to each other, most notably the 16 iron lines that compose what the team has dubbed an “iron forest” and certain oxygen lines, require a high-energy source to produce them, like a rapidly accreting black hole. Additionally, astronomers noted the fluorescence and absorption of helium in the spectrum, both of which individually suggest that there is a dense medium enveloping a powerful source.
The BH* scenario not only fits GLIMPSE-17775; it also accounts for why most little red dots are faint in X-rays, since any such emission is likely absorbed by the dense gas cocoon.
One missing element of the GLIMPSE-17775 puzzle piece is the part of the spectrum that would reveal what’s known as a Balmer break, or a strong dip in the emitted light that’s a signature characteristic of little red dots. To build a more comprehensive understanding of this little red dot, the team incorporated ancillary data from two observing programs that used NASA’s Hubble Space Telescope: the Frontier Fields and BUFFALO (Beyond Ultra-deep Frontier Fields And Legacy Observations) programs.
The Webb and Hubble data together help explain why the Balmer break is weaker than what typically is found in other little red dots: A giant host galaxy is surrounding GLIMPSE-17775. Although a little red dot’s host galaxy is not something that has been usually seen at such scale before, it isn’t inconsistent with the dense gas cocoon model. The black hole star model of little red dots attributes excess blue light to stars in the host galaxy.
When Webb first discovered little red dots, some researchers thought these objects had “broken cosmology,” unsure how galaxies could have grown so big so quickly in the early universe to account for all this light coming from their stars. However, the team believes the GLIMPSE-17775 puzzle piece fits nicely in the existing framework of the universe’s evolutionary history, because black hole masses don’t need to be as high in order to explain the broad emission lines.
“Everything fits, nothing is broken, and I think that makes the puzzle that is our universe even better,” said Kokorev. “Looking ahead, I’m eager to dive deeper and learn about what is powering the central engines of little red dots. While we think it’s a black hole, there are some other interesting theories being proposed, which is exciting. Maybe in a year or two, we’ll have the final answer to what powers these sources.”
The James Webb Space Telescope is the world’s premier space science observatory. Webb is solving mysteries in our solar system, looking beyond to distant worlds around other stars, and probing the mysterious structures and origins of our universe and our place in it. Webb is an international program led by NASA with its partners, ESA (European Space Agency) and CSA (Canadian Space Agency).
The following sections contain links to download this article’s images and videos in all available resolutions followed by related information links, media contacts, and if available, research paper and Spanish translation links.
Related Images & Videos
Abell S1063 with Pullout of GLIMPSE-17775 (NIRCam Image)
While the primary purpose of NASA’s James Webb Space Telescope’s observations of galaxy cluster Abell S1063 was to look for a certain population of stars, scientists obtained a detailed spectrum of GLIMPSE-17775 from the dataset. This little red dot is located behind Abell S1063.
Evidence of a ‘Black Hole Star’
NASA’s James Webb Space Telescope captured the deepest spectrum to date of a little red dot. More than 40 spectral lines have been discerned from the data, many of which independently support the theory that GLIMPSE-17775 is a black hole enshrouded by a hot, dense gas cocoon.
A compact, multifrequency radar built by a team at NASA’s Jet Propulsion Laboratory will make it easier to collect information about dynamic cloud systems. Called CloudCube, this new instrument simultaneously probes the atmosphere with three radar signals, spanning 36 to 240 GHz, for optimized sensitivity to a wide range of water droplet and ice particle sizes.
Figure 1: A prototype of CloudCube’s G-band channel was installed at Cape Grim, Tasmania, as a guest instrument for the Department of Energy’s Cloud and Precipitation Experiment at Kennaook (CAPE-K)
Credit: Raquel Rodriguez Monje / JPL
Built with funding from NASA’s Earth Science Technology Office Instrument Incubator Program, CloudCube transmits and receives Ka-, W-, and G-band signals, making it the first compact radar system capable of simultaneously probing meteorological targets at wavelengths spanning approximately one to ten millimeters. Researchers will be able to combine information from the three signals to learn more about the initiation and evolution of precipitation, as well as cloud microphysics and radiative properties.
“We’re making a low-power, low-mass instrument to facilitate new cost-efficient missions for atmospheric observations. Building a multi-frequency radar, especially at G-band, is very novel,” said Raquel Rodriguez Monje, a systems engineer at JPL and principal investigator for CloudCube.
Each of CloudCube’s three signals observes a different element of cloud physics. Ka-band radar signals are ideal for collecting precipitation profiles; W-band radar signals are preferred for measuring cloud particles that give rise to precipitation; and G-band radar signals, which have never been collected from a space-based instrument, are ideal for measuring ice and liquid water content inside very light clouds (a paper describing this measurement can be found here).
Probing the atmosphere simultaneously with three signals allows researchers to collect data on all these cloud features at once, which is valuable for improving weather forecasts and especially climate modeling. CloudCube leverages innovations in millimeter-wave hardware to pack three radar modules–one for each signal–within a single compact system.
Figure 2. A photo of the radar electronics for CloudCube’s compact G-band radar. Producing G-band radar signals requires a large amount of energy, and CloudCube is one of the first instruments to produce those signals effectively from a compact platform.
Credit: Raquel Rodriguez Monje / NASA JPL
One CloudCube innovation concerns the specialized components required to transmit G-band power from a compact, low-power instrument. The detection of cloud signals requires high transmit power, which CloudCube achieves by combining the outputs of multiple high-efficiency frequency-multiplication devices that allow the instrument to generate hundreds of milliWatts at 240 GHz. Another innovation of CloudCube is that it was designed to use as few radio frequency components as possible to reduce its mass and power consumption, which could lower the cost of future Earth-observing orbital instruments.
Flying an instrument equipped with G-band radar in space will be a new capability and will allow researchers to achieve greater spatial resolution and sensitivity in the study of cloud microphysical processes.
“Basically, we’re weighing clouds using these combinations of frequencies in a way that we couldn’t do before we had the G-band,” said Matt Lebsock, a researcher at JPL and co-investigator for CloudCube.
The instrument has been tested in the field. A ground-based prototype of CloudCube’s G-band channel operated continuously for 11 months during the Department of Energy’s Cloud and Precipitation Experiment at Kennaook (CAPE-K) campaign. CloudCube also participated in the Eastern Pacific Cloud Aerosol Precipitation Experiment, a ground campaign sponsored by the Department of Energy. A paper describing the results of that experiment can be foundhere.
Most recently, CloudCube successfully operated all three frequency bands from NASA’s Gulfstream III aircraft and collected its first airborne observations of snowfall as part of the North American Upstream Feature-Resolving and Tropopause Uncertainty Reconnaissance Experiment campaign—a NASA-funded campaign designed to improve forecasts of high-impact winter weather. The CloudCube team is currently calibrating and processing the data for public release.
For additional details, see the entry for this project onNASA TechPort.

 Login