The Apple TV horror comedy hasn't even finished airing its first season, but it's one of the most-nominated shows at the 2026 Television Critics Association Awards.
This NASA Hubble Space Telescope image features the galaxy cluster MACS0329-0211.
NASA, ESA, M. Postman (STScI); Image Processing: G. Kober (NASA/Catholic University of America)
Looking somewhat like a swarm of bees returning to their hive, this NASA Hubble Space Telescope image features the galaxy cluster MACS0329-0211. Galaxy clusters like MACS0329-0211 are important signposts in the story of how the structure of the universe evolved, and are the ultimate telescopic lenses, placing gravitationally lensed galaxies from the earliest stages of the universe into our view.
Zoom into this galaxy swarm and you will find large, oval-shaped elliptical galaxies, and thin spiral and lenticular galaxies viewed from the edge. We can also see the full, face-on view of spiral galaxies and their curving spiral arms. The image’s upper-right quadrant holds faint arcs of distant galaxies gravitationally lensed by the cluster’s massive gravity. The largest of these arcs appears above the bright oval shape of a giant elliptical galaxy. Closer inspection of the image’s center reveals several bright-white intersecting curves that appear as a distorted figure eight. This may be another distant galaxy whose light was magnified and distorted by this massive cluster’s gravity.
Hubble looked at MACS0329-0211 as part of an observing program of X-ray bright galaxy clusters. Researchers used Hubble’s two main cameras, the Advanced Camera for Surveys and its Wide Field Camera 3, to gather data visible and infrared light from the cluster. Hubble’s ability to see such a broad spectrum of light makes it a valuable tool in understanding the very nature of these galaxy clusters.
NASA’s Parker Solar Probe completed its 28th close approach to the Sun on June 8, again matching its record distance of 3.8 million miles from the solar surface. The flyby allowed the spacecraft to continue its measurements of the solar wind and solar activity at their source, while adding to our understanding of how the Sun’s atmosphere changes throughout the solar cycle.
The spacecraft checked in with flight controllers at the Johns Hopkins Applied Physics Laboratory (APL) in Laurel, Maryland — where Parker Solar Probe was designed and built — on Thursday, transmitting a beacon tone that indicated its systems were operating normally. Zooming around the Sun on a trajectory that limited communications with Earth, Parker had been out of contact and operating autonomously for nine days around its closest approach, as planned.
During this solar encounter, which started June 3 and ends Saturday, June 13, Parker’s four scientific instrument packages gathered data from inside the Sun’s atmosphere, or corona. Parker will begin returning detailed spacecraft telemetry on June 14, with science data transmission set to run from Wednesday, June 17 to Tuesday, June 30.
Parker’s observations of the solar wind and solar events, such as coronal mass ejections and the aftermaths of flares, are critical to advancing humanity’s understanding of the Sun and the phenomena that drive high-energy space weather events that pose risks to astronauts, satellites, air travel, and even power grids on Earth. Understanding the fundamental physics of space weather enables more reliable prediction of astronaut safety during future deep-space missions to the Moon and Mars.
Parker also equaled its record-setting speed of 430,000 mph — a mark that, like Parker’s distance to the Sun, was set during a close approach on Dec. 24, 2024, and matched during five flybys since, most recently on March 11. Parker will continue matching these speed and distance records during future flybys.
Through all six close approaches, mission leads say, the spacecraft has remained in excellent condition. While Parker doesn’t have a temperature sensor on the front of its heat shield — known as the Thermal Protection System, or TPS — the team can estimate through models that the heat shield reaches temperatures of about 1,700 degrees Fahrenheit at closest approach.
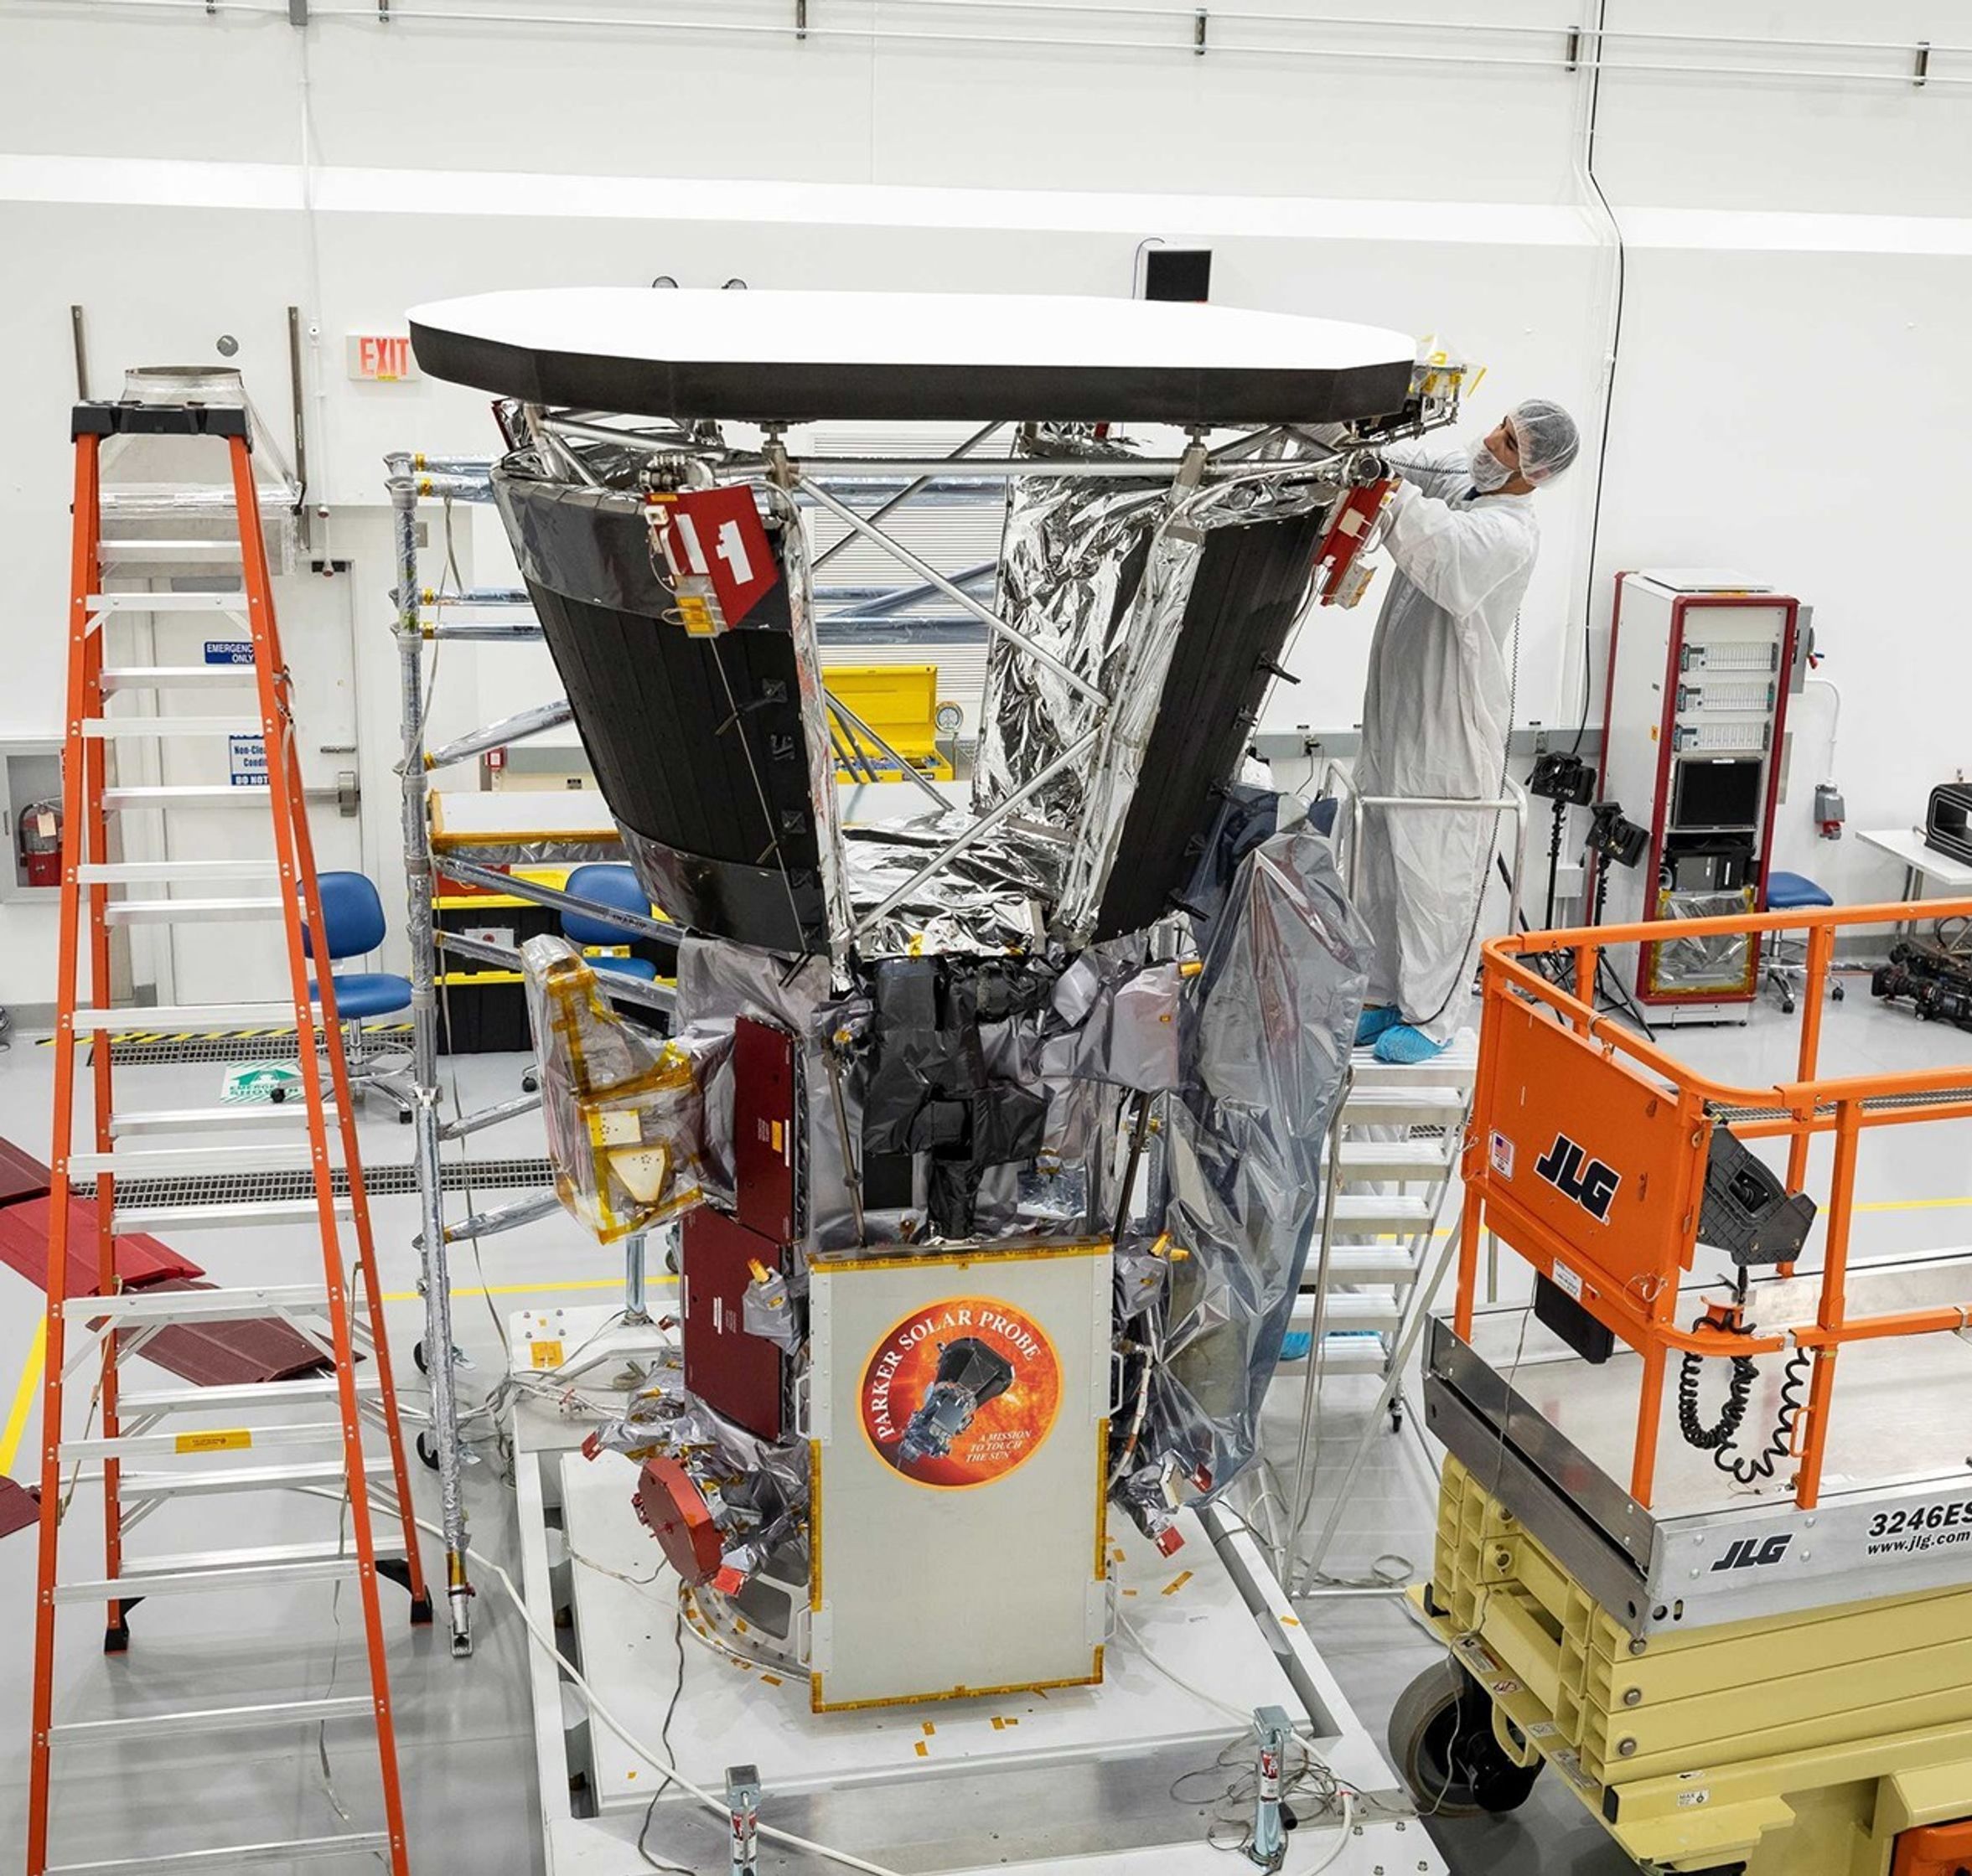
In this image from June 2018, about two months before Parker Solar Probe’s launch, technicians put the final touches on the thermal blankets below the spacecraft’s signature heat shield, the Thermal Protection System (TPS). After nearly eight years in space and through 28 solar en-counters, the TPS remains in excellent condition, even after withstanding temperatures of about 1,700 degrees Fahrenheit during its closest approaches to the Sun.
Meanwhile, the team can measure the temperature of the barrier blanketing below the heat shield, and the actual spacecraft temperature has remained consistent on each pass.
“That temperature consistency is a major indicator of spacecraft health,” said Wirzburger. “It tells us the heat shield isn’t degrading. If it were cracking or weakening, we’d see temperatures drift upward as more heat leaked through.”
Parker launched in August 2018. At the time, the Sun was near the minimum of its 11-year activity cycle. In 2024, representatives from NASA, the National Oceanic and Atmospheric Administration (NOAA), and the international Solar Cycle Prediction Panel announced that the Sun had reached its solar maximum period. Parker’s 28 encounters with the Sun reflect this change over time, sampling the Sun’s atmosphere from quiet to very active periods. Parker Solar Probe will remain in this orbit around the Sun and continue making observations into the declining phase of solar activity.
The next steps for the mission in late 2026 and beyond are under NASA review.
Parker Solar Probe was developed as a part of NASA’s Living With a Star (LWS) program to explore aspects of the Sun-Earth system that directly affect life and society. The LWS program is managed by the agency’s Goddard Space Flight Center in Greenbelt, Maryland, for NASA’s Science Mission Directorate in Washington. Johns Hopkins APL manages Parker Solar Probe for NASA and designed, built, and now operates the mission.
Mike Buckley, Johns Hopkins Applied Physics Laboratory
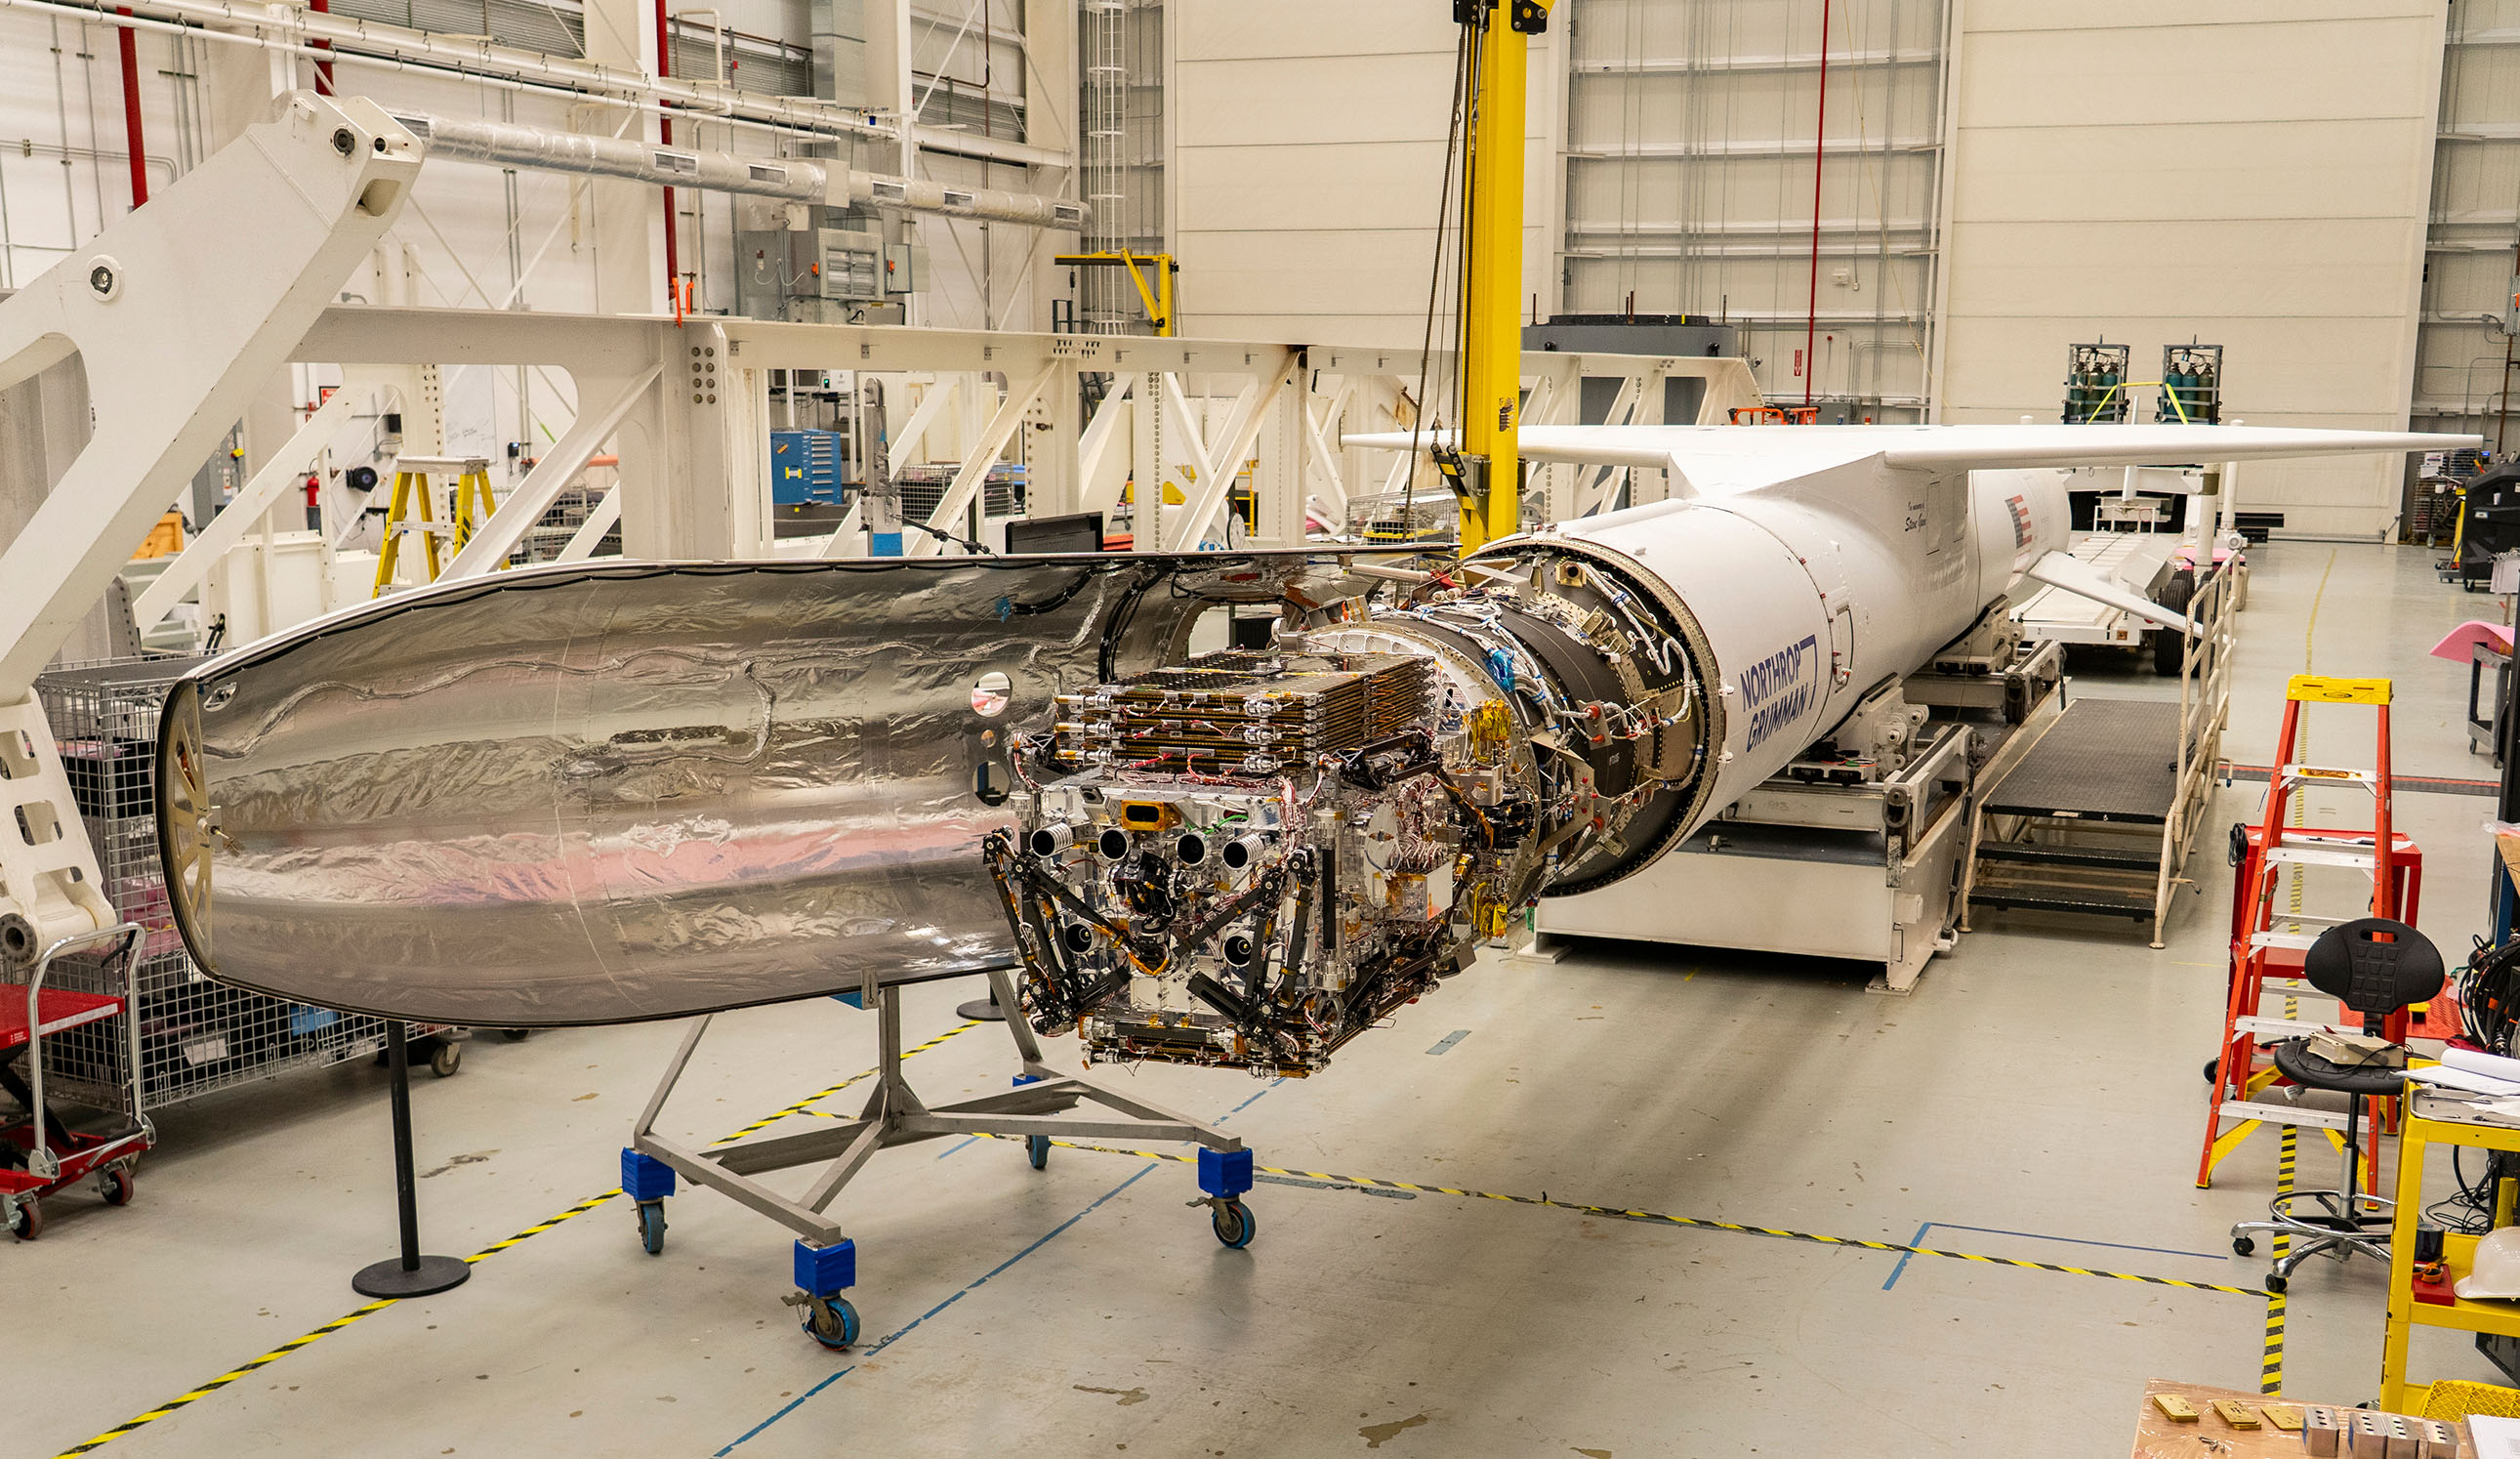
Katalyst Space’s LINK robotic servicing satellite awaits encapsulation inside a Northrop Grumman Pegasus XL on June 8, 2026, at NASA’s Wallops Flight Facility in Virginia. The rocket will carry LINK to space for an attempted orbital boost of NASA’s Neil Gehrels Swift Observatory.
Credit: NASA/Ron Beard
NASA will host an audio-only media teleconference at 11 a.m. EDT, Wednesday, June 17, to preview the Katalyst Space mission to boost the orbit of NASA’s Neil Gehrels Swift Observatory.
Katalyst’s robotic servicing spacecraft, called LINK, will attempt to rendezvous with Swift and raise its altitude, extending its science mission lifespan and advancing a key capability for the future of space exploration. The LINK spacecraft will launch on Northrop Grumman’s Pegasus XL rocket later this month from Kwajalein Atoll in the Marshall Islands.
Media interested in participating by phone must RSVP no later than two hours before the start of the call to Amy Barra at: amy.l.barra@nasa.gov. NASA’s media accreditation policy is available online.
Audio of the media teleconference will stream on the agency’s website at:
The Swift mission, which launched in 2004, leads NASA’s fleet of telescopes in studying changes in the high-energy universe, like gamma-ray bursts, which are the most powerful explosions in the cosmos. When a rapid, sudden event takes place in the sky, Swift serves as a “dispatcher,” providing critical information that allows other “first responder” missions to follow up to learn more about how the universe works.
After 21 years, Swift’s low Earth orbit has begun to rapidly decay because of increased solar activity. Rather than allowing the observatory to re-enter Earth’s atmosphere, as many missions do at the end of their lifetimes, NASA is using this opportunity to advance U.S. spacecraft servicing technology. In September 2025, NASA awarded a contract to Katalyst to mount a robotic servicing mission for Swift in less than a year. The mission will use LINK to rendezvous with Swift and boost it to a higher altitude, demonstrating a key capability for the future of space exploration. The mission is targeted for launch in June from Kwajalein Atoll, Marshall Islands.
Learn more about the mission to boost Swift’s orbit at:
Transforming NASA’s trusted Earth science into powerful business intelligence
Earth Science Private Sector Engagement
NASA Earth science data, tools, and expertise drive economic innovation by providing industry with trusted insights to accurately forecast risk, optimize operations, and advance next-generation business solutions. By connecting, informing, and partnering with businesses, NASA’s Private Sector Engagement Office unlocks new opportunities to reinforce the use of Earth observations in existing markets and broaden adoption across emerging industry sectors, empowering organizations to build powerful and resilient solutions for the future.
INNOVATE is NASA’s innovation funding program designed to accelerate the translation of Earth science into real-world applications. Selected teams receive access to NASA funding, data, and expertise to develop solutions that address commercial and societal challenges. This opportunity is open through August 31, 2026.
Investigators & Partners: NASA Goddard Space Flight Center; University of Wisconsin-Milwaukee; University of Colorado; University of Wisconsin-Madison; University of Connecticut; Swiss Re; Munich Re; Eversource
An AI-powered flood intelligence platform that combines NASA Earth observations with advanced modeling to deliver real-time flood forecasts and impact assessments, including Federal Emergency Management Agency and NOAA end users.
Designed with insurers and utilities to improve disaster response, risk management, and resilience.
Operational Risk Forecasting for AI Infrastructure
Investigators & Partners: NASA Goddard Space Flight Center; Universities Space Research Association; Meta; Uptime Institute; Open-IX
A first-of-its-kind system that uses NASA Earth observations to forecast operational risks to data centers, power systems, and water resources up to 14 days in advance.
Helps critical infrastructure operators anticipate disruptions before they occur.
Fire & Risk Modeling for Property Insurance
Investigators & Partners: National Science Foundation; National Center for Atmospheric Research; Mercury Insurance
A next-generation wildfire risk platform combining NASA Earth science, physics-based modeling, and AI to improve insurance underwriting and community resilience.
Developed with industry partners to better understand and manage growing wildfire risks.
Next-Generation Food Security Early Warning System
Investigators & Partners: Space Science Institute; Chapman University; World Food Program; Microinsurance Catastrophe Risk Organization
An advanced agricultural monitoring system that uses NASA Earth observations to detect food security risks months before traditional warning systems.
Supports insurers, humanitarian organizations, and agribusinesses with earlier, more actionable insights.
AI-Powered Wildfire Risk Intelligence for Utilities
Investigators & Partners: NASA Jet Propulsion Laboratory; OpalAI; Pacific Gas & Electric; Los Angeles Department of Water & Power
An AI-enabled wildfire intelligence platform that helps utilities identify asset-level wildfire risks and improve operational decision-making.
Designed to reduce outages, strengthen grid resilience, and protect communities.
Early Warning & Transparency for Forest Supply Chains
Investigators & Partners: NASA Goddard Space Flight Center; University of Maryland; Science Systems and Applications Inc.; Chainparency
A NASA-enabled monitoring and forecasting platform that helps forestry and wood-product industries track forest health, detect emerging risks, and improve supply chain transparency.
Supports more resilient and sustainable forest management at scale.
How NASA Helps Industry
How NASA supports agribusiness
Every day, farmers, food companies, and agricultural producers rely on timely, trusted information to manage their crops, land, water, and supply chains. NASA develops technology and missions to observe agricultural landscapes from space, informing optimal time and location for planting, monitoring of plant growth, best times for harvest, and market readiness assessments. U.S. and international partners use this information to support food security, stabilize markets, and strengthen productive farming.
From space, NASA tracks soil moisture, groundwater, crop condition, water use, heat stress, precipitation, and land change, while also supporting field-level tools and trusted partnerships with producers and agricultural organizations. By transforming satellite data into practical insights, NASA helps agribusiness to anticipate challenges, improve productivity, manage vital resources, and safeguard food systems.
The NISAR (NASA-ISRO Synthetic Aperture Radar) satellite captured an image of northeastern North Dakota on Aug. 23, 2025. The darker agricultural plots are plowed and unplanted fields, while the lighter colors represent the presence of pasture or crops. Circular patterns indicate the use of center-pivot irrigation.
NASA JPL
How NASA helps energy & utility companies
Energy providers, utilities, and infrastructure operators need trusted Earth information to plan for demand, protect assets, and keep essential services reliable. NASA Earth science supports decisions related to solar and meteorological resources, extreme heat, wildfire, air quality, flooding, drought, and land movement.
The Prediction Of Worldwide Energy Resources (POWER) project provides solar and meteorological data used by energy, building, and infrastructure communities. NASA Earth insights also help utility companies understand risks to grids, water systems, pipelines, and other critical assets and the Agency engages with partners such as the Center for Weather Innovation, Smart Energy and Resilience to advance Earth observation capabilities for the energy sector. Through data, training, stakeholder engagement, and partnerships, NASA equips energy and utility leaders with trusted information to strengthen resilience and support reliable operations.
This Black Marble data visualization shows how nighttime light changed year over year between 2014 and 2022 around the globe. Derived from satellite imagery taken daily over the past decade, golden areas featured brightening, purple areas featured dimming, and white areas experienced both kinds of changes.
NASA Scientific Visualization Studio
How NASA supports insurance & reinsurance
Insurance and reinsurance organizations depend on trusted information to understand hazards, price risk, support claims, and plan for changing risk exposure. NASA Earth science provides observations, models, and long-term records that help characterize events such as wildfire, flood, heat, drought, storms, land change, and infrastructure impacts.
NASA is engaging with the insurance and reinsurance community to better understand where Earth observations can support underwriting, catastrophe modeling, parametric products, claims response, and resilience planning. By participating in pre-competitive industry coalitions like the Center for Innovation in Risk, Catastrophes, and Decisions, as well as sector trainings and industry engagement, NASA helps insurers and reinsurers connect trusted Earth science with the decisions that shape risk, affordability, and recovery.
After unleashing dozens of destructive tornadoes, a slow-moving storm system dumped heavy rain across the U.S. Midwest and Southeast in early April 2025. A break in the clouds on April 7, 2025, revealed widespread flooding, shown in this image acquired by the Visible Infrared Imaging Radiometer Suite on the NOAA-21 satellite.
NASA Earth Observatory
How NASA helps the finance sector
Financial institutions, investors, and analysts need reliable information to understand physical risk, market exposure, and long-term change. NASA Earth science provides trusted data and models that help organizations to assess risk across assets, portfolios, and supply chains, including wildfire, heat, flood, land change, and infrastructure impacts.
NASA’s engagement with the finance sector focuses on helping users move from awareness to application, identifying relevant datasets, understanding uncertainty, and connecting Earth observations to real business decisions. Through training, collaborative sessions, and sector partnerships, NASA is working to make Earth science more accessible to financial decision-makers seeking trusted, science-based insights.
This screen capture from FIRMS shows Landsat active fire imagery of the Double Creek Fire in Oregon on September 10, 2022. The Landsat Active Fire and Thermal Anomalies product is generated from the Landsat Operational Land Imager (OLI).
NASA LANCE
How NASA helps mining and exploration
Mining and exploration companies rely on trusted geoscience information to understand landscapes, manage risk, and make decisions across the mineral resource life cycle. NASA Earth science observations can support characterization of terrain, land cover, water resources, surface change, environmental conditions, operational risks, and long-term landscape dynamics.
NASA is engaging with the mining and exploration community to better connect Earth observations with industry needs, from early exploration and resource assessment to operations, closure, and reclamation. Through participation in pre-competitive industry efforts such as the Center to Advance the Science of Exploration to Reclamation in Mining, as well as broader technical exchange and stakeholder engagement, NASA helps bring trusted data, models, and Earth system science into decisions that support responsible resource development.
Various minerals are revealed in vibrant detail in this sample mineral map of Cuprite, Nevada, following processing of imaging spectrometer data.
USGS
FEbruary 2026
Industry Summit Report
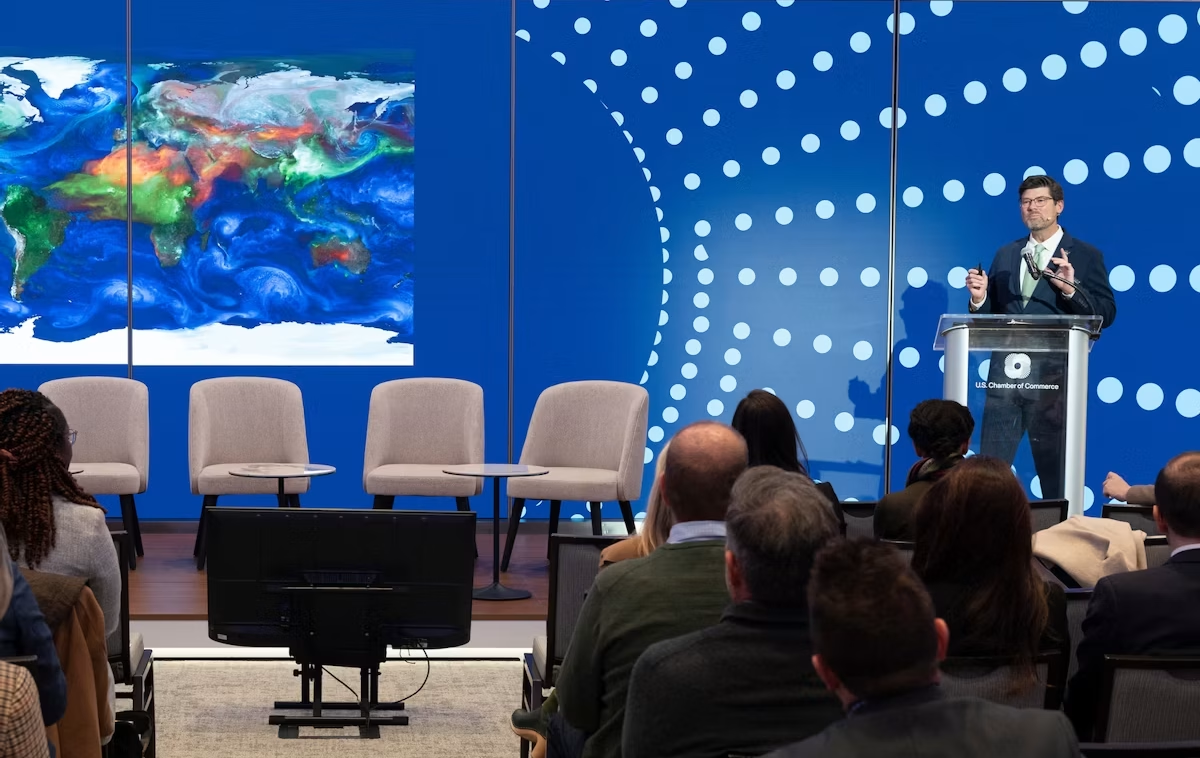
The NASA Earth Science Industry Summit, hosted by the U.S. Chamber of Commerce on February 2, 2026, served as a strategic forum to explore how NASA’s Earth Science enterprise contributes to the engines of the American economy and how public and private sectors can work together to unlock greater opportunities in Earth observation.
Explore the summary report for key reflections and takeaways, representing the perspectives of more than 180 participants across finance, insurance, agriculture, energy, utilities, and more.
Earthdata is your gateway to find, access, visualize, and download NASA Earth science data. Browse the data catalog, search by topic, discover learning resources including tutorials and trainings, and more.
NASA's Applied Remote Sensing Training Program (ARSET) teaches users how to use remote sensing data for a range of applications. ARSET trainings are available for all levels of experience at no cost, both in person and online.
The Fire Information for Resource Management System (FIRMS) tracks active fires and hotspots worldwide to support response, risk monitoring, and operational awareness.
Flood Water Monitoring
NASA’s Land, Atmosphere Near real-time Capability for Earth observation (LANCE) provides near real-time flood products, showing flooding and surface water changes to support exposure, claims, and resilience planning.
Economic & Human Activity
Night-time lights, visible with NASA’s Black Marble products, are used to monitor economic indicators, human activity, outages, infrastructure disruptions, and disaster recovery.
Heat & Temperature Insights
The ECOsystem Spaceborne Thermal Radiometer Experiment on Space Station (ECOSTRESS) instrument detects surface heat, crop water stress, urban heat, and thermal conditions affecting assets and operations.
Land Surface Change & Risk
The OPERA Surface Displacement (DISP) product suite identifies land surface movement from processes such as sinkholes, earthquakes, and landslides, supporting risk assessment for infrastructure and critical assets.
Long-Term Risk Projection
NASA Earth eXchange Global Daily Downscaled Projections (NEX-GDDP) provides historical baselines and future climate scenarios for asset, portfolio, and resilience planning.
Partnerships & Collaboration
NASA offers 60 years of experience in advanced engineering and testing capabilities, cutting edge research and technology development, as well as unique assets such as land, facilities and laboratories for use by commercial industries, academic institutions, U.S. government agencies and international entities.
Partnerships Front Door
Discover how NASA works with industry, academic, and non-profit partners to advance mutual goals through through strategic, non-procurement partnerships.
Eligible organizations that incorporate NASA data into their products, services, or research can gain significant value by displaying the NASA Data Insignia.
A compact, multifrequency radar built by a team at NASA’s Jet Propulsion Laboratory will make it easier to collect information about dynamic cloud systems. Called CloudCube, this new instrument simultaneously probes the atmosphere with three radar signals, spanning 36 to 240 GHz, for optimized sensitivity to a wide range of water droplet and ice particle sizes.
Figure 1: A prototype of CloudCube’s G-band channel was installed at Cape Grim, Tasmania, as a guest instrument for the Department of Energy’s Cloud and Precipitation Experiment at Kennaook (CAPE-K)
Credit: Raquel Rodriguez Monje / JPL
Built with funding from NASA’s Earth Science Technology Office Instrument Incubator Program, CloudCube transmits and receives Ka-, W-, and G-band signals, making it the first compact radar system capable of simultaneously probing meteorological targets at wavelengths spanning approximately one to ten millimeters. Researchers will be able to combine information from the three signals to learn more about the initiation and evolution of precipitation, as well as cloud microphysics and radiative properties.
“We’re making a low-power, low-mass instrument to facilitate new cost-efficient missions for atmospheric observations. Building a multi-frequency radar, especially at G-band, is very novel,” said Raquel Rodriguez Monje, a systems engineer at JPL and principal investigator for CloudCube.
Each of CloudCube’s three signals observes a different element of cloud physics. Ka-band radar signals are ideal for collecting precipitation profiles; W-band radar signals are preferred for measuring cloud particles that give rise to precipitation; and G-band radar signals, which have never been collected from a space-based instrument, are ideal for measuring ice and liquid water content inside very light clouds (a paper describing this measurement can be found here).
Probing the atmosphere simultaneously with three signals allows researchers to collect data on all these cloud features at once, which is valuable for improving weather forecasts and especially climate modeling. CloudCube leverages innovations in millimeter-wave hardware to pack three radar modules–one for each signal–within a single compact system.
Figure 2. A photo of the radar electronics for CloudCube’s compact G-band radar. Producing G-band radar signals requires a large amount of energy, and CloudCube is one of the first instruments to produce those signals effectively from a compact platform.
Credit: Raquel Rodriguez Monje / NASA JPL
One CloudCube innovation concerns the specialized components required to transmit G-band power from a compact, low-power instrument. The detection of cloud signals requires high transmit power, which CloudCube achieves by combining the outputs of multiple high-efficiency frequency-multiplication devices that allow the instrument to generate hundreds of milliWatts at 240 GHz. Another innovation of CloudCube is that it was designed to use as few radio frequency components as possible to reduce its mass and power consumption, which could lower the cost of future Earth-observing orbital instruments.
Flying an instrument equipped with G-band radar in space will be a new capability and will allow researchers to achieve greater spatial resolution and sensitivity in the study of cloud microphysical processes.
“Basically, we’re weighing clouds using these combinations of frequencies in a way that we couldn’t do before we had the G-band,” said Matt Lebsock, a researcher at JPL and co-investigator for CloudCube.
The instrument has been tested in the field. A ground-based prototype of CloudCube’s G-band channel operated continuously for 11 months during the Department of Energy’s Cloud and Precipitation Experiment at Kennaook (CAPE-K) campaign. CloudCube also participated in the Eastern Pacific Cloud Aerosol Precipitation Experiment, a ground campaign sponsored by the Department of Energy. A paper describing the results of that experiment can be foundhere.
Most recently, CloudCube successfully operated all three frequency bands from NASA’s Gulfstream III aircraft and collected its first airborne observations of snowfall as part of the North American Upstream Feature-Resolving and Tropopause Uncertainty Reconnaissance Experiment campaign—a NASA-funded campaign designed to improve forecasts of high-impact winter weather. The CloudCube team is currently calibrating and processing the data for public release.
For additional details, see the entry for this project onNASA TechPort.
GLOBE Mission Earth Educators Participate in Land Cover Community of Practice
During the 2025-2026 school year, educators from the NASA Science Activation Program’s GLOBE (Global Learning and Observation to Benefit the Environment) Mission Earth projectparticipated in a specialized Community of Practice led by NASA Langley Research Center to refine how students interact with NASA’s land cover data (MODIS, Landsat, and Sentinel-2). Their collaboration focused on four key areas:
Data Collection: Improving the process of making and submitting land cover observations to NASA using the GLOBE Observer App.
Curriculum Integration: Identifying connections between land cover observations, satellite data, and classroom learning.
Student Research: Brainstorming potential land cover research topics/questions for students.
Validation: Providing expert feedback on the satellite comparison process.
Through GLOBE, communities can contribute meaningful environmental data to a long-term data record. When participants make observations of land cover via GLOBE Observer, the team at NASA Langley compares their observation with satellite data for a similar time and location and sends a satellite comparison email, which includes a data table that shows how their GLOBE observation and the corresponding satellite data compare.
Key Community of Practice Findings: The Community of Practice included a total of 14 educators, with six actively collecting land cover observations with their students using the GLOBE Observer app. These land cover observations were collocated to MODIS, Landsat, and Sentinel-2 data with educators receiving a satellite comparison email.
Within the scope of this Community of Practice, 10 of the educators developed student research plans for the 2026-2027 school year focused on land cover data, addressing questions such as:
How does land cover affect surface temperature?
How has land use changed over time for our local area?
How does land cover differ for locations (such as other schools) at the same latitude but different longitudes?
How do different land covers impact flooding?
The educators were extremely excited to have the opportunity to interact and learn from each other as a community, as well as to connect with NASA subject matter experts. Based on lessons learned from the Community of Practice, the team has a better understanding of how NASA land cover data can be incorporated in the classroom, what types of research questions educators might present to their students, and resources that could be developed to assist educators in the implementation of their research plans.
Within the scope of the Land Cover Community of Practice (COP), educators were asked to provide feedback for the GLOBE Mission Earth GLOBE Nature Notes Guide that was developed by the NASA Langley team, leveraging the Nature Note model created by the NASA Science Activation program’s Learning Ecosystems North East (LENE) project, which is led by the Gulf of Maine Research Institute. The GLOBE Nature Notes aligned with GLOBE protocols were developed to assist educators in integrating the Nature Notes process with their students’ GLOBE observations. One of the COP educators is currently developing an example of a land cover GLOBE Nature Note that will be shared with the GLOBE and NASA Science Activation community, once completed.
Educators can join the GLOBE Program and contribute observations of Land Cover and other environmental conditions by downloading the GLOBE Observer app and learning more about Land Cover.
Sample of a NASA GLOBE Observer satellite comparison table that gets emailed to a participant after submitting a land cover observation. (NASA Langley GLOBE Mission Earth Science Activation project team).
NASA GLOBE Observer
GLOBE Mission Earth is supported by NASA under cooperative agreement award number NNX16AC54A and is part of NASA’s Science Activation Portfolio. Learn more about how Science Activation connects NASA science experts, real content, and experiences with community leaders to do science in ways that activate minds and promote deeper understanding of our world and beyond: https://science.nasa.gov/learn/about-science-activation/.
A compact, multifrequency radar built by a team at NASA’s Jet Propulsion Laboratory will make it easier to collect information about dynamic cloud systems. Called CloudCube, this new instrument simultaneously probes the atmosphere with three radar signals, spanning 36 to 240 GHz, for optimized sensitivity to a wide range of water droplet and ice particle sizes.
Figure 1: A prototype of CloudCube’s G-band channel was installed at Cape Grim, Tasmania, as a guest instrument for the Department of Energy’s Cloud and Precipitation Experiment at Kennaook (CAPE-K)
Credit: Raquel Rodriguez Monje / JPL
Built with funding from NASA’s Earth Science Technology Office Instrument Incubator Program, CloudCube transmits and receives Ka-, W-, and G-band signals, making it the first compact radar system capable of simultaneously probing meteorological targets at wavelengths spanning approximately one to ten millimeters. Researchers will be able to combine information from the three signals to learn more about the initiation and evolution of precipitation, as well as cloud microphysics and radiative properties.
“We’re making a low-power, low-mass instrument to facilitate new cost-efficient missions for atmospheric observations. Building a multi-frequency radar, especially at G-band, is very novel,” said Raquel Rodriguez Monje, a systems engineer at JPL and principal investigator for CloudCube.
Each of CloudCube’s three signals observes a different element of cloud physics. Ka-band radar signals are ideal for collecting precipitation profiles; W-band radar signals are preferred for measuring cloud particles that give rise to precipitation; and G-band radar signals, which have never been collected from a space-based instrument, are ideal for measuring ice and liquid water content inside very light clouds (a paper describing this measurement can be found here).
Probing the atmosphere simultaneously with three signals allows researchers to collect data on all these cloud features at once, which is valuable for improving weather forecasts and especially climate modeling. CloudCube leverages innovations in millimeter-wave hardware to pack three radar modules–one for each signal–within a single compact system.
Figure 2. A photo of the radar electronics for CloudCube’s compact G-band radar. Producing G-band radar signals requires a large amount of energy, and CloudCube is one of the first instruments to produce those signals effectively from a compact platform.
Credit: Raquel Rodriguez Monje / NASA JPL
One CloudCube innovation concerns the specialized components required to transmit G-band power from a compact, low-power instrument. The detection of cloud signals requires high transmit power, which CloudCube achieves by combining the outputs of multiple high-efficiency frequency-multiplication devices that allow the instrument to generate hundreds of milliWatts at 240 GHz. Another innovation of CloudCube is that it was designed to use as few radio frequency components as possible to reduce its mass and power consumption, which could lower the cost of future Earth-observing orbital instruments.
Flying an instrument equipped with G-band radar in space will be a new capability and will allow researchers to achieve greater spatial resolution and sensitivity in the study of cloud microphysical processes.
“Basically, we’re weighing clouds using these combinations of frequencies in a way that we couldn’t do before we had the G-band,” said Matt Lebsock, a researcher at JPL and co-investigator for CloudCube.
The instrument has been tested in the field. A ground-based prototype of CloudCube’s G-band channel operated continuously for 11 months during the Department of Energy’s Cloud and Precipitation Experiment at Kennaook (CAPE-K) campaign. CloudCube also participated in the Eastern Pacific Cloud Aerosol Precipitation Experiment, a ground campaign sponsored by the Department of Energy. A paper describing the results of that experiment can be foundhere.
Most recently, CloudCube successfully operated all three frequency bands from NASA’s Gulfstream III aircraft and collected its first airborne observations of snowfall as part of the North American Upstream Feature-Resolving and Tropopause Uncertainty Reconnaissance Experiment campaign—a NASA-funded campaign designed to improve forecasts of high-impact winter weather. The CloudCube team is currently calibrating and processing the data for public release.
For additional details, see the entry for this project onNASA TechPort.
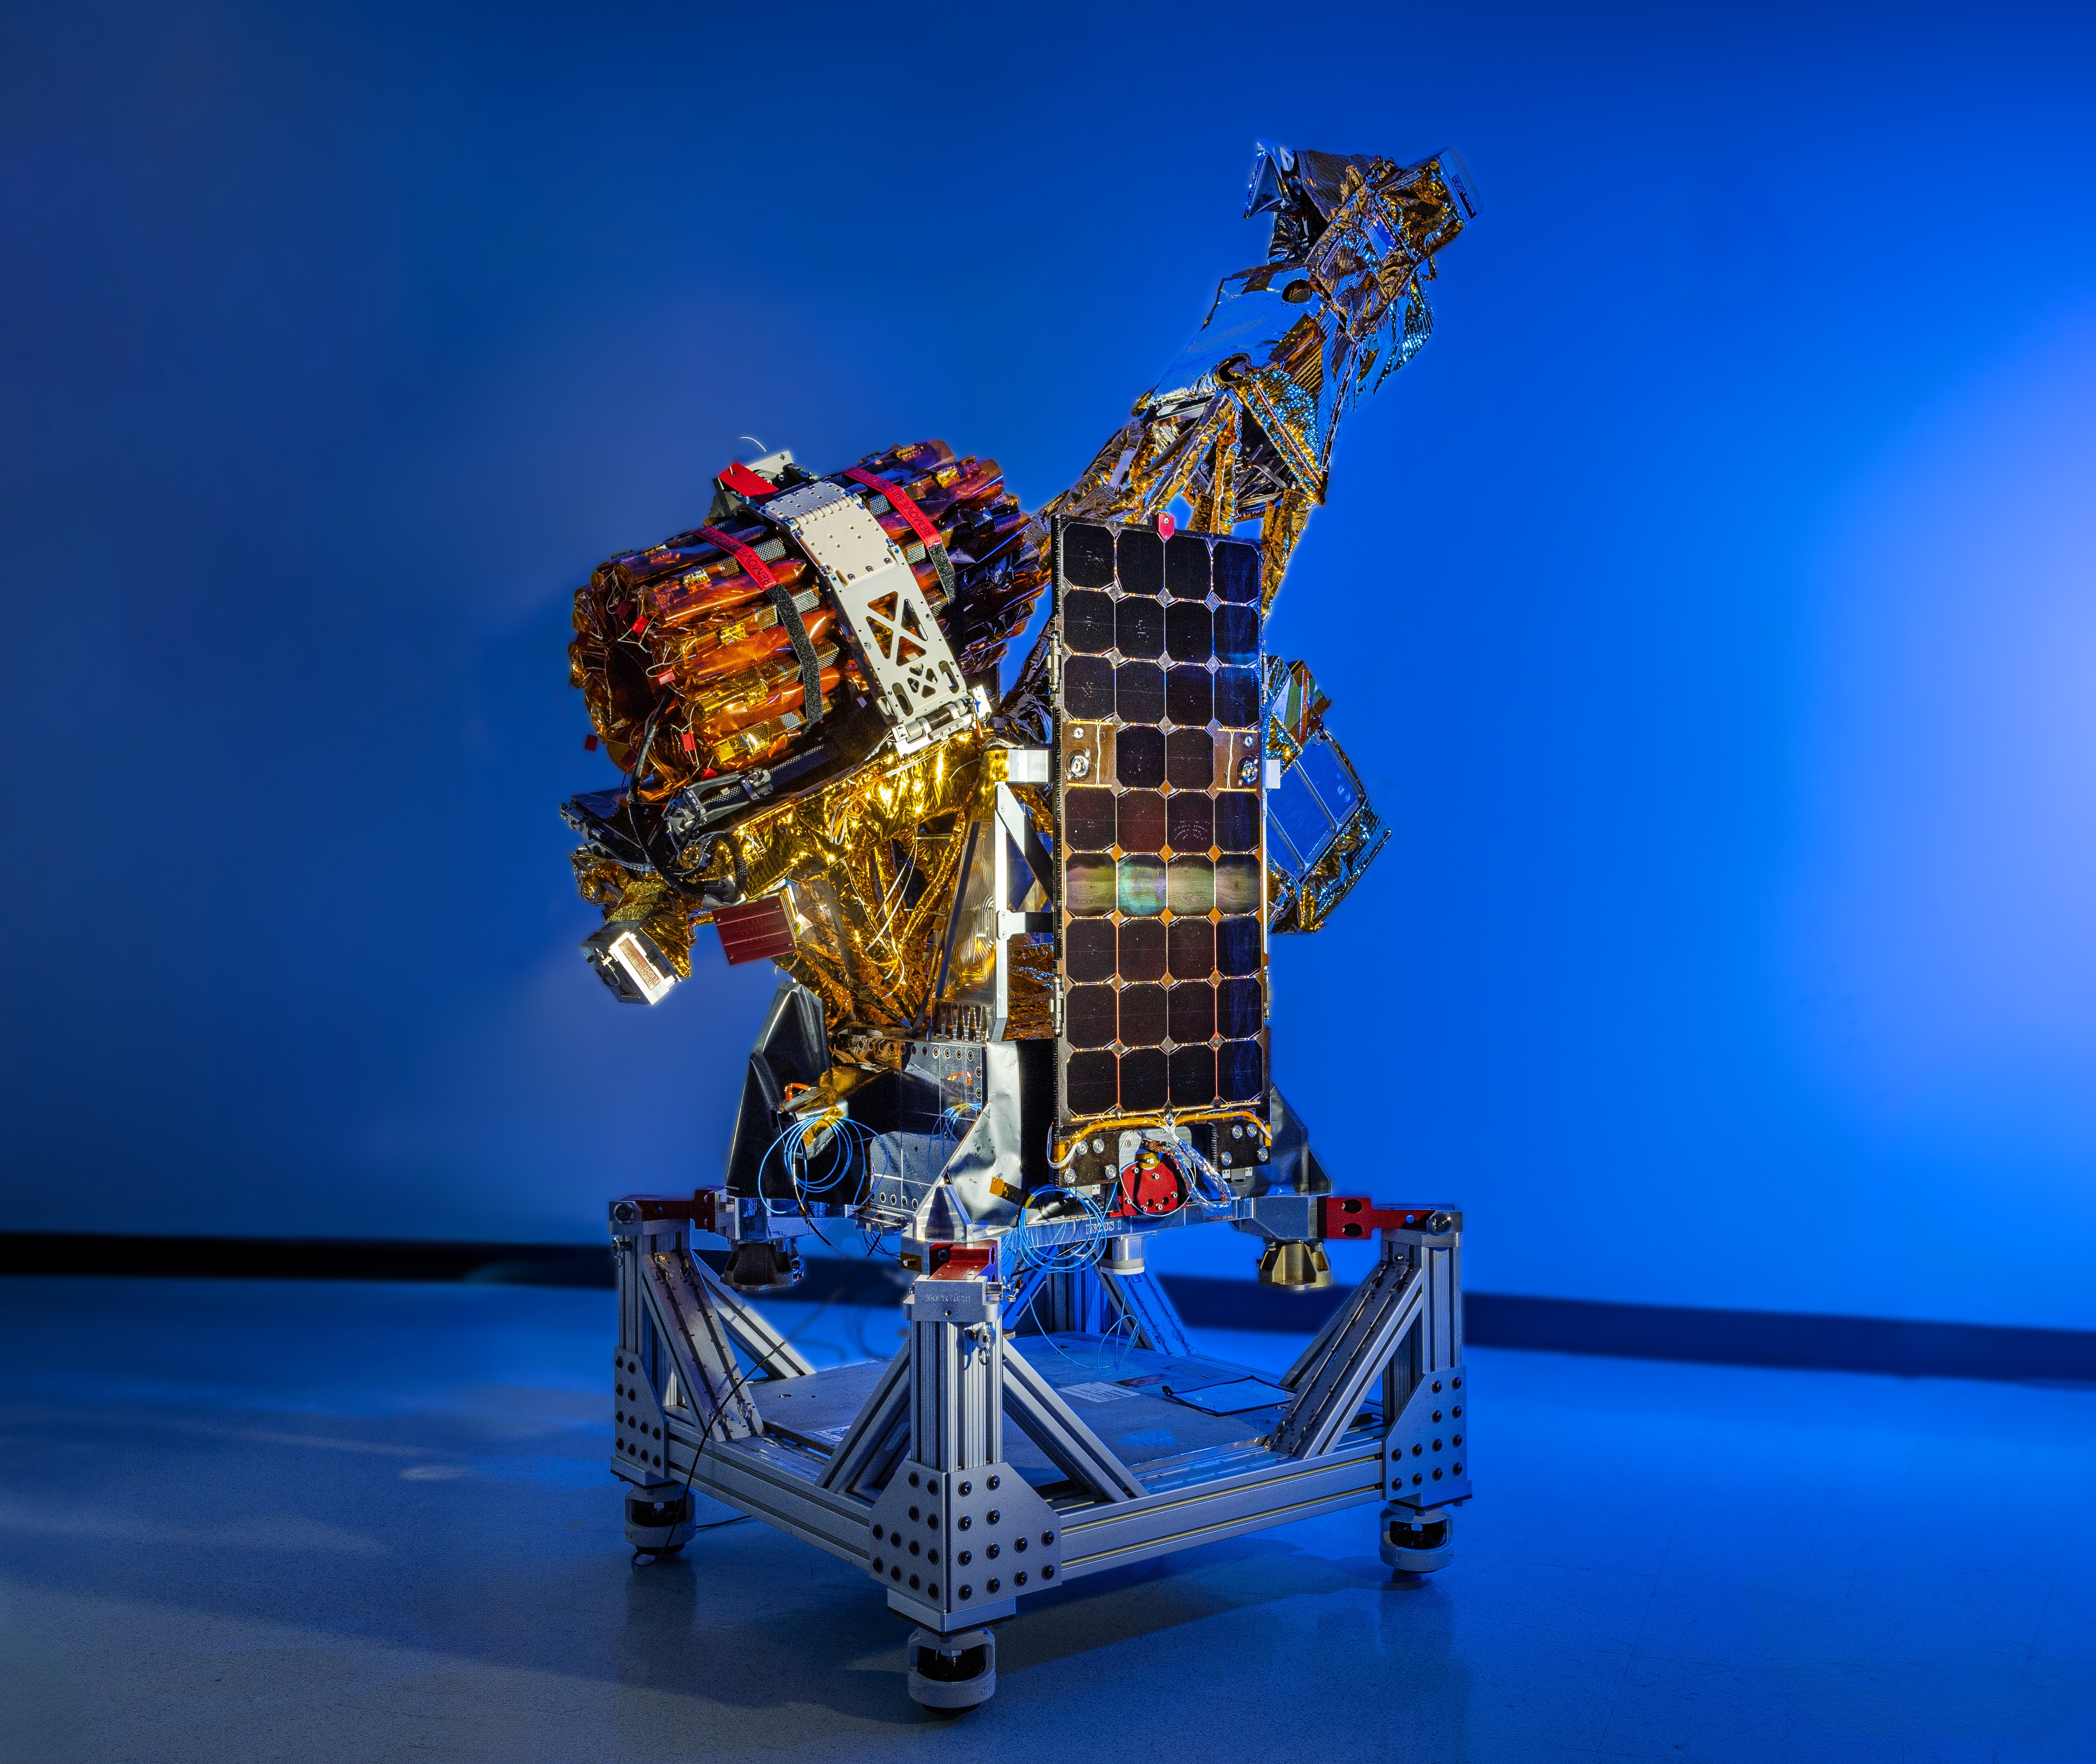
Two of the three SmallSats for NASA’s INCUS mission, including the one shown here, have completed assembly and testing in preparation for shipment to NASA’s Wallops Flight Facility in Virginia for a 2027 launch. From low Earth orbit the satellites will observe the dynamics of tropical convective storms.
Blue Canyon Technologies
Teams working on NASA’s INCUS (Investigation of Convective Updrafts) mission, the first space-based survey of the dynamics of tropical convective storms, have completed assembly and tested two of the mission’s small satellites, or SmallSats. Testing continues on the third SmallSat and is scheduled for completion no earlier than September in advance of a 2027 launch.
The three satellites will fly in tight coordination in low Earth orbit, with the first and second satellites separated by 30 seconds and the second and third satellite by 90 seconds.
Characterized by the sudden and intense lifting of large amounts of air and water, tropical convective storms provide more than half of the world’s precipitation, a crucial source of life-supporting fresh water. But they also produce severe weather, which can increase risks to life and property. The INCUS mission will help improve understanding of where, when, and why convective storms form.
Led by principal investigator Sue van den Heever of Colorado State University in Fort Collins, INCUS will use spaceborne radar instruments developed at NASA’s Jet Propulsion Laboratory in Southern California to observe the vertical motion of air and water, known as convective mass flux, as storms develop and evolve. The mission will also explore how environmental factors such as air temperature, humidity, pressure, wind speed, and wind direction correlate with that movement.
These insights will improve storm forecasting, potentially mitigating loss of life and property damage in affected communities, by helping decision-makers plan for and respond to severe weather events and manage freshwater supplies.
Teams at NASA JPL built each INCUS satellite’s radar, which were combined with a deployable mesh radar reflector made by Tendeg in Louisville, Colorado. The middle satellite also carries a microwave radiometer, also made at NASA JPL, that provides spatial context to the vertical precipitation profiles provided by the radars.
The three assemblies shipped in late 2025 and early 2026 to Blue Canyon Technologies in Lafayette, Colorado, where they were integrated with Blue Canyon’s spacecraft buses. The first two satellites, also called observatories, have successfully undergone vibration and thermal vacuum testing to ensure they will be able to withstand the jostling of launch and the extreme temperatures of space.
These two observatories also shipped to Tendeg, where teams successfully performed test deployments of the reflectors. Then they returned to Blue Canyon for additional testing. They’ll remain in storage before heading out next year to the launch site at NASA’s Wallops Flight Facility in Virginia.
Funded through the Earth Venture Mission-3 acquisition under NASA’s Earth System Science Pathfinder Program, INCUS is one of several missions fulfilling the clouds, convection, and precipitation requirements of NASA’s Earth System Observatory, a series of interconnected missions set to study our home planet’s dynamic natural systems and how they interact. The mission is also part of FALCON (Fleet for the Atmosphere Linking Commercial Observations with NASA), a fleet of atmosphere-observing satellites that will combine hardware contributions from NASA centers, universities, and commercial partners.
 Login