❌

Normal view

Astronomers Finally Find Milky Way’s Missing Black Hole Wind

8 June 2026 at 18:42
This image shows the evidence for the wind blowing away from Sagittarius A*: the white dot in the center of the image shows the supermassive black hole; in orange is data from ALMA, mapping the location of cold gas composed of carbon monoxide in the image; in blue is X-ray data from Chandra; a large cone-shaped cavity, visible as an absence of cold gas in the ALMA data, is filled by hot X-ray-emitting gas in the Chandra data. Image credit: NASA / CXC / UMass / Wang et al. / ALMA / ESO / NAOJ / NRAO / Longmore et al. / Minniti et al.

After a 50-year search, astronomers have uncovered evidence that Sagittarius A* -- the 4.3-million-solar-mass black hole that resides at the center of our Milky Way Galaxy -- is blowing a hot cosmic wind into its surroundings, carving out a giant cavity near the Galaxy’s heart.

The post Astronomers Finally Find Milky Way’s Missing Black Hole Wind appeared first on Sci.News: Breaking Science News.

Ursa Major III/UNIONS 1: Dwarf Galaxy or Star Cluster?

2 March 2026 at 17:00

Ursa Major III/UNIONS 1

The smallest satellite of the Milky Way, Ursa Major III/UNIONS 1, has posed a mystery since its discovery. Is this smattering of stars a dwarf galaxy or a star cluster?

The Milky Way’s Mysterious Companion

In 2024, researchers discovered a small group of stars orbiting the Milky Way at a distance of about 33,000 light-years in data from the Ultraviolet Near Infrared Optical Northern Survey (UNIONS). This collection of stars amounts to just 16 solar masses and shines with only 11 times the Sun’s luminosity, making it 4–5 times less massive than the next faintest Milky Way satellite.

Considering its small stellar population and small size (its half-light radius is 10 light-years, which is typical for a globular cluster), this satellite appeared at first glance to be an ordinary star cluster. But early data also suggested that the stars had an unusually high velocity dispersion, which could mean that they are nestled within a dense and massive dark matter halo — making the satellite not a star cluster but a dwarf galaxy.

Reflecting this uncertainty, the satellite has two names: Ursa Major III (its dwarf galaxy designation) and UNIONS 1 (its star cluster classification). Can new data clear up the confusion?

New Dispersion Data

In a recent research article, William Cerny (Yale University) and collaborators described new observations of 16 stars in Ursa Major III/UNIONS 1 with the Keck II telescope.

plots of velocity dispersion

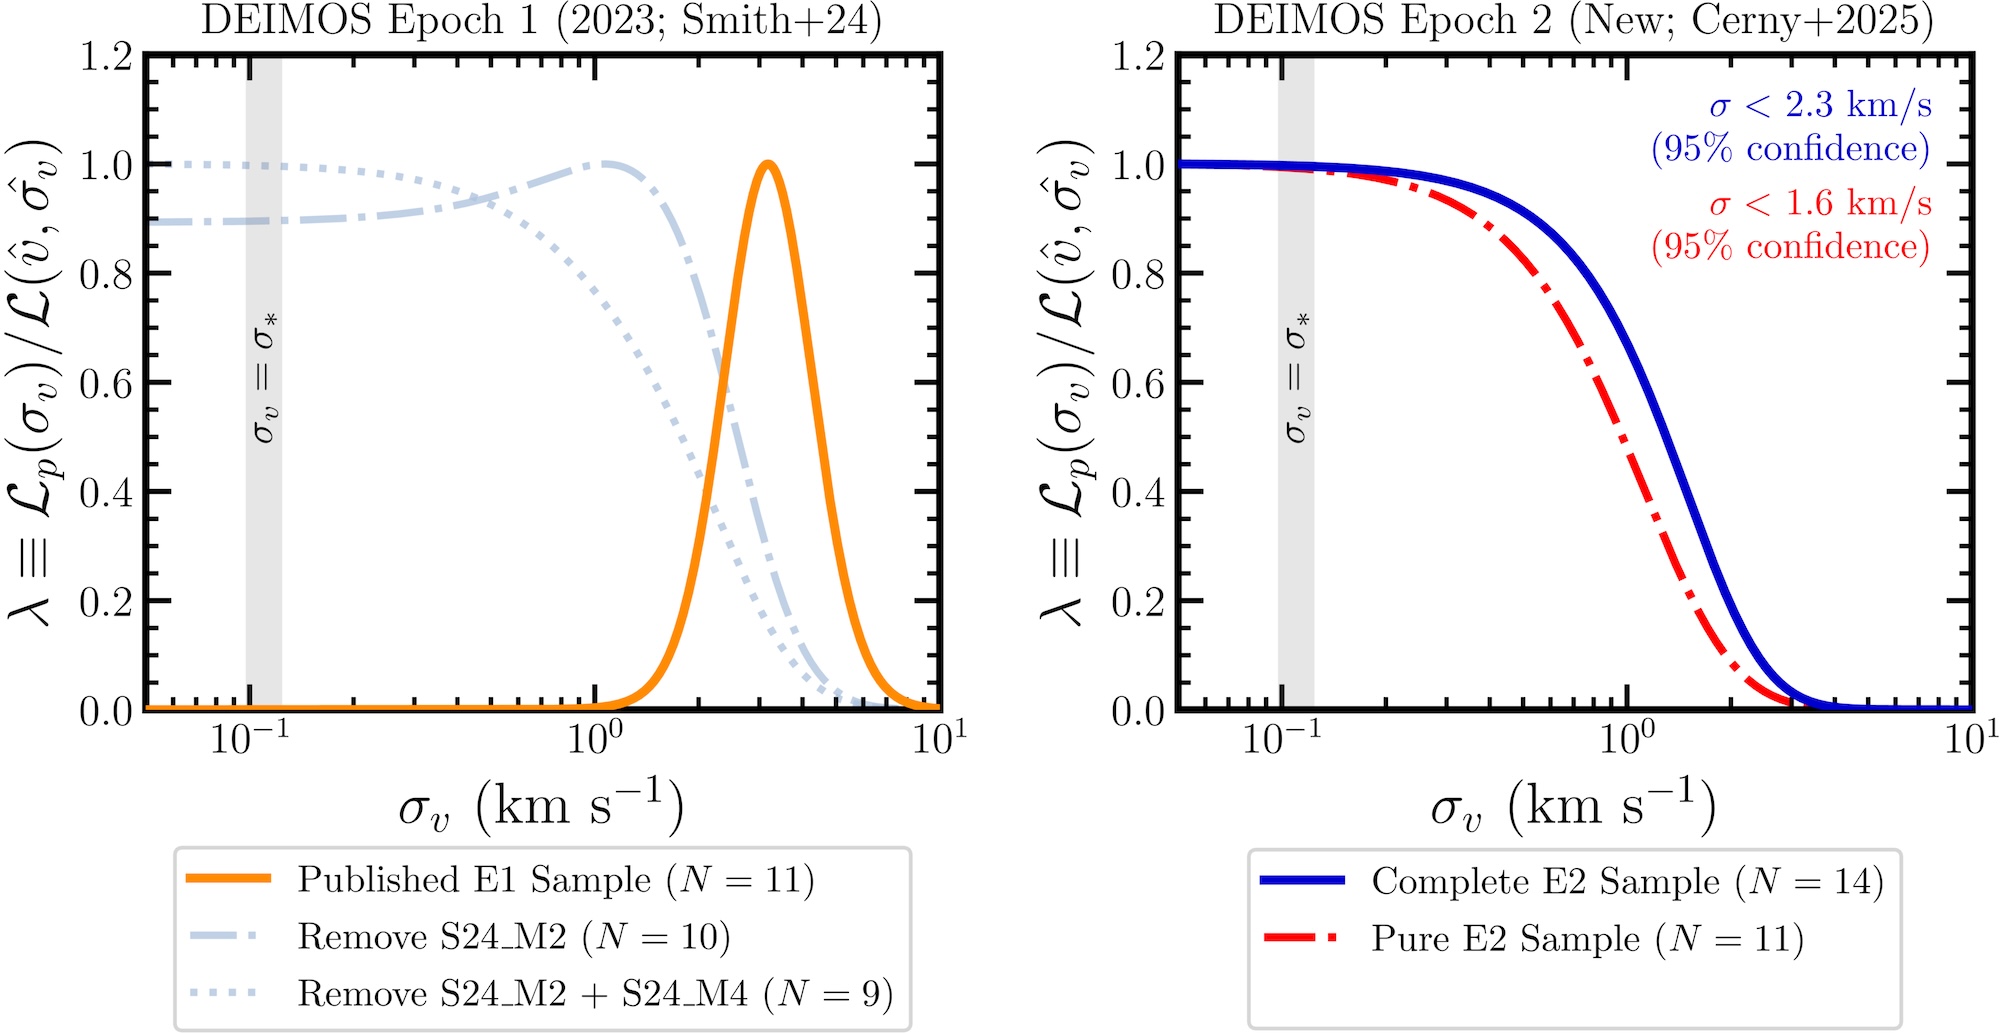
Normalized likelihoods for the velocity dispersion based on the initial data (left) and the new data (right). The initial velocity dispersion measurement of 3.7 km/s is ruled out by the new measurements. Click to enlarge. [Cerny et al. 2026]

Crucially, these measurements enabled a new estimation of the system’s velocity dispersion. In contrast to earlier work that found a high velocity dispersion of 3.7 km/s, the new data favor a value of just 0.1 km/s and rule out values above 2.3 km/s. While these results do not unequivocally preclude the possibility of dark matter, they strongly favor little to no dark matter. This goes against the initial evidence in favor of the dwarf galaxy hypothesis.

These observations also helped to confirm one candidate binary pair and identify three new binary candidates. (This large binary fraction, though interesting, isn’t diagnostic, as both star clusters and dwarf galaxies are known to host high proportions of binary stars.)

Further Evidence

Cerny’s team conducted a further test of the Ursa Major III/UNIONS 1’s identity by measuring the metallicities of its 12 brightest stars. They found that the stars are metal poor and have little metallicity dispersion. This finding again points to a star cluster, in which stars form in a single epoch, rather than a dwarf galaxy, which may feature multiple generations of stars with different degrees of chemical enrichment.

metallicity dispersion vs velocity dispersion for faint Milky Way satellites

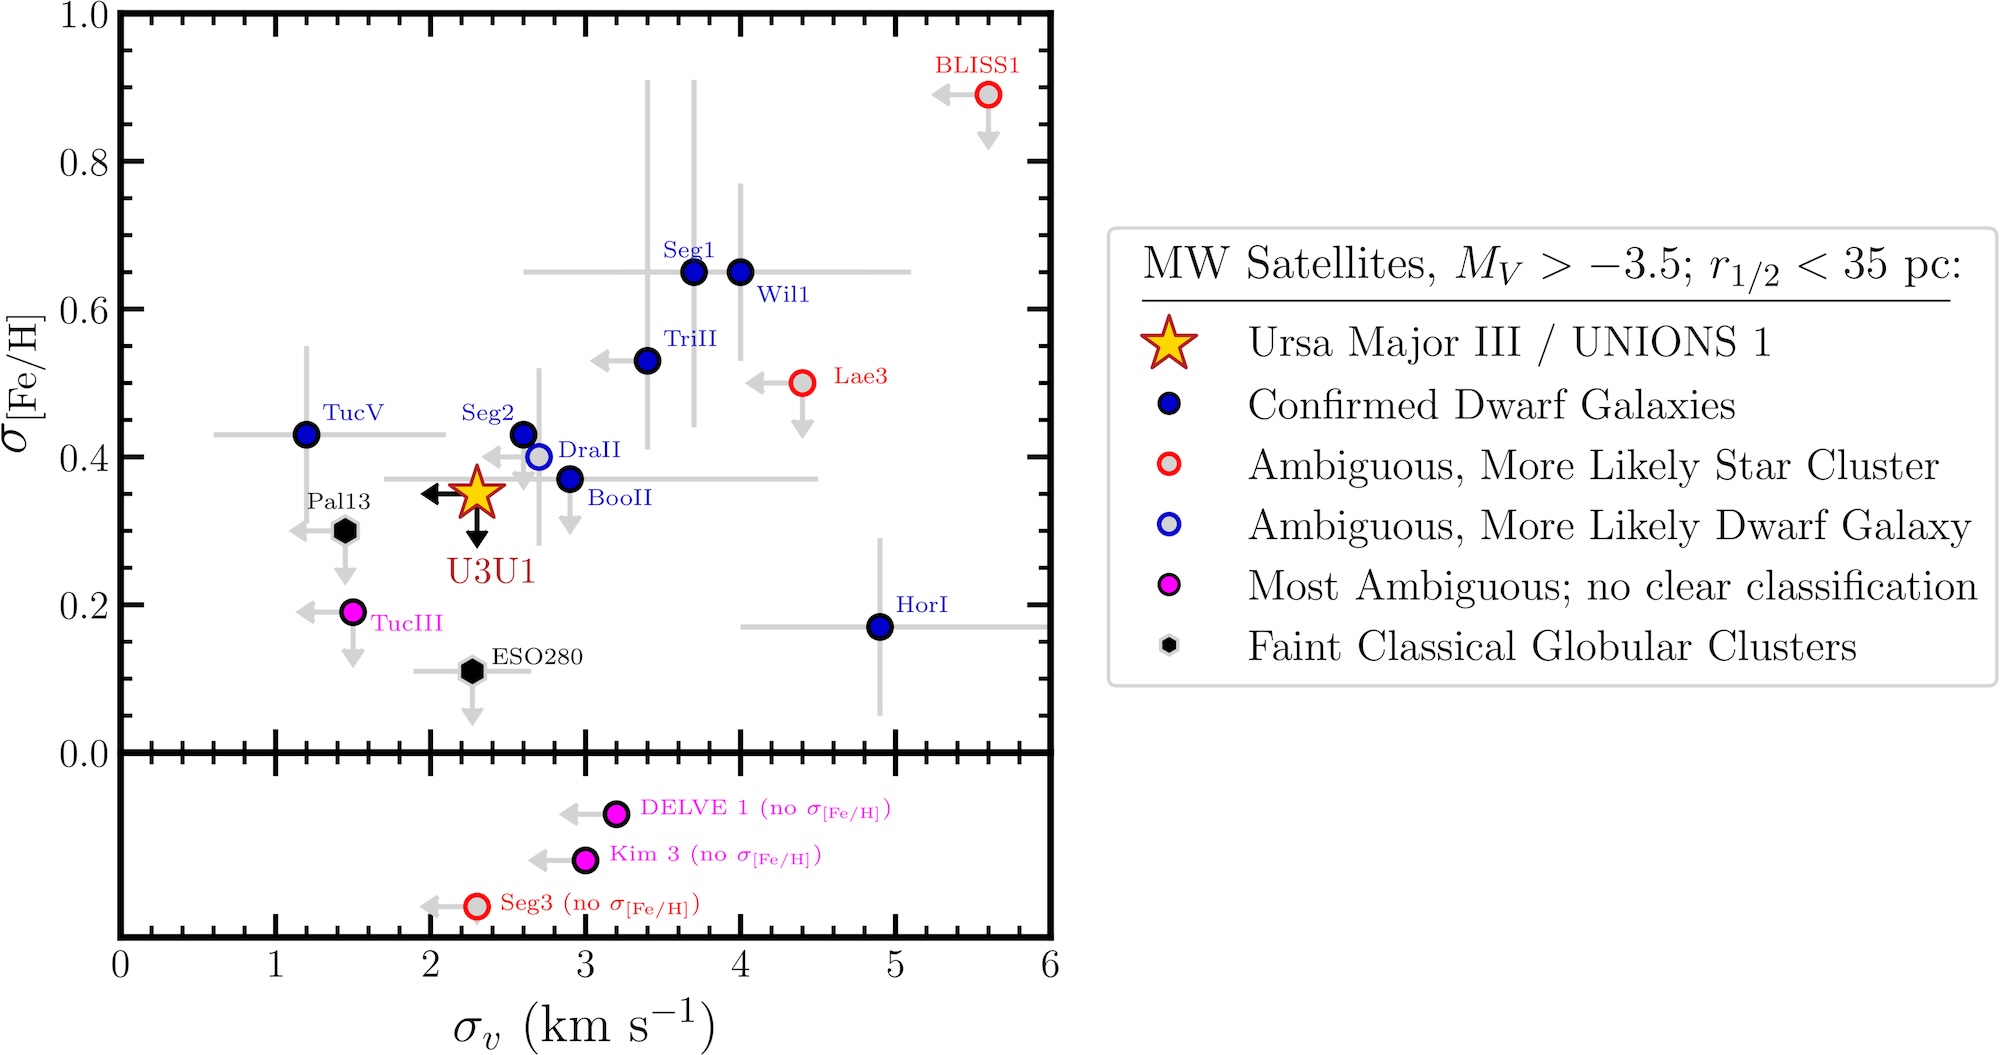
Upper limits on velocity dispersion and metallicity dispersion for Ursa Major III/UNIONS 1 compared to other faint Milky Way satellites. There are no confirmed dwarf galaxies for which the metallicity dispersion and velocity dispersion are both lower than for Ursa Major III/UNIONS 1. Click to enlarge. [Cerny et al. 2026]

Based on the newly collected evidence, Cerny and collaborators concluded that Ursa Major III/UNIONS 1 is likely a star cluster, though the possibility that it’s instead a dwarf galaxy could not be ruled out. If the star cluster classification holds, Ursa Major III/UNIONS 1 would be the least luminous metal-poor star cluster known. This classification may also imply the presence of a large number of compact objects — white dwarfs, neutron stars, or black holes — to keep the cluster intact, filling the role that dark matter would have played.

Going forward, further chemical abundance measurements of Ursa Major III/UNIONS 1 may still sway the argument one way or another. And as facilities like the Vera C. Rubin Observatory and the Euclid space telescope continue to collect data, other extreme Milky Way satellites may come to light.

Citation

“No Observational Evidence for Dark Matter Nor a Large Metallicity Spread in the Extreme Milky Way Satellite Ursa Major III/UNIONS 1,” William Cerny et al 2026 ApJL 999 L8. doi:10.3847/2041-8213/ae29b8

The post Ursa Major III/UNIONS 1: Dwarf Galaxy or Star Cluster? appeared first on AAS Nova.

Fueling Up: How Does the Milky Way Get Its Star-Forming Gas?

30 January 2026 at 17:00

Sagittarius B2

New research uses distant sources to investigate a question close to home: how the Milky Way replenishes its supply of star-forming gas.

Dynamic Galaxies

UGC 12158

This Hubble Space Telescope image shows UGC 12158, a barred spiral galaxy that is likely very similar to the Milky Way. This image also features an asteroid streaking across the top of the galaxy. [NASA, ESA, Pablo García Martín (UAM)]

In photographs, galaxies often appear static and isolated, surrounded by nothing but the blankness of space. This picture is deceiving: galaxies across the universe are dynamic, constantly compressing gas into new stars, expelling gas through supernovae and galactic winds, and replenishing their star forming material by channeling gas from cosmic filaments, accreting clouds from their galactic halos, or collecting previously expelled gas as it rains back down.

This interplay of inflowing and outflowing gas has important implications for a galaxy’s ability to form stars; without a way to resupply, galaxies would soon run out of star-forming gas. In a research article published this week, astronomers investigate one channel through which our own galaxy maintains its supply of star-formation fuel.

Quasars Lend a Hand

To learn more about how the Milky Way collects and incorporates new star-forming material, a team led by Hannah Bish (Space Telescope Science Institute; University of Washington) studied the low-velocity gas flowing into and out of our galaxy at the disk–halo interface. This interface is a transitional region in which gas from the Milky Way’s expansive, diffuse halo is incorporated into the disk, where it can condense into stars.

Hubble image of the quasar 3C 273

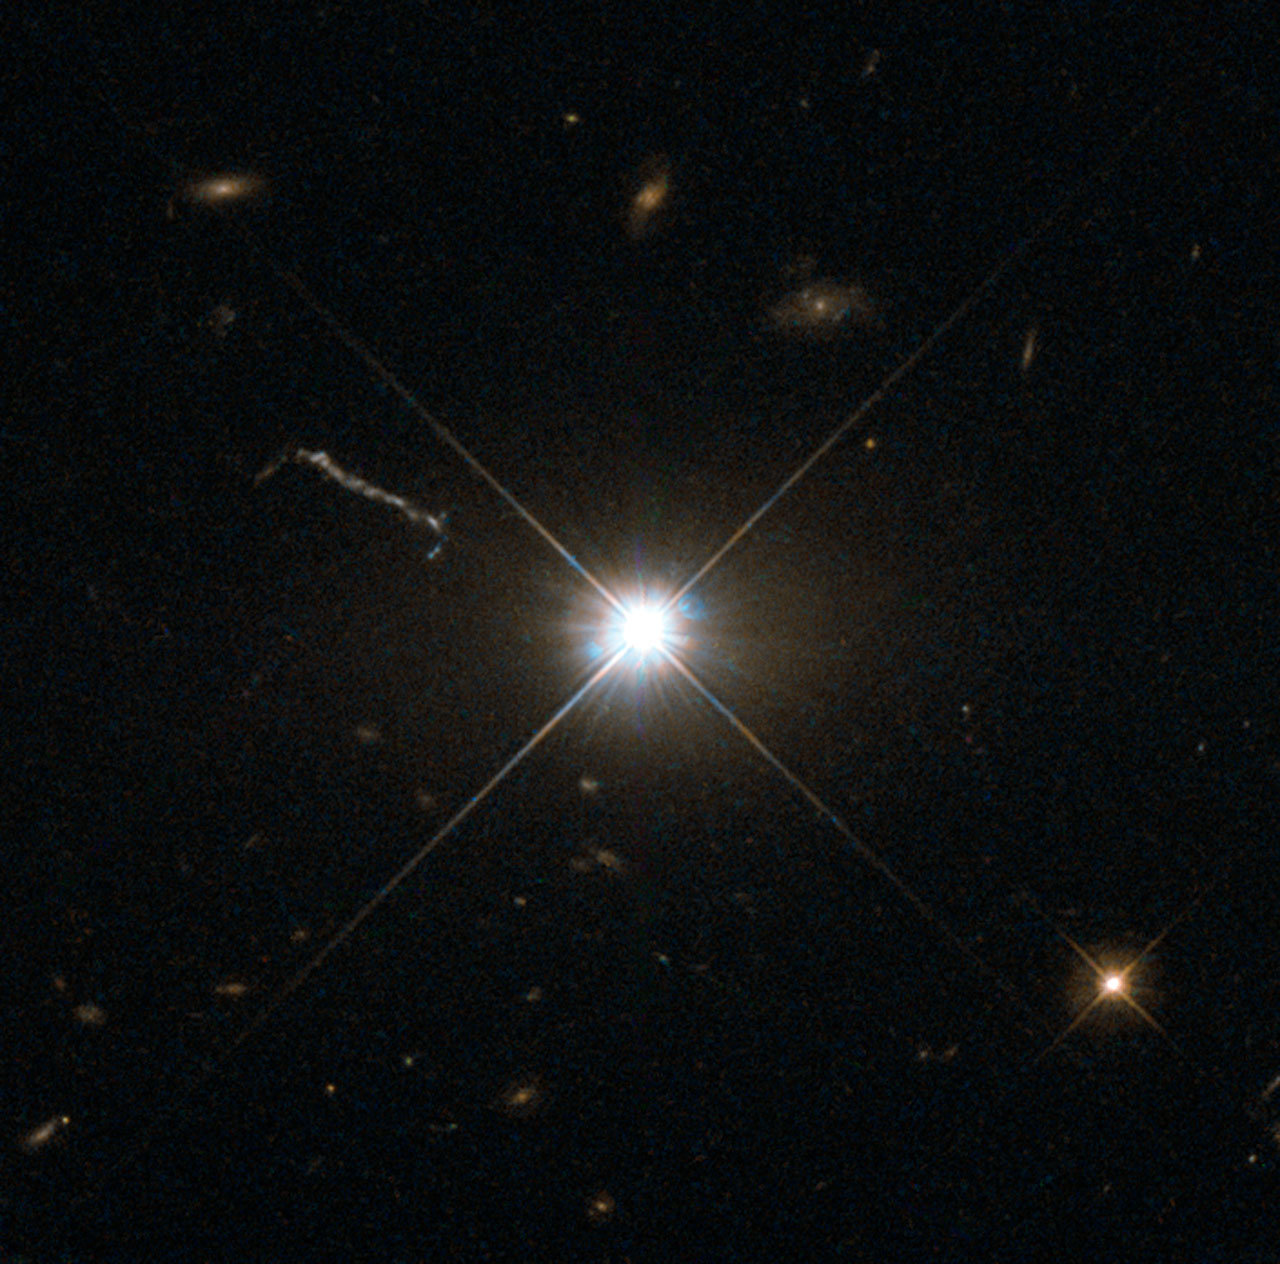
This Hubble image shows the quasar 3C 273. [ESA/Hubble & NASA; CC BY 4.0]

To study gas at the disk–halo interface, Bish’s team enlisted the help of some of the universe’s most luminous objects: quasars. A quasar is a bright, compact galactic center powered by accretion of gas onto a supermassive black hole. When the light from these distant, brilliant beacons passes through gas clouds like those enveloping the Milky Way, the composition, temperature, and velocity of the gas clouds leaves a spectral fingerprint on the light from the quasar.

Complex Inflows and Outflows

The team used spectra of 132 quasars and ground-based measurements of neutral hydrogen to identify and disentangle the motions of gases with different temperatures and compositions. Along 67% of the lines of sight, Bish and collaborators found evidence for both inflowing and outflowing gas, suggesting that these processes occur simultaneously.

infall velocities for gas accreting onto the Milky Way

Infall velocities for the northern (top) and southern (bottom) hemispheres of the Milky Way. The infall velocities in the southern hemisphere are roughly equal regardless of direction, denoted by color, or the ionization energy of the ion being studied. By contrast, the northern hemisphere shows dramatically different behavior with direction and ionization energy. Click to enlarge. [Bish et al. 2026]

They also found differences between inflows in different locations within the galaxy as well as for gas of different temperatures; in the Milky Way’s southern hemisphere, gas of all temperatures and coming from all directions flows inward at 5–10 km/s. In the northern hemisphere, things are more complicated: cooler gas flows inward at 5–10 km/s, while warmer gas streams toward our galaxy much faster. This trend also varies with location, appearing only in certain directions.

Bish’s team explored these results using a simple model of the Milky Way, which they found could largely reproduce the behavior in the southern hemisphere, but not the more complicated findings from the northern hemisphere. They suggested that the difference in behavior between the cooler and warmer gas could be evidence that accretion in the northern hemisphere occurs in patches, and that warm inflowing gas is piling up and cooling where it collides with denser gas at the disk–halo interface.

Looking forward, Bish’s team anticipates that high-resolution models — and more quasar observations to constrain those models — will be key to uncovering the causes of this curious behavior.

Citation

“Differential Accretion of Ionized Low-Velocity Gas at the Milky Way’s Disk–Halo Interface,” Hannah V. Bish et al 2026 ApJ 997 230. doi:10.3847/1538-4357/ae2741

The post Fueling Up: How Does the Milky Way Get Its Star-Forming Gas? appeared first on AAS Nova.

Featured Image: Hunting for Missing Supernova Remnants with EMU and POSSUM

15 September 2025 at 17:00

Researchers estimate that there are at least 1,000 supernova remnants in our galaxy that should be visible at radio wavelengths today — but so far, only a few hundred have been confirmed. Embarking on a search for the missing supernova remnants, Brianna Ball (University of Alberta) and collaborators used radio observations from the Evolutionary Map of the Universe (EMU) and Polarization Sky Survey of the Universe’s Magnetism (POSSUM) surveys. The image above presents a portion of that search, overlaying the positions of various objects of interest atop a background of radio continuum emission from EMU. Several types of objects are indicated: previously known supernova remnants (red), previously identified candidate remnants (orange), new candidates (white), known H II regions (cyan), and young pulsars (green stars). So far, the team has newly confirmed 14 supernova remnants, six of which were identified for the first time thanks to EMU and POSSUM, and 37 new candidate remnants. As the EMU and POSSUM surveys continue, the authors expect that as many as 400 candidate supernova remnants may be spotted. If these candidates are confirmed, it would nearly close the gap between expected and observed numbers of supernova remnants in the regions covered by these surveys. To learn more about this search for supernova remnants, be sure to check out the full research article linked below.

Citation

“A Catalog of Galactic Supernova Remnants and Supernova Remnant Candidates from the EMU/POSSUM Radio Sky Surveys. I.,” B. D. Ball et al 2025 ApJ 988 75. doi:10.3847/1538-4357/addc63

The post Featured Image: Hunting for Missing Supernova Remnants with EMU and POSSUM appeared first on AAS Nova.

How a Black Hole Collision Could Explain the Milky Way’s S-Stars

21 July 2025 at 17:10

Milky Way center

New research shows that a past collision between the Milky Way’s central black hole and a smaller black hole could explain the dynamics of the S-stars, a group of stars that orbit precariously close to our galaxy’s supermassive black hole.

Journey to the Center of the Milky Way

The center of the Milky Way harbors a supermassive black hole (Sagittarius A* or Sgr A*) with a mass of 4 million Suns. The nearest neighbors of this behemoth are a compact disk of massive young stars and a collection of stars called the S-stars, which inhabit the innermost 48 light-days of our galaxy.

While the stars in the disk are orderly, arranged on orbits with moderate eccentricities and low inclinations, the S-stars orbit Sgr A* every which way, careening around the black hole with a wide range of eccentricities and inclinations. So far, the cause of this unusual distribution of stars is unknown.

When Black Holes Collide

Past research has struggled to explain the S-stars’ orbits. A successful theory of S-star origins must account for the stars’ eccentric orbits (e = 0.61, on average) and high orbital inclinations (i = 79º, on average), and it must produce these characteristics within the 15-million-year lifetime of the stars.

diagram showing the proposed formation pathway for the Milky Way's S-stars

Schematic showing the proposed formation pathway for the Milky Way’s S-star population. Click to enlarge. [Akiba et al. 2025]

In a recent research article, a team led by Tatsuya Akiba (University of Colorado Boulder) offered a new hypothesis to explain these traits: Sgr A* absorbed a smaller black hole in the not-so-distant past, and the aftermath of the merger created the distribution of stars seen today.

The premise is not far-fetched: at the ripe old age of nearly 14 billion years, the Milky Way has likely gulped down neighboring dwarf galaxies and globular clusters multiple times. When a black hole embedded within one of these meals of stars and gas merges with the Milky Way’s central black hole, the collision causes Sgr A* to recoil — potentially rearranging the stars in its vicinity in the process.

Radical Reorganization

Akiba and collaborators used N-body simulations to explore the outcomes of such a collision. In their simulations, Sgr A* is situated within an axisymmetric disk of stars or gas. A smaller black hole falls toward Sgr A*, spirals inward, and merges with the larger black hole. The asymmetric emission of gravitational waves causes Sgr A* to recoil, warping the surrounding collection of stars and gas into an eccentric disk. For the eccentricity of the disk to match what is seen in the disk of stars surrounding Sgr A* today, the incoming black hole must have a mass of roughly 200,000 solar masses.

simulation results

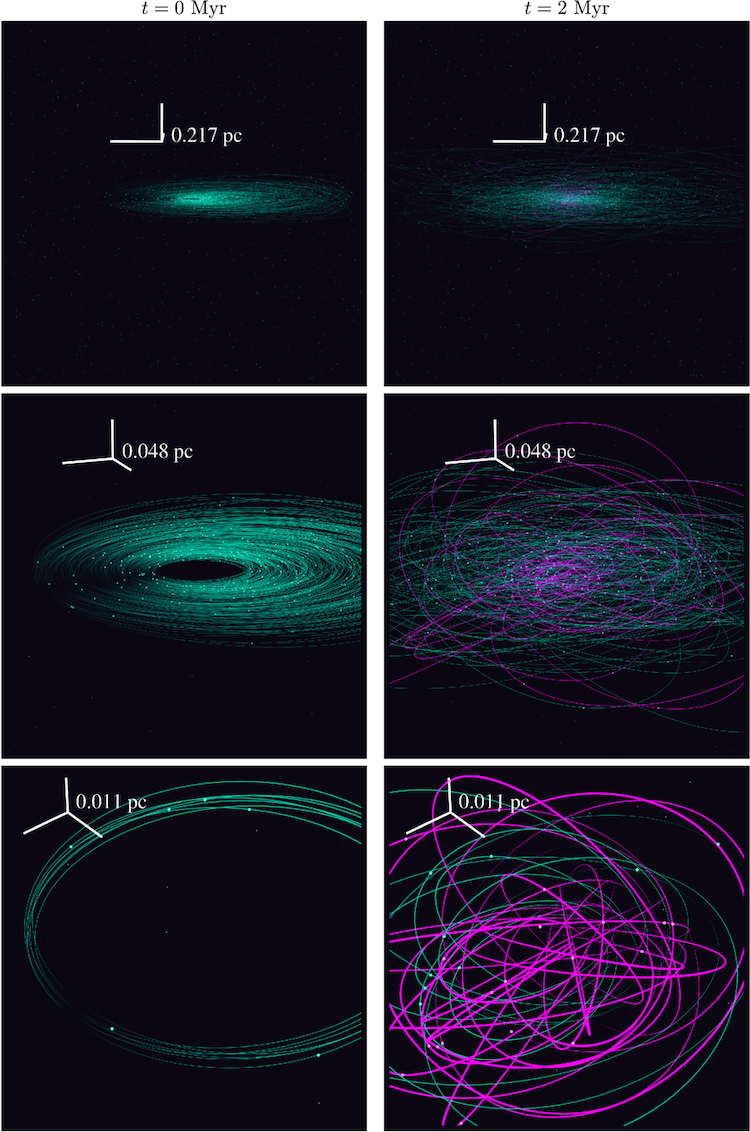
Simulation snapshots taken at the simulation onset (left column) and after 2 million years (right column). Orbits with inclination greater than 30 degrees are shown in magenta. Note the difference in scale between the rows. [Akiba et al. 2025]

After the merger, the stars orbiting farther out torqued the inclinations and eccentricities of the innermost stars up to high values through what’s called the eccentric Kozai–Lidov mechanism. After 2 million years of simulation time, this interaction produced a stellar distribution similar to what is seen today: a disk of moderate eccentricity surrounding “S-stars” with eccentric and highly inclined orbits.

While the properties of the modeled S-stars don’t exactly match the properties of the real deal — the simulated stars have, on average, lower inclinations and eccentricities — the authors noted that this work represents a first foray into their hypothesis. Modeling that explores a broader range of parameter space is needed to fully understand the origins of the stars at the center of the Milky Way.

Citation

“On the Formation of S Stars from a Recent Massive Black Hole Merger in the Galactic Center,” Tatsuya Akiba et al 2025 ApJL 987 L27. doi:10.3847/2041-8213/addc5d

The post How a Black Hole Collision Could Explain the Milky Way’s S-Stars appeared first on AAS Nova.

Stars on the Move: New Insights from the Galactic Center

27 May 2025 at 17:00

Milky Way center

Editor’s Note: Astrobites is a graduate-student-run organization that digests astrophysical literature for undergraduate students. As part of the partnership between the AAS and astrobites, we occasionally repost astrobites content here at AAS Nova. We hope you enjoy this post from astrobites; the original can be viewed at astrobites.org.

Title: Discovery of a Dense Association of Stars in the Vicinity of the Supermassive Black Hole Sgr A*
Authors: S. Elaheh Hosseini et al.
First Author’s Institution: University of Cologne and Max Planck Institute for Radio Astronomy
Status:
Published in ApJ

The galactic center is a dynamic region at the heart of the Milky Way that is home to a supermassive black hole named Sgr A* (Sagittarius A-Star). It is densely packed with stars, gas, and dust, all interacting in fascinating ways. One challenge in studying this region is understanding the movement of stars, particularly those near the black hole, where gravitational forces are intense.

Astronomers have previously observed stars with unusual motions near Sgr A*, but a recent study highlights 42 sources near IRS 1W, an infrared source and well-known bow-shock source near the center of the galaxy. These sources are moving northward towards Sgr A*, and their behavior offers new insights into the region’s dynamics. What do the distributions, origins, and potential connections of these stars reveal about the enigmatic region surrounding Sgr A*?

What Are the N-Sources?

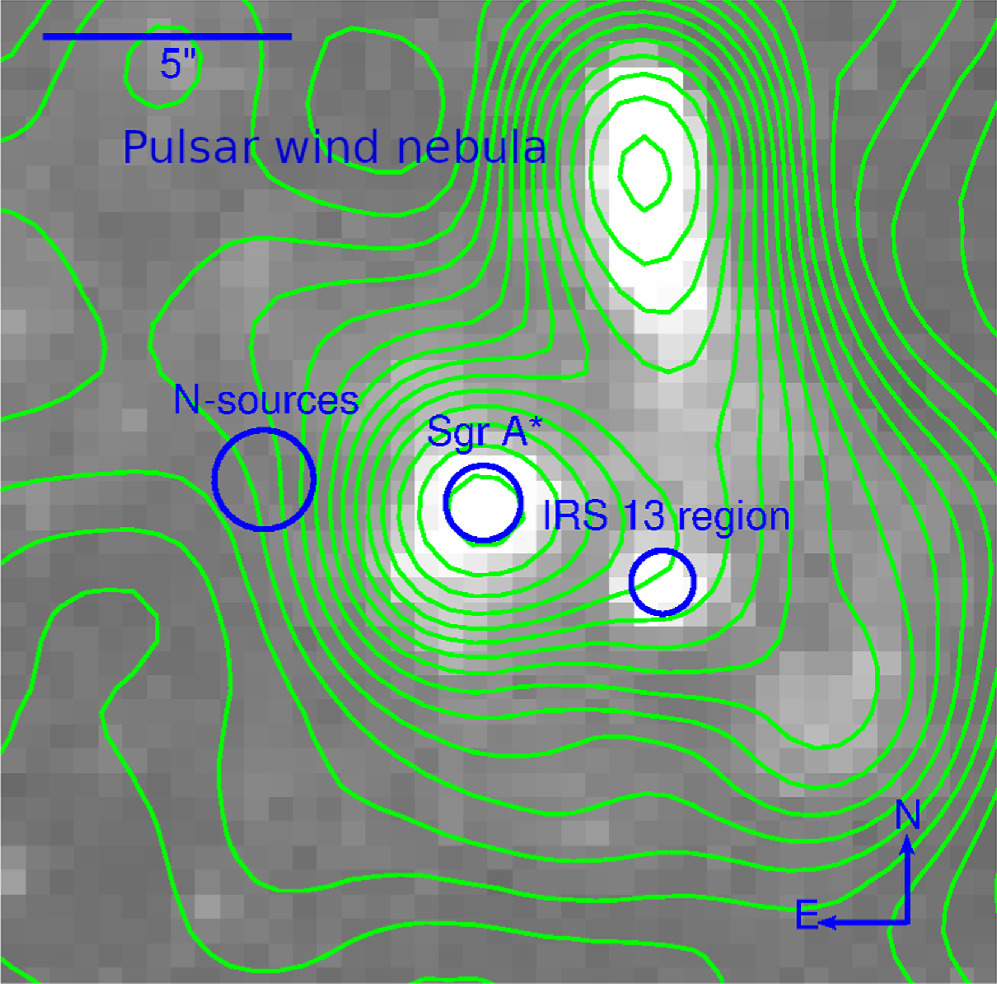
The study identifies these 42 sources, referred to as the N-sources (see Figure 1), as a group of stars moving northward relative to the central black hole. Their spatial distributions and proper motions reveal they are more clustered than stars in random regions at a similar distance from Sgr A*. This clustering, combined with their motion, suggests that the N-sources near the galaxy’s center may be part of a stellar association — a group of stars moving together in the same direction but not held together by gravity.

infrared sources near the galactic center

Figure 1: Image from 2005 showing the location of the N-sources and other IRS sources near the galactic center. The position of Sgr A* (the supermassive black hole) is indicated by the “x.” The N-sources are located about 6.05′′ from Sgr A* in this Ks-band image, which is sensitive to wavelengths of light slightly longer than visible light and is often used to observe regions obscured by dust. [Hosseini et al. 2024]

X-ray sources near the galactic center

Figure 2: X-ray image from Chandra showing the position of Sgr A*, IRS 13, and other bright X-ray sources. The lack of a significant X-ray source at the position of the N-source association further supports the idea that these stars may not be part of a typical stellar cluster. [Hosseini et al. 2024]

The authors also analyzed X-ray data from the Chandra X-ray Observatory, revealing no significant X-ray emission from the N-source region (Figure 2). In contrast, both the X-ray bright Sgr A* and IRS 13, another well-known infrared source near this region, show significant emission. This lack of X-ray emission from the N-sources adds complexity to understanding these sources and their origin.

Two Possible Origins

The study suggests two primary scenarios for the origin of the N-sources:

  1. A stellar cluster around an intermediate-mass black hole: One possibility is that the N-sources are part of a stellar cluster that is stabilized by an intermediate-mass black hole, a type of black hole with a mass between stellar-mass black holes and supermassive black holes like Sgr A*. The authors suggest the intermediate-mass black hole could have formed from stellar-mass black holes colliding with stars. If the N-sources are associated with this black hole, their motion could be influenced by its gravitational forces, keeping the cluster intact in the dense environment of the galactic center. Data from the Chandra X-ray Observatory suggest that this hypothetical intermediate-mass black hole would be surrounded by a faint accretion flow. Since weaker flows with less infalling material typically produce less X-ray radiation, this could explain the lack of bright X-ray emission at the N-source locations.
  2. A projection effect from a stellar disk: Alternatively, the N-sources and IRS 13, another stellar association, might simply appear clustered because of their position along the same stellar disk. This disk could be a projection of stars from a larger structure, such as the clockwise stellar disk observed in other regions near Sgr A*. In this case, the N-sources might not be physically bound to an intermediate-mass black hole but could just be stars from a local disk-like structure.

Looking Ahead: What’s Next for Studying the N-Sources?

To better understand the N-sources’ origin, future spectroscopic observations, especially with JWST, will be crucial. These observations could provide key data on the stars’ velocities, helping astronomers determine whether they are part of a stellar cluster around an intermediate-mass black hole or just a projection from a larger stellar disk.

The study of the N-sources offers important insights into the dynamics of the galactic center, a region that is both an astrophysical laboratory and a challenging environment for astronomers. By understanding how stars move in this dense, gravitationally extreme region, researchers can learn more about the role of supermassive black holes, intermediate-mass black holes, and stellar clusters in shaping the structure and evolution of our galaxy.

Original astrobite edited by Viviana Cáceres and Lucas Brown.

Original astrobite authored by Sparrow Roch.

The post Stars on the Move: New Insights from the Galactic Center appeared first on AAS Nova.

Is Earth’s water why intelligent life evolved here?

1 June 2026 at 12:00

Earth has many unique features for a planet, such as a magnetic field, a large moon, and plate tectonics. It’s also the only planet we know of that harbors life. These facts form the basis of the Rare Earth hypothesis, which posits that we haven’t found aliens because other planets in the Galaxy probably don’t have all the right conditions for life. 

Another characteristic of Earth is that about 30% of its surface is land and about 70% is ocean. Recently, Columbia University Assistant Professor David Kipping investigated whether the proportion of Earth’s surface covered by dry land versus ocean, or its land fraction, is another reason Earth is habitable not only for simple single-celled organisms, but also for intelligent species like humans. 

To test this hypothesis, Kipping created 4 statistical models of planets with different land fractions that intelligent aliens could potentially evolve on. First, he created an equation to describe the likelihood that a planet in its star’s habitable zone has a particular land fraction, known as a probability distribution. Kipping weighted this probability distribution toward the extreme ends, making it more likely that a planet would be covered by a single huge landmass or a single vast ocean than by a mix of both, as on Earth. 

Kipping then incorporated this land fraction probability distribution into his statistical models to calculate the probability that a random planet will have that land fraction and host intelligent life. The 4 scenarios Kipping tested were: 1) that intelligent life is more likely to emerge on land-dominated planets, 2) that it’s more likely to emerge on ocean-dominated planets, 3) that it’s more likely to emerge on planets with roughly equal amounts of land and ocean, and 4) that its emergence is independent of a planet’s land fraction. 

As a first step in determining the kinds of planets intelligent aliens would tend to emerge on, Kipping used each model to predict the probability that intelligent life would emerge on a planet with the same land fraction as Earth. He then compared these probabilities by calculating the ratios between each value. Because Earth is the only known planet with intelligent life, a model that predicted a greater probability for humanity’s existence on Earth would be more likely to reflect reality.

Kipping considered it strong evidence that a given model was more realistic than another if the ratio between 2 of them was greater than 10, meaning one model was 10 times more likely to predict the existence of Earth and humanity. Kipping found that no comparison of any 2 models passed this threshold. However, the models assuming that intelligent life prefers ocean-dominated planets or planets with a land-ocean balance were 2.5 and 3 times more likely to predict the existence of humanity than the model assuming that intelligent life prefers land-dominated planets. Additionally, the model assuming that intelligent life prefers a land-ocean balance was always more likely to predict humanity than any other model, though marginally. 

Kipping also addressed whether finding more planets with intelligent life would affect which model was deemed most realistic, for example, if scientists discovered conclusive evidence of life on Mars in its distant past. Here, Kipping identified 2 complications. First, it’s uncertain how much of Mars’s surface was once covered by water – some estimate it had a land fraction as high as 81%, while others estimate it was as low as 25%. Second, proving that Mars once had life would not prove it once had intelligent life.

Regardless, Kipping reran the models assuming that ancient Mars had a land fraction comparable to Earth’s. Adding this second data point produced ratios similar to those in the earlier Earth-only calculations, meaning it still didn’t make any single model 10 times more likely to predict the existence of humans and Martians, respectively. 

Kipping then took the 10-times threshold and reversed the calculations to find what conditions would exceed it. In doing so, he calculated that astronomers would need to find 14 other planets with intelligent life and known land fractions to robustly determine whether intelligent life is more likely to occur on desert planets, ocean planets, balanced planets, or without bias.

Kipping concluded that he can’t yet definitively state whether there is something special about Earth’s land fraction when it comes to producing intelligent species. However, Earth’s existence would suggest that intelligent life is unlikely to favor extreme desert planets, so the Milky Way probably isn’t filled with Tatooines and Jakkus. And while his analysis doesn’t debunk the Rare Earth hypothesis, it does undermine the argument that Earth’s ocean size explains why Earth is rare. 

The post Is Earth’s water why intelligent life evolved here? appeared first on Sciworthy.

❌