Normal view
The Ancient Roots of Modern Winemaking
Two-thousand-year-old grape seeds yield viticultural insight in the Chianti wine region
The post The Ancient Roots of Modern Winemaking appeared first on Nautilus.

274 Years Ago Today, Benjamin Franklin Flew a Kite
But a Frenchman beat him to the electric punch by a month
The post 274 Years Ago Today, Benjamin Franklin Flew a Kite appeared first on Nautilus.

The Dinosaur-killing Asteroid May Have Fueled Life Underground for 8 Million Years
How the Romans Invented Apartment Living. It Was Brilliant, Brutal, and Often Deadly
The fastest humans in the galaxy just got a spiffy patch to prove it
NASA's Artemis II crew are the fastest people alive, and now they have the patch to prove it.
Mission Commander Reid Wiseman, pilot Victor Glover, and mission specialists Christina Koch and Jeremy Hansen (the latter with the Canadian Space Agency) spent 10 days in early April flying by the Moon. Their journey took them farther away from Earth than any humans have gone (52,756 miles [406,771 km]) and then, on the way back on board their Orion spacecraft Integrity, they sped up to about 24,664 miles per hour (39,693 k/ph) reentering the atmosphere.
Only three other people in history have traveled faster. NASA's Apollo 10 astronauts Thomas Stafford, John Young, and Eugene Cernan set the record for the highest speed attained by a crewed vehicle relative to the Earth's surface: 24,791 mph (39,897 kph) on May 26, 1969.


Β© Reid Wiseman/A-B Emblem/collectSPACE
- ZME Science
- Englandβs Famous Naked Giant Is Getting a 17-Ton Chalk Makeover To Prevent Him From Fading
- ZME Science
- Metal Detectorist Finds Rare Roman Gold Ring Buried During Britainβs Imperial Breakaway
Ancient Romans Were Obsessed With This Remarkable Herb β Then It Vanished Forever
Observing the End of Star Formation in Galaxies
![]()
Editorβs Note: Astrobites is a graduate-student-run organization that digests astrophysical literature for undergraduate students. As part of the partnership between the AAS and astrobites, we occasionally repost astrobites content here at AAS Nova. We hope you enjoy this post from astrobites; the original can be viewed at astrobites.org.
Title: Searching Within Galaxies for the Earliest Signs of Quenching With Spatially Resolved Star Formation Histories in UVCANDELS
Authors: Charlotte Olsen et al.
First Authorβs Institution: New York City College of Technology
Status: Published in ApJ
How and Why Do Galaxies Stop Forming Stars?
Galaxies serve as important laboratories for many subfields of astrophysics. As such, astrophysicists are interested in the full galactic life cycle, from how galaxies are born to the end of their formation. Whereas young galaxies in the distant universe are actively forming stars, many nearby galaxies are much quieter, with little or no ongoing star formation. Astronomers like to describe these galaxies as βred and deadβ because their stars are older and therefore appear redder in color. The process by which galaxies shut down their star formation is known as quenching, and it causes galaxies to become quiescent. Understanding the origin of quiescent galaxies is a fundamental question in galaxy evolution. Studying this process is challenging, however, because star formation is intertwined with many other factors that shape galaxies, including their environments and supermassive black holes.
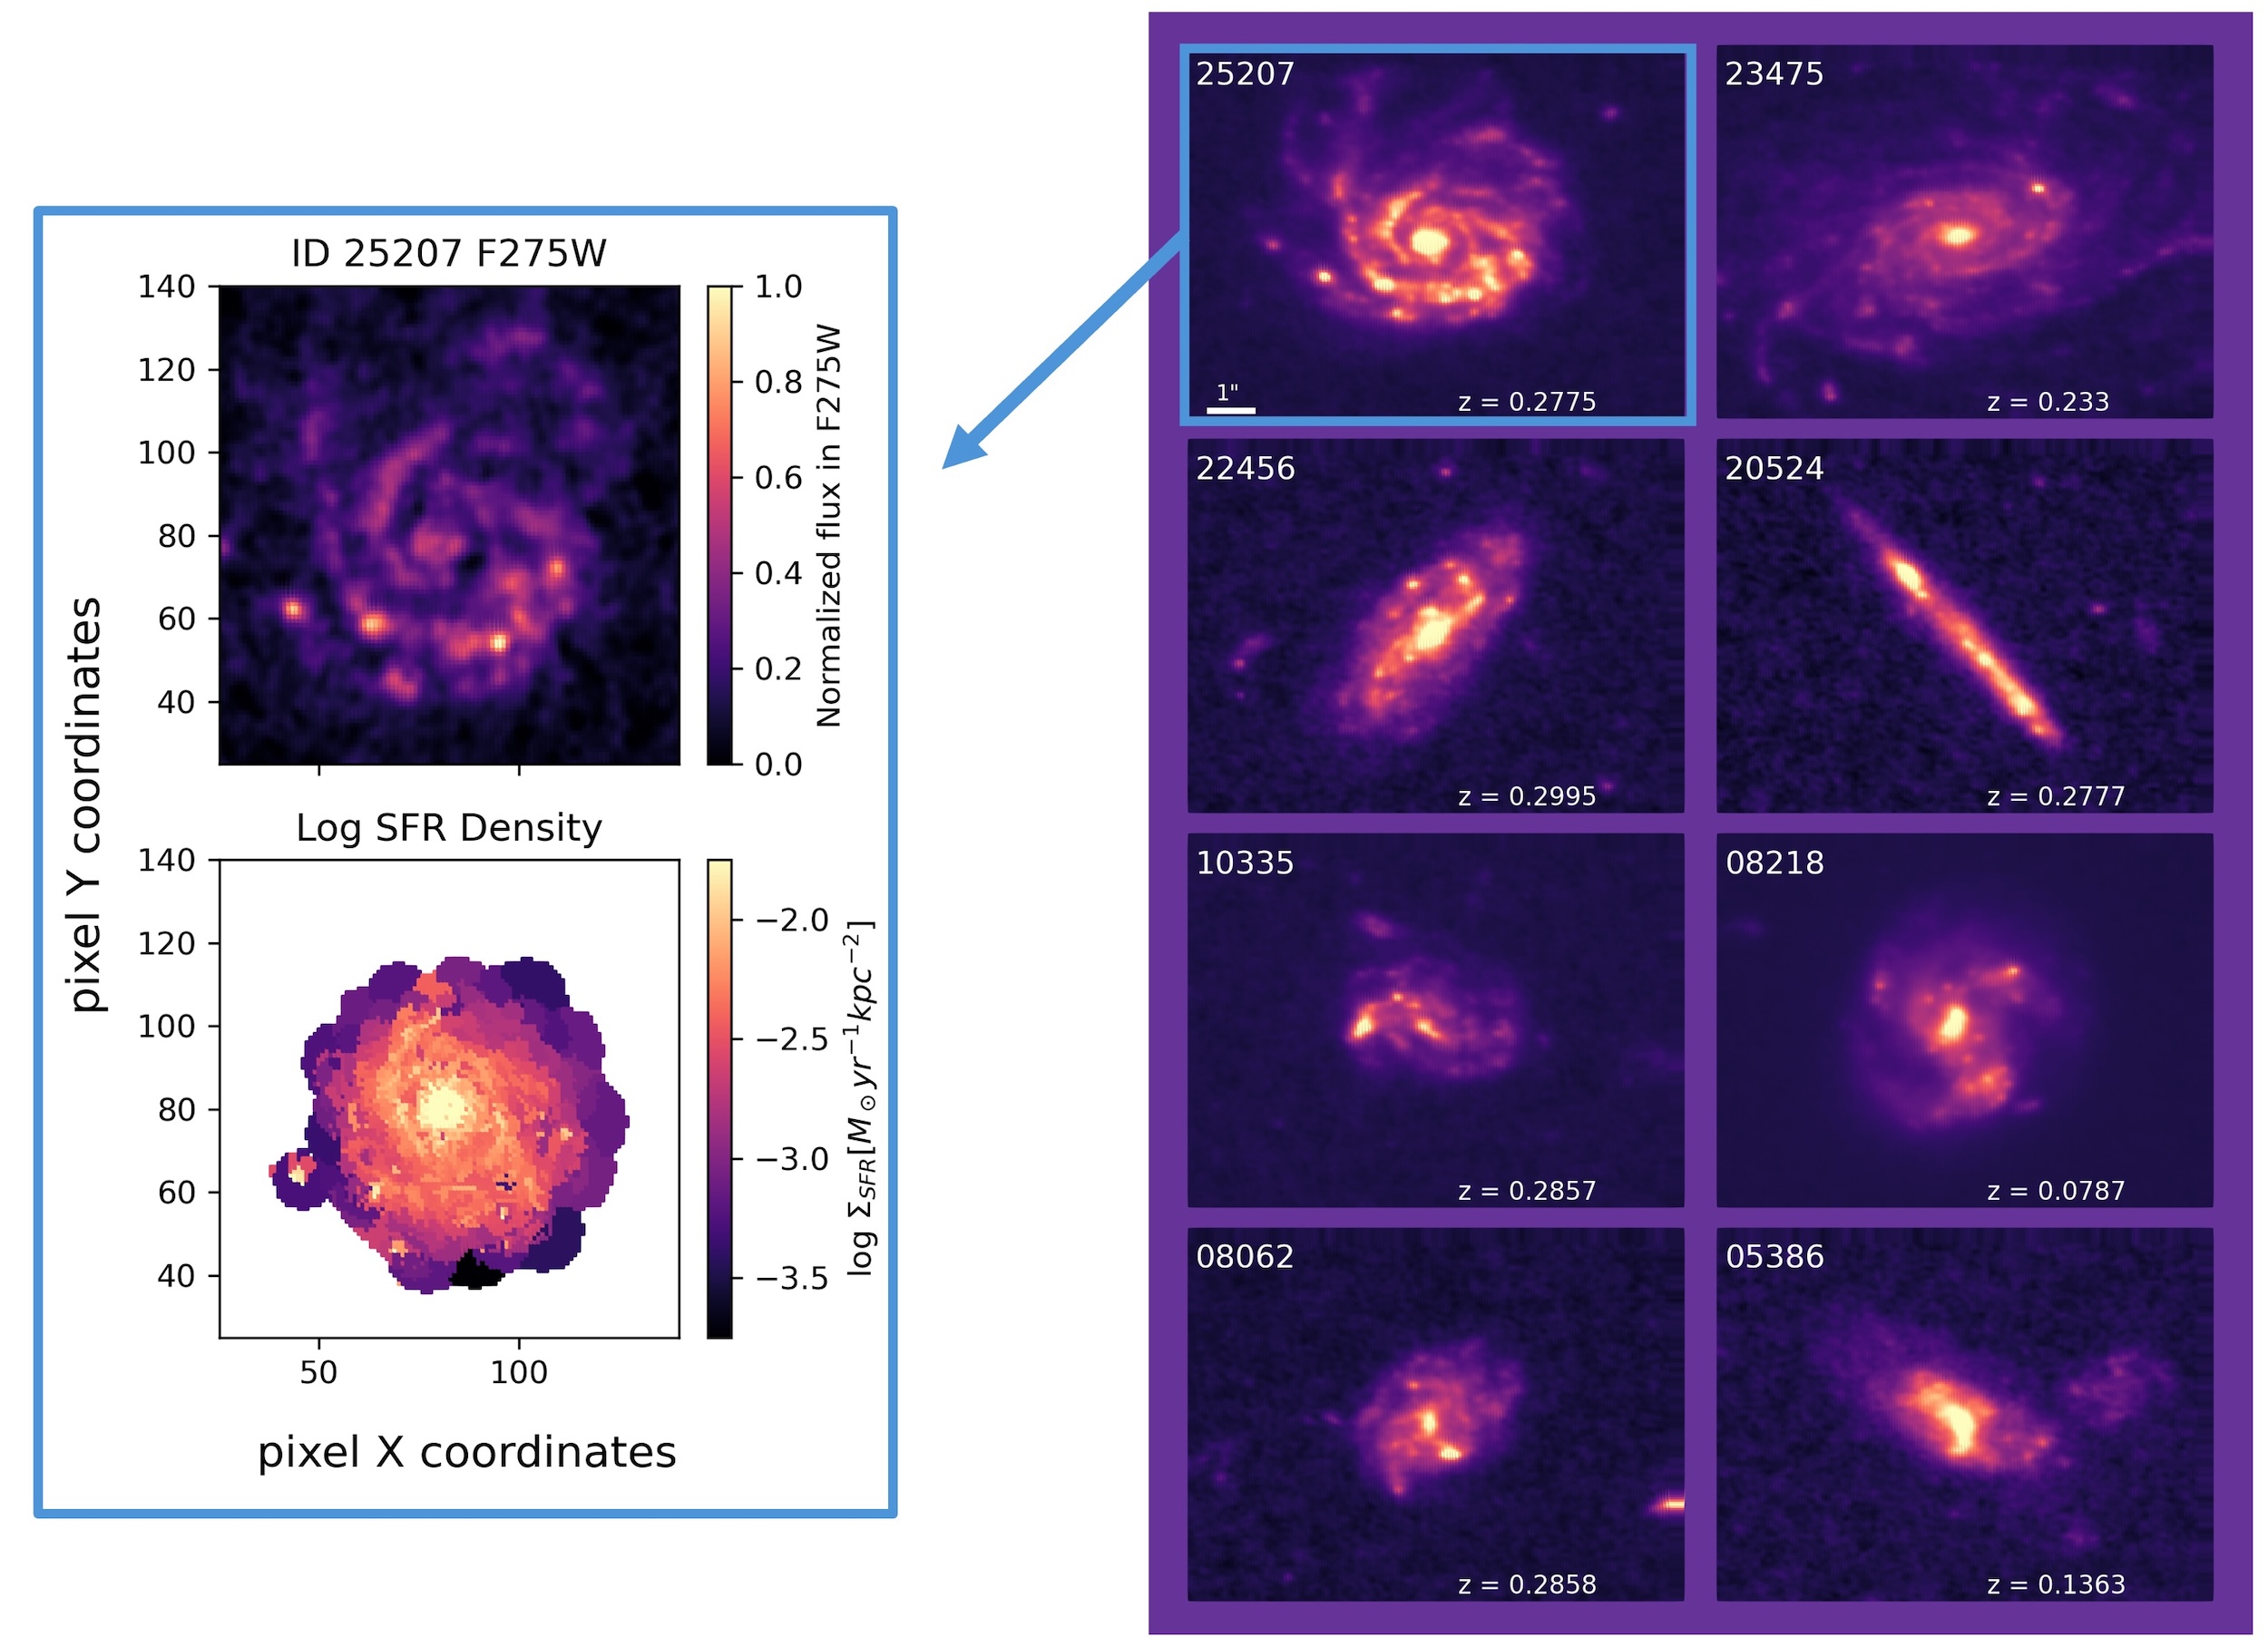
Star formation occurs on scales that are much smaller and over timescales much shorter than the global properties and overall lifetime of a galaxy. By observing star formation on these smaller scales over time, astronomers can gain a clearer picture of how star formation ceases in a galaxy, and they can determine whether this process is driven from the inside out β starting with the supermassive black hole in the galactic center β or from the outside in, influenced by environmental effects. In todayβs article, the authors use the Cosmic Assembly Near-Infrared Deep Extragalactic Legacy Survey with high-resolution ultraviolet coverage (UVCANDELS) to examine eight βgoldenβ galaxies, shown in Figure 1. They then reconstruct the star formation histories within small regions of each galaxy to detect the βearliest signs of quenching.β
Figure 1: Images of the eight galaxies in the βGolden Sampleβ of galaxies studied in this work (right). These galaxies were chosen because of their clear detection, and they show a range of edge-on to face-on views as well as shapes. The authors divided each galaxy into small, resolved regions in which they measured the star formation (example shown on left). [Adapted from Olsen et al. 2026]
Characterizing the Star Formation Histories
To trace a galaxyβs star formation over cosmic time, todayβs authors model its integrated light β which encodes the many episodes of past star formation β using spectral energy distribution (SED) fitting. By comparing a galaxyβs light across many wavelengths to computer models, SED fitting can estimate the ages of its stars and when they formed. This approach allows astronomers to study how a galaxyβs star formation rate evolves as a function of its stellar mass, known as the SFR β Mstellar relation. Note that the article considers the star formation rate and stellar mass in individual regions of each galaxy, so it analyzes these properties as surface densities, Ξ£SFR and Ξ£Mstellar, instead of the total values.
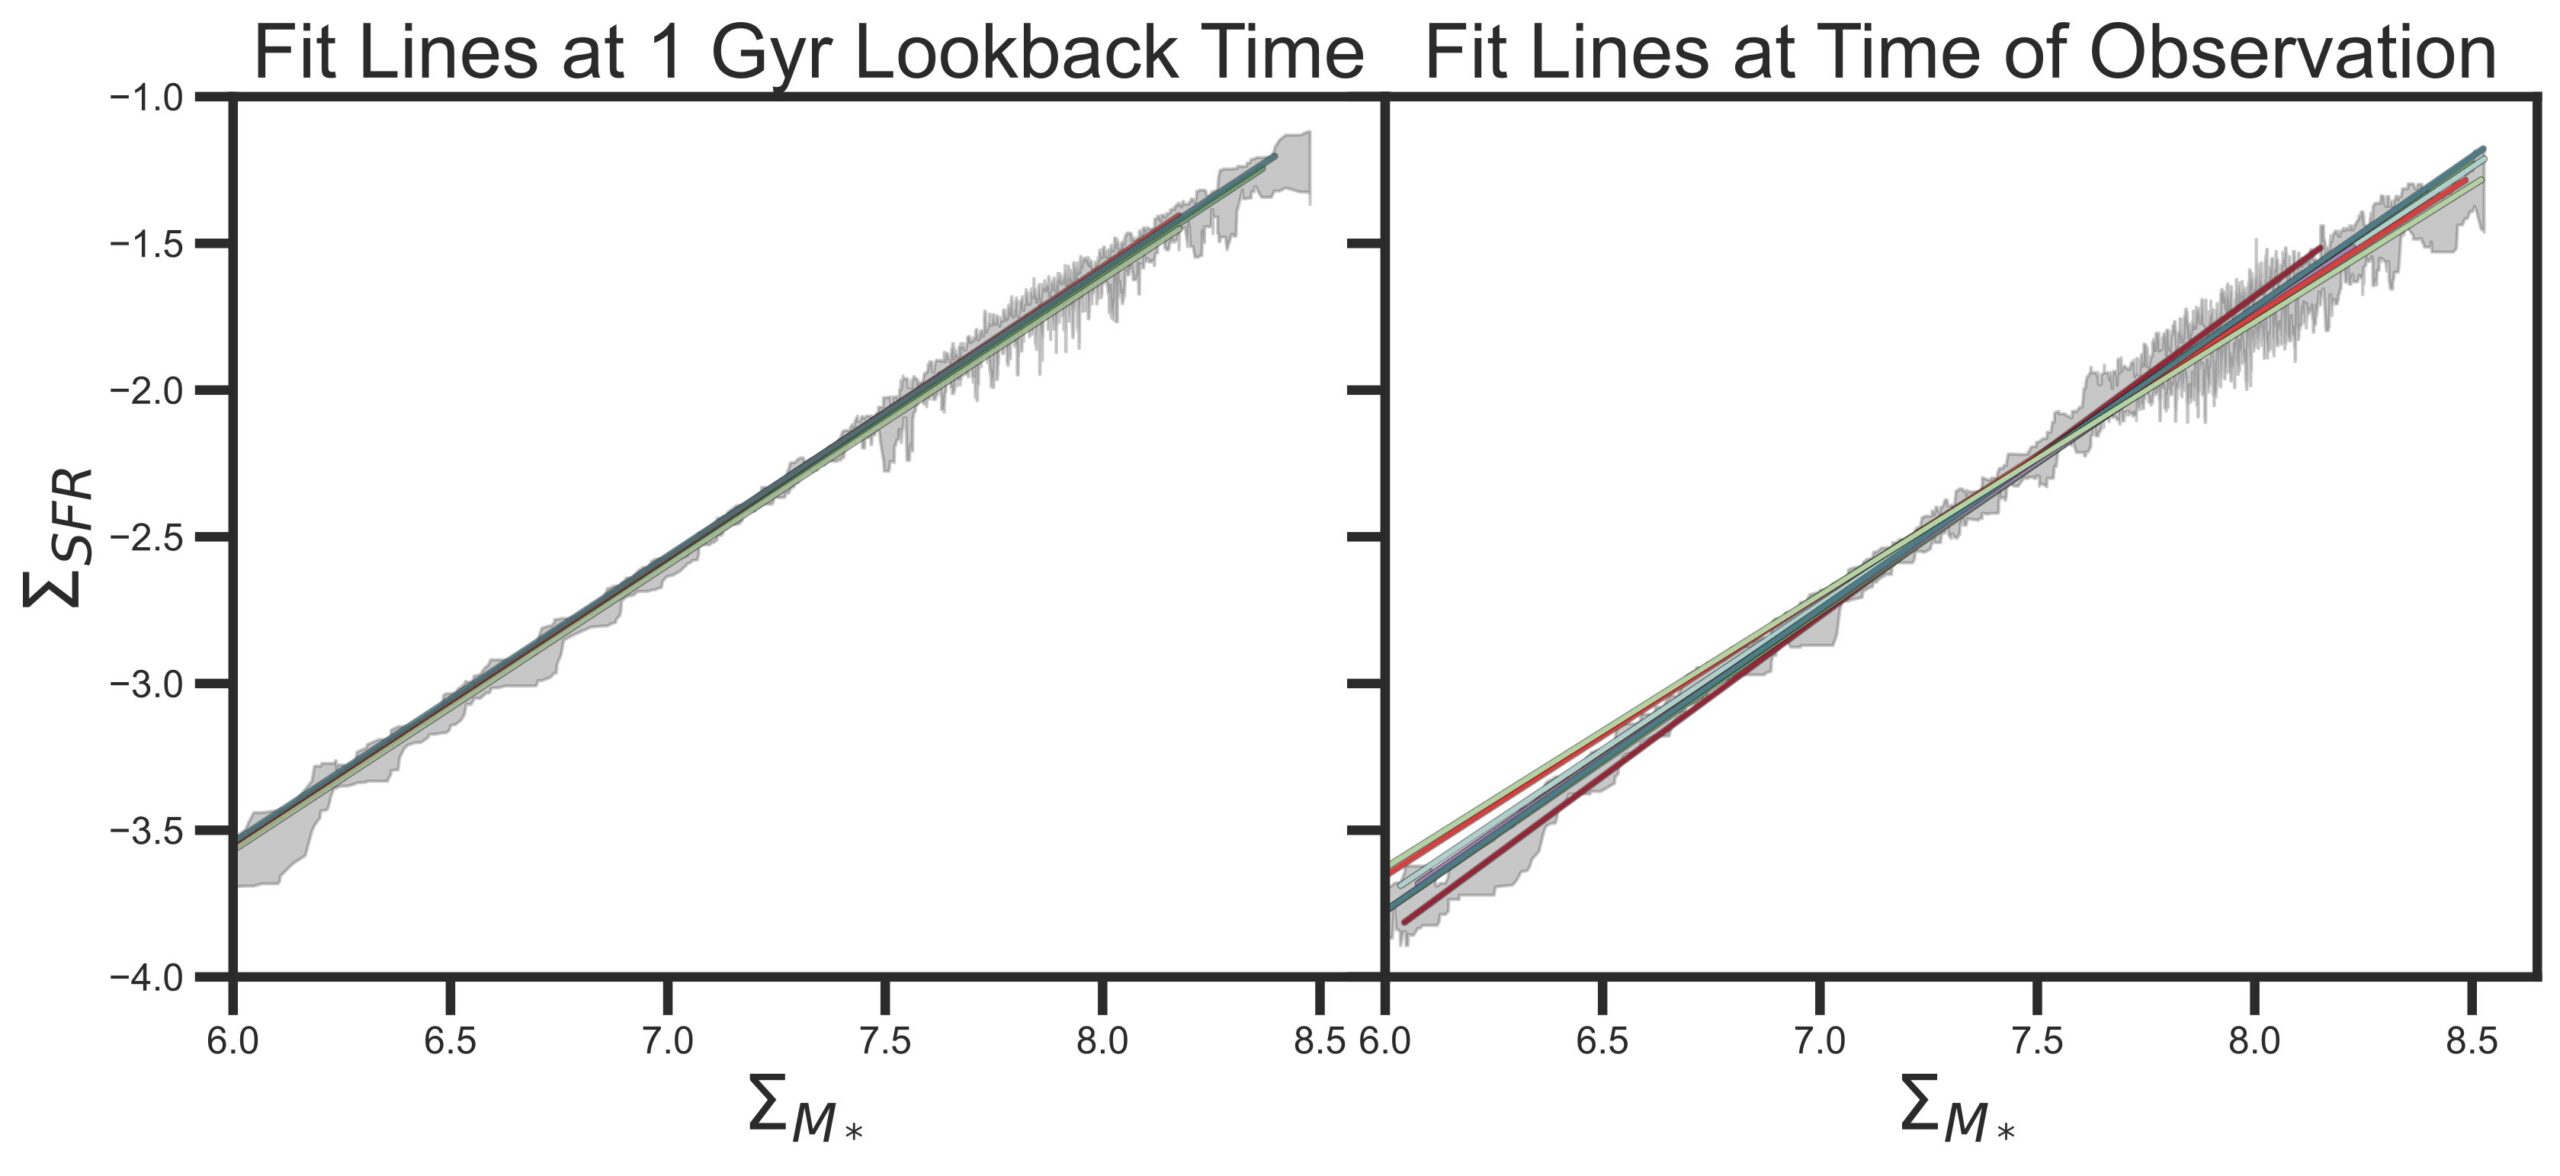
Using SED fitting, the authors determine the expected star formation rate and stellar mass of the regions from 250 million to 1 billion years before the time of observation. Figure 2 shows the line of best fit for the SFR β Mstellar relation of the regions for each galaxy, before and at the time of observation. The SFR β Mstellar relations are very similar across the sample 1 billion years before the observations; however, by the time of observation, the overall star formation rates have decreased slightly, indicating that the galaxies are beginning to quench. They also exhibit increased variation suggesting that each galaxy is quenching in a different way.
Figure 2: The best-fit SFR β Mstellar relation of the regions for each galaxy, represented by the different colored lines, 1 billion years (1 Gyr) before and at the time of observation (left and right panels, respectively). At 1 billion years before the observation, the galaxies appear to have the same relation, but their variation at the time of observation suggests that the galaxies have begun quenching in different ways. [Olsen et al. 2026]
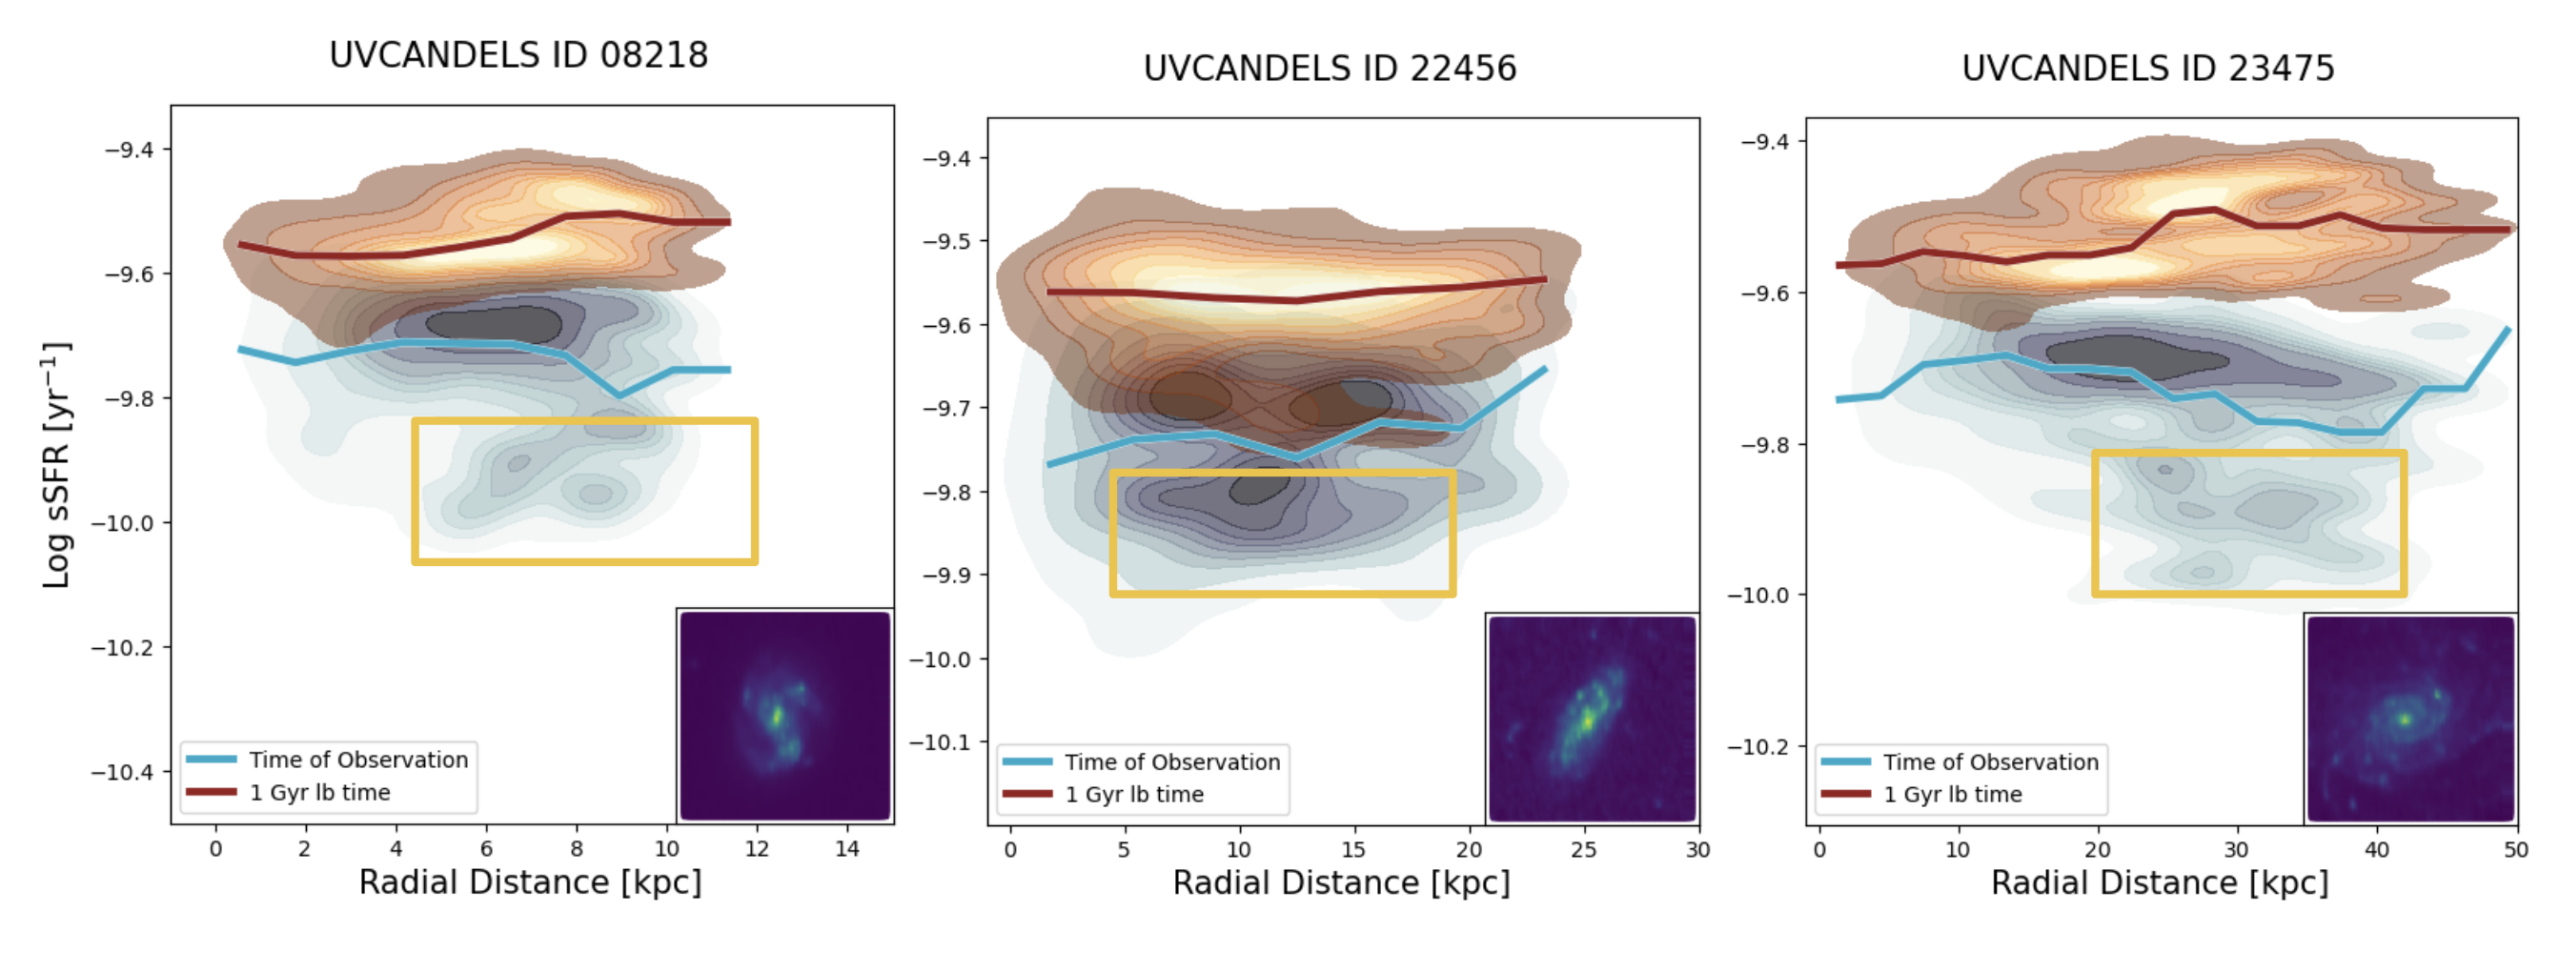
Figure 3: The specific star formation rate of the regions as a function of their distance from the center for three of the galaxies in the sample. Overall, the star formation rate decreases from 1 billion years before the observation (red) to the time of observation (blue). However, the regions where the star formation decreases most significantly (indicated with the yellow boxes) vary from galaxy to galaxy. [Olsen et al. 2026]
Detecting the Earliest Signs of Quenching
It should be noted that all of the galaxies in this study are still forming stars. However, they are on the verge of having their star formation suppressed, offering valuable insight into how quenching begins and how diverse the process can be. New telescopes are pushing the boundaries of what we can observe. On one hand, JWST can capture galaxies at exceptionally high resolution; on the other, the Vera C. Rubin Observatory and the Nancy Grace Roman Space Telescope will deliver vast datasets containing billions of galaxies. Future investigations leveraging these facilities could reveal more about the physical processes that quench galaxies on small scales, shedding light on the mechanisms that drive galaxy evolution.
Original astrobite edited by Catherine Slaughter.
About the author, Shalini Kurinchi-Vendhan:
After studying astrophysics and literature at Caltech, I moved onto a Fulbright Fellowship in Heidelberg, Germany. Iβm passionate about using computer simulations to explore supermassive black holes and galaxy evolutionΒ β but I also love poetry and traveling.
The post Observing the End of Star Formation in Galaxies appeared first on AAS Nova.
- AAS Nova
- Astronomers Hate Them! This Star Formation Ingredient Makes Clusters Look 300 Million Years Older
Astronomers Hate Them! This Star Formation Ingredient Makes Clusters Look 300 Million Years Older
![]()
Editorβs Note: Astrobites is a graduate-student-run organization that digests astrophysical literature for undergraduate students. As part of the partnership between the AAS and astrobites, we occasionally repost astrobites content here at AAS Nova. We hope you enjoy this post from astrobites; the original can be viewed at astrobites.org.
Title:Β Characterizing The Star Cluster Populations in Stephanβs Quintet Using HST and JWST Observations
Authors: P. Aromal et al.
First Authorβs Institution: University of Western Ontario
Status: Published in ApJ
On 12 July 2022, the first images taken with JWST were released to the public. All of the astronomers in my department gathered together to watch the images be revealed in real time. It was exciting for everyone, from graduate students getting to see a glimpse into the future possibilities of their fields, to retired professors getting to see the fruits of their decades-long labor in advocating for the telescope to be built.
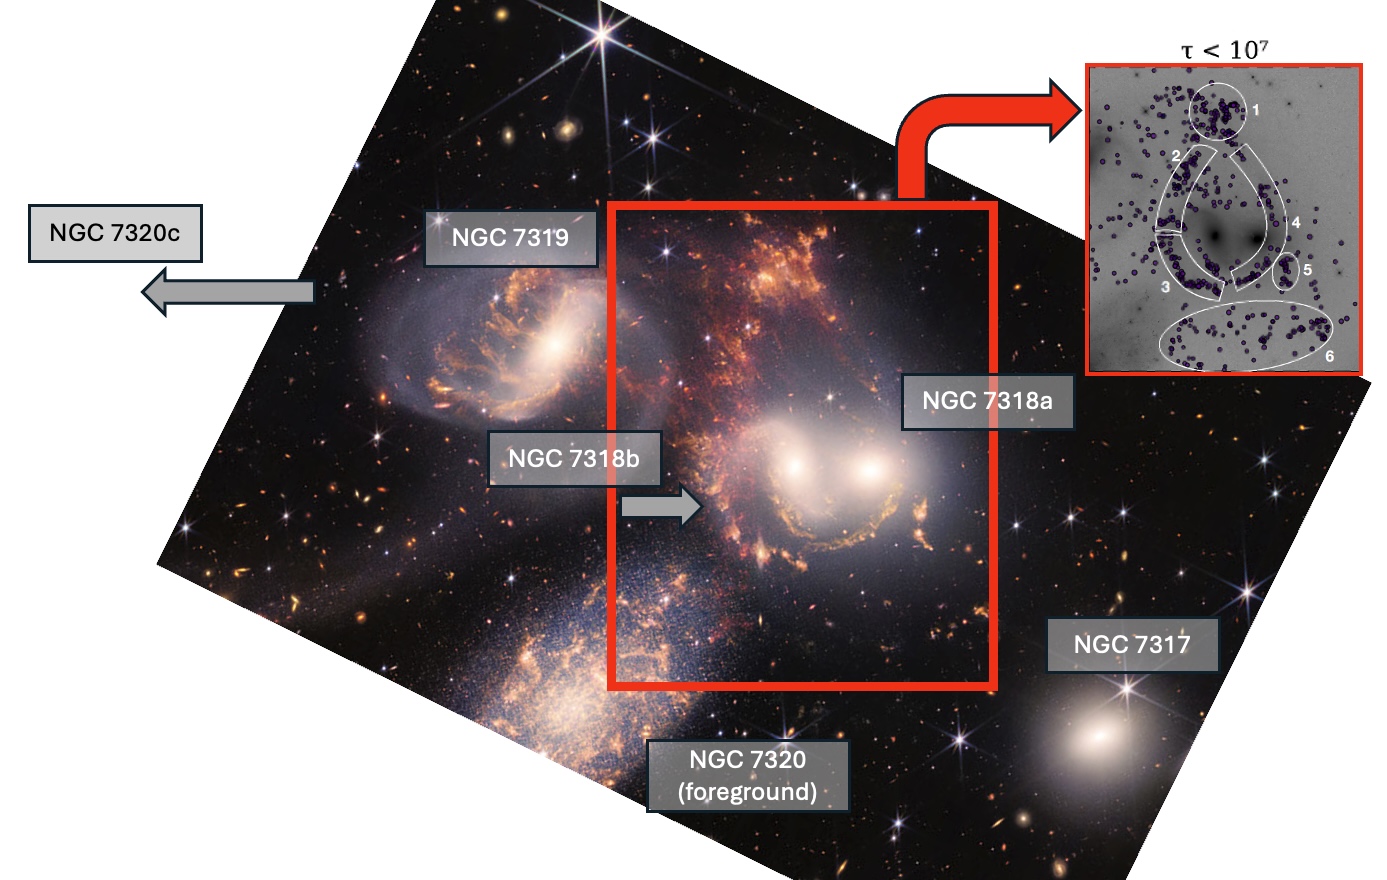
One image that was showcased was of Stephanβs Quintet (Figure 1), an actively interacting galaxy group. We were all immediately impressed by the clarity of the star-forming regions in the dense gas between the galaxies in the image. Now, more than three years later, the authors of todayβs article lay out a comprehensive study of the star clusters in those same regions, taking advantage of JWSTβs multi-wavelength imaging capabilities.
Figure 1: The JWST imaging of Stephanβs Quintet with member galaxies labeled (including NGC 7320C, which is outside of the field of view). Gray arrows indicate the direction the associated galaxy is moving. The inlaid image shows the distribution of young star clusters in relation to the six main tidal features in the group. [Inset image: Adapted from Aromal et al. 2025; Background image: NASA, ESA, CSA, STScI]
HST + JWST = OMG!
While JWSTβs depth and resolution are exciting for those studying high-redshift galaxies, for local-universe astronomers JWST really shines when used in combination with the Hubble Space Telescope (HST). The star clusters in Stephanβs Quintet were already cataloged in 2015 using HST, but the filters used in the imaging only captured optical and very-near-infrared wavelengths. If you want to get enough data to be able to accurately estimate the ages of these star clusters, especially accounting for reddening caused by surrounding dust, you need to push your imaging further into the infrared.
Unlike HST, JWST can take images in two wavelength filters at once, meaning you can get more data with roughly the same observing time. Here the authors imaged the same star clusters that HST looked at with five new JWST filters, all at longer infrared wavelengths than HST. Together, the authors had flux measurements at 10 different wavelengths across the optical and infrared spectrum for each star cluster, meaning they could perform spectral energy distribution fitting.
Go Ahead, Guess My Age
The best way to estimate an unresolved star clusterβs age is to get its full spectrum of light and fit spectroscopic models with varying ages to it until the model matches the observations. But, if you have individual brightness measurements at many different, spread-out wavelengths, you can still fit spectral models to the measurements and make a best guess despite the gaps in your full spectrum. Here the authors compare their multi-wavelength data to Code Investigating GALaxy Emission (CIGALE) spectral energy distribution models, allowing both the cluster ages and amount of dust extinction to vary.
This is where the long-wavelength JWST imaging is most necessary, because it is sometimes difficult to determine a clusterβs age with this method. For instance, is the light a cluster is giving off mostly red because its stars are very old, or is it because its stars are actually bluer and younger and the cluster just appears red due to foreground dust?
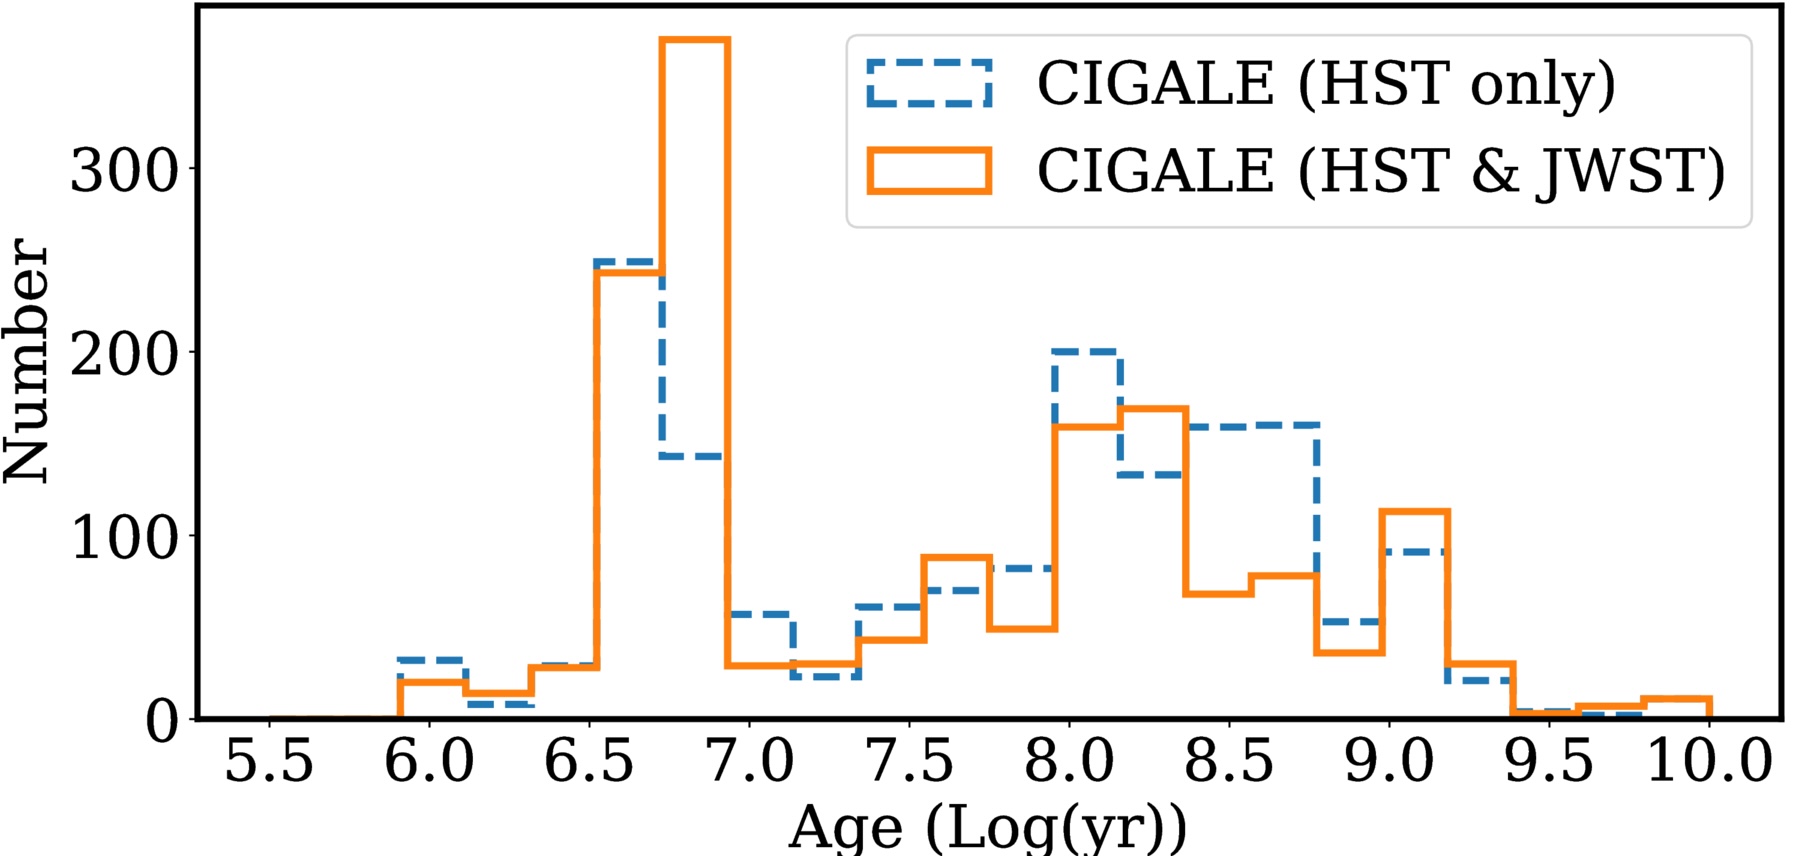
Infrared imaging can βsee throughβ any dust and break this ageβextinction degeneracy. For most of the clusters, the authors found that the original HST-only age estimates were accurate, but for 121 clusters in the sample (about 8% of the total), the JWST imaging made a significant change in the age estimates, shifting them to younger ages.
Where Do the Hip, Young Star Clusters Hang Out?
Once the authors had their updated ages for the clusters, they then mapped out where the clusters were located in Stephanβs Quintet and how these clusters traced the known tidal structures in the group. Tidal structures are structures, usually consisting of gas, dust, and stars, that are formed from the tidal forces galaxies exert on one another as they interact and merge. The authors found that throughout all tidal regions of Stephanβs Quintet, there were many young, low-mass star clusters, all about 3β5 million years old. This timescale lines up with previous studiesβ estimates of when NGC 7318B was thought to first fall into Stephanβs Quintet, compressing the gas in the group and creating tidal shocks that would trigger star formation.
Additionally, the authorsβ star cluster age distribution for the group (see Figure 2) has a second, broader peak of higher-mass clusters with ages around 200 million years. This would correspond to when the most recent encounter between NGC 7320C (which has now passed through the group and is out of frame in Figure 1) and NGC 7319 is estimated to have occurred.
Figure 2: A histogram of the ages of all the star clusters in Stephanβs Quintet. The blue dashed line shows the estimates using only the HST data, and the orange solid line shows the estimates using both HST and JWST together. Notice how a lot of the clusters around 108 years old turned out to be less than 107 years old. [Adapted from Aromal et al. 2025]
Taken together, the updated age measurements of the star clusters in Stephanβs Quintet provide not only a study of star formation history, but also of the galaxyβgalaxy interaction history in the system!
Looking Ahead
While the authors have improved the age estimates of the clusters in Stephanβs Quintet, there are still limitations to their analysis. Their estimated star formation rate for the group is much lower than that estimated with other tracers, such as H-alpha emission, meaning this study may still be missing a fraction of very young star clusters. The most likely culprits are embedded clusters that havenβt had enough time to expel the surrounding gas from the massive clouds they formed within.
Future work will attempt to identify these embedded clusters using near-infrared JWST imaging, since in this study the authors focused only on the previously HST-identified clusters. In addition, combining their JWST data with high-resolution radio observations taken with the Atacama Large Millimeter/submillimeter Array will allow them to study the gas in the group more closely and understand how it influences the star formation.
This work highlights JWSTβs excellent application to star cluster observations, building on the data we already have from decades of HST use, and it looks like weβre only just getting started!
Original astrobite edited by Skylar Grayson.
About the author, Veronika Dornan:
Veronika is a postdoctoral research associate at the University of Edinburgh. Her research is in observations of globular star clusters and how they can be used to study the evolution of their host galaxies.
The post Astronomers Hate Them! This Star Formation Ingredient Makes Clusters Look 300 Million Years Older appeared first on AAS Nova.

Outflows, Shocks, and Star Formation in Messier 82
![]()
Editorβs Note: Astrobites is a graduate-student-run organization that digests astrophysical literature for undergraduate students. As part of the partnership between the AAS and astrobites, we occasionally repost astrobites content here at AAS Nova. We hope you enjoy this post from astrobites; the original can be viewed at astrobites.org.
Title:Β Stars Born in the Wind: M82βs Outflow and Halo Star Formation
Authors: Vaishnav V. Rao et al.
First Authorβs Institution: University of Michigan
Status: Published in ApJ
Outflows and Star Formation
Some galaxies, known as starburst galaxies, form stars at exceptionally high rates. High star formation rates mean, you guessed it, lots of new stars! The most massive stars live comparatively short lives and can die in a brilliant cosmic explosion known as a supernova. So, when you have a starburst galaxy, you get lots of young stars, a fraction of which produce supernovae. While these stellar explosions occur on relatively small scales, they can collectively drive galactic-scale expulsions of gas and dust known as outflows.
Outflows expel gas laden with metals out of the galaxy, playing a pivotal role in the evolution of galaxies. They can also drive additional star formation in the areas surrounding the galaxy, which is exactly what todayβs authors are interested in. Messier 82 (M82), a quintessential local starburst galaxy, is the focus of todayβs article (see Figure 1). M82βs proximity makes its spectacular outflows a prime testing ground for studying the impact of outflows on a galaxy and its surroundings.
Figure 1: An image of the local starburst galaxy M82, taken by the Subaru Telescope. The Hubble Space Telescope field encompassing the Southern Arcs is highlighted as a green box. [Rao et al. 2025]
The Southern Arcs of M82
The main focus of todayβs article are arc-like groups of stars called the Southern Arcs that are located near M82βs southern outflow. Using photometry from the Hubble Space Telescope, todayβs authors derive star formation histories for the Southern Arcs, with the goal of understanding the impact that M82βs outflows have had on star formation in its halo. Figure 1 shows the Southern Arcs region of M82 highlighted in green alongside an image of M82.
Star Formation Histories
If youβve ever taken an astronomy class, youβre probably familiar with the HertzsprungβRussell (HR) diagram. HR diagrams are one of the most powerful tools available to astronomers, as they encode a ton of information regarding populations of stars and their formation. In practice, astronomers can construct HR diagrams using resolved stellar populations. That is, if you can resolve individual stars in a galaxy, you can construct a colorβmagnitude diagram, which is essentially the HR diagram you may be familiar with, but uses observed properties as a proxy for temperature (color) and luminosity (magnitude).
Todayβs authors use the colorβmagnitude diagrams of the Southern Arc to derive star formation histories for the region. Star formation histories describe the star formation rate as a function of time, providing an insight into when and how stellar populations formed. To derive the Southern Arc star formation histories, the authors use the MATCH colorβmagnitude diagram fitting code, which determines the combination of stellar populations that reproduce the observed colorβmagnitude diagram, accounting for observational biases along the way. Figure 2 shows the star formation histories obtained using three different stellar evolution models. The authors find that about 85% of the stellar mass in the Southern Arc field formed sometime between 70 and 150 million years ago before star formation slowed down. About 30 million years ago, star formation picked up again, producing the rest of the stellar mass in the Southern Arc field.
Figure 2: The star formation history (left) and cumulative star formation history (right) of the Southern Arc region. Different stellar evolutionary models are marked in different colors. The star formation history shows the star formation rate as a function of time, while the cumulative star formation history shows the buildup of the stellar mass as a fraction of the total mass observed now. [Rao et al. 2025]
So, Whatβs the Deal with the Southern Arcs?
The authors explore two mechanisms that could explain the star formation histories. In the first scenario, M82βs outflows trigger star formation when impacting the cooler circumgalactic gas. When the outflow shocks collide with the cooler gas, it causes it to collapse and form stars. In the second scenario, star formation is occurring within the outflows themselves. Figure 3 is a schematic of the two proposed mechanisms.
Figure 3: A schematic outlining the two possible mechanisms for the formation of the Southern Arcs. The left panel shows the scenario in which shocks produced by the outflow collide with gas in the circumgalactic medium, triggering star formation. The right panel shows the scenario in which star formation is triggered within the outflow itself. [Rao et al. 2025]
Original astrobite edited by Jessie Thwaites.
About the author, Drew Lapeer:
Drew is a first-year PhD student at the University of Massachusetts Amherst. They are broadly interested in the evolution of galaxies, with a focus on the impact of cosmic feedback on the galactic ecosystem. In their free time, they enjoy reading, rock climbing, hiking, and baking!
The post Outflows, Shocks, and Star Formation in Messier 82 appeared first on AAS Nova.
Bed Bugs Took Over When Humans Built the First Cities. They Never Left Us Since
Oldest Wine in the World Is Still Liquid Inside 2,000-Year-Old Roman Funeral Urn
- ZME Science
- This Medieval Wax Notebook Survived 800 Years in a Latrine and Itβs Perfectly Preserved
In 1908, a Dog βRescuedβ Children From the Seine β After Pushing Them In First
How Did Humans Learn Which Plants Are Safe To Eat? Food Scientists Explain
Satanβs Lies Are More Believed Now Than Ever Before


World Population from Creation to the Flood to the Present and Beyond


Understanding the Age of the Earth from a Young Earth Perspective