❌

Normal view

Thermal Electrons Can Explain the Mysterious Radio Behavior of a Tidal Disruption Event

8 September 2026 at 17:00

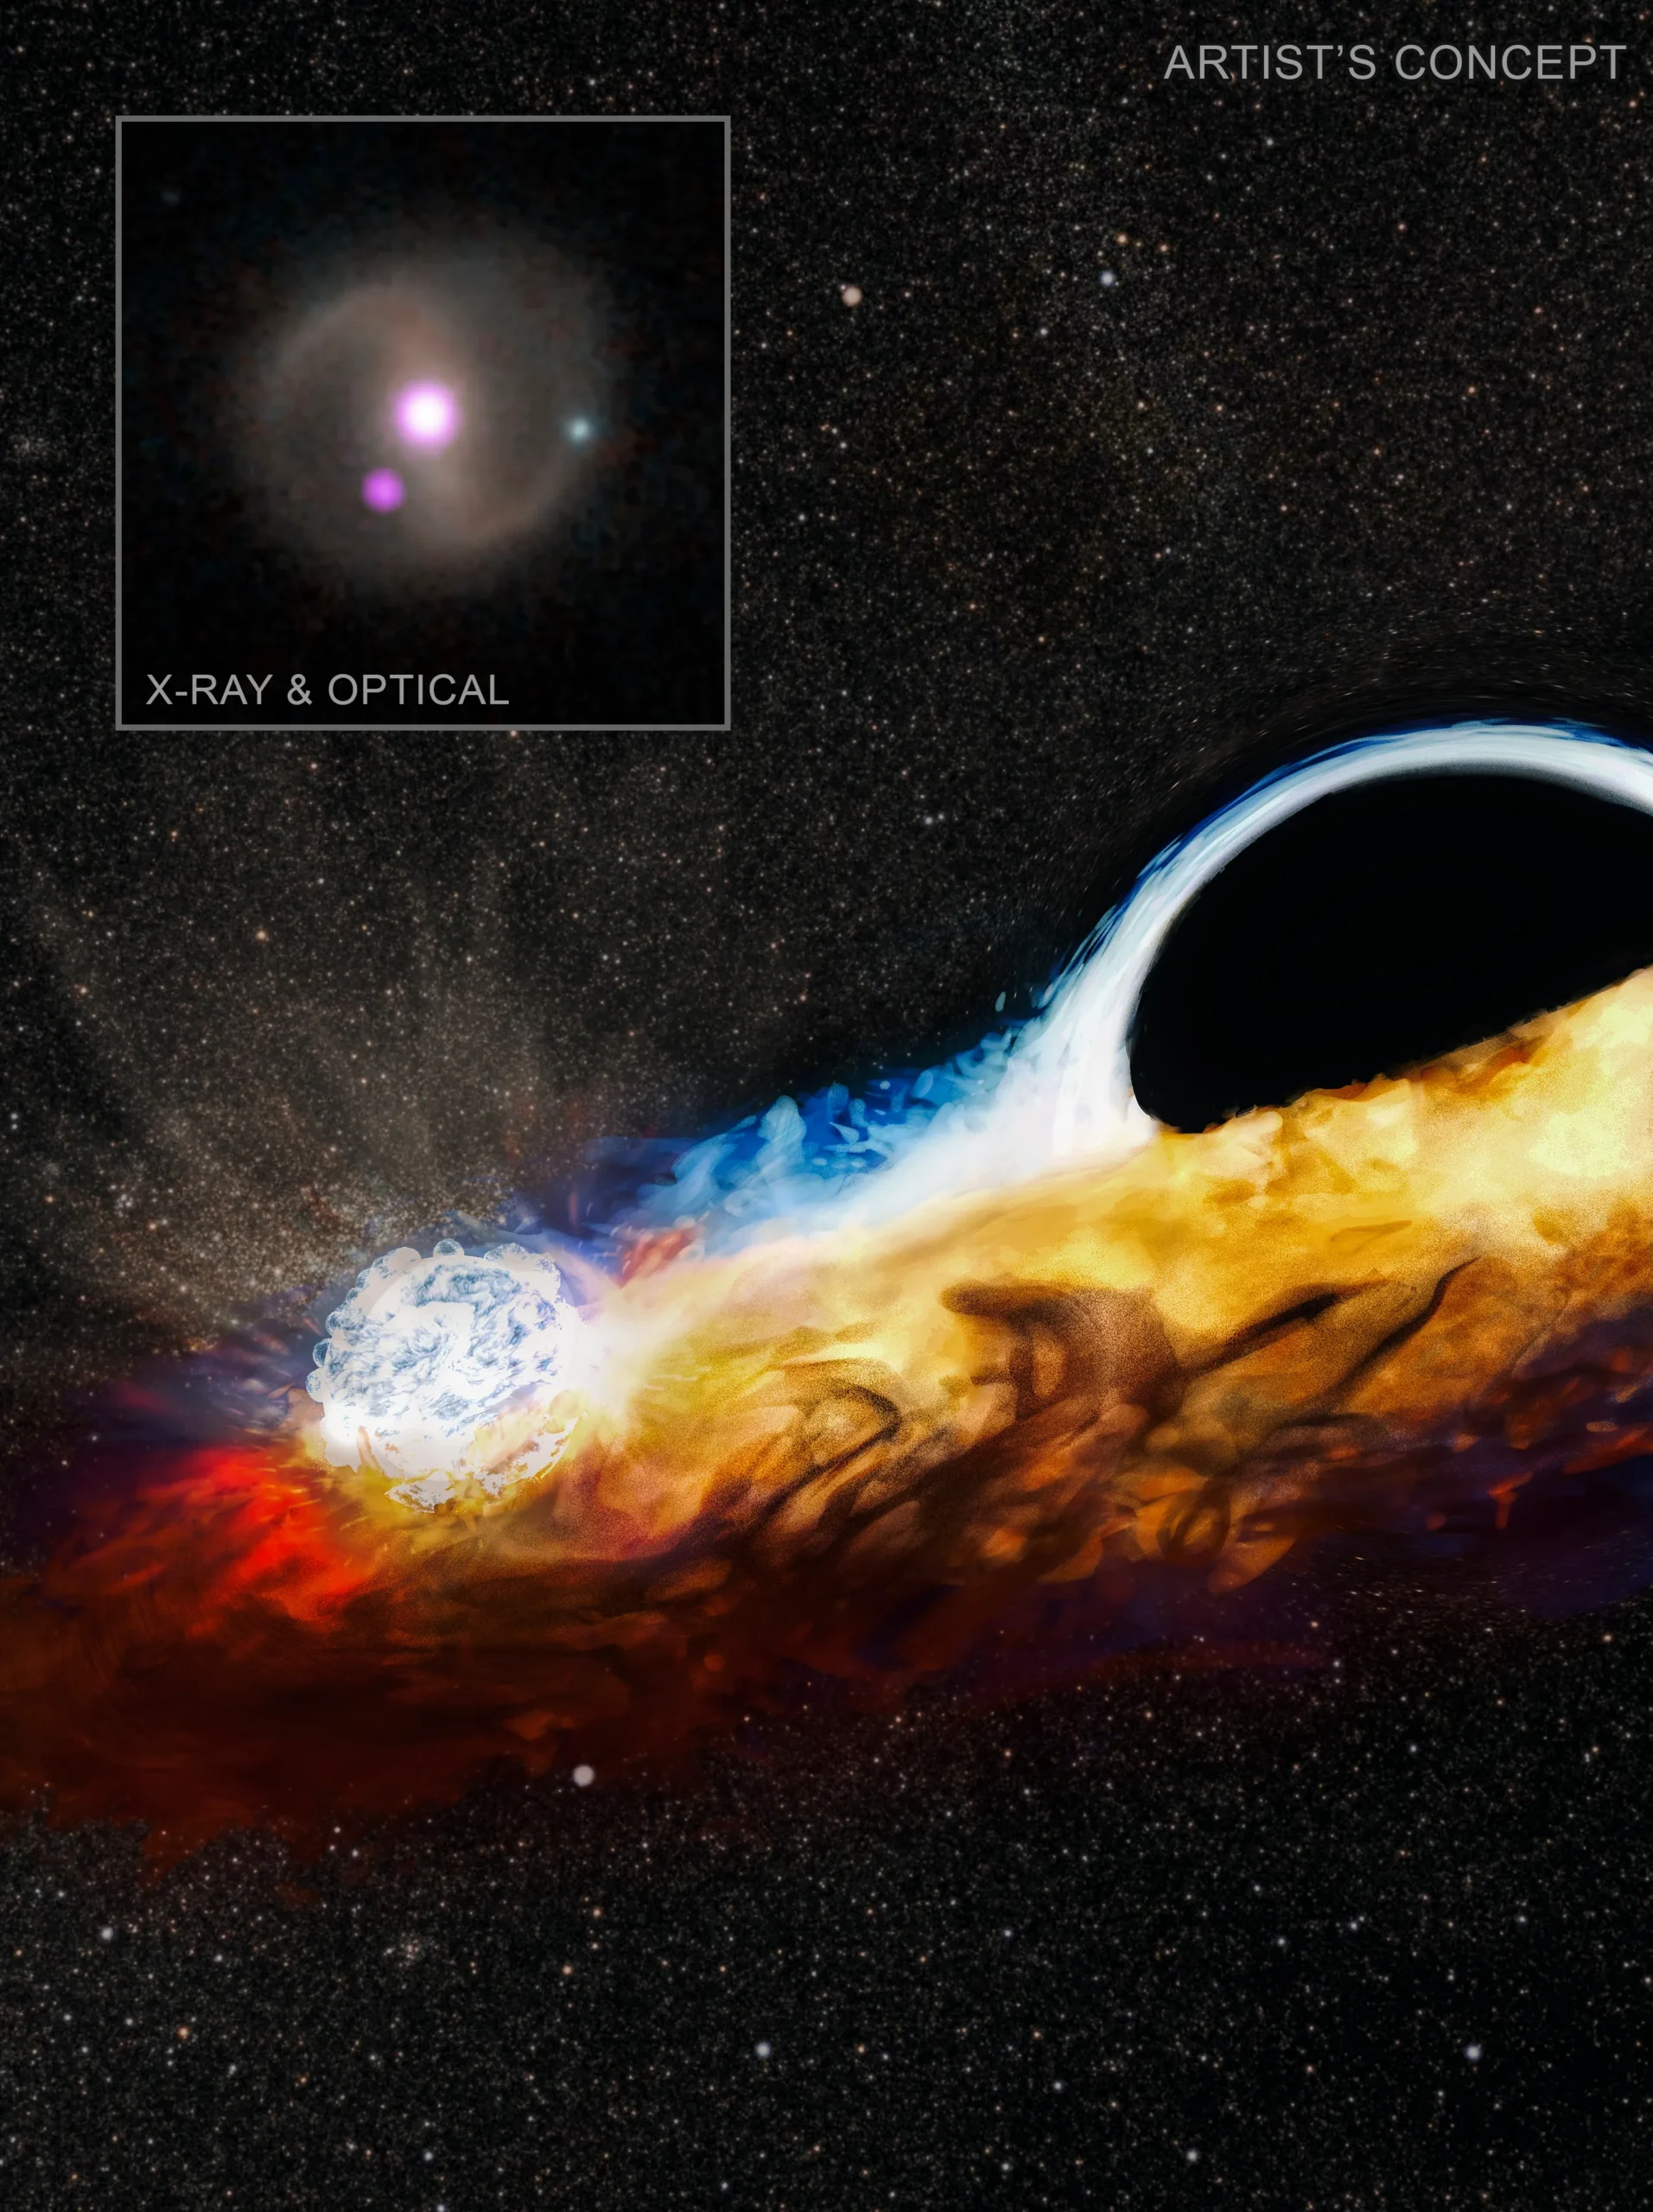
illustration of a tidal disruption event

Editor’s Note: Astrobites is a graduate-student-run organization that digests astrophysical literature for undergraduate students. As part of the partnership between the AAS and astrobites, we occasionally repost astrobites content here at AAS Nova. We hope you enjoy this post from astrobites; the original can be viewed at astrobites.org.

Title: Thermal Electrons in the Radio Afterglow of Relativistic Tidal Disruption Event ZTF22aaajecp/AT 2022cmc
Authors: Lauren Rhodes et al.
First Author’s Institution: McGill University
Status: Published in ApJ

Tidal disruption events (TDEs, see Figure 1), which occur when a star gets a little too close to a supermassive black hole (SMBH) and gets ripped apart, are a hot topic across the electromagnetic spectrum. During a TDE, the star can no longer hold itself together under the gravitational pull of the SMBH. Some bits of the star end up accreting onto the black hole, which can launch a temporary outflow, or, in especially dramatic cases, a relativistic jet.
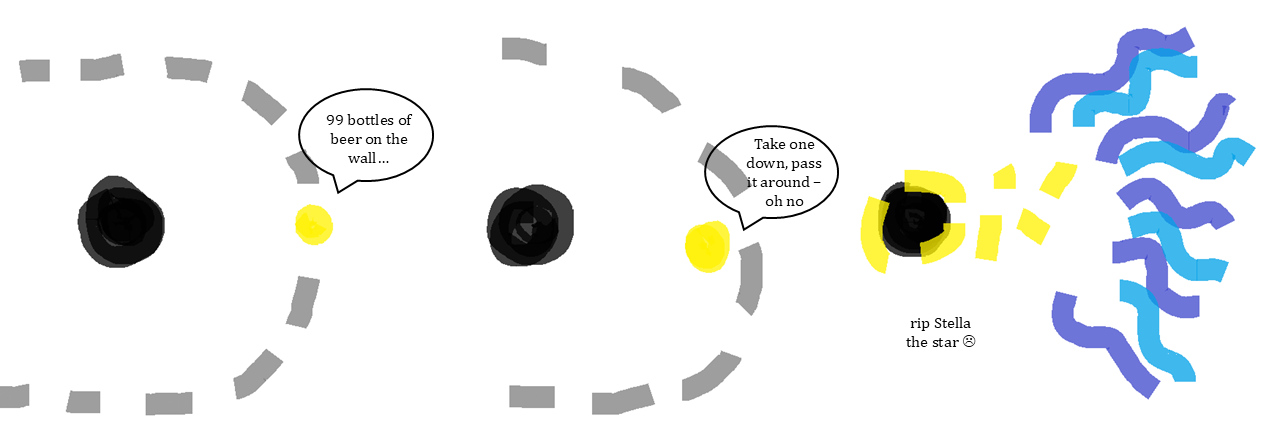
cartoon of a star orbiting a black hole, getting to close, and being ripped apart

Figure 1: Timeline of events leading to a tidal disruption event. [Chloe Klare]

Aside from being cool transients (as far as spectacular stellar deaths go, they are rivaled only by the supernova), TDEs are valuable to study for a variety of reasons. They likely play a role in galaxy evolution, SMBH growth, and even the life cycles of active galactic nuclei (AGN, in which material is constantly swirling onto the SMBH). Not to mention, they are a great tool for eyeballing the mass of the SMBH responsible for the TDE; if the black hole is any bigger than about 1 billion times the mass of the Sun, its event horizon — the point at which not even light can escape its gravity — extends too far, and a star will disappear across the event horizon before it ever gets ripped apart.

How to Spot a TDE

Usually, TDEs are discovered in the X-ray (after all, not many transients are powerful enough to generate an X-ray flare) or in the optical (thanks to high-cadence, wide-field surveys like the Zwicky Transient Facility and the Legacy Survey of Space and Time). However, radio is a particularly useful regime for TDE searches, especially in dusty host galaxies where we cannot see the optical TDE signatures at all; while dust obscures optical light, the radio is unaffected! There is just one catch: how exactly can we identify a TDE based on only its radio emission?

The radio light in a TDE is generated via synchrotron radiation — which is caused by fast moving electrons in strong magnetic fields — and originates in jets or shocks. Unfortunately, this is also the case in AGN, the primary extragalactic source of variable radio emission, and it can be difficult to distinguish between the two. Additionally, the amount of light we see from synchrotron radiation at a given frequency depends on how energy is distributed among the electrons in the source, which is unknown. Perhaps the simplest case — or at least the one you’ll learn about first in your undergraduate statistical mechanics course — is that the energy is distributed among the electrons thermally (left panel in Figure 2). However, most radio transients associated with black holes are assumed to have non-thermal electron energy distributions, usually where there are exponentially many more low-energy electrons than high-energy electrons (right panel in Figure 2).
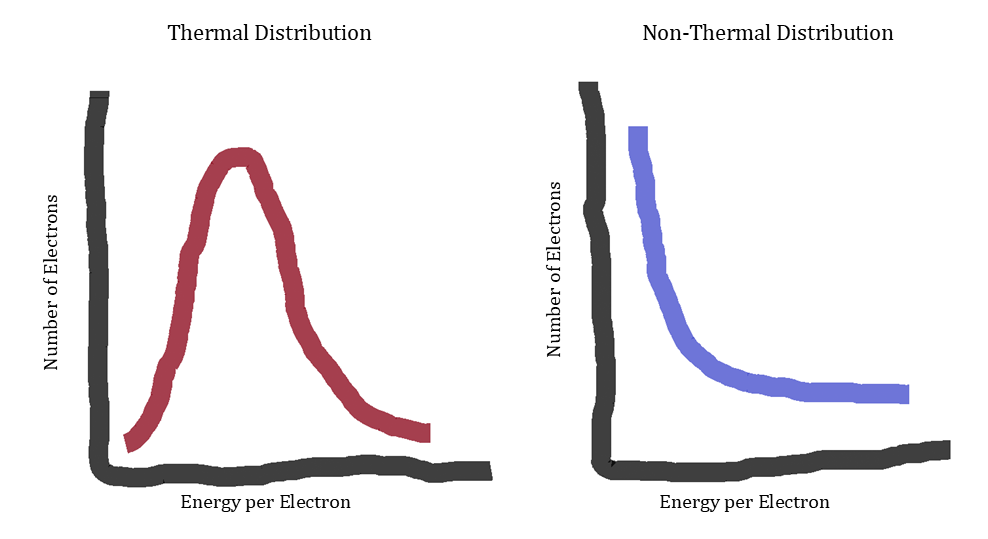
cartoon showing thermally distributed and non-thermally distributed electrons

Figure 2: Energy can be distributed among the electrons in a source either thermally (left panel), where most electrons have a medium amount of energy, or non-thermally (right panel), where most electrons have a small amount of energy. Often, extragalactic radio transients are assumed to originate from non-thermal electrons, but today’s article argues why we shouldn’t ignore thermal electrons. [Chloe Klare]

As a further challenge, very few TDEs have had extensive follow-up observations in the radio, so we don’t have strong constraints on how most TDEs should behave, especially in the long term. Luckily, some astronomers are working to change this.

This includes today’s authors, who have focused on one particular TDE, ZTF22aaajecp/AT2022cmc (I’m sure everyone mispronounces her name), or 2022cmc for short. 2022cmc is a special TDE: it is one of only five TDEs suspected to have launched a relativistic jet, and it has the highest redshift (z ~ 1.2) of the five. It was observed first in the optical and then in the X-ray and radio. The X-ray emission was highly variable for 400 days post-TDE, and then disappeared, and the first 100 days of radio emission indicated there was a relativistic outflow. At the time, it was concluded that the jet shut off and the X-ray emission ceased. However, the story doesn’t end there; the authors of today’s article continued to observe 2022cmc in the radio for an additional 900 days at frequencies spanning about 1–100 GHz.

Our authors had two key observing strategies: wide frequency coverage and long duration. Measuring the change in brightness with observing frequency, or the spectral energy distribution (SED), is important for determining which processes are responsible for the radio emission, since thermal electrons and non-thermal electrons will produce different SEDs. On the other hand, measuring the change in brightness over time, or the light curve, is important for determining what is happening at the source, such as whether there is a jet and, if so, how long it lasts. Here, our authors combine light curves at six different frequencies (Figure 3) and SEDs at nine different epochs (Figure 4) to investigate both.
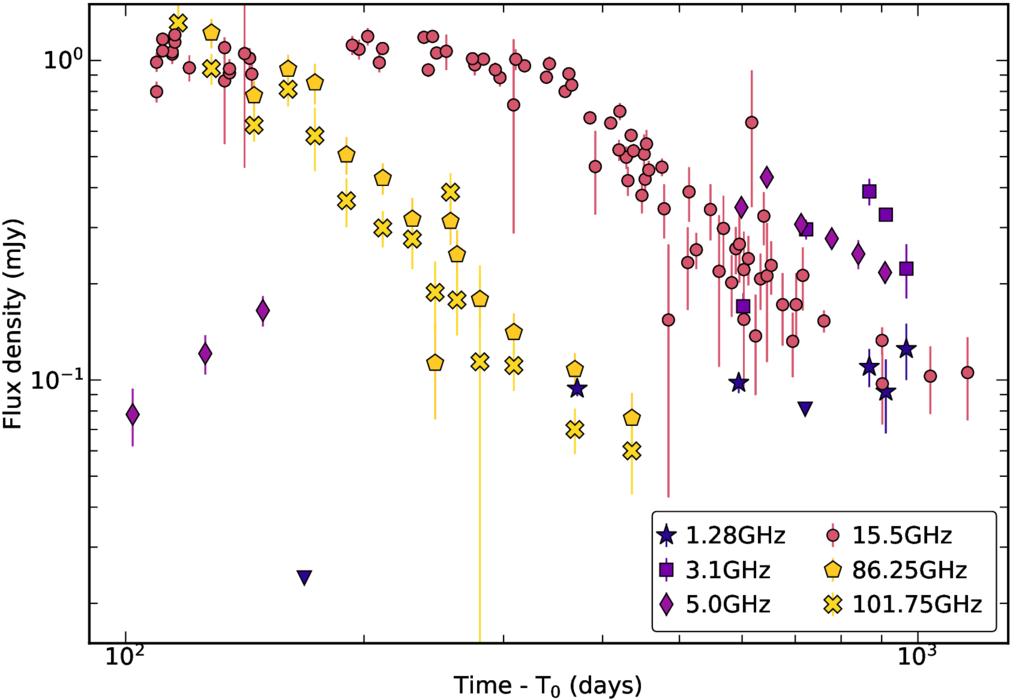
Plot of flux density over time

Figure 3: Light curves spanning six frequencies and 900 days obtained by today’s authors. [Rhodes et al. 2025]
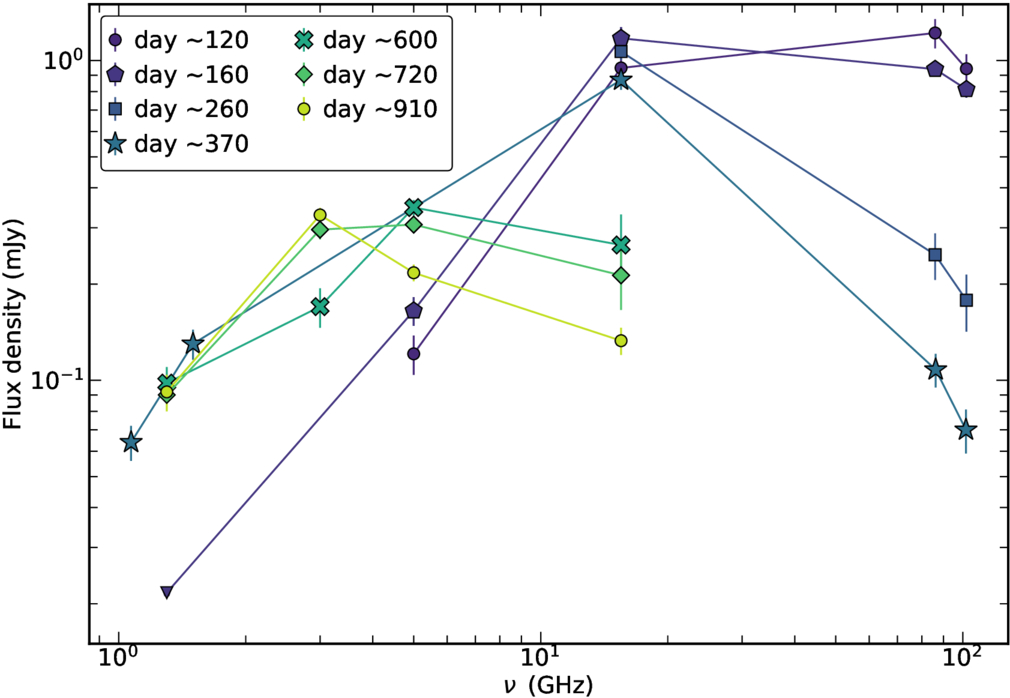
Plot of flux density as a function of frequency

Figure 4: Nine epochs of radio SEDs, which show the peak moving to lower frequencies over time. [Rhodes et al. 2025]

The Findings

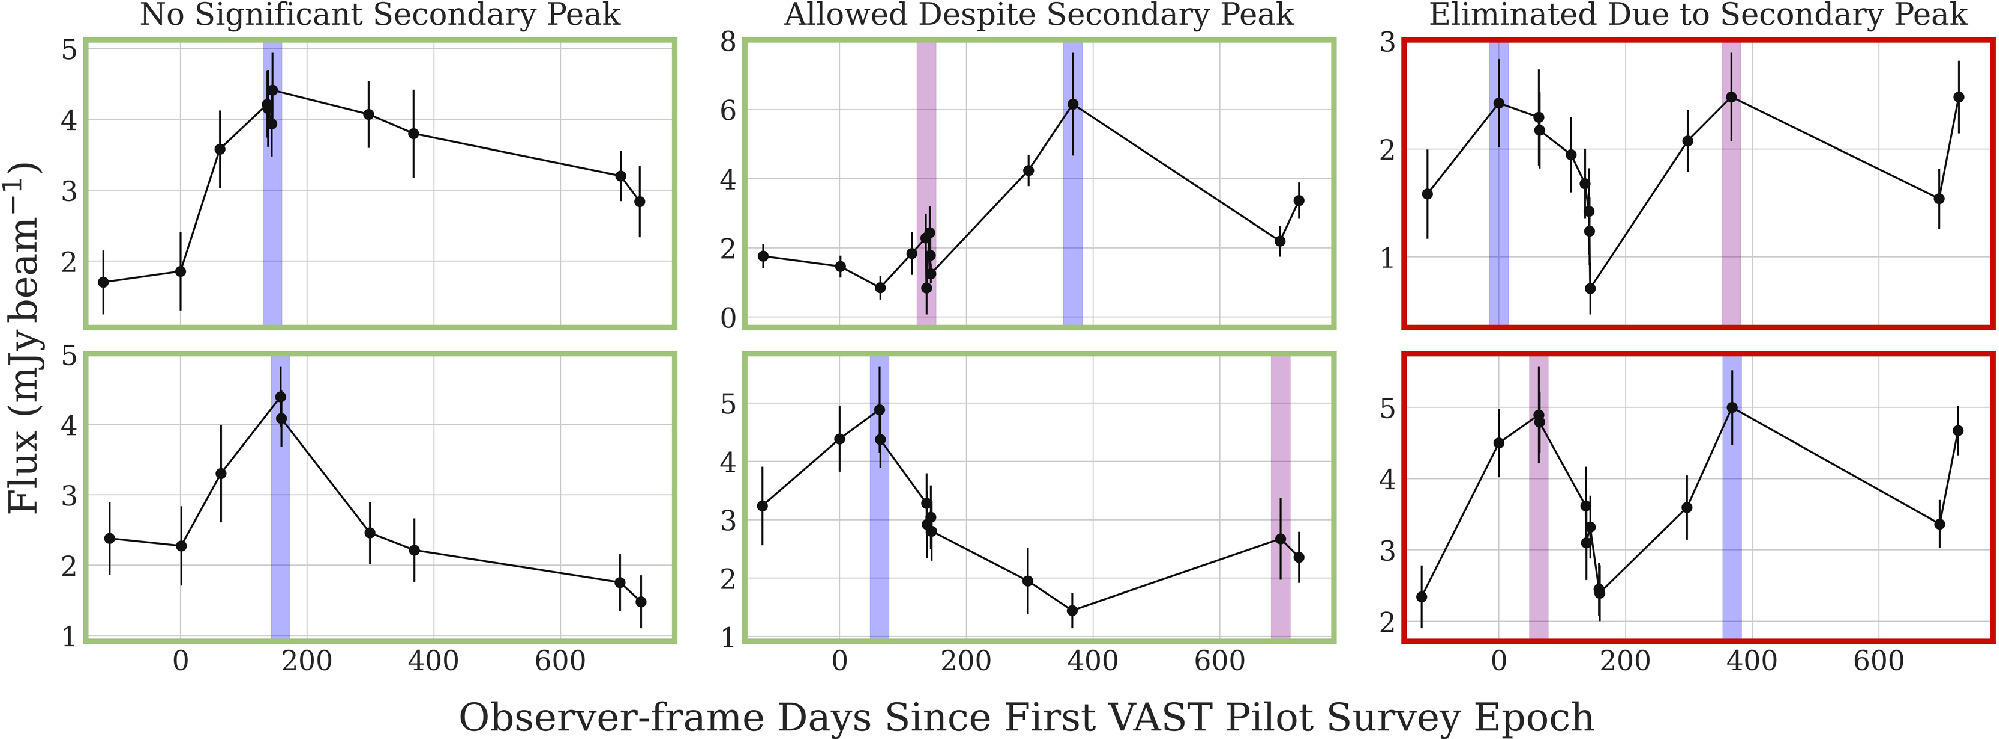
Our authors find a couple of interesting results. First, in the time domain, they find the highest-frequency light curves fade with time, while the lower-frequency light curves increase initially, hit peaks at different times (after 300 days at 15.5 GHz, and after 800 days at 1.3 GHz), and then begin to decay. The spectral evolution is even more intriguing; the SED is always peaked, and the peak shifts to lower frequencies over time, which is typical for an expanding emission region. At frequencies below the peak, the SED doesn’t change much. However, the high-frequency side of the SED shows confusing behavior: early on, it has a very steep slope (the amount of light drops off sharply at higher frequencies), but it eventually flattens.

Investigations Begin

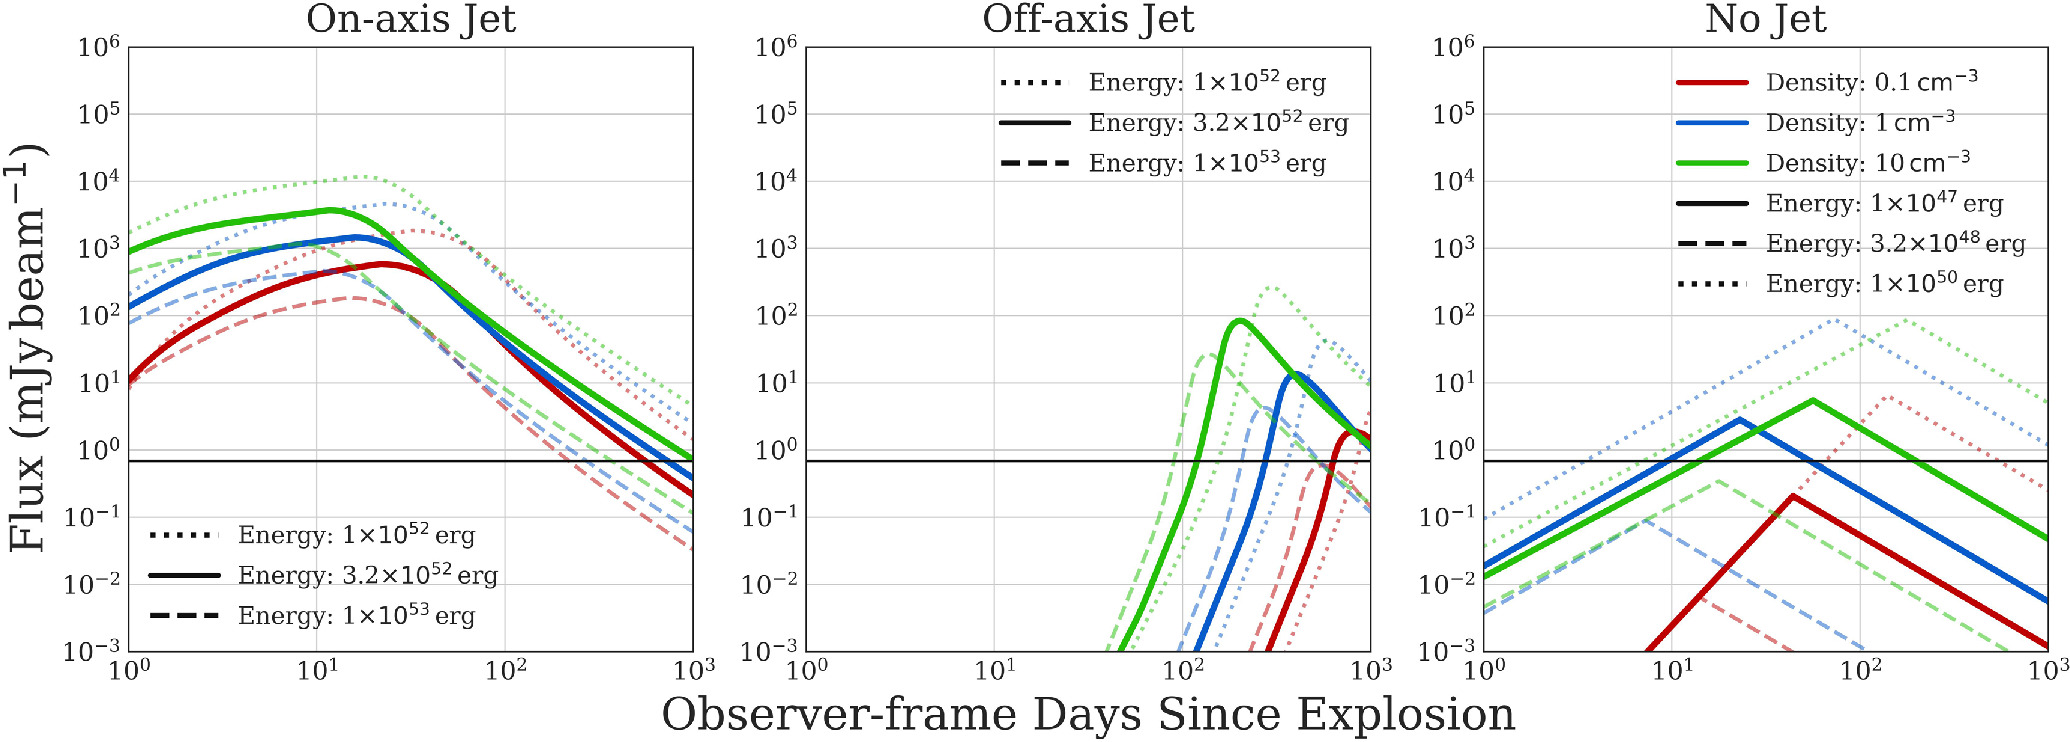
Next, our authors consider three possibilities to explain these observations. They first consider synchrotron radiation from only non-thermal electrons in a relativistic jet (Figure 5), which is the canonical model for a gamma-ray burst radio afterglow. Initially, the jet is so fast that all its radio light is relativistically beamed in one direction (like a flashlight), and we can only see the jet if it’s pointed directly at us. Eventually, the jet slows down enough that it is no longer beamed, and light is emitted in all directions (like a light bulb). At this point, we see the light fade over time, which is exactly what happened in the high-frequency light curves. However, there is one glaring problem: this model cannot possibly explain the observed long-lasting steep SED at high frequencies. So, our authors discard this theory.

cartoon showing the jets of a black hole with and without relativistic beaming

Figure 5: The left image shows what a black hole–generated jet looks like in the rest frame of the jet itself. As long as the jet isn’t moving too fast, this is what we see too. However, if the material in the jet is moving near the speed of light, we observe a relativistically beamed jet (right image). [Chloe Klare]

Instead, our authors consider a jetted outflow that has non-thermal and thermal electrons both independently generating synchrotron emission1, giving us the superposition of two radio spectra. This model also doesn’t fit the data well. The peak of the SED moves too slowly, a very dense local environment is required, and, once again, the authors cannot reconcile that steep high-frequency SED.

Lastly, our authors keep the thermal/non-thermal electrons combo and ditch the jet entirely, modeling a spherical outflow. Excitingly, this model best fits the observations, and, most importantly, can explain the mysterious high-frequency behavior. Initially, most of the radio emission originates in the thermal electron population, which produces more light at higher frequencies. As the outflow expands, the non-thermal electrons begin to dominate, and the SED transforms into the classic non-thermal synchrotron shape.

Next Steps

Ideally, our authors want to compare 2022cmc to other TDEs, but few TDEs have such thorough follow-up observations. They speculate that thermal electrons were important in the radio evolution of one of the few such TDEs, Swift J1644, and recommend we revisit its emission models. More broadly, they recommend two future priorities: first, we need extensive radio observations for larger samples of TDEs, especially around 100 GHz, where the thermal electrons contribute most to the SED; secondly, we should stop neglecting thermal electrons not just in TDE models, but in models of any black hole jets, including gamma-ray bursts and X-ray binaries. While this work addresses only one event, one thing is clear. For theorists and observers alike, there is a myriad of exciting work to be done, so it’s no wonder TDEs have garnered so much attention lately.

  1. A convenient property of extragalactic synchrotron sources is that all their electrons radiate independently of one another, even if they are part of the same electron population. This is called incoherent emission. (Galactic sources are another story, but I’ll save that for another time.) ↩︎

Original astrobite edited by Flavia Pascal.

About the author, Chloe Klare:

I’m a PhD student in astronomy and astrophysics at Penn State (with a physics minor, so I get to use my semester spent in QFT for something!). I study active galactic nuclei (in the radio!), and I’m currently looking for baby synchrotron jets in active galactic nuclei.

The post Thermal Electrons Can Explain the Mysterious Radio Behavior of a Tidal Disruption Event appeared first on AAS Nova.
Monthly Roundup: The Fourth Catalog of Gravitational Wave Events from LIGO, Virgo, and KAGRA

29 July 2026 at 17:00

Illustration of gravitational waves emanating from a pair of black holes approaching a merger

A recent Focus Issue of the Astrophysical Journal Letters describes the fourth version of the catalog of gravitational wave events (GWTC-4.0) from the Laser Interferometer Gravitational Wave Observatory (LIGO), the Virgo interferometer, and the Kamioka Gravitational Wave Detector (KAGRA).

This catalog contains transient gravitational wave events recorded through January 2024, during the observatories’ fourth observing run, which concluded in November 2025. GWTC-4.0 displays the results of significant improvements to our suite of gravitational wave detectors, including higher-powered lasers and reduced quantum noise. A fifth catalog of gravitational wave events was released in Spring 2026, with the accompanying scientific articles being submitted to the Astrophysical Journal and the Astrophysical Journal Letters.

This Monthly Roundup consists of short descriptions of each of the currently published research articles in the LIGO–Virgo–KAGRA Gravitational Wave Transient Catalog (GWTC): Release 4 Focus Issue. Each snippet links to the corresponding research article, and the Focus Issue landing page is linked at the bottom of this post. Be sure to revisit the landing page to catch new articles as they’re published!

Introducing GWTC-4.0

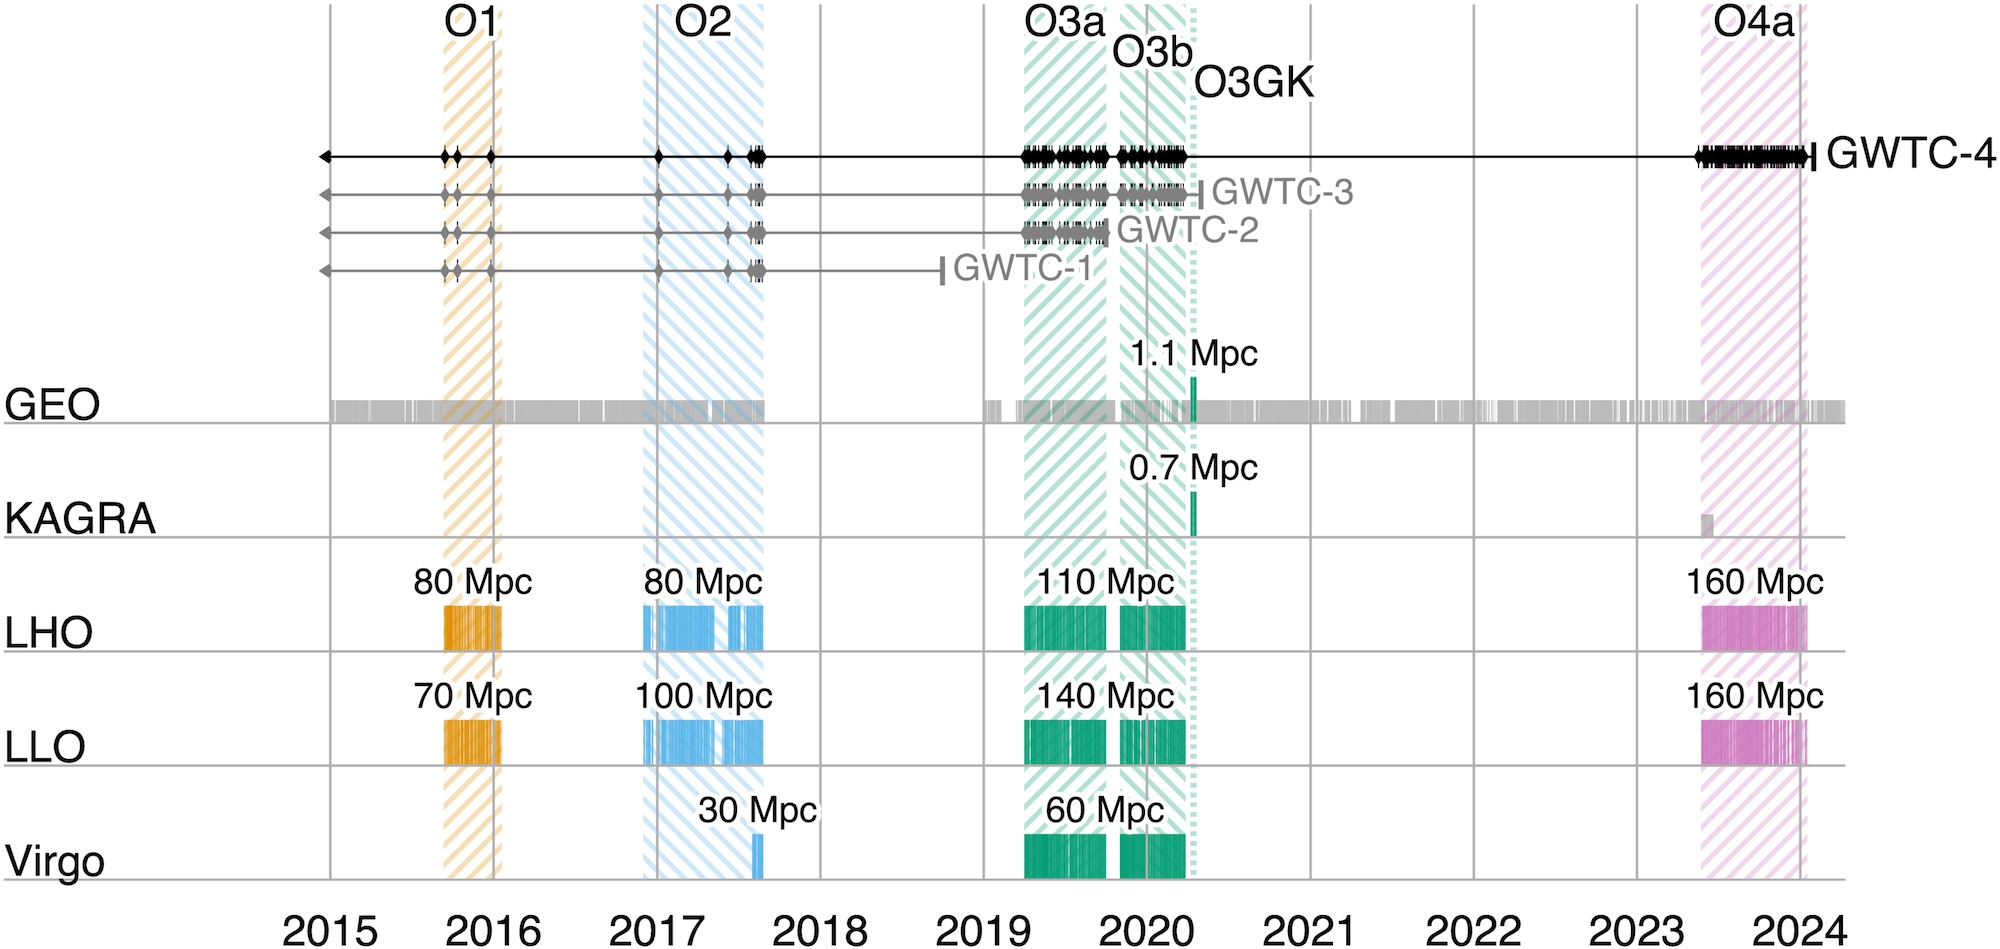
timeline of gravitational wave observatories' observing runs

A timeline showing observing runs between 2015 and 2024. Click to enlarge. [LVK Collaboration 2025]

First up, the collaboration orients the reader to many important aspects of the catalog and the articles contained in the Focus Issue. This article describes how four detectors, each with two arms 3–4 kilometers long, monitor gravitational waves from Hanford, Washington; Livingston, Louisiana; Santo Stefano a Macerata, Italy; and Hida, Japan. These detectors work in concert, ready to receive signals from the universe during coordinated observing runs separated by periods of downtime for construction and commissioning. During these pauses, a smaller instrument, the German–British GEO600 gravitational wave detector, has kept an ear out for signals and will continue to do so until the end of 2026.

After these detectors record subtle spacetime squiggles from compact objects colliding millions to billions of light-years away, the collaboration converts the raw signals into the data contained in catalogs like GWTC-4.0. This process involves modeling the gravitational wave signals, filtering them to identify candidate transients, and pinpointing the most significant events.

After collecting and cleaning the signals, the collaboration undertakes a critical step: making their data accessible to researchers and the public. The data are available through the Gravitational Wave Open Science Center, and the Focus Issue article on open data describes how to navigate the online portal, how the datasets archived online are structured, and how the data were calibrated.

Science Results

This fourth version of the gravitational wave transient catalog greatly expands the sample of gravitational wave transients recorded by detectors across the globe. Including events from previous catalogs, GWTC-4.0 brings us to 218 events for which the probability of the source being astrophysical in nature is more than 50% and for which there is little chance of the signal being an instrumental artifact. This represents a more than 100% increase in the number of recorded gravitational wave events fulfilling this criterion, broadening our understanding of colliding compact object pairs. This release also includes some superlative signals, such as the most massive black hole binary with a low false-alarm rate and the highest signal-to-noise ratio for a gravitational wave event thus far.

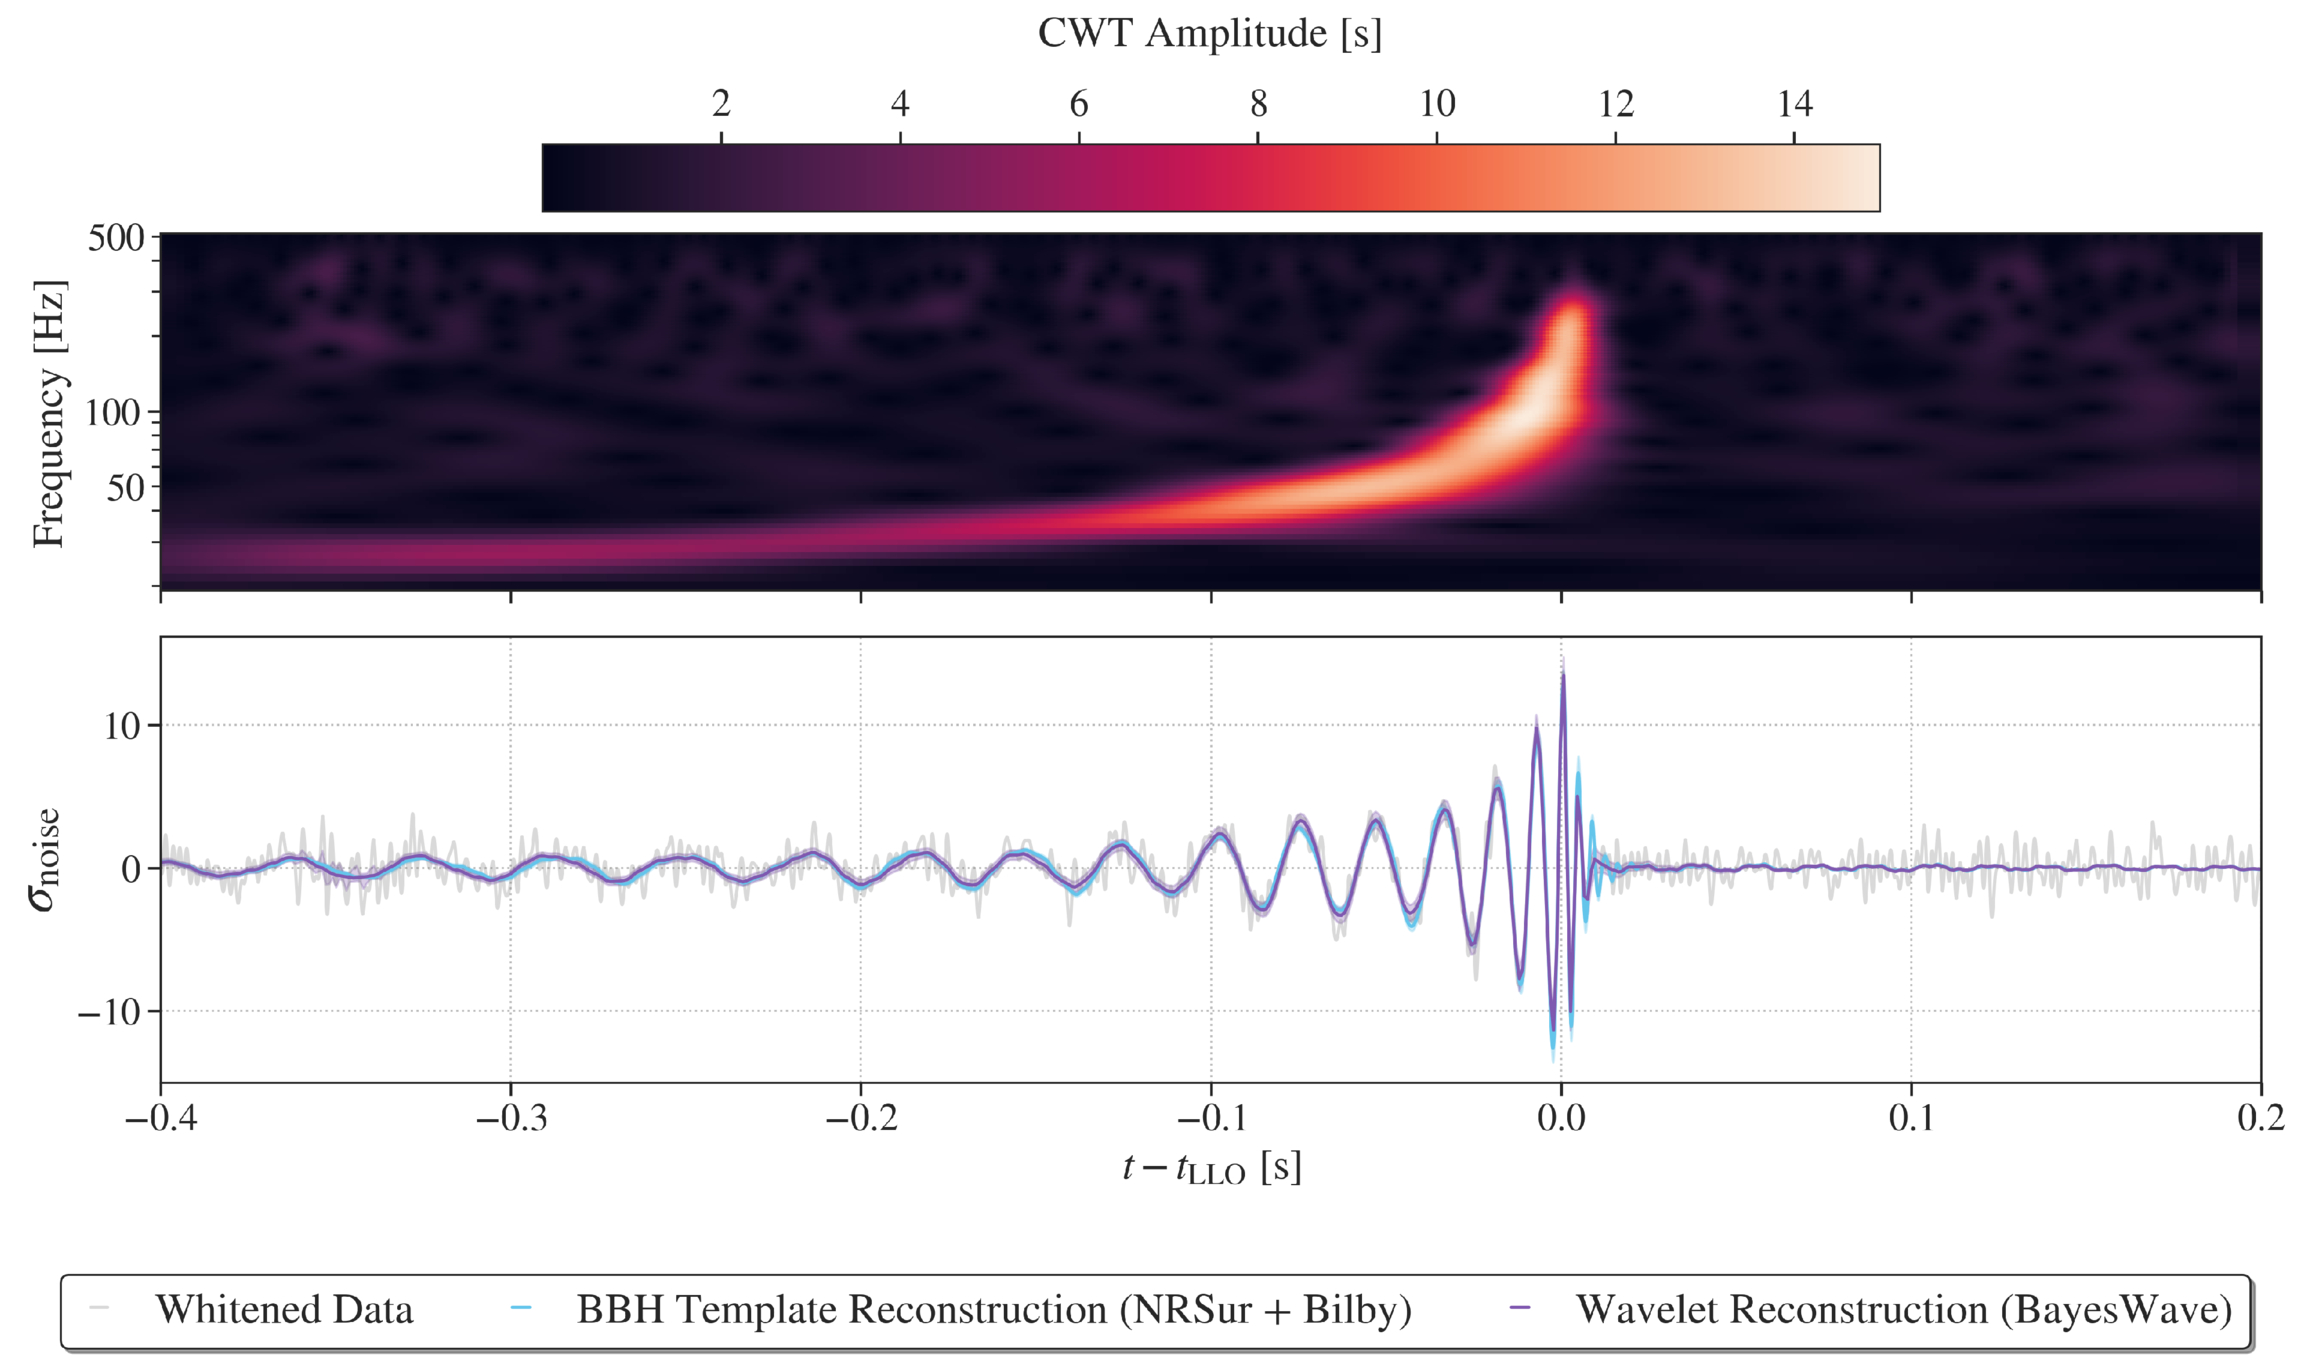
Detected in November 2023 by both LIGO Hanford and LIGO Livingston, GW231123 is in many ways an exceptional gravitational wave transient. The total mass of the merging components appears to be between 190 and 265 solar masses, and the false-alarm rate for this signal is less than one per year. This makes it the most massive merger event with such a low false-alarm probability. The two components also appear to have high spins, which complicates the interpretation of the signal with existing models. A binary black hole merger in which one or more components lies within the pair-instability mass gap is the likeliest explanation for this signal, but the authors also present alternative scenarios, such as a core-collapse supernova or a gravitationally lensed gravitational wave signal.

GW230814 gravitational wave signal

Representations of the GW230814 gravitational wave signal. Click to enlarge. [LVK Collaboration 2026]

GW230814, which was detected only by LIGO Livingston, is the loudest signal in the catalog. This signal is consistent with the collision of two black holes, each of roughly 30 solar masses. During the analysis of this signal, the team discovered potential deviations from the predictions of general relativity in the ringdown phase, when the remnant black hole settles into its final shape. Without a detection from another facility to corroborate this finding, it’s difficult to pinpoint the cause of the deviation, but the team could not rule out statistical noise fluctuations as the source.
Plot of the differential merger rate

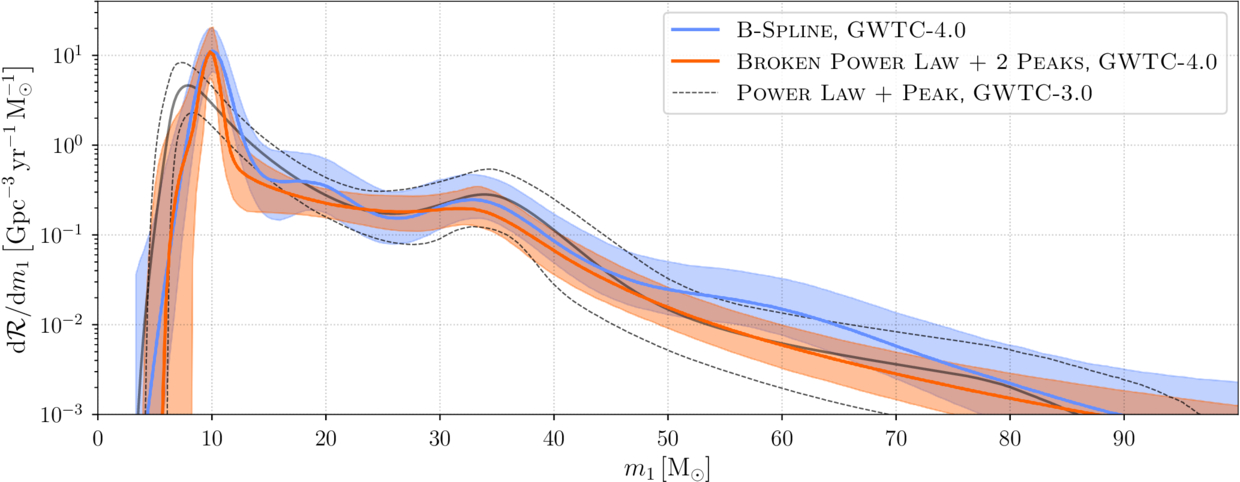
Plot of the differential merger rate as a function of the mass of the more massive of the two merger components. This shows overdensities at 10, 35, and possibly 20 solar masses. Click to enlarge. [LVK Collaboration 2026]

Surveying merging black holes and neutron stars on the population level, the team analyzed 158 gravitational wave signals from the current catalog. This analysis supported findings from previous transient catalogs, including multiple overdensities in the distribution of merging black hole masses, broadly distributed neutron star masses, and an increase in the merger rate with redshift. The new data strengthened certain previously identified trends, such as an increase in the width of the effective spin distribution with redshift, and weakened others.

The full list of articles in the GWTC-4.0 Focus Issue can be found here.

Citation

“GWTC-4.0: An Introduction to Version 4.0 of the Gravitational-Wave Transient Catalog,” A. G. Abac et al 2025 ApJL 995 L18. doi:10.3847/2041-8213/ae0c06

“GWTC-4.0: Methods for Identifying and Characterizing Gravitational-Wave Transients,” A. G. Abac et al 2026 ApJL 1004 L21. doi:10.3847/2041-8213/ae447b

“Open Data from LIGO, Virgo, and KAGRA Through the First Part of the Fourth Observing Run,” A. G. Abac et al 2026 ApJ 1004 232. doi:10.3847/1538-4357/ae211e

“GWTC-4.0: Updating the Gravitational-Wave Transient Catalog with Observations from the First Part of the Fourth LIGO–Virgo–KAGRA Observing Run,” A. G. Abac et al 2026 ApJL 1004 L22. doi:10.3847/2041-8213/ae2c74

“GW231123: A Binary Black Hole Merger with Total Mass 190–265 M⊙,” A. G. Abac et al 2025 ApJL993 L25. doi:10.3847/2041-8213/ae0c9c

“GW230814: Investigation of a Loud Gravitational-Wave Signal Observed with a Single Detector,” A. G. Abac et al 2026 ApJL 1004 L23. doi:10.3847/2041-8213/ae2ad3

“GWTC-4.0: Population Properties of Merging Compact Binaries,” A. G. Abac et al 2026 ApJL 1005 L51. doi:10.3847/2041-8213/ae771e

The post Monthly Roundup: The Fourth Catalog of Gravitational Wave Events from LIGO, Virgo, and KAGRA appeared first on AAS Nova.

A Wandering Supermassive Black Hole Eating a Star

29 June 2026 at 17:00

disk of hot gas swirling around a black hole

Editor’s Note: Astrobites is a graduate-student-run organization that digests astrophysical literature for undergraduate students. As part of the partnership between the AAS and astrobites, we occasionally repost astrobites content here at AAS Nova. We hope you enjoy this post from astrobites; the original can be viewed at astrobites.org.

Title: The Wandering Supermassive Black Hole Powering the Off-Nuclear Tidal Disruption Event AT2024tvd
Authors: M. Guolo et al.
First Author’s Institution: Johns Hopkins University
Status: Published in ApJL

A Star Gets Eaten in the Wrong Neighborhood

We find supermassive black holes at the centers of most large galaxies. They end up there because of how galaxies form: as matter collapses and merges over time, material sinks to the gravitational center, and the black hole settles in.

So, what happens when we catch a star being ripped apart by a supermassive black hole that is not at the center of its galaxy?

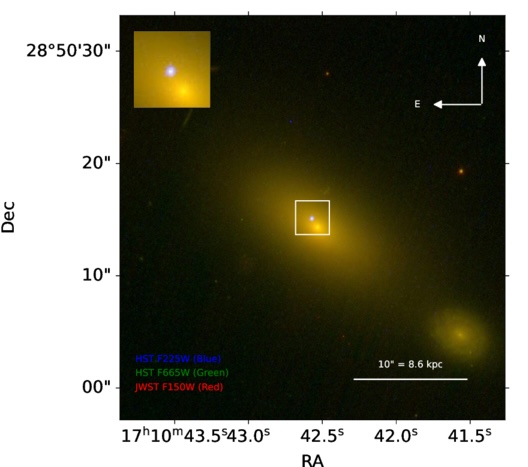
That is exactly the puzzle posed by AT2024tvd, a tidal disruption event (TDE) spotted roughly 2,600 light-years from the center of a massive galaxy located 600 million light-years away from us (see Figure 1).

AT2024tvd from Hubble and JWST

Figure 1: A color image of AT2024tvd from the Hubble Space Telescope and JWST. The yellow dot inside the square marks the galaxy’s center, while the TDE is the white dot, which is visibly offset to the upper left, about 2,600 light-years away. [Adapted from Guolo et al. 2026]

We see TDEs when a black hole tears apart a star that gets too close to it. It happens because the black hole’s gravity pulls harder on the near side of the star than the far side, stretching the star until it comes apart. The stellar debris then forms a hot accretion disk, a ring of material swirling around the black hole that spirals inward and releases a burst of electromagnetic energy across many wavelengths — from visible light to X-rays. These events are valuable to astronomers because they briefly light up black holes that would otherwise be invisible, giving us a rare window to measure their properties. Since supermassive black holes live at galactic centers, that is also where we expect TDEs to happen, which makes a TDE found away from a galactic center rare and puzzling. The galactic center is often called the nucleus of a galaxy, so astronomers refer to these displaced events as “off-nuclear” TDEs. AT2024tvd is only the third known off-nuclear TDE, and this research article makes a strong case that it is the most remarkable one yet.

Measuring Mass Using Light

To figure out the mass of the black hole responsible for AT2024tvd, the authors needed to get creative. You cannot weigh a black hole directly, so astronomers have to work backward from what they can see. The key idea is that a black hole’s mass controls how its accretion disk behaves. A more massive black hole produces a larger, cooler disk, while a less massive one produces a smaller, hotter disk. By measuring how bright the disk is at different wavelengths and how hot it gets, you can figure out how massive the black hole must be.

The authors did this by modeling the light the event produced across many wavelengths. They combined data from several telescopes: the Zwicky Transient Facility, the Neil Gehrels Swift Observatory, Pan-STARRS, and two rounds of high-quality X-ray data from XMM-Newton. TDE light curves go through different phases. The early flare in visible and ultraviolet light is bright but complicated, and the physical processes behind it are not fully understood. But after a few hundred days, TDEs settle into a quieter “plateau phase,” where the ultraviolet and visible light come directly from the accretion disk. At this stage, the emission follows well-understood physics, and astronomers can model it reliably.

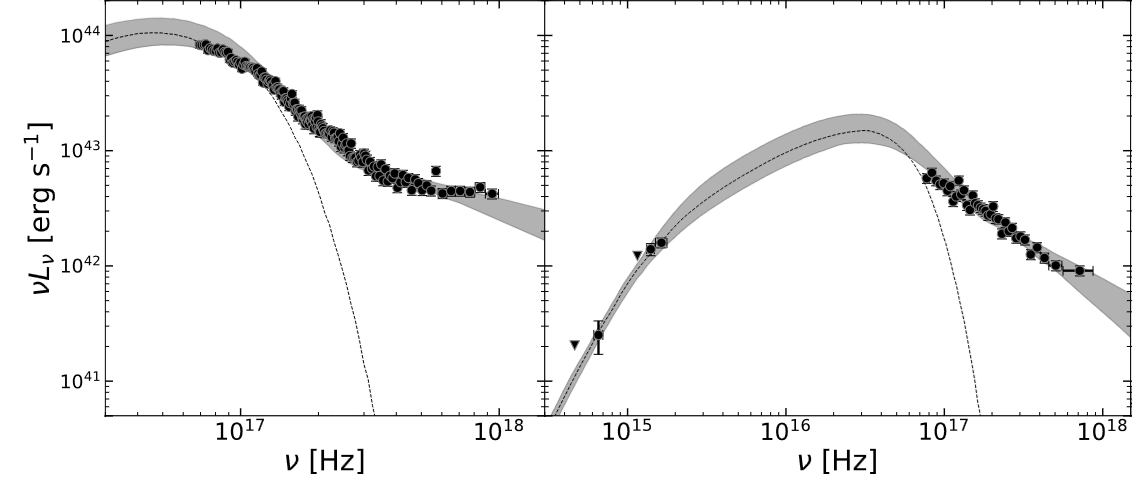
The authors used a model called kerrSED, which describes the spectral energy distribution (SED) of a spinning black hole’s accretion disk (kerr). It accounts for the disk’s temperature, its physical size, the black hole’s spin (how fast it rotates), and the angle at which we are viewing the system. It also accounts for a process called Comptonization, where hot electrons near the black hole boost lower-energy photons (particles of light) up to X-ray energies. By fitting this model to the observed light at multiple wavelengths simultaneously, the authors could pin down the disk properties and extract the black hole mass. The result was a clean fit: the disk model alone could explain all the observed light during the plateau phase, with nothing significant left over (see Figure 2).

brightness evolution of AT2024tvd

Figure 2: The brightness of AT2024tvd measured across a wide range of wavelengths, after correcting for absorption and the galaxy’s motion. The symbols show individual measurements from different telescopes, while the shaded contours represent the best-fit disk model and its uncertainty. Left: The early X-ray data, which is well explained by emission from the hot inner accretion disk. Right: The later data covering both visible/ultraviolet light and X-rays, all consistently explained by the same disk model. [Adapted from Guolo et al. 2026]

Not an Intermediate, but a Supermassive Black Hole

From their fit, the authors found a black hole mass of about one million solar masses. Black holes above about 100,000 solar masses are considered supermassive, while those below that threshold but above about 100 solar masses are called intermediate-mass black holes. So, this puts AT2024tvd in the supermassive category. This matters because the two previously known off-nuclear TDEs, called 3XMM J2150-05 and EP240222a, were both powered by intermediate-mass black holes. Those black holes were found inside small, dense collections of stars called ultra-compact dwarf galaxies that were orbiting larger host galaxies.

AT2024tvd is different. When the authors looked at deep images of the location where the TDE happened, they found no star cluster or small galaxy there. Whatever group of stars once surrounded this black hole has been almost entirely pulled apart by the gravity of the much larger parent galaxy. The ratio of the black hole’s mass to the mass of any remaining stars around it is extreme: greater than 3%, which is far above what we normally see. This is the signature of a “wandering” supermassive black hole, one that was brought in during a past galaxy merger and has been slowly sinking toward the center of its new host ever since, losing its surrounding stars along the way.

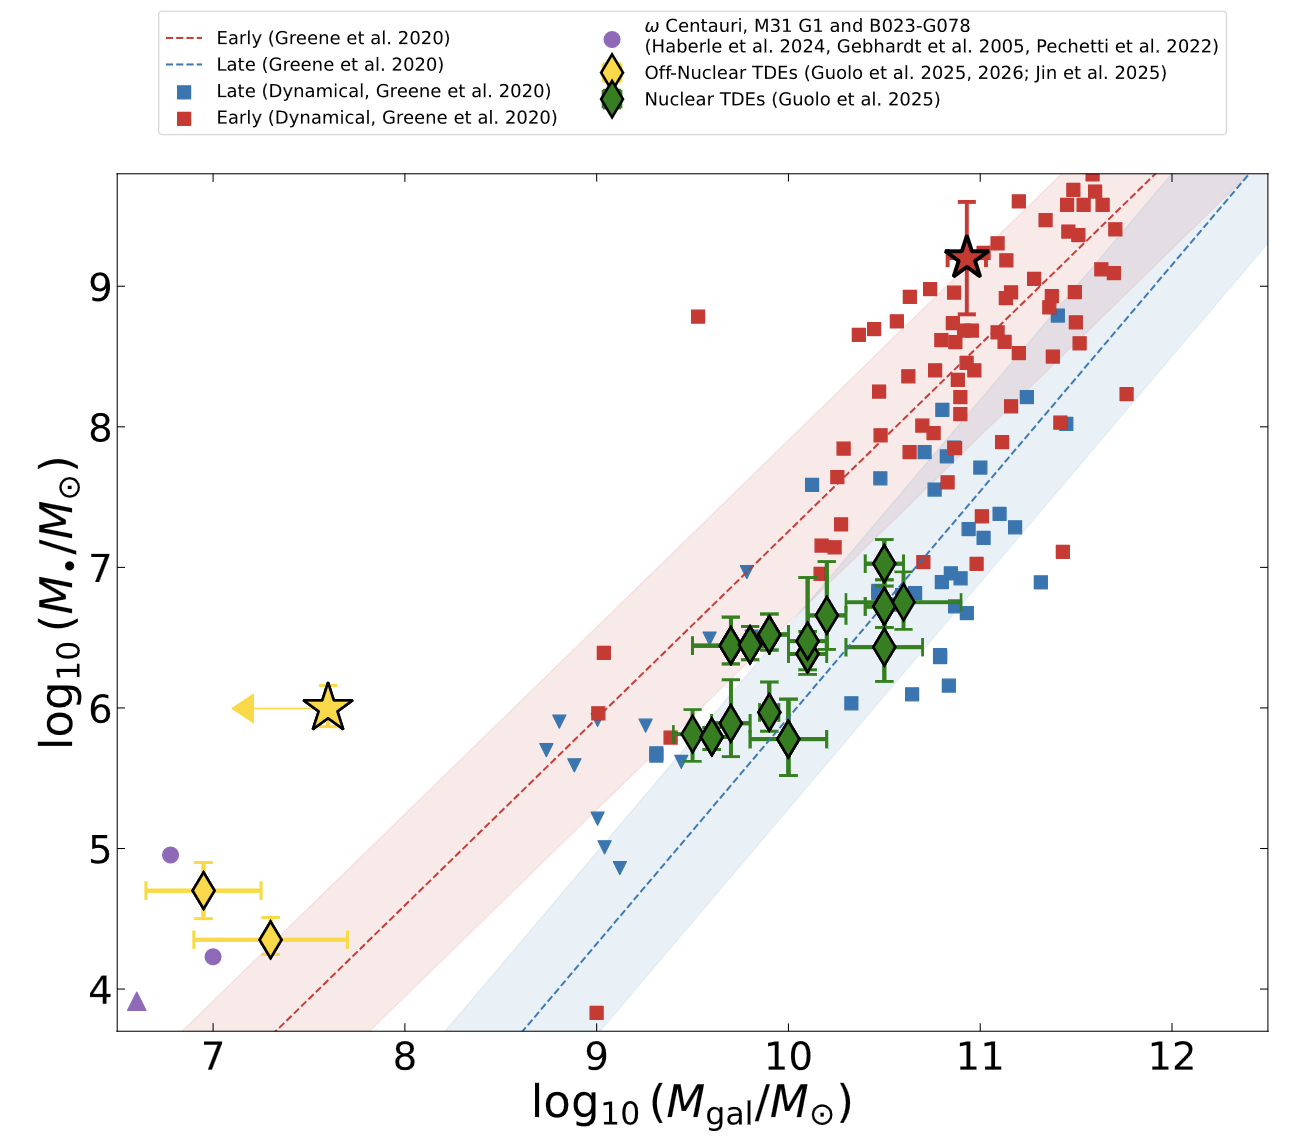
The authors compared AT2024tvd to other TDEs using established relationships between accretion disk properties and black hole mass (Figure 3). In terms of its disk temperature, luminosity, and inferred mass, AT2024tvd behaves like a typical nuclear TDE powered by a supermassive black hole. However, when placed on the black hole mass versus host stellar mass relation, it stands out as a strong outlier. The black hole mass is far too large for the small amount of surrounding stellar mass detected at its location.

plot of black hole mass versus host galaxy mass

Figure 3: AT2024tvd (yellow star) plotted on the relationship between black hole mass and host galaxy stellar mass. Red squares show nearby galaxies with dynamically measured black hole masses plotted against galaxy bulge stellar mass, while blue squares show the relation using total galaxy stellar mass. Purple points and green diamonds represent nuclear TDE host galaxies with black hole masses inferred from different TDE modeling techniques. Yellow diamonds mark the two previously known off-nuclear TDEs. AT2024tvd stands out as a clear outlier, with a very high black hole mass compared to the upper limit on any surrounding stellar mass. [Guolo et al. 2026]

The Big Picture

This discovery matters for several reasons. It shows that off-nuclear TDEs are not limited to intermediate-mass black holes sitting in small satellite galaxies. Some are powered by fully supermassive black holes that have been displaced from their original galactic centers. It also shows that TDE modeling, when done carefully during the plateau phase of the light curve (when the emission is dominated by well-understood accretion disk physics), can provide reliable black hole masses on its own, without assuming any relationship between the black hole and its host galaxy. This is particularly important for wandering black holes, where those relationships do not apply.

Looking ahead, upcoming surveys like Vera C. Rubin Observatory’s Legacy Survey of Space and Time are expected to find many more off-nuclear TDEs. Combined with X-ray follow-up from telescopes like XMM-Newton, these events could become our main tool for mapping out the population of displaced black holes in the nearby universe. One disrupted star at a time, we are starting to find black holes that theory told us should exist but that had, until now, stayed hidden.

Original astrobite edited by Kelsie Taylor and Veronika Dornan.

About the author, Serat Saad:

Serat is a first-year PhD student in astronomy at The Ohio State University. His research is on stellar and galactic dynamics, where he uses observational data to understand gravity. He also has interests in active galactic nuclei and tidal disruption events.

The post A Wandering Supermassive Black Hole Eating a Star appeared first on AAS Nova.

Could a White Dwarf–Black Hole Pair Explain the Longest Gamma-Ray Burst Ever Seen?

9 June 2026 at 23:36

illustration of GRB 250702B

What’s the story behind the longest gamma-ray burst ever observed? Researchers explore how repeated interactions between a white dwarf and an intermediate-mass black hole could explain GRB 250702B’s unusual properties.

An Exceptional Gamma-Ray Burst

GRB 250702 host galaxy

An image of GRB 250702B’s location within its host galaxy. [NASA, ESA, CSA, H. Sears (Rutgers). Image Processing: A. Pagan (STScI)]

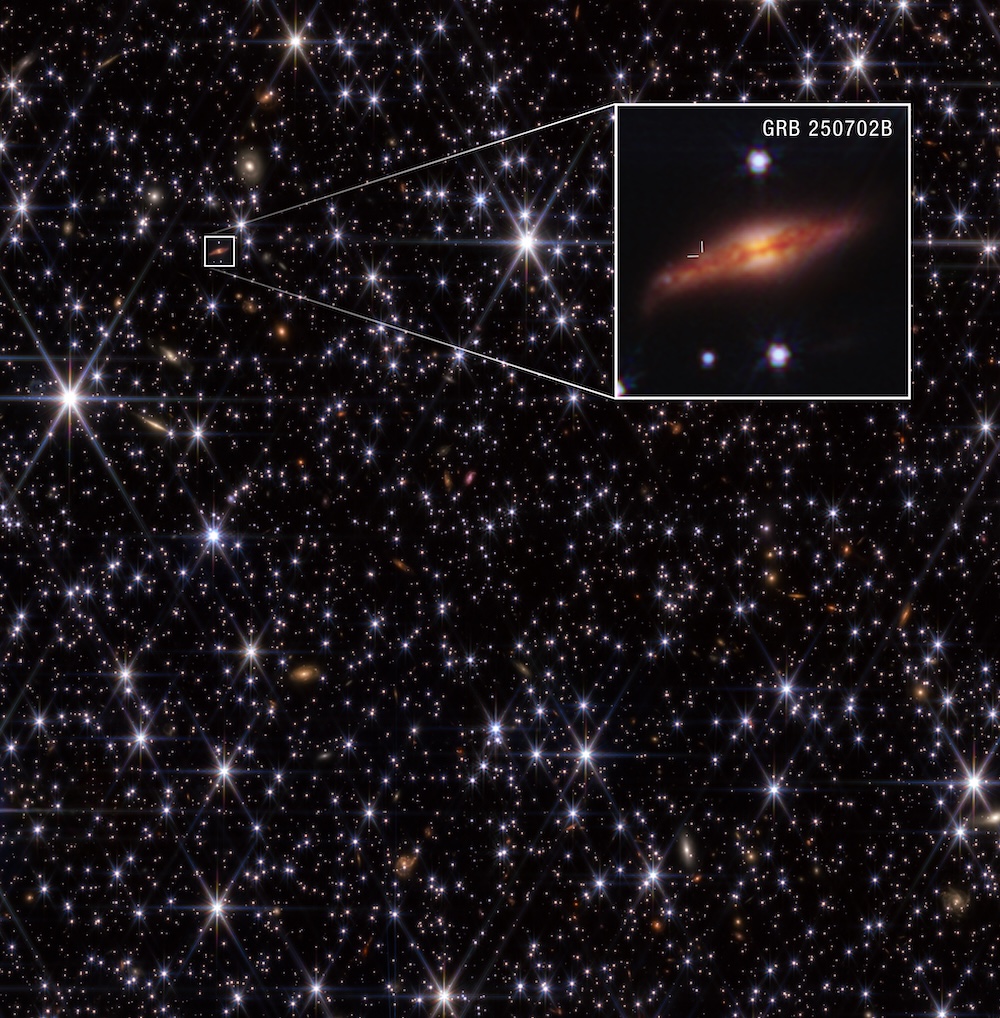
In 2025, the Fermi Gamma-ray Space Telescope spotted an intense flash of gamma rays from a distant, dusty galaxy, and a fleet of spacefaring and earthbound telescopes soon revealed the remarkable characteristics of the event. GRB 250702B featured multiple bursts spanning several hours, individual flares lasting roughly 100 seconds, and X-ray emission in the 24 hours leading up to the gamma-ray activity — something never seen before in a gamma-ray burst.

These characteristics have been challenging to explain with typical models of long gamma-ray burst formation, such as collapsing massive stars, but researchers have developed numerous promising alternatives. In a new research article, astronomers have shown how GRB 250702B’s behavior might be explained by repeated close encounters between a white dwarf and an intermediate-mass black hole.

Eccentric Close Encounters

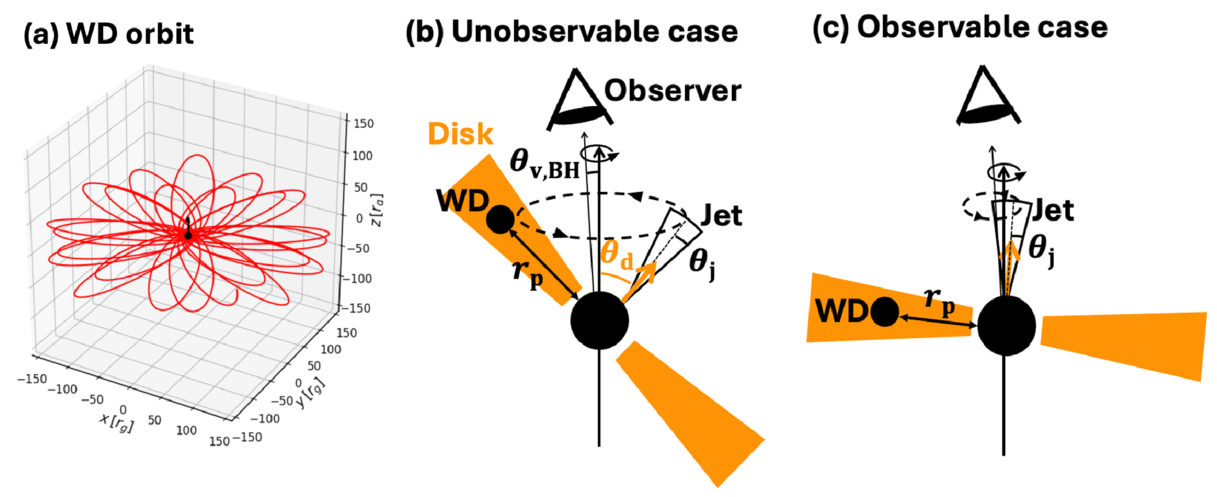
Yuri Sato (Tohoku University) and collaborators modeled the source of GRB 250702B as a white dwarf that has been captured into orbit around an intermediate-mass black hole. In their model, the white dwarf travels on an extremely eccentric orbit, drawing close to the black hole roughly once an hour. Each time the white dwarf ventures close, the black hole’s tidal forces strip away part of the star until, after about 40 such encounters, the white dwarf is completely destroyed.

geometry of the GRB 250702B system

Schematics showing the orbit of the white dwarf (WD; left) and the geometries that produce observable and unobservable jets. Click to enlarge. [Sato et al. 2026]

When the black hole peels material away from the white dwarf, some material swirls into an accretion disk, and some is cast off into space. Accretion from the disk powers a narrow relativistic jet: the source of the event’s powerful gamma-ray flares. This should mean that there is one jet produced each time the white dwarf is partially disrupted — 40 times — yet astronomers detected only a handful of flares from GRB 250702B.

Jet Precession and Model Predictions

The discrepancy can be resolved if the angle between the jet and the black hole’s spin axis precesses over time so that only some of the jets are pointed toward us. This can occur if the accretion disk is misaligned relative to the black hole’s spin. As an alternative, disk instabilities or other processes could keep all but a few of the expected jets from being launched.

radio afterglow predictions for GRB 250702B

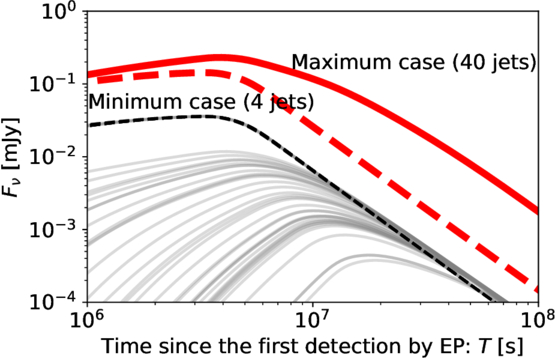
Predicted strength of the radio afterglow for the jet precession case (maximum case) and the case in which only four jets were launched due to disk instabilities or jet choking (minimum case). The x-axis shows the time since the burst was detected in X-rays by the Einstein Probe (EP). [Sato et al. 2026]

Sato and coauthors found that these two scenarios have different long-term outcomes, providing a potential way to ascertain what’s going on at the source; in the jet precession scenario, the jets that are launched away from our line of sight produce an order of magnitude more radio emission at late times.

This work by Sato and collaborators demonstrates how the repeated partial tidal disruption of a white dwarf by an intermediate-mass black hole can match the properties of one of the most remarkable recent transient sources — one that has pushed astronomers to consider new ways of producing gamma-ray bursts.

Citation

“Successive Partial Disruptions with Orbital Precession in a White Dwarf–Black Hole System for Repeating GRB 250702B,” Yuri Sato et al 2026 ApJL 1003 L44. doi:10.3847/2041-8213/ae6a8f

The post Could a White Dwarf–Black Hole Pair Explain the Longest Gamma-Ray Burst Ever Seen? appeared first on AAS Nova.

A Black Hole’s Puzzling X-Ray Bursts

29 April 2026 at 17:00

illustration of a stellar-mass object crashing through the accretion disk around a supermassive black hole

In 2019, a supermassive black hole in a galaxy 300 million light-years away woke up. Now, it’s puzzling astronomers with an unexpected slowdown in its X-ray bursts.

ZTF19acnskyy host galaxy

The fuzzy yellow galaxy at the center of this image is home to ZTF19acnskyy. [Sloan Digital Sky Survey]

Ansky Awakens

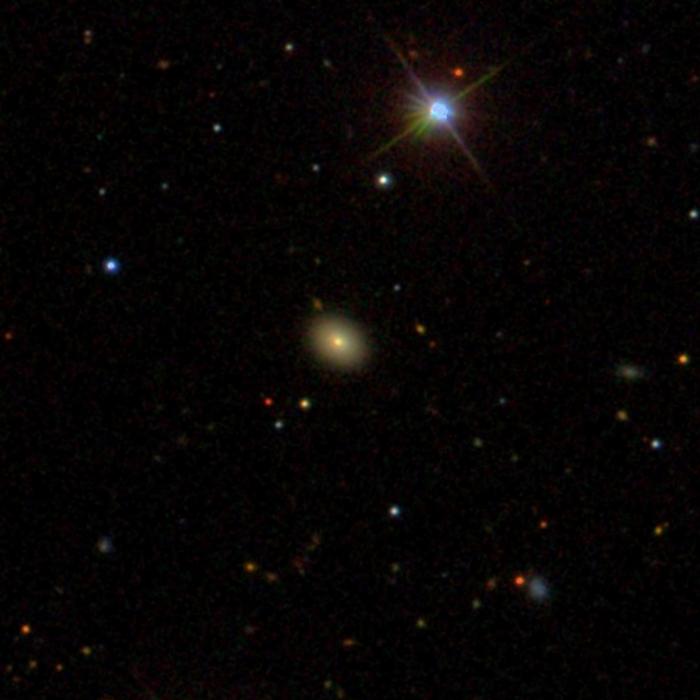
Nearly seven years ago, the Zwicky Transient Facility saw the galaxy SDSS J133519.91+072807.4 suddenly brighten at optical wavelengths, with the source given the moniker ZTF19acnskyy or “Ansky.” Within the next few years, Ansky brightened at other wavelengths, possibly signaling the first recorded case of a slumbering supermassive black hole grumbling to alertness.

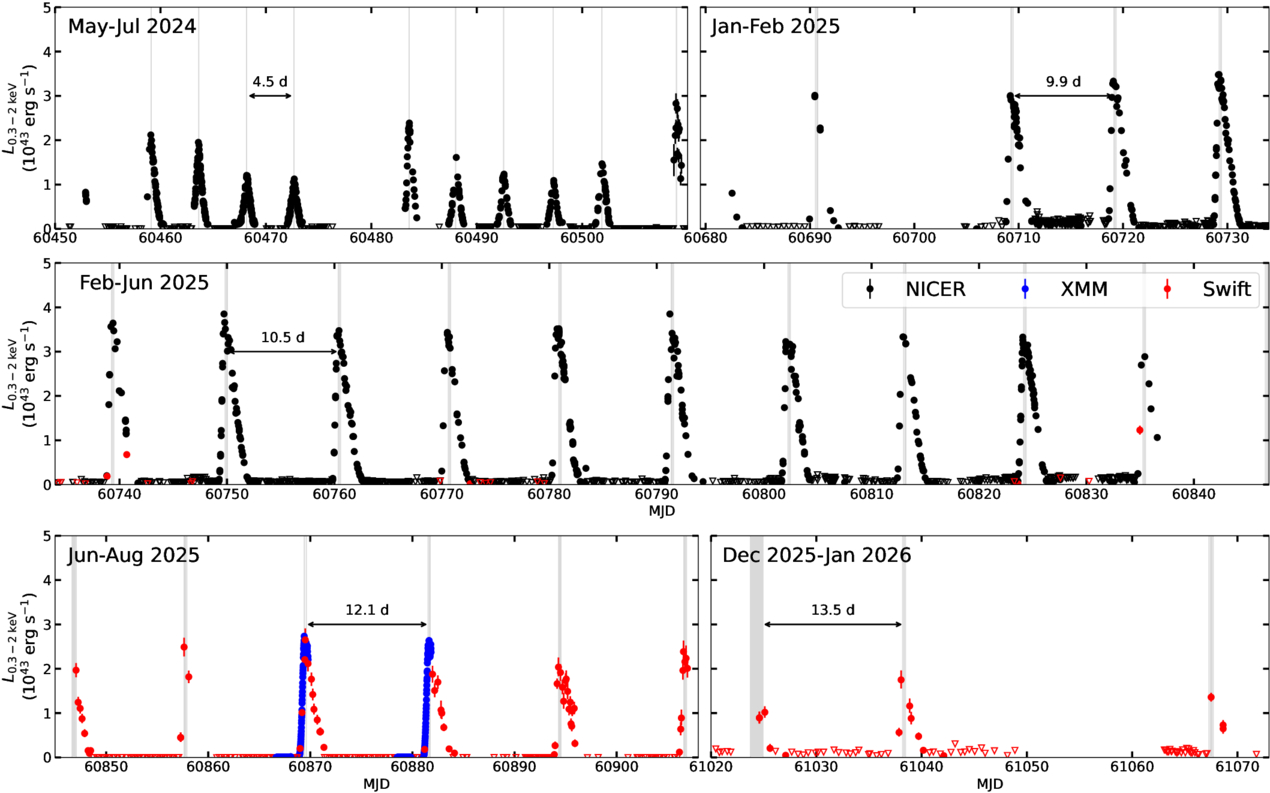
In 2024, Ansky entered a new phase of behavior, exhibiting a series of semi-regular X-ray flares called quasi-periodic eruptions. The leading explanations for these flares, which have been detected from several nearby galaxies, involve a star-sized object spiraling toward a supermassive black hole. The repeating X-ray flares arise when the object crashes through an accretion disk around the black hole, or when the object loses mass each time it passes closest to the black hole. In either scenario, the time between flares is expected to decrease over time — but as new work shows, Ansky is behaving in ways that fail to fit existing theories of quasi-periodic eruptions.

An Unexpected Slowdown

plot of Ansky's X-ray flares

Soft X-ray observations of Ansky’s bursts from 2024 to 2026. These plots clearly show that in 2025 and 2026, the peak luminosities of the bursts have remained roughly constant while the time between bursts has increased. Click to enlarge. [Chakraborty et al. 2026]

Astronomers first reported on Ansky’s strange behavior in 2025, finding evidence that the time between eruptions was increasing rather than decreasing as expected. To investigate this emerging trend, Joheen Chakraborty (Massachusetts Institute of Technology) and collaborators analyzed data from the Neil Gehrels Swift Observatory’s X-ray Telescope, XMM-Newton, and the Neutron star Interior Composition Explorer (NICER).

This X-ray monitoring campaign spanned from January 2025 to January 2026 and captured 23 bursts, including 19 consecutive bursts — the most seen from a quasi-periodic eruption source to date. The bursts each lasted about three days, and the burst luminosity and total energy remained roughly constant, but the time between bursts increased smoothly from 9.9 days in January 2025 to 13.5 days in January 2026.

Possible Explanations

What physical process can produce X-ray bursts that are roughly consistent in energy and peak luminosity, last for approximately three days, and become more spaced out over time? The team considered five possibilities:

  1. A star orbiting a black hole could transfer a bit of mass to the black hole each time it draws close… but it’s not clear whether the energy of each burst would remain the same as the star loses mass, nor is it clear how a three-day eruption duration could be achieved.
  2. A star partially disrupted by a black hole could be kicked progressively farther from the black hole due to asymmetric mass loss or the reformation of its core… but this scenario cannot explain the bursts’ consistent energies and luminosities.
  3. An object orbiting a black hole with an accretion disk could be experiencing general relativistic precession… but no combination of known sources of precession can reproduce Ansky’s behavior.
  4. A second supermassive black hole could cause reflex motion of the inner black hole, changing how far the signal must travel… but even though this scenario can increase the time between bursts, the rate of increase is three orders of magnitude too small.
  5. Instabilities in the black hole’s accretion disk could trigger recurrent bursts of accretion… but it’s not yet clear how an instability scenario could produce such predictable behavior.

While none of these models can fully solve the mystery of Ansky’s slackening X-ray flares, this work provides new avenues for exploration. In the meantime, we may get new clues simply from waiting to see what this source does next!

Citation

“A Positive Period Derivative in the Quasiperiodic Eruptions of ZTF19acnskyy,” Joheen Chakraborty et al 2026 ApJL 1001 L6. doi:10.3847/2041-8213/ae548b

The post A Black Hole’s Puzzling X-Ray Bursts appeared first on AAS Nova.

Monthly Roundup: Updates on Three Notable Transients

27 February 2026 at 17:00

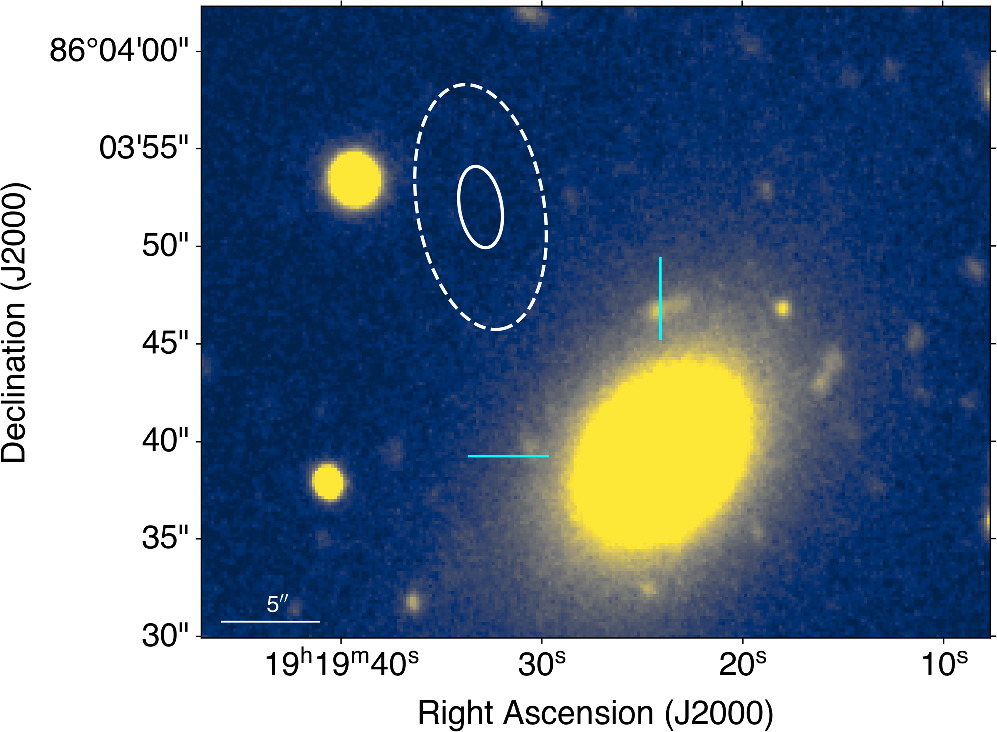
AT 2024wpp

Across the universe and across the electromagnetic spectrum, flares, bursts, and waves are making their mark on the sky. Today, we’re giving an update on three exceptional transients that have been discussed previously on AAS Nova: AT 2024wpp, GRB 250702B, and GW231123.

The Most Luminous Known Fast Blue Optical Transient, AT 2024wpp

Discovered in September 2024, AT 2024wpp burst onto the scene as the most luminous example of a fast blue optical transient (FBOT) — a growing class of events that are more luminous, more rapidly evolving, and bluer than supernovae. In October 2025, astronomers published their findings on AT 2024wpp’s X-ray and radio evolution. Just last month, a research team led by Natalie LeBaron (University of California, Berkeley) described the results of a complementary investigation of the transient’s ultraviolet, optical, and near-infrared behavior.

AT 2024wpp light curves

The ultraviolet through infrared light curve of AT 2024wpp. Results from different filters are offset vertically for clarity. [LeBaron et al. 2026]

LeBaron and collaborators collected ultraviolet through infrared photometry as well as optical and infrared spectroscopy to characterize the event. These efforts led to the first-ever collection of ultraviolet data during the rising period of an FBOT. Overall, the data reveal an almost featureless spectrum from the optical through the near-infrared and a persistent, weeks-long thermal continuum, both of which seem to be common for FBOTs.

The observations point to a luminous central energy source that continuously injects energy into its surroundings, powers multiple outflows, and ionizes the ejected material. These features can be explained by the rapid accretion of material by a neutron star or a black hole, in which the accreted material forms a disk and is ejected in both a fast-moving polar outflow and a slower-moving equatorial outflow.

Though the exact nature of the central object powering AT 2024wpp’s intense radiation isn’t known — the extreme luminosity of this event points to a stellar-mass black hole as the central object, but a neutron star cannot be ruled out — the overall picture of this event matches what has been found for previous FBOTs. Upcoming instruments and surveys will discover more FBOTs and spot them earlier in their evolution, transforming our understanding of these rare transients.

An Ultra-Long X-Ray and Gamma-Ray Transient, GRB 250702B

GRB 250702B is an exceptional gamma-ray burst: an intense flash of gamma rays lasting anywhere from a few milliseconds to several hours. GRB 250702B is unprecedented among events in this class because it features several bursts arising over the course of roughly 7 hours, plus X-ray precursor emission going back 24 hours before discovery. We’ve previously covered JWST follow-up observations of GRB 250702B, and today we’re taking a look at its high-energy evolution.

Swift and Chandra observations of GRB 250702B

Swift (black circles) and Chandra (blue circles) observations of GRB 250702B. Click to enlarge. [Adapted from O’Connor et al. 2025]

Brendan O’Connor (Carnegie Mellon University) and collaborators collected observations of GRB 250702B from the Neil Gehrels Swift Observatory, the Nuclear Spectroscopic Telescope Array (NuSTAR), and the Chandra X-ray Observatory, stretching from just half a day after the transient was discovered to 65 days later. The team aimed to determine whether GRB 250702B fit the profile of an ultra-long gamma-ray burst accompanying a star’s collapse into a black hole or a relativistic tidal disruption event, in which a star is ripped apart by a massive black hole.

O’Connor’s team found that GRB 250702B didn’t fit neatly into either category. While many of the event’s properties closely resembled those of ultra-long gamma-ray bursts, the hours-long gamma-ray emission and the precursor X-ray emission were outliers. Certain features are more easily reconciled with the tidal disruption of a main-sequence star by an intermediate-mass black hole, but others are similarly hard to account for. Finding the smoking gun for a tidal disruption event — an abrupt shutoff to the X-ray emission — will require long-term X-ray monitoring.

Because GRB 250702B has features that align with both ultra-long gamma-ray bursts and tidal disruption events, O’Connor and coauthors proposed scenarios that combine aspects of both possibilities: either a stellar-mass black hole tidally disrupting a star or the merger of a helium star with a stellar-mass black hole.

The Most Massive Gravitational Wave Source, GW231123

When compact objects like neutron stars and black holes merge, their collisions produce ripples in spacetime that are accessible to detectors on Earth. One of the most exciting events so far from the fourth gravitational wave transient catalog is GW231123, which appears to be caused by the merger of two black holes, each at least 100 times the mass of the Sun. The LIGO, Virgo, and KAGRA (LVK) collaborations reported a total mass of 238 solar masses for the event, which would make it the most massive binary black hole merger yet observed.

In a recent article, Ilya Mandel (Monash University and OzGrav) urged caution when interpreting seemingly extreme events like GW231123. Mandel’s argument is a statistical one, highlighting how certain aspects of the Bayesian techniques used to estimate GW231123’s mass could have skewed that estimate toward an artificially high value.

posterior probability distributions for maximum mass of GW231123 and all gravitational wave events seen by LVK

The posterior probability distribution on the maximum mass as derived from the total LVK catalog (blue), compared to the posterior for GW231123 (orange; multiplied by 10 for visibility). Click to enlarge. [Mandel 2026]

In general, Mandel points out, events that appear extreme are simply more likely to be statistical fluctuations. As an example, consider a large group of people having their heights measured, but with very large measurement uncertainties. The highest reported height in this situation is likely to be associated with a reasonably tall person whose height had a large upward measurement error, not necessarily someone who is exceptionally tall. Similarly, the reported most massive gravitational wave source is likely not quite as massive as claimed.

Mandel also demonstrated how considering the population of black hole mergers detected by LVK as a whole can provide a different perspective on GW231123’s likely mass. By analyzing this entire sample together, Mandel showed that the maximum mass for the population of merging black holes appears to be considerably lower than the mass estimated for GW231123, again raising the possibility that the true mass of the event is lower than the current estimate.

Ultimately, Mandel pointed out that at present it’s impossible to distinguish between three possibilities: that GW231123 is a true outlier among the population of merging black holes, representing a member of a new, unexplored population; that it’s a member of the same population as other black hole mergers seen by LVK but inhabits an extreme high-mass tail; or its high mass estimate is a statistical artifact.

Citation

“The Most Luminous Known Fast Blue Optical Transient AT 2024wpp: Unprecedented Evolution and Properties in the Ultraviolet to the Near-Infrared,” Natalie LeBaron et al 2026 ApJL 997 L10. doi:10.3847/2041-8213/ae2910

“Comprehensive X-Ray Observations of the Exceptional Ultralong X-Ray and Gamma-Ray Transient GRB 250702B with Swift, NuSTAR, and Chandra: Insights from the X-Ray Afterglow Properties,” Brendan O’Connor et al 2025 ApJL 994 L17. doi:10.3847/2041-8213/ae1741

“What Is the Most Massive Gravitational-Wave Source?” Ilya Mandel 2026 ApJL 996 L4. doi:10.3847/2041-8213/ae278d

The post Monthly Roundup: Updates on Three Notable Transients appeared first on AAS Nova.

Ia’m Just Getting Started: A Type Ia Supernova’s First Day

24 February 2026 at 17:00

G299.2-2.9

Editor’s Note: Astrobites is a graduate-student-run organization that digests astrophysical literature for undergraduate students. As part of the partnership between the AAS and astrobites, we occasionally repost astrobites content here at AAS Nova. We hope you enjoy this post from astrobites; the original can be viewed at astrobites.org.

Title: The First Day of a Type Ia Supernova from a Double-Degenerate Binary
Authors: Gabriel Kumar, Logan J. Prust, and Lars Bildsten
First Author’s Institution: University of California, Santa Barbara
Status: Published in ApJ

Much like distance markers along the highway, Type Ia supernovae have long been used as distance indicators in space. These supernovae were originally theorized to form in binary systems. In this system, a white dwarf (a dense, collapsed remnant of a star) steals surface material from a non-degenerate star like our Sun and then explodes. Because of the initial conditions and properties of those two stars, the explosion would shine with the same intrinsic brightness regardless of the binary system’s location in space.

Research and observations, however, show that this is not entirely true; not all Type Ia supernovae are equally luminous. There are various theories regarding the different formation scenarios and explosion mechanisms that might create a Type Ia supernova. Developing ways to sleuth out the origins of these systems can be useful because it may tell us more about their luminosity.

One emerging theory of formation is the “double-detonation scenario.” In this case, two white dwarfs exist in a binary system. The more massive primary (the “accretor”) steals material from the less massive white dwarf secondary (the “donor”). After the primary steals the donor’s outer thin shell of helium, the helium surrounding the accretor detonates. This explosion induces a shock wave that travels into the dense core of the accretor and causes another detonation. The two detonations — one on the surface and one in the core — produce enough energy to explode the star into a supernova, a powerful stellar explosion. When the material from the exploding star reaches its companion star, it forms a mysterious, conical wake within the gaseous material, or “ejecta,” expelled from the accretor. This wake might be an important clue for distinguishing a supernova’s origins.

Since these explosions are incredibly powerful and would be difficult (and dangerous!) to perform in a lab, astronomers turn to computer simulations to model these events. Hydrodynamical simulations, in particular, are helpful for researchers because they model how fluids “flow” by solving complex equations that are too tricky to do by hand. (Remember that stars are just balls of gas, and hence fluid!) The authors of today’s article ran hydrodynamical simulations of the explosion and subsequent evolution of the ejecta from a double-detonation scenario.

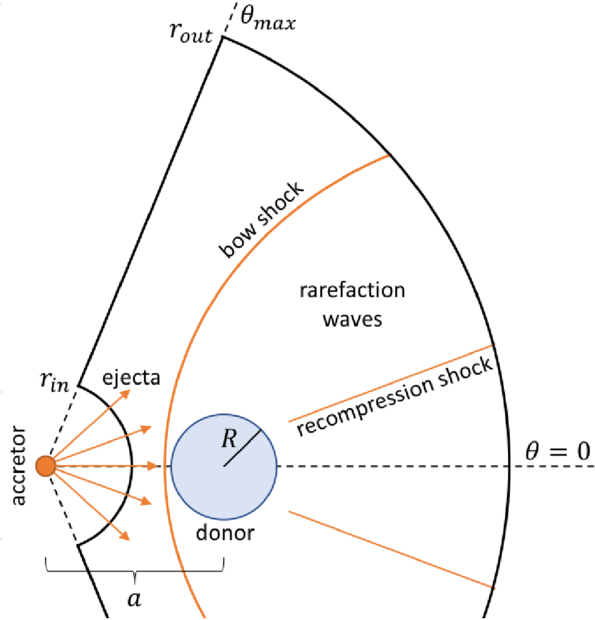
In the diagram of the team’s setup (see Fig. 1), you can see a “bow shock.” This shock is from the wave produced in the accretor’s detonation and is bowed since it bends around the donor star. This shock moves quickly through the cone of ejecta, modifies its structure, and leaves clues within the ejecta as it settles.

schematic of the simulation setup

Figure 1: A visual schematic of the simulation setup. The accretor is the exploding star, which produces a “bow shock” from the detonation. The bow shock and recompression shock modify the structure of the ejecta, which fills the space between rout and rin. The ejecta is full of gaseous stellar material. [Kumar et al. 2025]

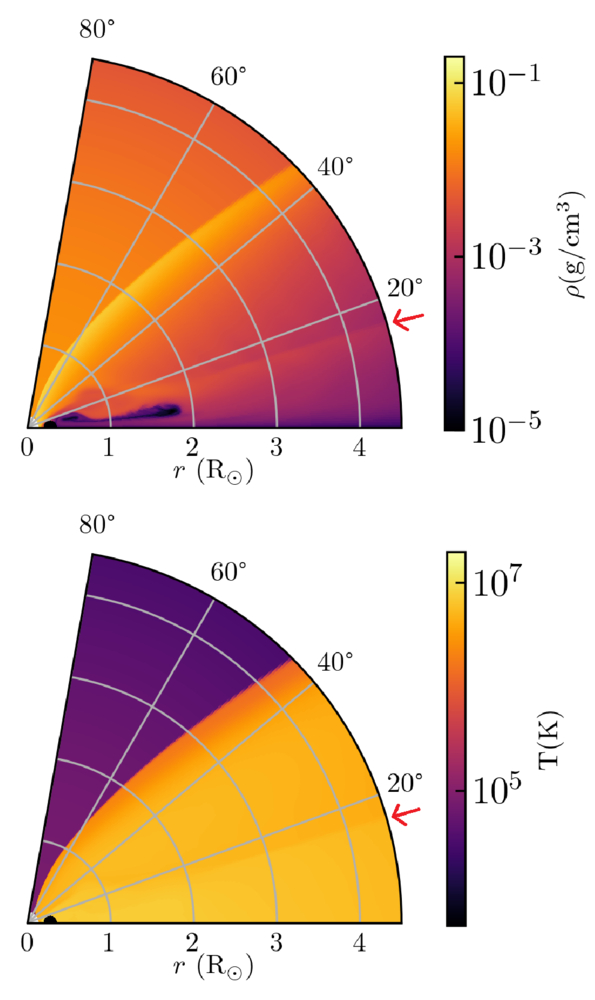
After simulating 1,000 seconds after the explosion, the authors recreated a high-density, low-temperature “wake” from the shock. You can see imprints of this wake in Fig. 2, as denoted by the red arrow.
visual slice of the simulated ejecta

Figure 2: A visual “slice” of the ejecta surrounding the donor star just 200 seconds after detonation. The bottom-left corner (r = 0) has a faint white spot, indicating the donor. The density (top) and temperature (bottom) of the ejecta are shown. The faint line marked by the red arrow indicates the secondary shock from the explosion, highlighting changes in both density and pressure. [Kumar et al. 2025]

Once they were able to produce this wake, the authors evolved the ejecta over time to see what the radiation from this material might reveal. They discovered that the “shocked,” or compressed and heated, ejecta flew out much further than the unshocked ejecta (see Fig. 3).
simulation snapshot at 2 hours of simulation time

Figure 3: A slice of the simulation taken later, at 2 hours of simulation time. The ejecta in the shocked region has flown out farther than the ejecta in the unshocked region. Note that the horizontal scale has changed from Figure 2. [Kumar et al. 2025]

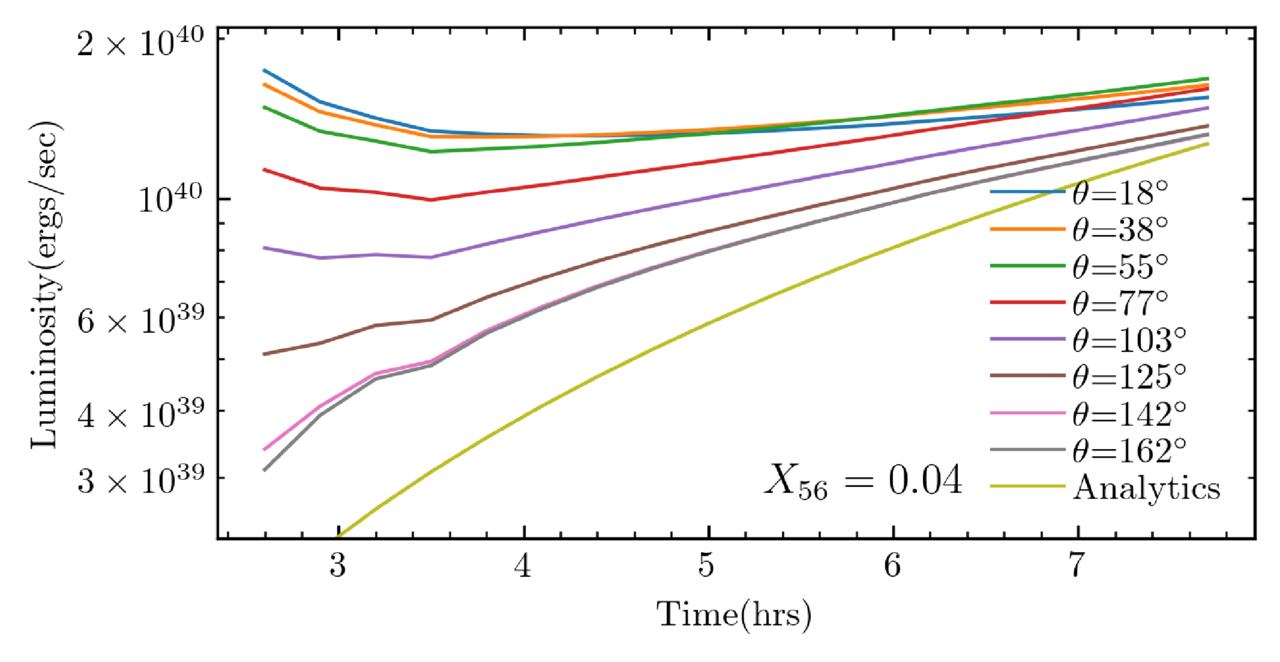
This ejecta can be seen from different viewing angles, influencing an observer’s measurement of the explosion’s luminosity. The strongest features of the wake are visible up to about 55 degrees, while some effects can still be seen up to about 140 degrees — almost half of the sky (see Fig. 4). Overall, an observer’s position relative to the explosion axis might change their reported luminosity of the explosion. The authors estimate that this wake might cause Type Ia supernovae from a “double-detonation” scenario to appear up to 15% fainter, depending on the observer’s viewing angle. Therefore, if scientists use Type Ia supernovae as cosmic distance indicators, their calibrations might be slightly off. This isn’t the best news for those using measurements of Type Ia supernovae to measure the expansion rate of the universe.
plot of luminosity versus time after detonation of a supernova

Figure 4: A comparison of luminosity vs. time over the course of 6 hours shortly after detonation. The different lines indicate different viewing angles from the axis of explosion. The line “Analytics” describes a light-curve prediction by Piro (2012) for a supernova that was not shock-heated. The luminosities for this model span almost one order of magnitude. [Kumar et al. 2025]

We’ve talked a lot about the accretor and ejecta in this scenario, but what might happen to the donor star? One idea is that the donor star is “kicked” away by the high velocity of the blast. In this simulation, the authors were able to calculate a “kick” velocity, or speed imparted by the blast to the donor star, that was much higher than estimates from other detonation models. One observed Type Ia supernova, SN 2021aefx, is believed to have the fastest observed ejecta to date. The mechanism that today’s authors modeled might explain how the ejecta of this event got its super-fast “kick.”

While there is always more work to be done, this work presents a first step at identifying double-detonation Type Ia supernovae from early observations. With an influx of observations from new observatories, like the Vera C. Rubin Observatory, we should expect to see many more early supernova detections.

Original astrobite edited by Ansh Gupta.

About the author, Mckenzie Ferrari:

I’m currently a PhD student in the geophysical sciences program at the University of Chicago. While I now study the atmosphere and oceans of Earth, most of my previous research focused on simulations of Type Ia supernovae and galaxy formation and evolution. In my free time, I foster cats for a local organization, enjoy cooking, and can often be found running along Lake Michigan.

The post Ia’m Just Getting Started: A Type Ia Supernova’s First Day appeared first on AAS Nova.

How Many Kilonovae Will Rubin Observatory Help Us Spot?

4 February 2026 at 17:00

Vera Rubin Observatory

The detection of gravitational waves and light from a single source was one of the most important discoveries of the gravitational wave era. Can upcoming data from Vera C. Rubin Observatory help astronomers repeat that feat?

kilonova as seen by Hubble

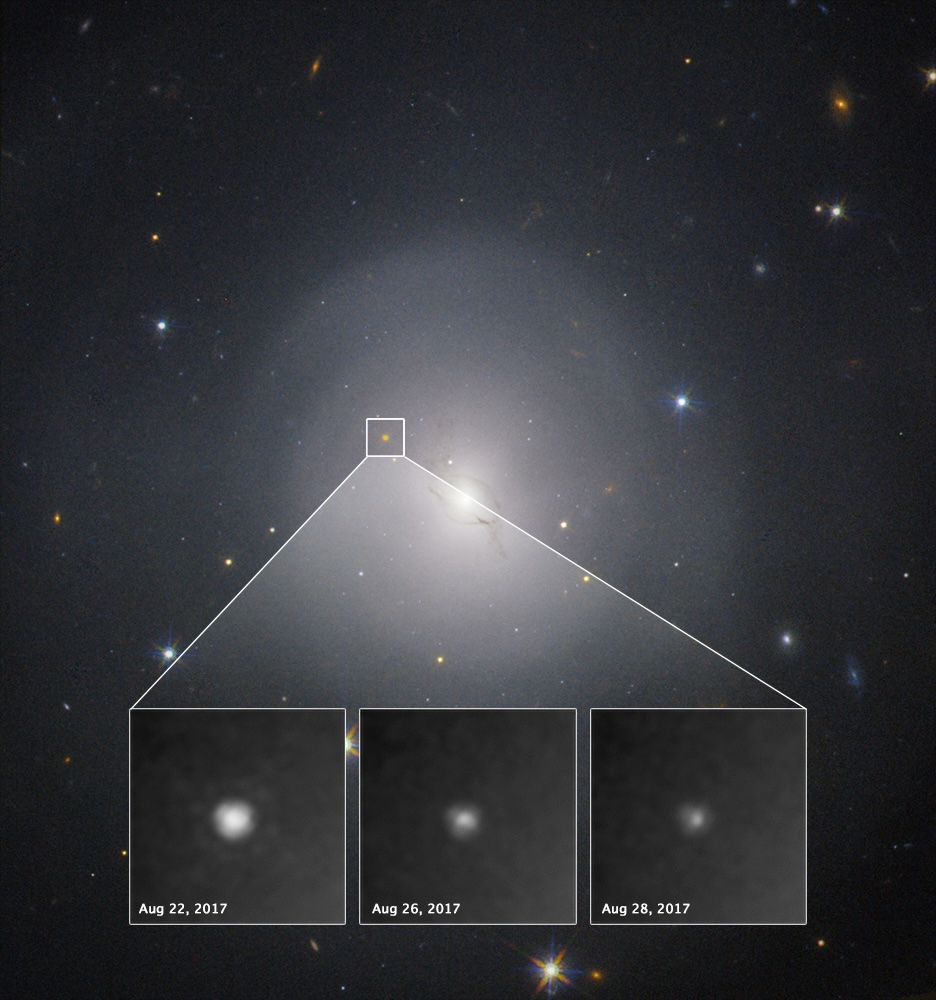
These images from the Hubble Space Telescope show the fading light of the kilonova associated with the gravitational wave event GW170817. [NASA and ESA Acknowledgment: A. Levan (U. Warwick), N. Tanvir (U. Leicester), and A. Fruchter and O. Fox (STScI)]

Not Yet Repeated

When two neutron stars merge, the collision sends ripples through spacetime and generates an electromagnetic signal called a kilonova. In 2017, researchers detected gravitational waves and kilonova emission from colliding neutron stars — the first and, to date, only electromagnetic signal definitively associated with a gravitational wave event.

In a research article published this week, a team led by Simon Stevenson (Swinburne University of Technology; OzGrav) considered how the much-anticipated Legacy Survey of Space and Time (LSST), carried out by Rubin Observatory, can enhance our ability to detect kilonovae and pair them with their gravitational wave counterparts.

Survey Simulations

When a new gravitational wave signal is detected, researchers rush to search for an electromagnetic counterpart to the signal. While Rubin Observatory can aid this type of reactive search, Stevenson’s team focused on a different strategy: spotting kilonovae during routine survey operations and using these detections to trigger a targeted hunt through gravitational wave data, searching for signals missed by automated detection algorithms.

Over the 10-year course of LSST, Rubin will scan the visible southern sky every few days, uncovering a wide variety of transient sources such as supernovae, novae, and tidal disruption events. Because Rubin will amass a huge amount of data each night, astronomers worldwide will use data brokers to pass along the most promising signals. Stevenson’s team used for their analysis a bespoke and modular data broker called Fink. Fink currently handles 200,000 alerts per night from the Zwicky Transient Facility and will be scaled up to handle 10 million alerts per night as Rubin requires.

simulated kilonova light curves

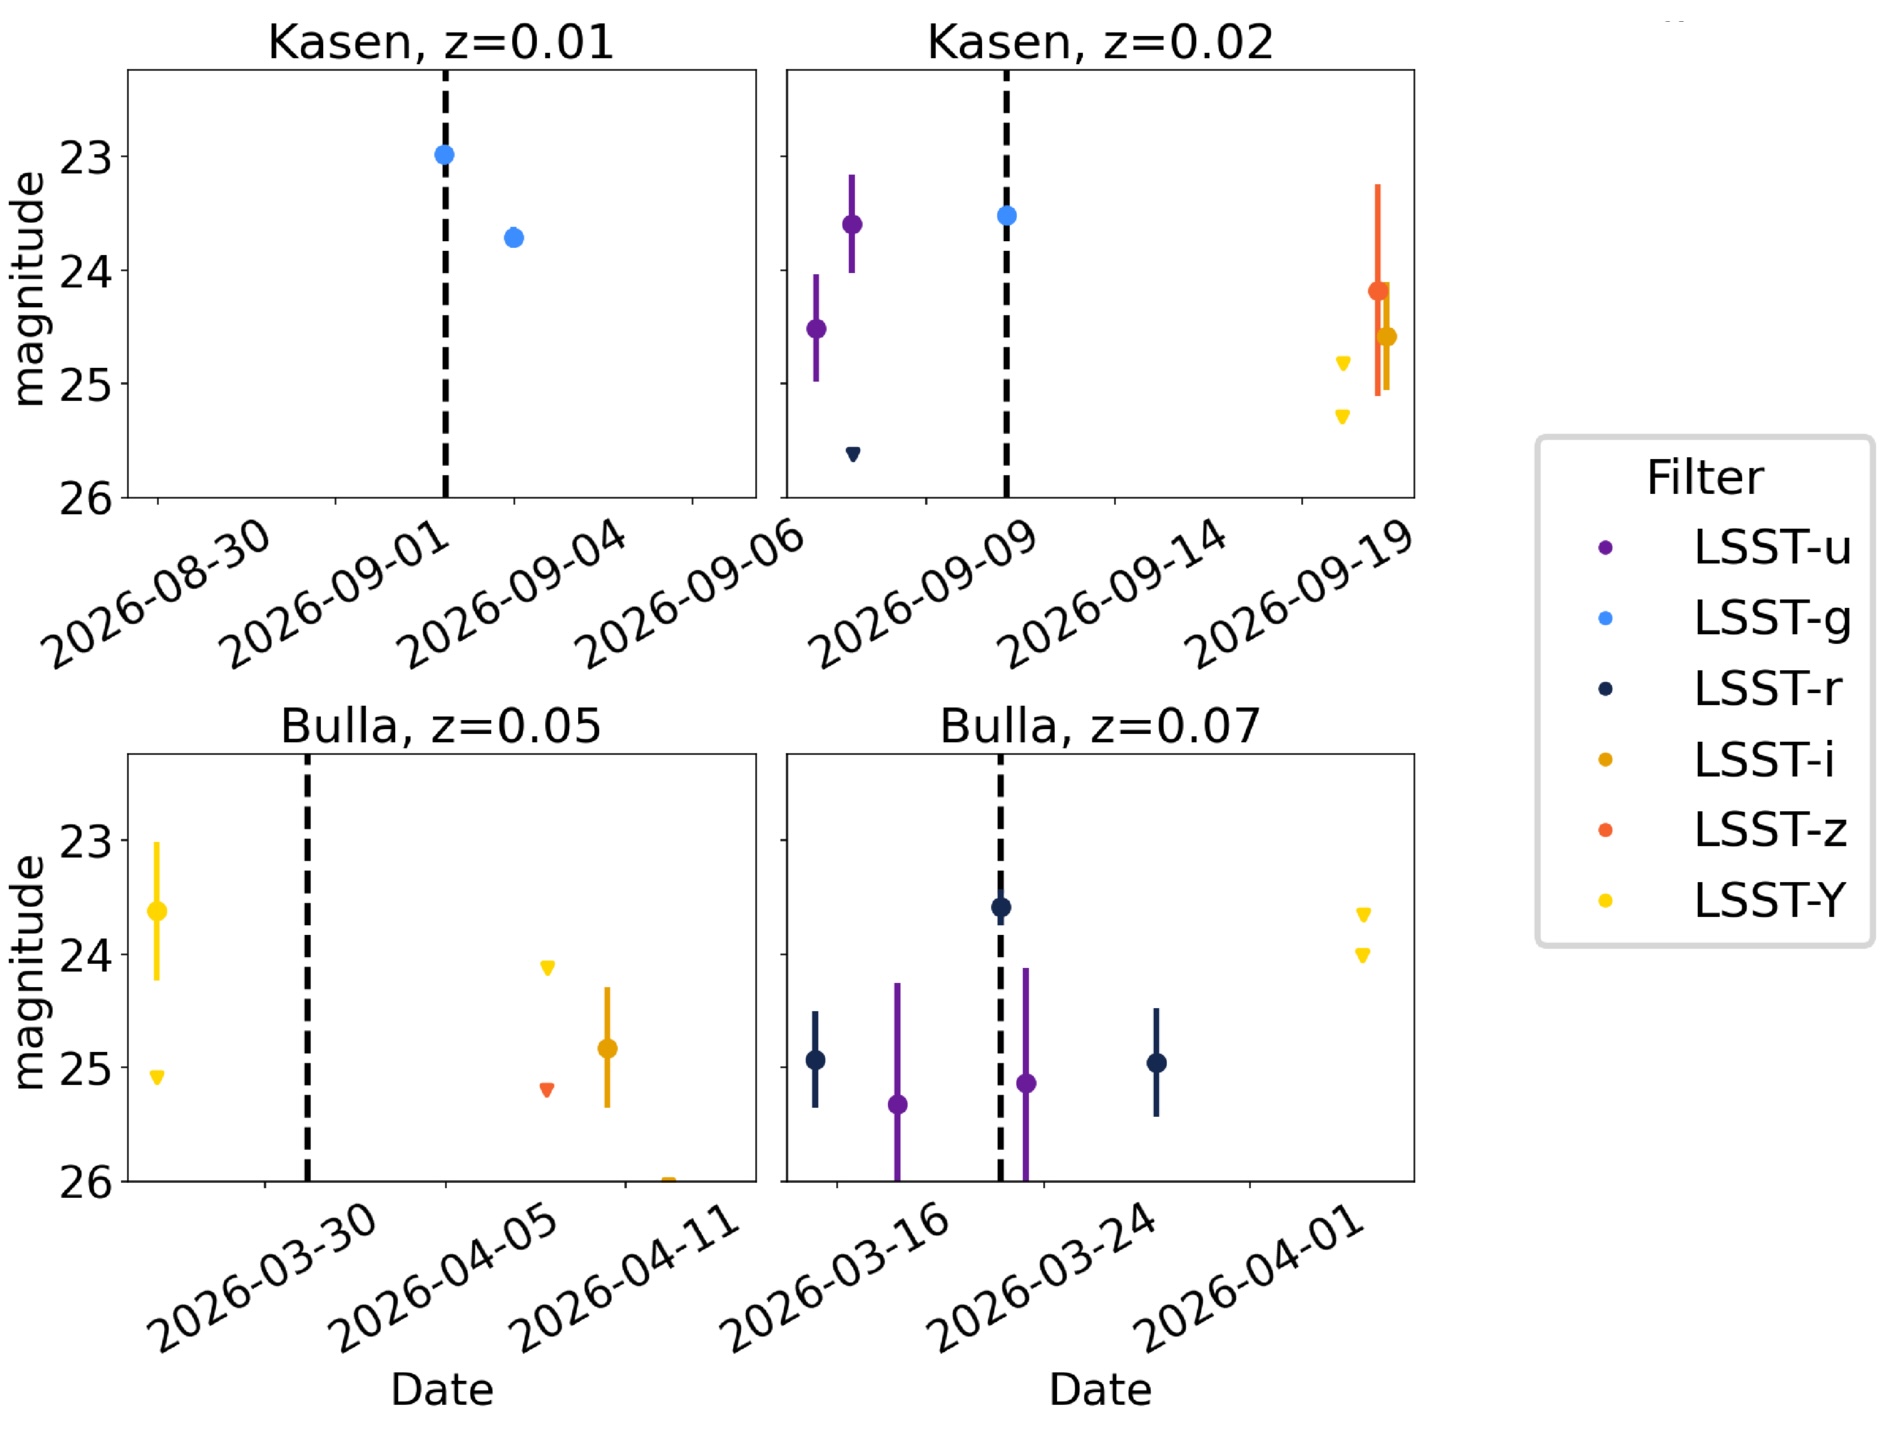
Examples of simulated kilonova light curves for different redshifts and models (Kasen and Bulla). Click to enlarge. [Adapted from Stevenson et al. 2026]

Searching for Signals

Though Rubin is a transient-tracking powerhouse, it’s not ideally suited to discovering kilonovae specifically; these events evolve so rapidly that Rubin may only be able to collect a few data points before the event fades from its view. To gauge Rubin’s efficacy as a kilonova detector, Stevenson and collaborators simulated kilonova light curves and identified detections with a signal-to-noise ratio greater than 5; these detections will be passed to the data broker. They found that Rubin will detect about 42 kilonovae per year, but only a few will have a strong enough signal to be passed to the broker.

For the handful of detections that are passed to the broker, what are the prospects for tracking down the associated gravitational wave signals? Due to the survey cadence, most kilonova detections occurred 1–2 days after the gravitational waves from the neutron star collision would have reached Earth, but delays of up to 5 days were possible. This means that searches for gravitational wave signals must sift through multiple days of data — a computationally intensive prospect that might require the development of new search techniques. The computational requirements of this search are increased by the possibility of contaminants (signals misclassified as kilonovae and passed on by the data broker), which will require additional followup.

Despite these challenges, it’s clear that Rubin’s upcoming detections of kilonovae will advance our study of these rare events. With LSST expected to get underway early this year, the next multi-messenger signal may be just around the corner.

Citation

“Strategy for Identifying Vera C. Rubin Observatory Kilonova Candidates for Targeted Gravitational-Wave Searches,” Simon Stevenson et al 2026 ApJ 998 8. doi:10.3847/1538-4357/ae244e

The post How Many Kilonovae Will Rubin Observatory Help Us Spot? appeared first on AAS Nova.

Supernovae, Shocks, and Spindown: A Possible Origin Story for Ultra-Long-Period Pulsars

16 January 2026 at 17:00

Researchers have recently discovered a number of ultra-long-period pulsars that are difficult to explain with typical pulsar models. A new article explains how these pulsars might arise from massive stars in close binary systems.

Strangely Slow Sources

Crab Nebula

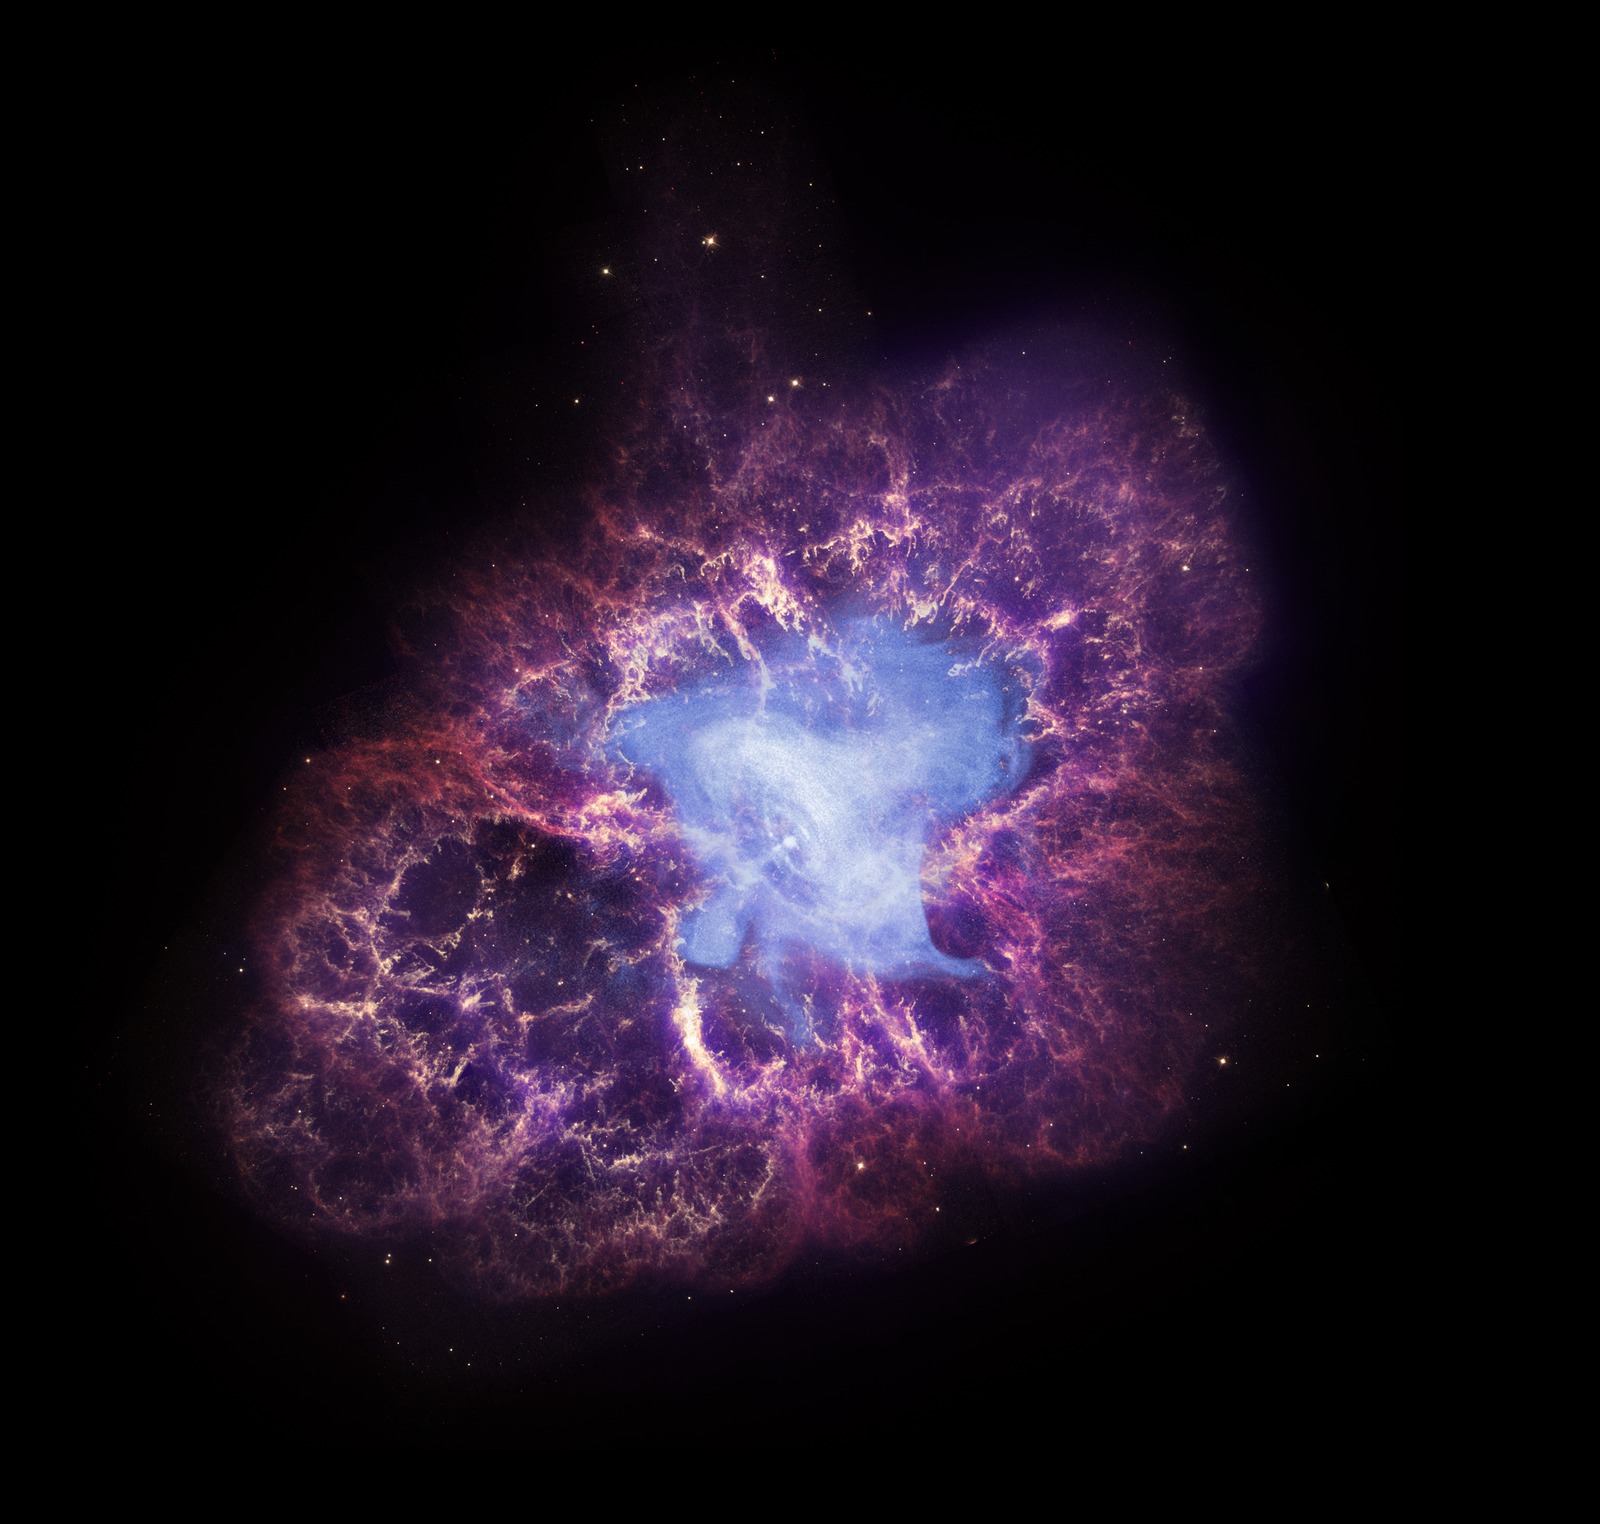
A multi-wavelength view of the Crab Nebula, the remnant of a supernova that birthed a neutron star. The neutron star powers a pulsar wind nebula, shown in blue. [X-Ray: NASA/CXC/J.Hester (ASU); Optical: NASA/ESA/J.Hester & A.Loll (ASU); Infrared: NASA/JPL-Caltech/R.Gehrz (Univ. Minn.)]

When massive stars go supernova, the explosion can leave behind the condensed stellar core in the form of a neutron star. Neutron stars that spin rapidly become pulsars, whose fast rotation powers beams of radio emission along the star’s poles.

Until not too long ago, pulsars appeared to have periods no longer than 12 seconds. Above that “sluggish” rotation rate, researchers suggested, pulsars could no longer produce electron–positron pairs and channel them along polar magnetic field lines to generate their characteristic radio signals.

So it seemed, until unexpectedly slow pulsars began to crop up. The first trend-breaking pulsars had periods of a few dozen seconds, and objects with pulse periods of minutes or hours have now been found. What could these strange objects be?

Neutron Star Origin Story

In a recent article led by Savannah Cary (University of California, Berkeley), researchers proposed that these strange radio sources are pulsars, but pulsars that rotate slowly and have magnetically powered (rather than rotationally powered) radio emission.

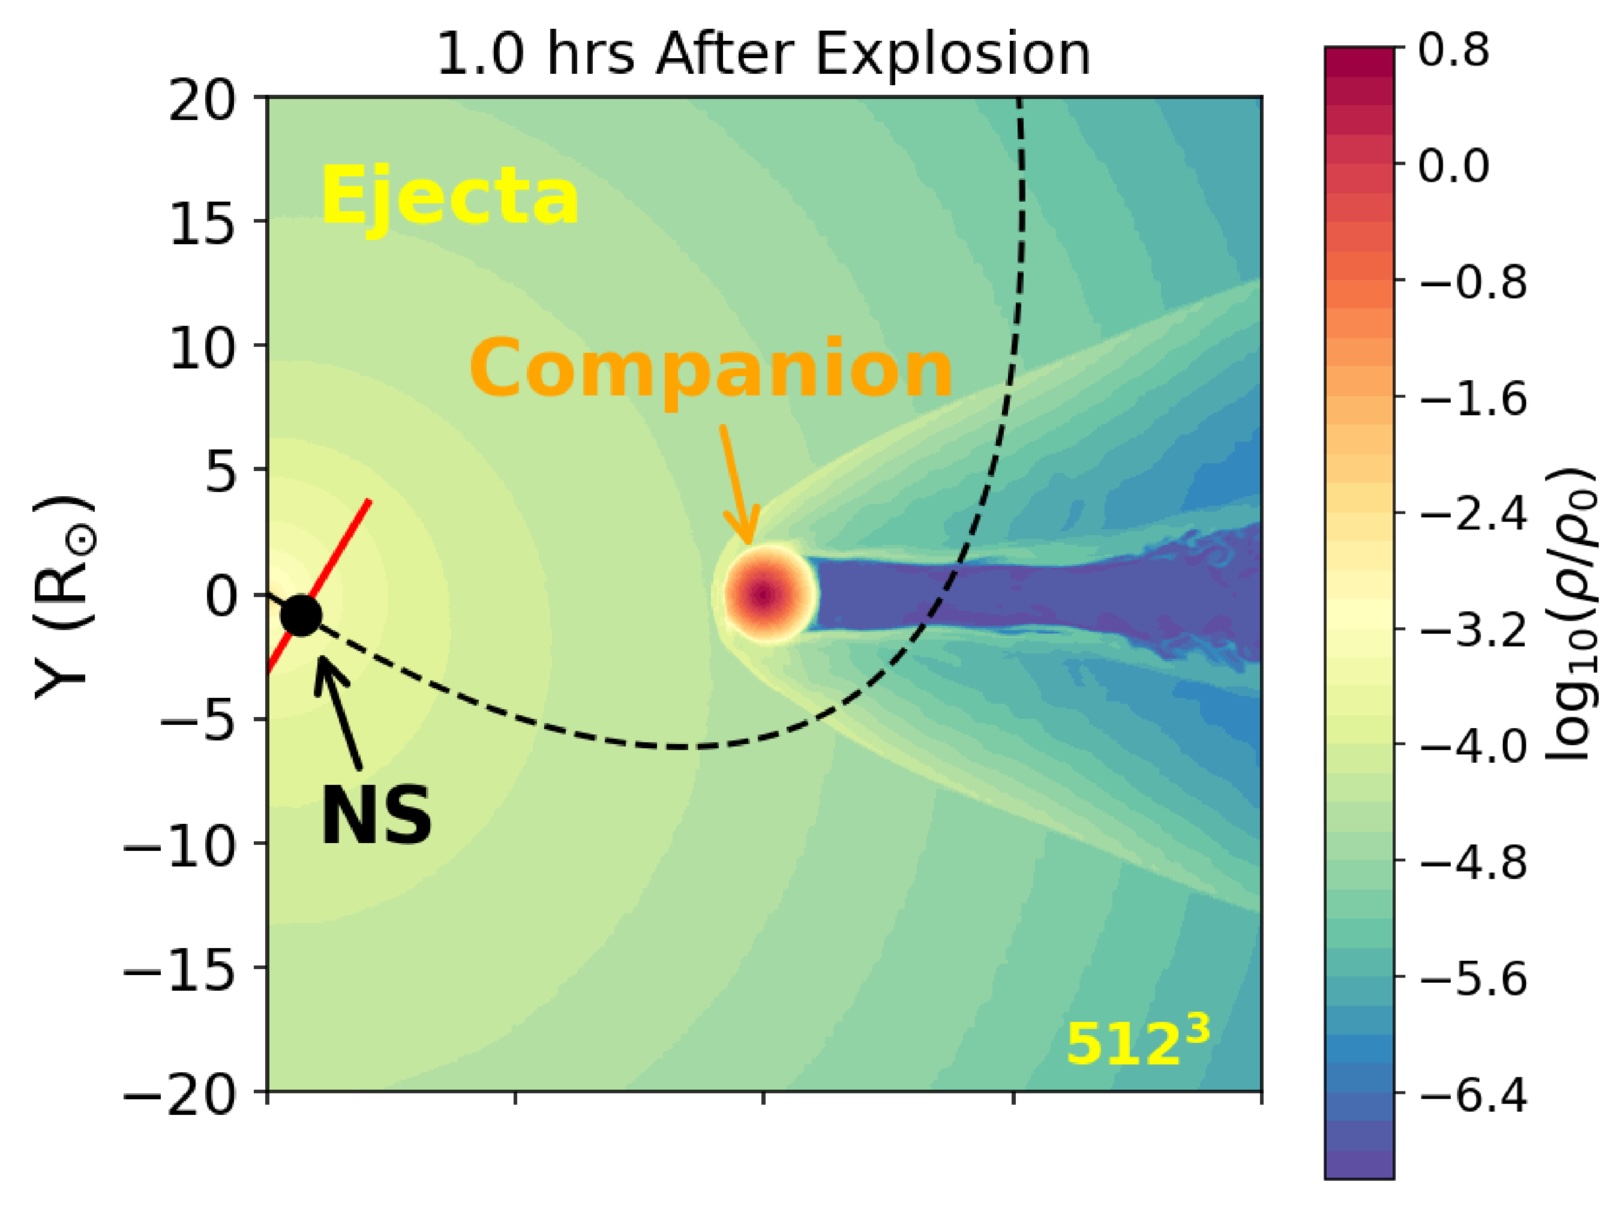
The proposed origin story for these ultra-long-period pulsars begins with a binary system containing a massive star and a close stellar companion. As the massive star evolves, it transfers its outer layers to the companion and expires as a stripped-envelope supernova that births a rapidly spinning neutron star. As the supernova ejecta crashes into the companion star, the star heats up and expands to 5–100 times its original radius.

simulation of supernova ejecta colliding with a star

Simulation snapshot taken one hour after the supernova explosion. The black dashed line shows the path the neutron star (NS) will take through the companion star’s outer layers. Click to enlarge. [Adapted from Cary et al. 2026]

Meanwhile, the explosion delivers a ferocious kick to the newborn neutron star, likely unbinding the binary system. This sets the neutron star on a new course that could take it through the puffed-up outer layers of its former companion, where it may collect gas from the star and ejected material from the supernova into an accretion disk.

Slowing Down

Cary’s team explored the outcomes of this scenario with a trio of simulations: hydrodynamical models for the shock heating of the companion star, numerical models for the formation of the disk around the neutron star, and analytical models for the interaction between the disk and the neutron star.

For a binary system containing stars of 6.4 and 4.0 solar masses and a separation of 20 solar radii — values drawn from observations and simulations — the resulting unbound neutron star collects a disk in 8–10% of cases. The neutron star’s mass, radius, rotation rate, and magnetic field strength determine whether the neutron star and the disk will interact. If they don’t, the neutron star remains rotating rapidly like a typical pulsar. If they do, the neutron star’s rotation will slow to a relative crawl over about a million years. For modest magnetic fields between 1013 and 1014 Gauss, this means rotation periods in the realm of 102 seconds, whereas stronger magnetic fields, above 1015 Gauss, yield periods of roughly a day.

This work suggests that close binary systems could be the source of ultra-long-period pulsars, of which Cary’s team estimates there may be 10–1,000 in the Milky Way. Future work will explore this possibility further, examining broader swaths of parameter space to learn more about how this scenario could contribute to the population of ultra-long-period pulsars in our galaxy.

Citation

“Accretion from a Shock-Inflated Companion: Spinning Down Neutron Stars to Hour-Long Periods,” Savannah Cary et al 2026 ApJ 996 141. doi:10.3847/1538-4357/ae1d43

The post Supernovae, Shocks, and Spindown: A Possible Origin Story for Ultra-Long-Period Pulsars appeared first on AAS Nova.

Selections from 2025: Pinpointing a Bright Fast Radio Burst with CHIME

29 December 2025 at 17:00

JWST image of the galaxy NGC 4141

Editor’s Note: For the remainder of 2025, we’ll be looking at a few selections that we haven’t yet discussed on AAS Nova from among the most-downloaded articles published in AAS journals this year. The usual posting schedule will resume January 2nd.

FRB 20250316A: A Brilliant and Nearby One-Off Fast Radio Burst Localized to 13 pc Precision

Published August 2025

Main takeaway:

NGC 4141

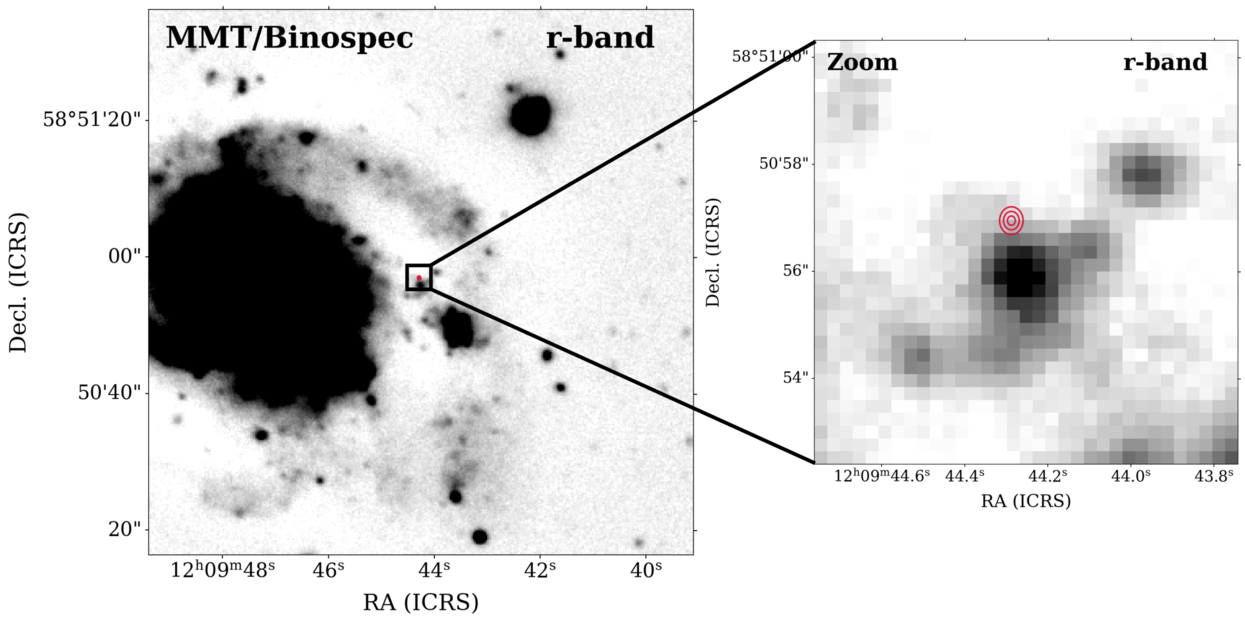
MMT observation of NGC 4141 (left) and zoomed-in on FRB 20250316A’s location. The red lines show the 1-, 2-, and 3-sigma localization ellipses of the burst. Click to enlarge. [CHIME Collaboration 2025]

Discovered in March 2025 by the Canadian Hydrogen Intensity Mapping Experiment (CHIME) Outrigger array, FRB 20250316A is one of the brightest fast radio bursts ever observed. The CHIME collaboration traced the burst to the galaxy NGC 4141, 130 million light-years from Earth, and locked in on the source’s position with a precision of just 42 light-years.

Why it’s interesting:

The origins of fast radio bursts — bright flashes of radio waves lasting on the order of milliseconds — are mysterious, despite several thousand bursts having been cataloged. Among the many questions that remain is whether one-off bursts and repeating bursts arise from the same population of objects, or if they have entirely different origins. So far, FRB 20250316A appears to be a one-off burst; while it’s still possible that the source could emit another burst, the team noted that the burst’s properties don’t mesh with those of known repeating bursts. This makes the discovery and localization of FRB 20250316A an excellent opportunity to investigate the sources of one-off fast radio bursts.

More about the potential source of this burst, and prospects for pinpointing future sources:

After homing in on FRB 20250316A’s location, the CHIME collaboration embarked on a multi-wavelength follow-up campaign to learn more about where the burst came from. This campaign placed constraints on the metallicity and gas density near the source, which lies about 600 light-years from the center of the nearest star-forming region. A separate research article, published the same day as this work from the CHIME collaboration, described the discovery of a red giant star in the FRB 20250316A source region. This star may be located near FRB 20250316A’s source by chance, or it could be in a binary system with the source. With the main CHIME array in British Columbia continuing to scan for new bursts and three newly built outrigger telescopes in British Columbia, West Virginia, and California now online, we can expect many more precise localizations in the future!

Citation

The CHIME/FRB Collaboration: et al 2025 ApJL 989 L48. doi:10.3847/2041-8213/adf62f

The post Selections from 2025: Pinpointing a Bright Fast Radio Burst with CHIME appeared first on AAS Nova.

Selections from 2025: A Repeating Fast Radio Burst in a Quiescent Galaxy

17 December 2025 at 17:00

CHIME radio telescope

Editor’s Note: For the remainder of 2025, we’ll be looking at a few selections that we haven’t yet discussed on AAS Nova from among the most-downloaded articles published in AAS journals this year. The usual posting schedule will resume January 2nd.

A Repeating Fast Radio Burst Source in the Outskirts of a Quiescent Galaxy

Published January 2025

Main takeaway:

FRB 20240209A localization region and likely host galaxy

Gemini-North image of the FRB 20240209A localization region (white lines) and the source’s likely host galaxy (cyan crosshairs). [Shah et al. 2025]

Using the Canadian Hydrogen Intensity Mapping Experiment (CHIME), Vishwangi Shah (McGill University) and collaborators discovered the repeating fast radio burst source FRB 20240209A. The team localized the source to roughly 130,000 light-years from the center of a quiescent elliptical galaxy about 1.8 billion light-years away. This suggests that the bursts originated from a globular cluster on the outskirts of the galaxy, pointing to a delayed formation pathway for the source.

Why it’s interesting:

Fast radio bursts are brief, intense flashes of radio waves from sources across the universe. Aside from one fast radio burst that has been associated with a magnetar within our own Milky Way, the source of these outbursts remains mysterious, and precise localization of these bursts is key to pinning down their origins; fast radio bursts that come from galaxies with active star formation may be linked to “prompt” formation channels like core-collapse supernovae or young magnetars, while bursts that arise in quiescent galaxies might be due to “delayed” formation pathways such as neutron stars that are born from merging white dwarfs.

How FRB 20240209A compares to other fast radio bursts, and what may have caused it:

FRB 20240209A is similar to other repeating fast radio bursts in terms of the shape of its individual bursts as well as its tendency to undergo periods of high and low bursting activity. Its location makes it quite unusual, though: it’s the only repeating fast radio burst known to come from a quiescent galaxy, and it’s the only burst — repeating or not — that has been found in an elliptical galaxy. If confirmed to originate from a globular cluster, FRB 20240209A would also be only the second known fast radio burst source to come from this type of environment. Shah’s team explored multiple possible origin stories for FRB 20240209A, including the possibility that the source was ejected from its host galaxy. The team favors an origin involving a magnetar formed through the collapse or merger of a compact object.

Citation

Vishwangi Shah et al 2025 ApJL 979 L21. doi:10.3847/2041-8213/ad9ddc

The post Selections from 2025: A Repeating Fast Radio Burst in a Quiescent Galaxy appeared first on AAS Nova.

Investigating the Most Luminous Known Fast Blue Optical Transient

5 December 2025 at 17:00

luminous fast blue optical transient

Fast blue optical transients are a rare class of emerging transients, the source of which is not yet known. A recent study of the most luminous known object in this class, AT2024wpp, reveals clues about their identity.

A New Class of Transients

In 2018, a network of robotic survey telescopes spotted a new transient source toward a galaxy 200 million light-years away. It was bright and getting brighter rapidly, rising in just a few days to become 10–100 times brighter than the brightest supernovae.

That transient, AT2018cow, was the first of now tens of known sources like it that are too blue, too rapidly evolving, and too luminous to be ordinary supernovae. Despite the growing number of luminous fast blue optical transients (FBOTs) discovered, exactly what causes them is still up for debate.

Brightest of the Bright

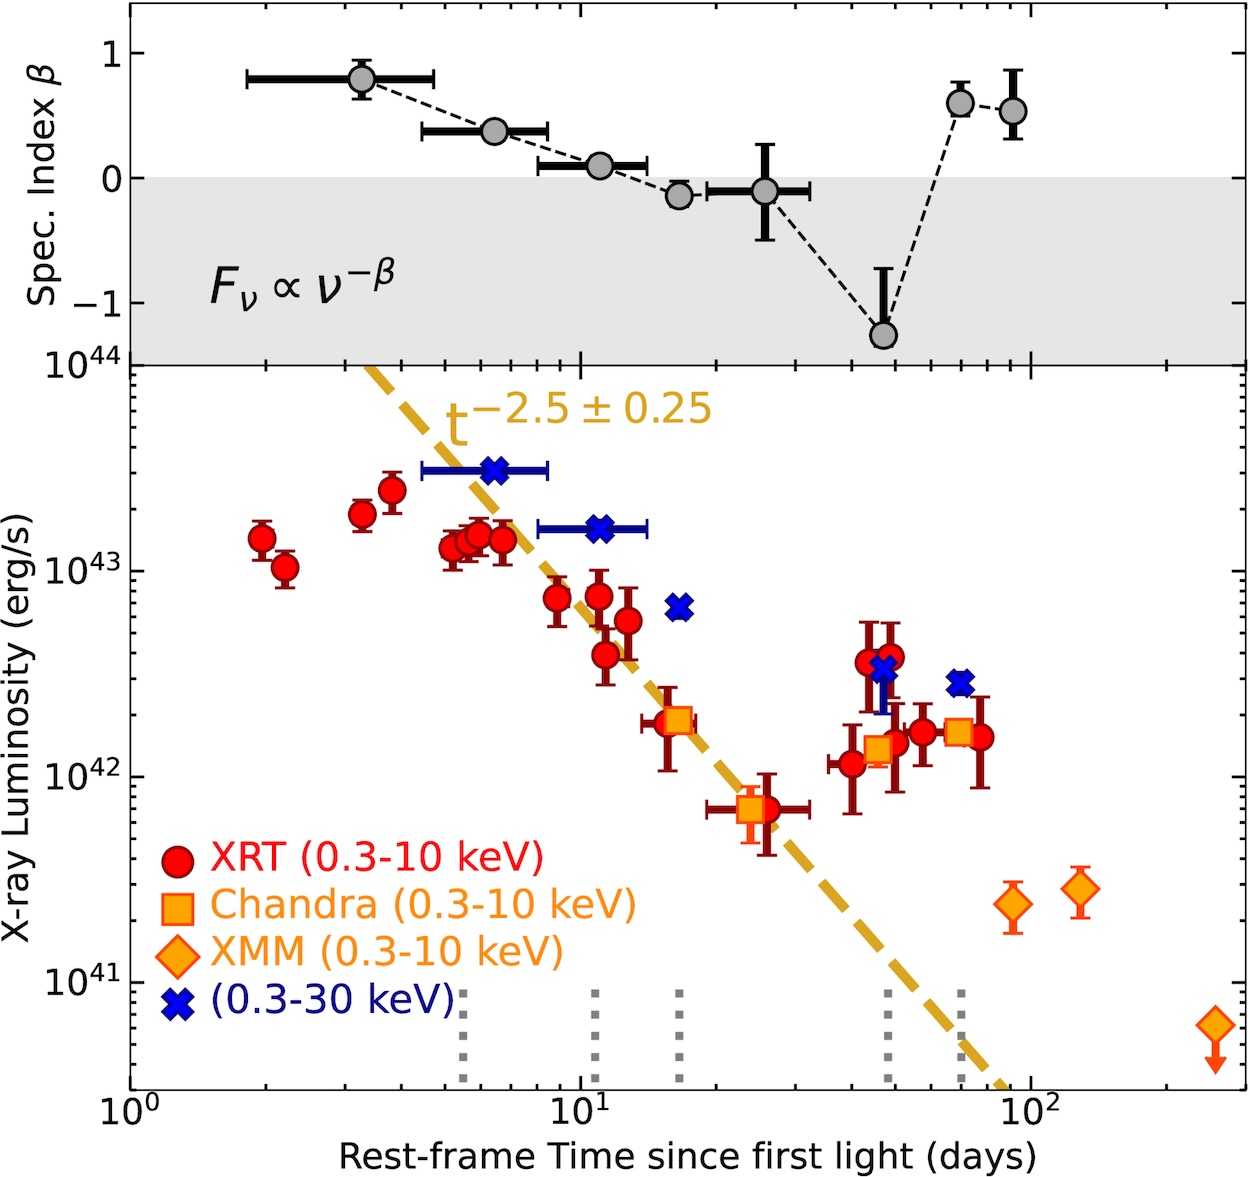
Enter AT2024wpp: the most luminous known fast blue optical transient to date. In about a month and a half, this record-breaking event radiated away more than 1044 Joules — which is roughly equivalent to the Sun’s radiative output over 8 billion years. Nayana A. J. (University of California, Berkeley) and collaborators carried out an extensive multi-wavelength observing campaign to track the behavior of AT2024wpp from 2 to 280 days after it was first discovered, making it only the second FBOT to undergo such detailed study. This research article describes the team’s findings at radio and X-ray wavelengths.

X-ray behavior of AT2024wpp

X-ray behavior of AT2024wpp. The top plot demonstrates the hardening of the spectral index (i.e., shifting toward higher energies) around the peak at 50 days. Click to enlarge. [Nayana A. J. et al. 2025]

The team enlisted the Atacama Large Millimeter/submillimeter Array, the Australian Telescope Compact Array, the Allen Telescope Array, the MeerKAT array, and the Giant Metrewave Radio Telescope to survey the source from 0.25 to 203 GHz. On the opposite end of the spectrum, they collected observations from the Neil Gehrels Swift Observatory, the Chandra X-ray Observatory, XMM-Newton, and NuSTAR to probe AT2024wpp’s X-ray emission from 0.2 to 79 keV.

These observations revealed that AT2024wpp’s X-ray emission remained bright and constant for 7 days before plummeting until day 30. The emission then rocketed up again, peaking at day 50, and shifted toward higher energies. Finally, things settled down to a lower brightness around day 75. In the radio, AT2024wpp’s behavior was complex, showing a never-before-seen meteoric rise at millimeter wavelengths around 17–32 days.

Comparison of the density of the material surrounding AT2024wpp and other FBOTs

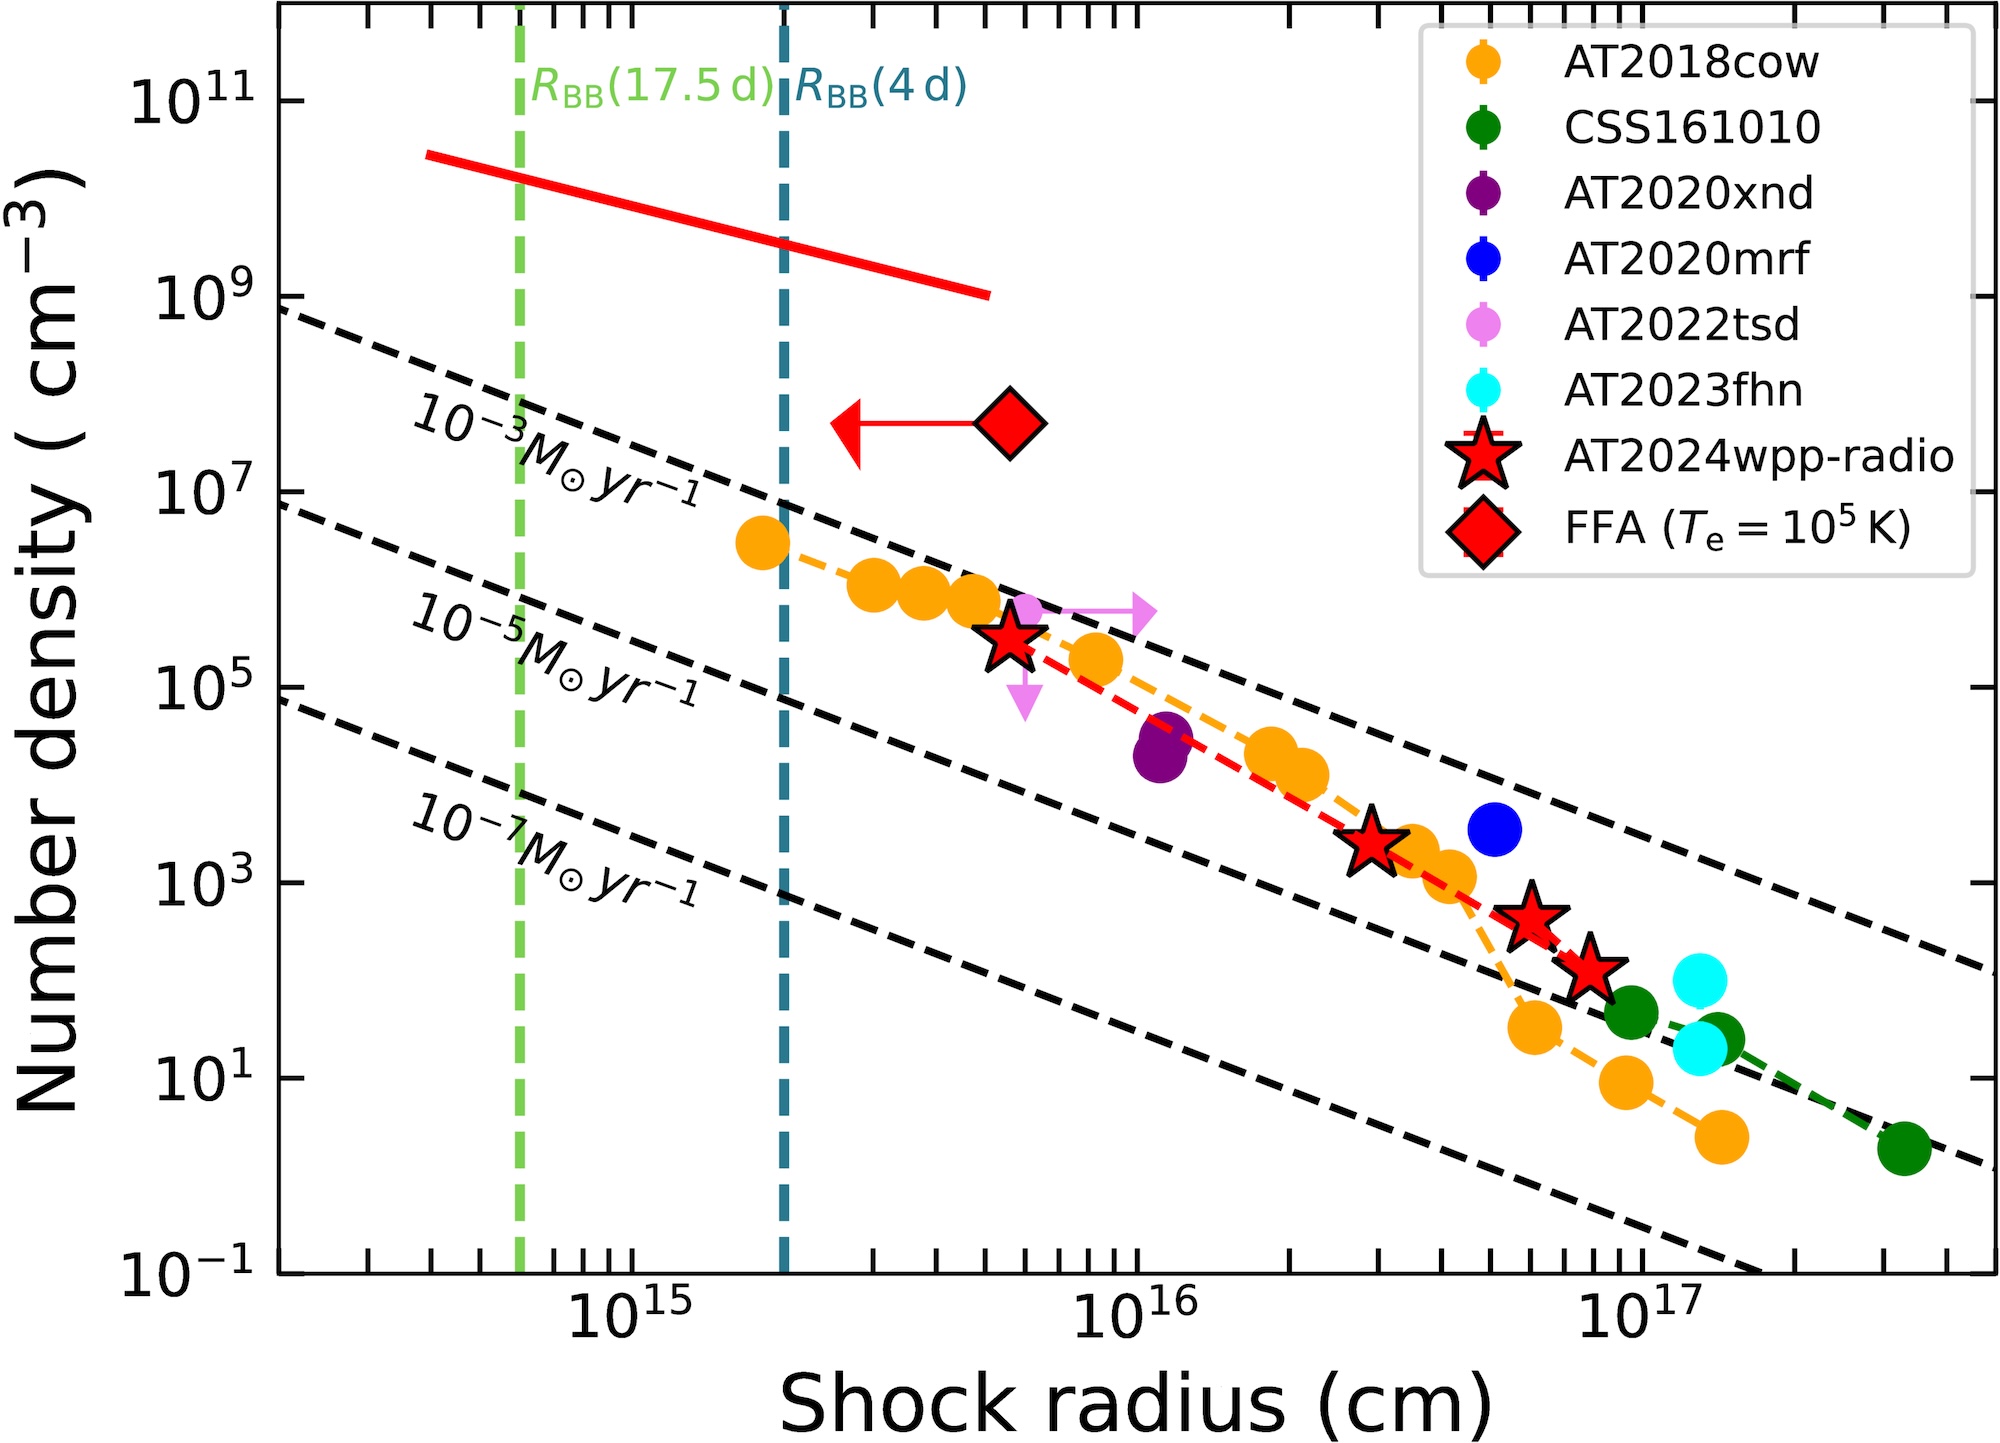
Comparison of the density of the material surrounding AT2024wpp (red stars) and other FBOTs. Click to enlarge. [Nayana A. J. et al. 2025]

Possible Scenarios

Based on these observations, the team favors a scenario involving a central compact object — a black hole or a neutron star — that is rapidly accreting matter from its surroundings. This accretion powers outflows that accelerate to more than 40% the speed of light and send a shock through dense material around the system. Notably, the team found that the density of the surrounding material is similar among FBOTs that have bright radio emission, including AT2024wpp. This suggests that similar processes are responsible for setting up these events.

The team pointed to two scenarios from the literature that are compatible with their data. In the first, a newborn neutron star or black hole collides with a stellar companion, ripping the star apart and accreting its remains. In the second, a Wolf–Rayet star (a massive star that has shed much of its atmosphere and is nearing its eventual end as a supernova) is tidally disrupted by a neutron star or a black hole. Though it’s not possible to narrow the possibilities further, the immense energies involved tilt things in favor of a black hole rather than a neutron star.

Though FBOTs remain mysterious, additional multi-wavelength studies like this one can help to illuminate their origins. And with the Ultraviolet Transient Astronomy Satellite (ULTRASAT) and UltraViolet EXplorer (UVEX) missions slated to launch within the next five years, we can expect many more FBOT discoveries in the near future.

Citation

“The Most Luminous Known Fast Blue Optical Transient AT 2024wpp: Unprecedented Evolution and Properties in the X-Rays and Radio,” Nayana A. J. et al 2025 ApJL 993 L6. doi:10.3847/2041-8213/ae0b4d

The post Investigating the Most Luminous Known Fast Blue Optical Transient appeared first on AAS Nova.
Monthly Roundup: Astronomy in the News

30 July 2025 at 18:12

collage of multiple illustrations and images

There’s been a lot of astronomy in the news lately! Many recent news stories have featured research published in the AAS journals, so today we’re taking a look at four research articles that have recently gotten attention from the media.

New Horizons Navigates by the Stars

Starting closest to home, the first article describes a technological demonstration that took place on the edge of our solar system. In the nearly 20 years since its launch, the New Horizons spacecraft has ventured from Cape Canaveral to its current berth in the Kuiper Belt, roughly 61 au (5.7 billion miles or 9.1 billion kilometers) from Earth. In that time, New Horizons became the first spacecraft to venture close to Pluto and its moons as well as a second Kuiper Belt object called Arrokoth.

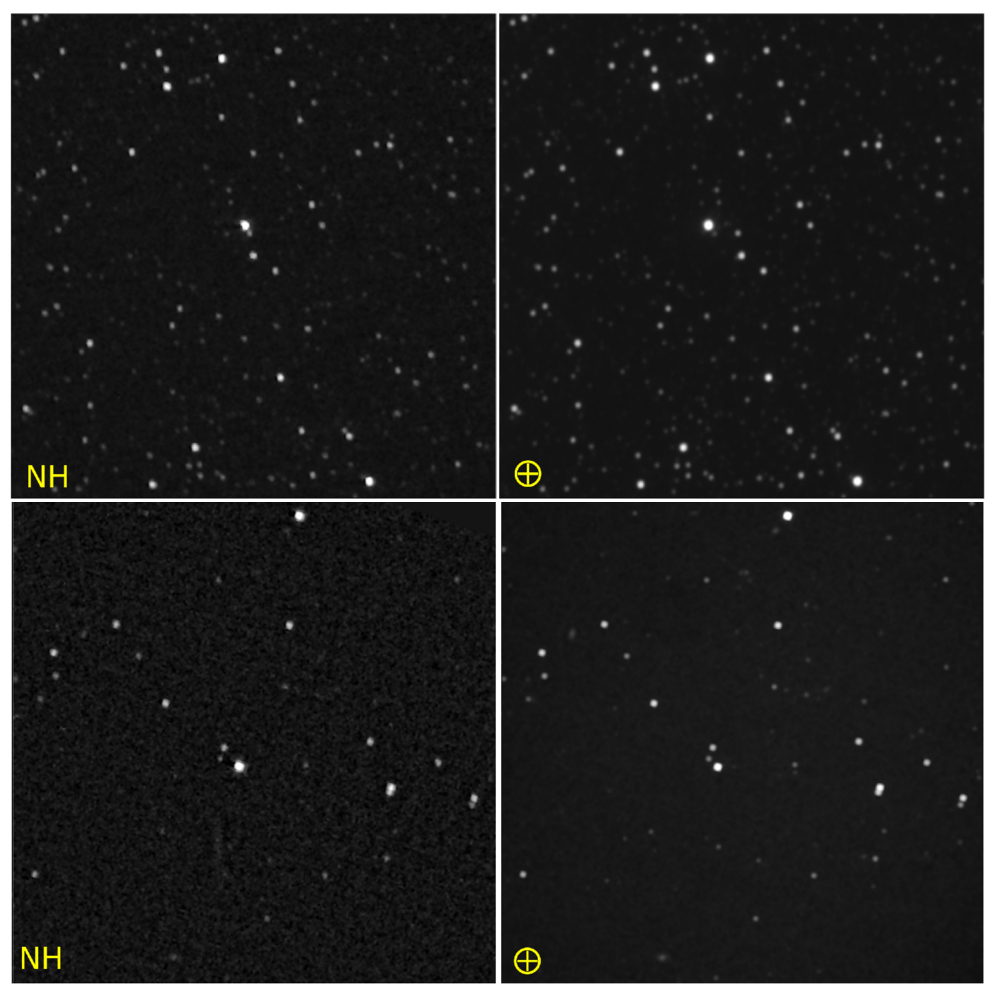
images of Proxima Centauri and Wolf 359 from New Horizons and from Earth

The difference in the position of Proxima Centauri (top row) and Wolf 359 (bottom row) as seen from New Horizons (left column) and Earth (right column) is evident by eye. [Adapted from Lauer et al. 2025]

New Horizons has also traveled a large enough distance for nearby stars to shift their positions relative to the background of more distant stars, enabling a measurement of the spacecraft’s position in space. Tod Lauer (NSF National Optical Infrared Astronomy Research Laboratory) and collaborators demonstrated this ability using New Horizons Long Range Reconnaissance Imager (LORRI) observations from April 2020, when the spacecraft was 47 au from the Sun. The stars used for the parallax measurements were Proxima Centauri and Wolf 359, two of the nearest stars to Earth. The team measured the stars’ positions relative to the positions of background stars and compared the results to observations made from Earth.

From the apparent shift in position of the two stars, the team determined the location of the spacecraft in space as well as the error in their measurement. They were able to ascertain the position of the spacecraft to within 0.44 au of its true position.

Though this measurement is far less accurate than localization with the Deep Space Network, it’s still an important step toward understanding the future prospects for autonomous spacecraft navigation via the stars. Looking ahead to future interstellar navigation systems, the team showed that measurements of a few nearby stars (Proxima Centauri and Barnard’s Star are the best bets for journeys within tens of thousands of astronomical units of the Sun) are more useful than measurements of a larger number of more distant stars. Basing measurements on a larger number of images to cut down on random scatter in the position of the star would also improve the results, as would simply using newer instruments. Ultimately, other types of navigation systems, such as those based on measurements of pulsars, are more likely to reach the precision necessary for autonomous spacecraft navigation. However, this method remains interesting, given that the straightforward nature of the imaging and analysis is already well within the capabilities of modern spacecraft systems.

First Detection of Semiheavy Water Ice Around a Low-Mass Protostar

Next up is a discovery from 457 light-years away in the Taurus molecular cloud. With a mass of 0.3–0.5 solar mass, a disk spanning 75–125 au, and a surrounding envelope of 0.9 solar mass, the isolated low-mass protostar L1527 is likely to grow into a star of similar mass to the Sun. That makes it an excellent target for investigating how planetary systems like our own acquire critical molecules like water.

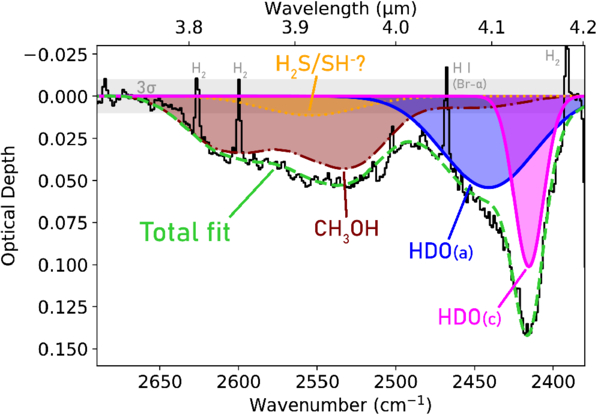
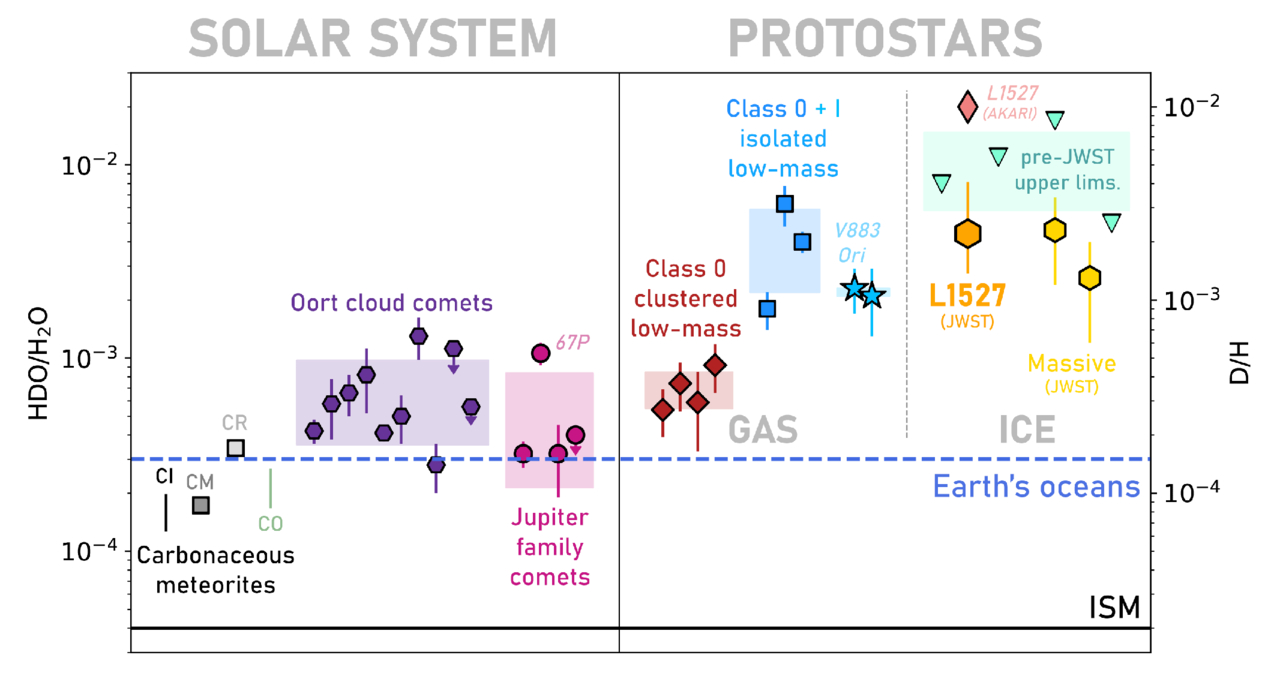
Katerina Slavicinska (Leiden Observatory) and coauthors used JWST to search L1527 for semiheavy water (HDO) — a water molecule in which one of the hydrogen atoms is replaced with a deuterium atom. HDO has been detected in many locations throughout our solar system, including in Earth’s oceans, and water in our solar system tends to contain a high abundance of HDO molecules. A high deuterium abundance can be linked to formation in a cold environment, suggesting that our solar system’s water may have formed in the icy clouds out of which the Sun and the planets were born.

JWST spectrum of L1527

JWST spectrum of L1527. [Slavicinska et al. 2025]

Thanks to JWST’s high resolution and sensitivity, Slavicinska’s team was able to detect HDO ice in L1527, where previous, lower-resolution observations had only hinted at the presence of the molecule. They also measured emission from H2O ice, yielding a ratio of the abundances of the two types of water. The ice HDO/H2O ratio of L1527 is consistent with the gas HDO/H2O ratios of other isolated low-mass protostars and 4–7 times higher than the gas HDO/H2O ratios of clustered low-mass protostars.
plot of the ratio of semiheavy water to water for various solar system objects and protostars

HDO/H2O ratios for various solar system objects and protostars. Click to enlarge. [Slavicinska et al. 2025]

This difference may be due to differences in the star-forming environments of clustered protostars, or it may signal that the water in these protostars underwent gas-phase processing at some point. If environmental factors are the cause, that would suggest that L1527 should have a higher HDO/H2O ratio than objects in our solar system, since the Sun likely formed in a cluster environment.

This study demonstrates JWST’s ability to investigate the chemistry of young stars and probe the chemical evolution of protostars and planetary systems. Slavicinska and coauthors identified two important next steps to advance our understanding of the chemistry of star- and planet-forming environments: 1) measuring gas-phase and ice-phase HDO/H2O ratios in the same object to understand how gas-phase chemistry alters water around protostars and 2) measuring the HDO/H2O ratios of larger samples of isolated and clustered protostars in order to understand the impact of environmental factors.

A Massive Planet Approaches Its Doom

TOI-2109b is an ultra-hot Jupiter exoplanet that orbits its host star every 16 hours, giving it the shortest period of any known hot Jupiter. Orbiting its host star so closely, TOI-2109b is susceptible to powerful tidal forces that can lead to an exchange of angular momentum between the planet and its home star, potentially causing the planet to spiral inward and be engulfed by its star.

orbital periods, temperatures, and radii of ultra-short-period hot Jupiters

Comparison of the orbital period, temperature, and radius of TOI-2109b to other ultra-short-period Jupiters. [Alvarado-Montes et al. 2025]

Jaime Alvarado-Montes (Macquarie University) and collaborators investigated how and when TOI-2109b’s doom might come about. Critical to the discussion is the uncertain age of TOI-2109, which likely lies in the range of 1.09–2.65 billion years. If the star’s age is on the lower end of the range, TOI-2109b’s orbit would decay slowly (~4 milliseconds per year); if the star’s age is on the higher end of the range, the planet’s orbit would decay quickly (~1,100 milliseconds per year). The decay rate depends on the star’s age because planets lose their kinetic energy due to friction inside their host stars, and the efficiency of this process depends upon the interior structure of the star, which changes with age.

Alvarado-Montes and coauthors used data from the Transiting Exoplanet Survey Satellite (TESS), the CHaracterising ExOPlanet Satellite (CHEOPS), and multiple ground-based telescopes to constrain the rate of change of TOI-2109b’s orbital period. Taking into account changes in transit timing due to an outer planet candidate in the system, deviations from spherical symmetry, and other factors, the authors find a likely orbital decay rate of just 2.6 milliseconds per year. This is consistent with the rate predicted for a “young” host star, and it’s expected to shift TOI-2109b’s mid-transit time by a few seconds over a three-year period. This change is potentially detectable with high-cadence observations, helping to understand not just the fate of TOI-2109b, but of ultra-short-period planets as a whole.

Discovery of a Mysterious Long-Period Transient

Finally, Fengqiu Adam Dong (National Radio Astronomy Observatory; Green Bank Observatory) and coauthors recently described their discovery of an unusual long-period transient radio signal. Long-period radio transients exhibit signals that repeat with periods ranging from 10 seconds to multiple hours. While the exact origin of these signals remains unknown, researchers suspect that magnetic white dwarfs and neutron stars are the cause, with the two sources perhaps representing different classes under the long-period radio transient umbrella.

The signal was detected by the Canadian Hydrogen Intensity Mapping Experiment (CHIME) radio telescope, which was searching for bursts of radio emission from pulsars within our galaxy. The newly discovered radio signal, which comes from a source named CHIME J1634+44, has a primary period of 841 seconds and a secondary period of 4,206 seconds, making it decidedly un-pulsar-like. Dong’s team performed follow-up observations of CHIME J1634+44 with the Very Large Array, the Neil Gehrels Swift Observatory, and the Green Bank Telescope. The Very Large Array and the Green Bank Telescope each detected two bursts from the source, bringing the total number of bursts reported in this study to 89.

images of CHIME J1634+44

Continuum images of CHIME J1634+44 from the Very Large Array. The two panels show the autocorrelation function of the left-hand (left) and right-hand (right) circularly polarized components of the signal. CHIME J1634+44 is only detected in one of these two images, which suggests a 100% circularly polarized signal. [Dong et al. 2025]

CHIME J1634+44 is unusual in a number of ways. Its emission is almost entirely circularly polarized, meaning that the plane in which the electric and magnetic waves of the radio signal oscillates rotates in a circle as the signal travels through space. The time between pulses is also decreasing, slowly but steadily. If the pulsation period coincides with an object’s spin period, this means that the object is spinning faster as time goes on; this could occur if the source of the bursts is accreting material from a companion. If instead the pulsation period is linked to the orbital period of an object in a binary system, emission of gravitational waves could be causing the orbit to shrink.

What kind of object could produce this signal? Dong and coauthors considered binary systems containing either a white dwarf or a neutron star. Neither scenario perfectly fits the available evidence, but the team concluded that a binary system containing a neutron star is the likeliest source of the long-period, highly polarized, steadily accelerating pulses of CHIME J1634+44. The strongest evidence in favor of this scenario is that neutron stars are known to exhibit strongly polarized pulses of similar luminosity to those from CHIME J1634+44. Dong’s team expects that CHIME J1634+44 will remain an important test of theories of long-period radio transients — and as new information emerges about its identity, CHIME J1634+44 might just find its way into the news again!

Citation

“A Demonstration of Interstellar Navigation Using New Horizons,” Tod R. Lauer et al 2025 AJ 170 22. doi:10.3847/1538-3881/addabe

“HDO Ice Detected Toward an Isolated Low-Mass Protostar with JWST,” Katerina Slavicinska et al 2025 ApJL 986 L19. doi:10.3847/2041-8213/addb45

“Orbital Decay of the Ultra-Hot Jupiter TOI-2109b: Tidal Constraints and Transit-Timing Analysis,” Jaime A. Alvarado-Montes et al 2025 ApJ 988 66. doi:10.3847/1538-4357/ade057

“CHIME/Fast Radio Burst Discovery of an Unusual Circularly Polarized Long-Period Radio Transient with an Accelerating Spin Period,” Fengqiu Adam Dong et al 2025 ApJL 988 L29. doi:10.3847/2041-8213/adeaab

The post Monthly Roundup: Astronomy in the News appeared first on AAS Nova.
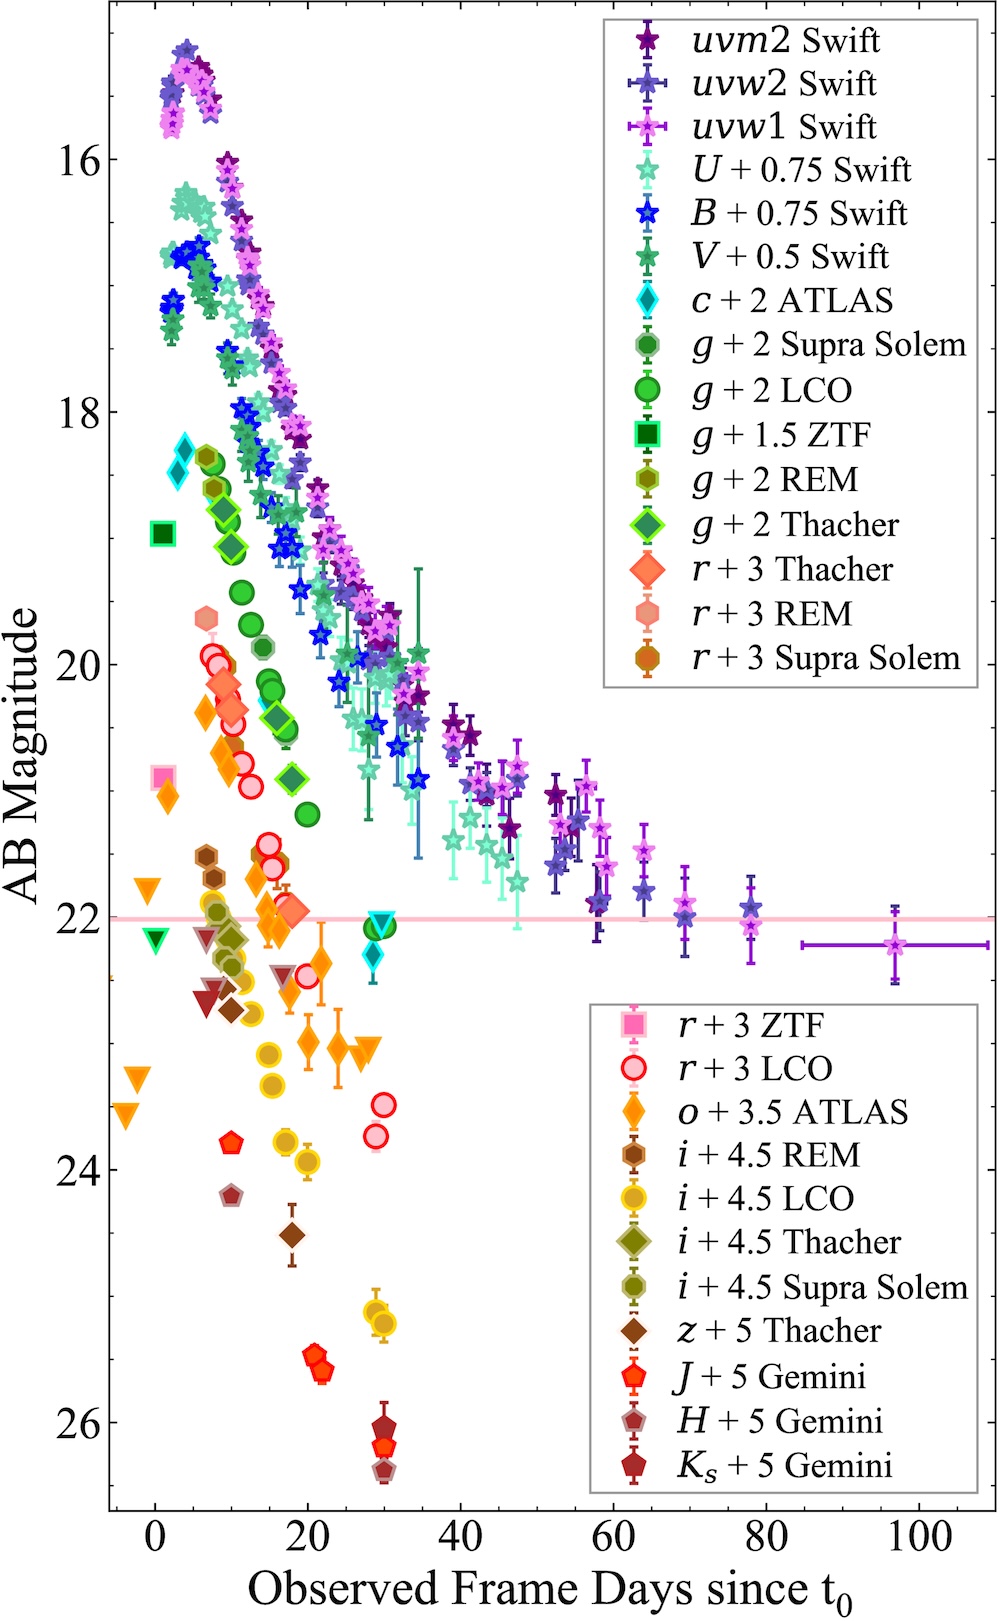
Did That Supermassive Black Hole Rip Apart a Star, or Is It Eating Lunch Like Normal?

13 May 2025 at 17:00

artist's impression of a tidal disruption event

Editor’s Note: Astrobites is a graduate-student-run organization that digests astrophysical literature for undergraduate students. As part of the partnership between the AAS and astrobites, we occasionally repost astrobites content here at AAS Nova. We hope you enjoy this post from astrobites; the original can be viewed at astrobites.org.

Title: An Untargeted Search for Radio-Emitting Tidal Disruption Events in the VAST Pilot Survey
Authors: Hannah Dykaar et al.
First Author’s Institution: University of Toronto
Status:
Published in ApJ

The supermassive black holes in the centers of most galaxies are notoriously, and predictably, violent actors in the universe. While some, classified as active galactic nuclei, act like a drain on their host galaxies, swallowing anything and everything that falls into them, even dormant black holes will react destructively when provoked. Orbit too closely, and any galactic nucleus will break you apart like a first-year chemistry student bumping an unsuspecting beaker off the lab bench.

If an ill-fated star falls into a black hole, the system will briefly glow across the electromagnetic spectrum. When and where these mishaps, known as tidal disruption events (TDEs, shown in Figure 1), occur, as well as the exact physical processes causing the brief glow, are not well understood. TDEs have been detected overwhelmingly in galaxies that do not have active galactic nuclei and are calming down after an era of intense star formation, and current models of the TDE occurrence rate disagree with observations. We expect to see more types of galaxies, such as those with active galactic nuclei, that host TDEs at similar rates, but we don’t — however, we might just be looking in the wrong places, or rather, with the wrong set of eyes.

Traditionally, TDEs have been identified by their optical, ultraviolet, or X-ray emission, but active galactic nuclei are surrounded by dust, which absorbs light at these wavelengths on its way to us. However, at radio wavelengths, the issue of dust obscuration fades, allowing us to uncover the TDEs that may be hiding. While radio emission has been observed from known TDEs, identifying TDEs in the radio comes with a major hurdle, presented by the pesky active galactic nuclei themselves; they are famously variable in radio emission, and they can serve as pretty convincing TDE imposters.

Searching for TDEs at Radio Wavelengths

Today’s authors decide to take on this challenge, armed with data from the Variable and Slow Transients (VAST) pilot survey, which observes large swaths of the sky at regular intervals to track variability on the order of days to months. VAST is optimized for observing TDEs, but unfortunately, it is also excellent at finding active galactic nuclei. How do we know what to look for, and how can we distinguish a TDE from an active galactic nucleus? Easy, we can just identify characteristics common to all the known radio-emitting TDEs in the VAST field of view — all one of them, that is. Surely, that won’t do. Instead, our authors simulate the evolution of TDEs as seen by VAST, which can only catch discrete snapshots of light at a specific radio wavelength. Their models of TDE radio emission assume one of three cases: either the TDE produces a relativistic jet directed at us (on-axis), directed away from us (off-axis), or none at all. The presence or absence of a jet, and its direction, determine the shape of the light curve, as shown in Figure 2.

Light curves of simulated TDEs

Figure 2: This figure shows the change in radio brightness over time we expect to see from a galaxy during a TDE given different models. The shape of the radio flare depends strongly on whether the TDE results in a relativistic jet, and if so, whether the jet points toward us (on-axis) or not (off-axis). These simulated light curves were used to establish criteria for TDE candidacy, and compared with observations from the final sample to constrain the incidence rate of TDEs and likelihood of different jet geometries. [Dykaar et al. 2024]

From these simulations, the authors identify three overarching characteristics that wannabe TDEs must exhibit: first, they must be variable, signaling the flare of activity as the star crashes into the black hole; second, the flare should be sufficiently bright compared to the galaxy’s normal brightness; and third, the flare must last for more than one observation, to ensure it is not a spurious detection. Additionally, the authors find that the peak brightness of the TDE must be double the typical galaxy brightness to effectively rule out active galactic nucleus imposters, which do not tend to vary this drastically, as shown in Figure 3. Lastly, the TDE must actually occur near the center of a galaxy (the black hole locale), as confirmed by optical or infrared survey catalogs. In the VAST pilot survey, 12 sources meet these criteria.
Three types of light curves, two of which are considered TDE candidates.

Figure 3: To distinguish TDEs from active galactic nucleus imposters, the authors kept only sources that exhibited one dominant peak in their radio flux, shown by the blue windows. Sources with secondary peaks (shown by the purple windows) that were much smaller than the primary peak were allowed, as the secondary peak could reasonably be due to ambient active galactic nucleus activity. However, multiple comparable peaks are indicative of only intrinsic active galactic nucleus fluctuations, not a TDE. [Dykaar et al. 2024]

Following Up on TDE Candidates at Other Wavelengths

The authors next subject these TDE candidates to thorough multi-wavelength scrutiny using archival survey data. First, they investigated whether the candidates are associated with gamma-ray bursts, which are extremely luminous and energetic events that may accompany TDEs. Unfortunately, gamma rays are easily absorbed, making them notoriously difficult to trace back to their sources. (After all, the journey of a gamma ray through light-years of dust and gas to Earth is not unlike Odysseus’s return to Ithaca, and we all know how many made that journey unscathed.)

The authors found that all 12 sources were coincident with a gamma-ray burst, but all 12 sources were also coincident with multiple gamma-ray bursts (which is unlikely to be physical), as were randomized, TDE-free regions of the VAST sky. In other words, the gamma-ray burst association is inconclusive. Contemporary optical and infrared observations of the candidates revealed no corresponding flares, which leads to more questions. Are the sources simply too far away for their optical and infrared flares to be discernible, or could dust absorption be at play? Additionally, nearly all candidates maintained an increased radio flux after the TDE flare. This may indicate that the TDE occurred within an active galactic nucleus as it was transitioning to a higher radio flux state, that the TDE was followed by intense star formation, or both.

By comparing their candidates to the expected observational manifestations of their TDE models, the authors conclude that the candidate sources are consistent with TDEs that have relativistic jets. They also independently constrain the TDE incidence rate, which agrees with current theory. As our window into the variable radio universe expands with future observations, such as with the ongoing VAST survey, we will have a growing population of such radio-detected TDEs to study, and the ability to distinguish them from regular active galactic nuclei will be ever more valuable in our quest to understand them.

About the author, Chloe Klare:

I’m a PhD student in Astronomy and Astrophysics at Penn State, with a physics doctoral minor. In my research, I’m looking for newly evolving synchrotron jets in active galactic nuclei (in the radio!).

The post Did That Supermassive Black Hole Rip Apart a Star, or Is It Eating Lunch Like Normal? appeared first on AAS Nova.

Black Hole vs. Magnetized Neutron Star: Matchup Predictions

12 May 2025 at 17:00

Artistic representation of the merger of a neutron star and a black hole

When a black hole consumes a neutron star, it’s typically thought to do so without an electromagnetic belch. New research explores the conditions under which a black hole’s neutron-star feast produces an observable electromagnetic signal.

Signaling a Collision

In the past few years, gravitational-wave detectors across the globe have detected a handful of neutron star–black hole mergers. What sorts of electromagnetic signals might accompany these outbursts of gravitational waves is a matter of intense interest.

In rare cases, if the black hole and neutron star are relatively close in mass, their gravitational tussle will rip the neutron star apart. As the shredded stellar material collects in a searingly hot disk around the black hole, it is expected to power a bright transient like a kilonova or a gamma-ray burst.

More commonly, the black hole is much more massive than the neutron star. In this case, the black hole should swallow the neutron star whole and without an electromagnetic trace — unless, as recent research shows, a strong magnetic field surrounds the neutron star.

Detailed Simulations

simulated merger of a neutron star and a black hole

The simulated merger of a neutron star and a black hole, in which the neutron star is swallowed whole. Click to enlarge. [Kim et al. 2025]

Yoonsoo Kim (California Institute of Technology) and collaborators used general relativistic magnetohydrodynamic simulations to explore the electromagnetic signals that might accompany the collision of a black hole and a magnetized neutron star. The simulations follow an 8.0-solar-mass black hole as it merges with a 1.4-solar-mass neutron star with a magnetic field of roughly 1016 Gauss — more than 10 quadrillion times the strength of Earth’s magnetic field.

As the simulated neutron star plunges toward the black hole, the neutron star’s magnetosphere — the region of space in which particles bend to the will of the neutron star’s magnetic field — begins to ripple with waves. The waves expand outward at nearly the speed of light, launching an exceptionally massive shock. This monster shock drives the creation of an electromagnetic transient: a flash of radio waves called a fast radio burst.

plot showing the striped, pulsar-like wind structure

The “striped” pulsar-like wind, shown at 7 milliseconds post-merger. The color scale shows the toroidal magnetic field component. [Adapted from Kim et al. 2025]

Striped Winds and a Fleeting Pulsar Phase

A second type of transient arises after the neutron star merges with the black hole. After the neutron star vanishes within the black hole’s waiting maw, its leftover magnetic field rearranges and begins to rotate, dragged along by the spinning black hole. Briefly, the black hole enters a pulsar-like state, surrounded by a “striped” wind created by spiraling magnetic field lines in alternating directions. As this magnetic field dissipates, a “fireball” of magnetized electron–positron plasma is ejected. When these electron–positron pairs annihilate, they briefly release another electromagnetic signal: a burst of X-rays and gamma rays.

Kim and coauthors noted that their simulated neutron star–black hole pair is similar in mass to the colliding pairs spotted by gravitational-wave detectors. This suggests that detectable gravitational-wave events may be accompanied by brief bursts at radio, X-ray, and gamma-ray wavelengths, providing another avenue to learn about these cosmic collisions.

Citation

“Black Hole Pulsars and Monster Shocks as Outcomes of Black Hole–Neutron Star Mergers,” Yoonsoo Kim et al 2025 ApJL 982 L54. doi:10.3847/2041-8213/adbff9

The post Black Hole vs. Magnetized Neutron Star: Matchup Predictions appeared first on AAS Nova.
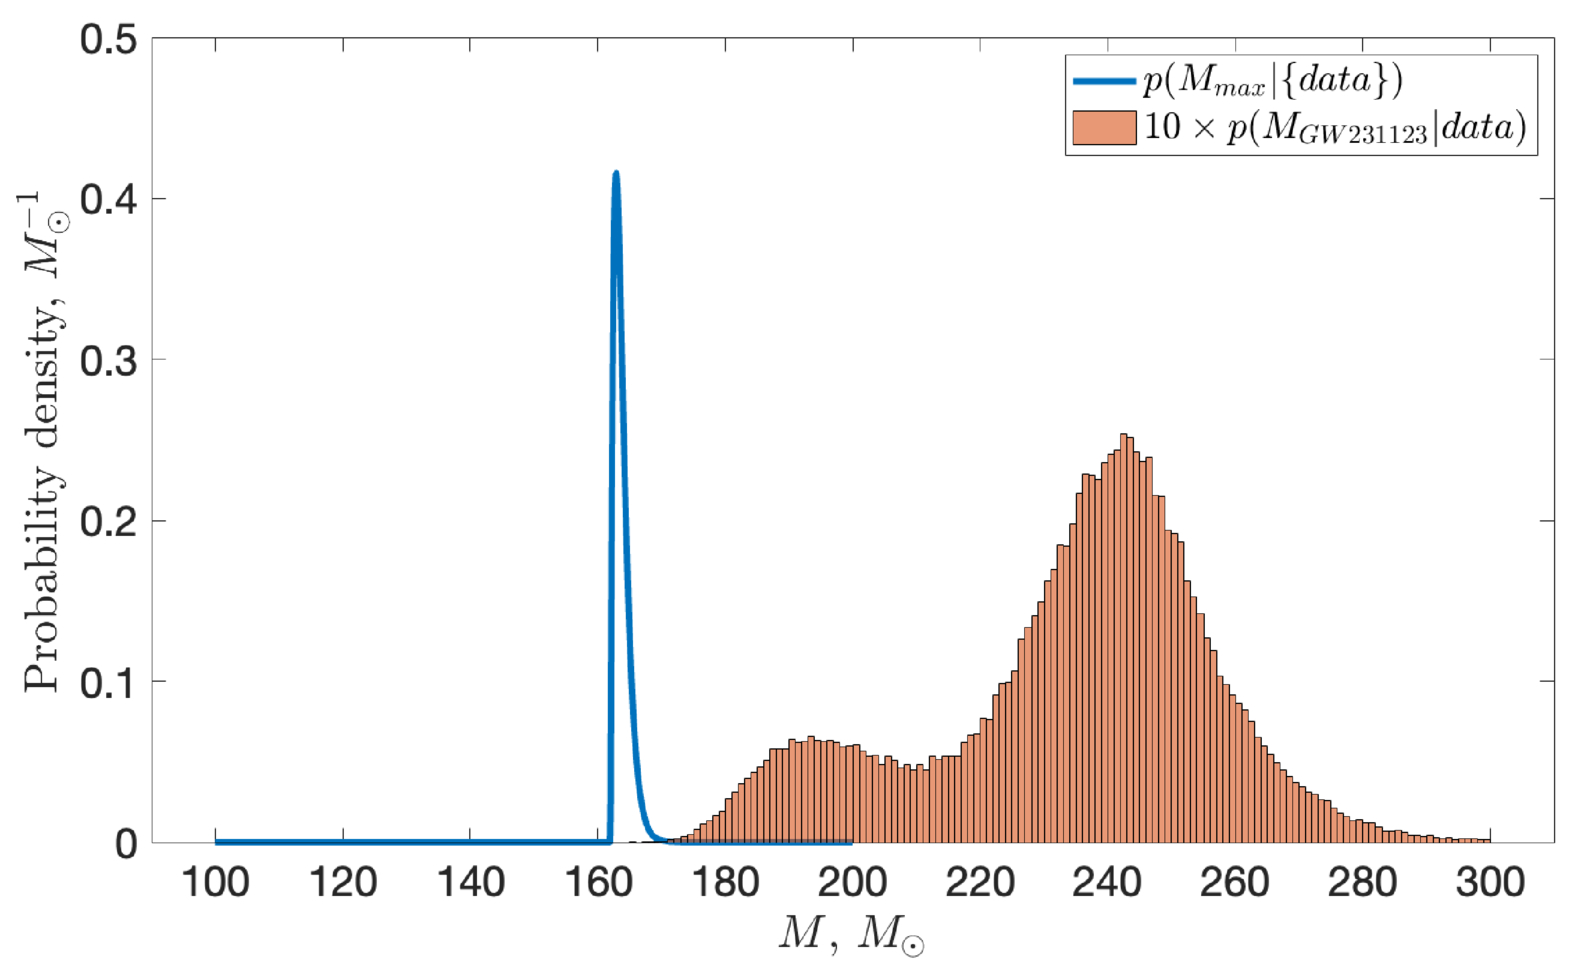
❌