The Moon’s polar regions may be less hostile to microbes than previously thought. This is the new finding from researchers at NASA and the University of Maryland in the US who say that future crewed missions to the lunar south pole will have to be carefully thought out to limit the unintended transfer of Earth life forms.
High ultraviolet radiation and temperatures make the Moon’s surface a harsh place and not somewhere bacteria and other micro-organisms can easily survive. This is particularly true for the equatorial regions, where all previous crewed missions have been sent. Things might be quite different at the lunar poles, however, since sunlight strikes these high-latitude regions at a low angle because of the Moon’s minimal tilt to the Sun of 1.5°. The result is long permanent shadows where it is cooler. The moonscape is also as rugged here as elsewhere with mountains and hills, which also cast shadows, and deep craters protected from the Sun’s heat and ultraviolet flux. These conditions allow for water ice too.
Because of these unique properties, future crewed missions, such as NASA’s Artemis IV, are scheduled to go to the Moon’s south pole, which has also been identified as a possible future location for a human outpost. The polar regions have already been observed by spacecraft such as ESA’s SMART-1, India’s Chandrayaan, Japan’s Kaguya and NASA’s Lunar Reconnaissance Orbiter. These provided a wealth of information that will be used to prepare future missions.
The problem is that no matter how stringent the sterilization procedures are prior to take-off, the astronauts on these missions will take microbes from Earth with them. Indeed, humans carry millions of microbes on their skin and even more in their bodies.
Landing sites for Artemis IV
To investigate whether microbes could survive in the polar regions, the researchers, led by Prabal Saxena, who works at NASA’s Goddard Space Flight Center, and Stefano Bertone at the University of Maryland, modelled how bacteria and fungi commonly found on human skin would behave in the environment of three candidate landing sites for the upcoming Artemis IV mission. The researchers began by making highly resolved spatial maps of the topography in these regions that included ruggedness, slopes and shadowing effects. They also modelled the UV exposure and temperature in these regions to identify specific locations where micro-organisms could survive for at least 24 h.
“Since the temperatures at the lunar poles are rarely high enough to kill bacteria and low temperatures can preserve microbes on Earth, UV radiation is generally likely to be more dangerous in these regions, says Saxena. “We therefore analysed UV fluxes at finer spatial scales using a technique called ray tracing, and for some regions, included optical effects such as reflection and refraction as sunlight hits the Moon’s surface, leveraging updated LOLA-based topography maps on a scale of 5 m/pixel.”
Understanding how sunlight behaves at the poles is crucial, he adds. “Since the Moon has a very small axial tilt, the Sun appears to hover just above the horizon here, so even small hills and rocks can prevent light from reaching lower-lying ground, creating small, shadowed areas protected from UV rays.”
Up to seven days survival
The simulations revealed that the bacteria and fungi studied could survive in certain niches for up to or potentially beyond seven days. One particular fungus, the Aspergillus, is particularly resistant to UV radiation and could potentially survive in 15 to 30% of the areas assessed, even those that receive some sunlight during the lunar winter. The reconstructions also showed that all five microbes in this study, Bacillus, Deinococcus, Staphylococcus, Aspergillus and Fusarium could possibly survive in certain areas of the De Gerlache Rim’s permanently shaded regions, including when scattered UV light is incorporated into the simulations.
Survival does not mean growth (which requires active metabolism and potential reproduction), however, stresses Saxena. Indeed, surviving microbes are in a dormant, so-called cryptobiotic state and would only grow if the conditions were amenable to life – which is not the case for the Moon as we currently understand it.
The work could apply beyond the Moon, he says. Indeed, a number of different airless bodies such as Mercury, Ceres, some asteroids and comets and exoplanets that may have similar properties could also have potential survivable niches for microbial life. Understanding how these niches may exist, how life may be transferred to them and how human exploration may leave its mark will all serve as a key testbed for future potential human exploration of Mars, which likely has far more habitable environments.
“We need to understand what was there before us, because when we search for signs of life beyond our planet on these bodies, we will want to make sure it’s not stuff we brought,” says Saxena.
A planned flagship spacecraft to Uranus was aiming to use Jupiter for a gravitational boost to shorten its journey to the outer solar system. Now that the mission’s launch date has been pushed back, it’ll need to find another way to its target.
Redesigning the Route
Uranus and Neptune, the ice giants of our solar system, have been comparatively neglected by humanity’s fleet of interplanetary probes. While all of the other major bodies have been visited by at least an orbiter or even a lander, the most detailed exploration we’ve done of these two planets happened when the Voyager 2 spacecraft went screaming past on its way toward interstellar space.
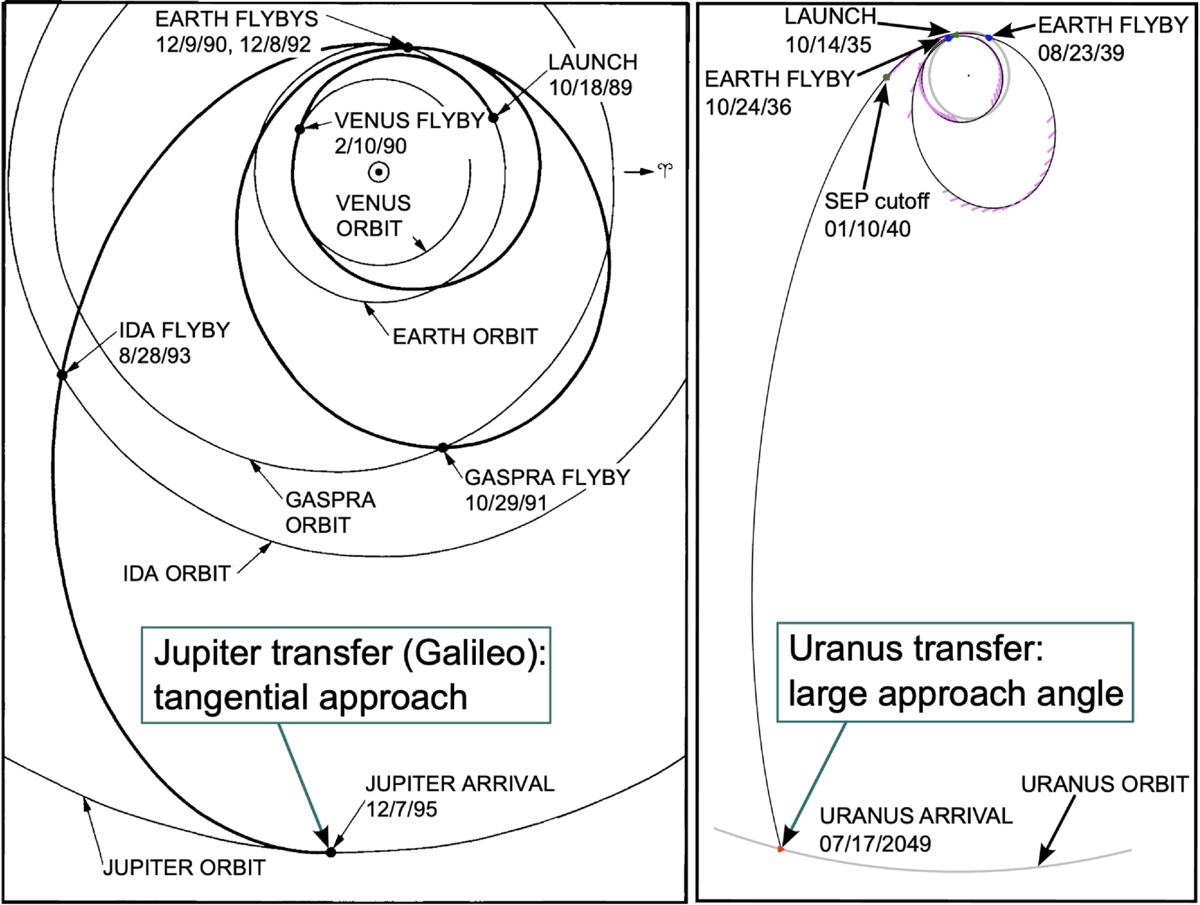
Schematics of different trajectories within the solar system. Left: The path the Galileo spacecraft took to Jupiter. This path arrived nearly parallel to the planet’s motion. Right: One of the proposed paths to Uranus. This path will intersect the planet’s orbit at a much steeper angle to shorten the flight time. Click to enlarge. [Simon et al. 2026]
So it was no surprise when a panel of scientists and engineers charged with setting scientific exploration priorities between 2023 and 2032 recommended finally sending a spacecraft to Uranus, depositing it into orbit around the planet, and keeping it there for a while to collect data. The study itself suggested a basic design for the mission: a pair of spacecraft, one orbiter and one sacrificial atmospheric probe, collectively weighing about 4,000 kg.
Getting these spacecraft to their destination will be a challenge The thriftiest path to get to Uranus, a trajectory called a Hohmann transfer that’s been used for other missions aimed elsewhere in the solar system, would take 16–17 years. Rather than accept the long wait, the original authors suggested that the mission instead fly toward Jupiter, using the giant planet’s massive gravitational tug to slingshot the spacecraft toward Uranus.
However, this plan relied on Jupiter being in just the right place when the spacecraft approached. This in turn relied on the mission launching sometime in 2031 or 2032: any earlier or later, the slingshot would be aimed in the wrong direction. Now that timelines and budgets have slipped for this flagship mission, hitting this launch window seems unlikely. And, without the boost from Jupiter, the mission will have to cross 20 au of open interplanetary space on its own.
Solar Electric Propulsion to the Rescue
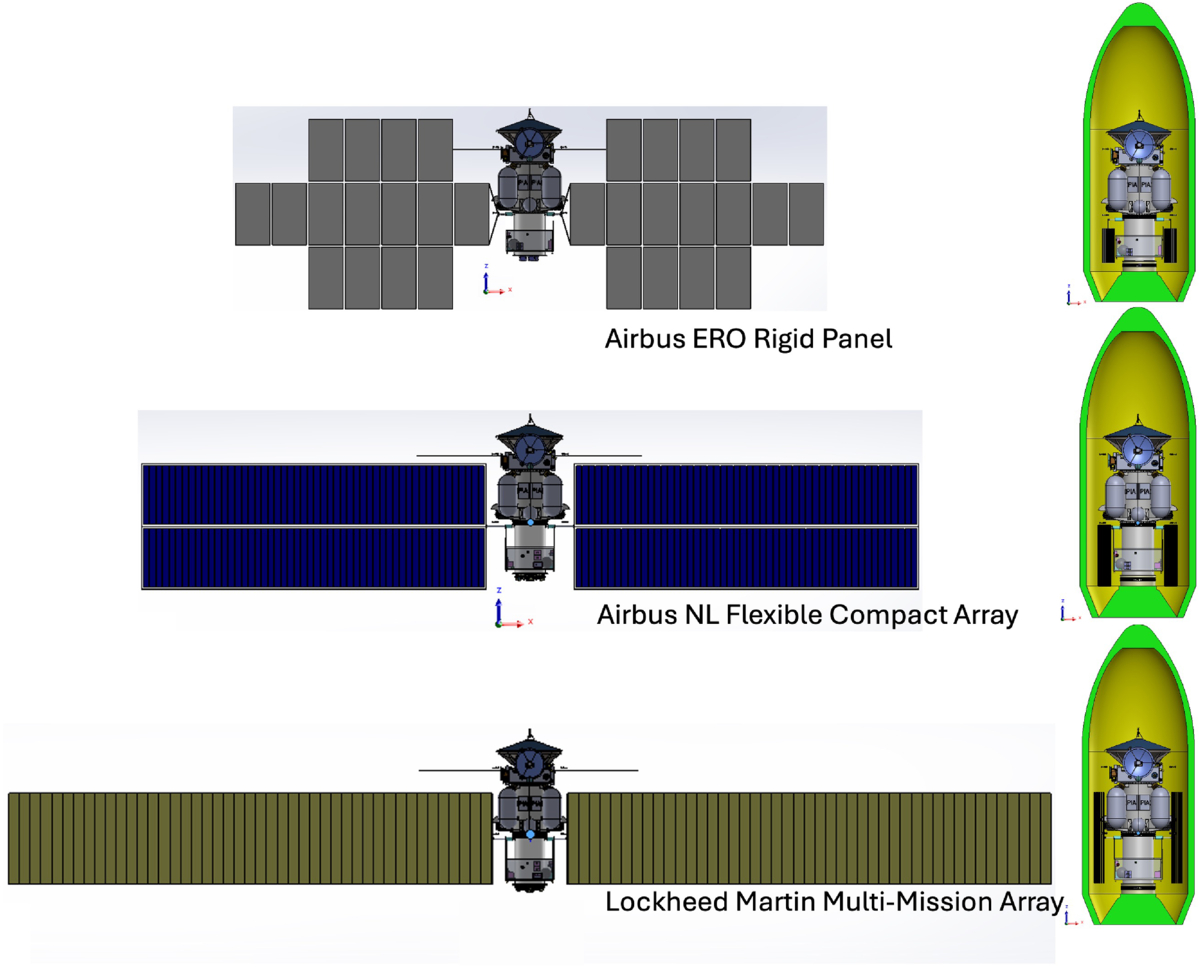
Several proof-of-concept designs for the mission’s SEP components. How these designs would be packaged into a rocket fairing for launch is shown at right. Click to enlarge. [Simon et al. 2026]
Recently, a team led by Amy Simon, NASA Goddard Space Flight Center, took on this challenge and tried to chart a new path through the solar system. The team realized that solar electric propulsion (SEP), a technique that relies on using solar panels to create electricity and accelerate ions to create thrust, might offer a path forward. By using SEP, the mission could leave Earth, unfurl wings of solar panels, then gradually accelerate for as long as there was enough sunlight to power the engine.
The power levels would likely get too low just a few astronomical units into their journey, but that would be enough: after discarding the SEP stage, the mission could coast to Uranus on a journey that would take only 13 years. Even better, this technology has a proven flight history and would require little maturation or development. The BepiColombo mission to Mercury is currently using SEP, and similar techniques are used on satellites in Earth orbit today.
Simon and collaborators also took on a number of other challenges that have cropped up since the mission was proposed, including fewer available plutonium power sources and a re-assessment of Uranus’s rings that revealed hazards in the original flight path. Their work brings the mission closer to the launch pad and illustrates how much iteration goes into the spacecraft that finally takes to the stars.
Citation
“Uranus Orbiter and Probe: Mission Challenges and Concept Updates Since the Origins, Worlds, and Life Decadal Survey,” Amy A. Simon et al 2026 Planet Sci. J.7 143. doi:10.3847/PSJ/ae680c
The UK’s Science and Technology Facilities Council (STFC) recently announced funding cuts to a range of physics and astronomy projects as it seeks to reduce costs. One of the most high-profile casualties is e-MERLIN, a network of seven radio telescopes spread across the UK, including the iconic Lovell Telescope at Jodrell Bank.
To discover what the cuts could mean for UK science and the livelihoods of those affected, podcast host Andrew Glester caught up with two astronomers at Jodrell Bank: Simon Garrington, e-MERLIN director, and David Williams-Baldwin, an e-MERLIN research support scientist.
They discuss why the cuts have caused such alarm among scientists, how the UK astronomy community is mobilizing in opposition, and why the consequences could extend far beyond Jodrell Bank.
e-MERLIN combines signals from its telescopes to produce sharp radio images of the Universe – with a resolution comparable to that of the Hubble Space Telescope. As things stand, funding for the telescope array will run out in March 2028, putting the future of the network and scientific operations at Jodrell Bank in doubt.
It’s an uncertain time for an observatory that was granted UNESCO World Heritage status in July 2019 for its historical contributions and its technical and scientific ingenuity since the 1940s.
An STFC spokesperson emphasises that Jodrell Bank is “not closing” and “will continue to play an important role in UK science”. This includes the Square Kilometre Array Observatory that has its headquarters at Jodrell Bank as well as other radio astronomy research projects in the UK and elsewhere.
“We recognise the strength of feeling about Jodrell Bank and the e-MERLIN network, and the contribution they have made to UK science. The achievements of the scientists, engineers and staff who have supported e-MERLIN over many years are widely respected across the research community,” they add. “We are focusing on the next generation of radio astronomy to ensure UK researchers continue to be at the forefront of the field. Rising cost pressures mean that we have had to make difficult choices about STFC funding to make sure we are able to fund world class research sustainably into the future.”
A radiation shielding vest tested during the uncrewed Artemis I flight in 2022 has been shown to significantly reduce the radiation dose that future astronauts or deep-space tourists might receive.
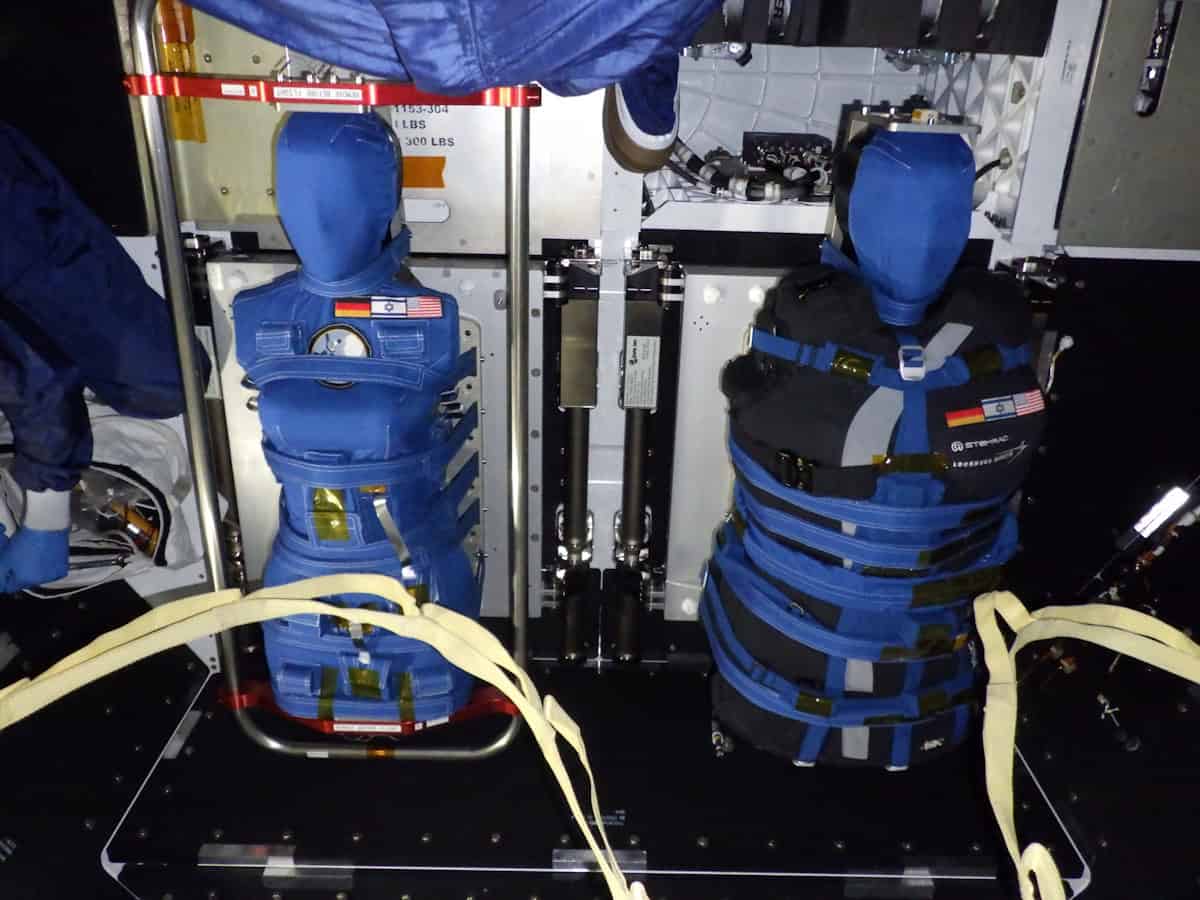
The data for this analysis were obtained via seating two human-tissue-equivalent female torso phantoms in the Orion crew capsule. While the “Zohar” phantom wore the new AstroRad vest, its travel companion “Helga” did not. Numerous radiation dosimeters placed in and on the phantoms allowed the received radiation dose to be compared.
“Exposure to radiation in space is unavoidable, and a single major solar particle event (SPE) can deliver more than one-third of NASA’s 600 millisievert career effective-dose limit. A three-year round trip to Mars would equal or exceed the career limit, which corresponds to a 3% mortality risk from radiation-induced cancer. So we developed the AstroRad vest to significantly reduce this hazard,” explains immunologist Oren Milstein, CEO of StemRad Radiation Protection, which began developing the vest with Lockheed Martin in 2015.
Dosimetry phantoms The Helga and Zohar (wearing the AstroRad vest) phantoms inside the Orion spacecraft at the NASA Vehicle Assembly Building prior to the launch of Artemis I. (Courtesy: NASA/Lockheed Martin/DLR)
The shielding thickness varies throughout the garment according to the radiation sensitivity of the underlying organs, with breasts, colon, lungs, ovaries, stomach and red bone marrow having concentrated shielding in the test vest. Milstein was inspired to develop this targeted architecture based on the experiences of his PhD supervisor, who treated the first responders to the 1986 Chernobyl nuclear power plant disaster.
With damage to bone marrow the accepted cause of death for all those emergency workers who lost their lives within months of the accident, “that heritage instilled in me a desire to protect people from radiation by selective shielding of the bone marrow,” Milstein explains, adding that the female focus of this experiment is because women have a higher predicted risk of radiation-induced cancer than men.
Astronauts currently shield from SPEs in “storm shelters” consisting of barricades of supplies, or by moving into areas containing more hardware against the walls. AstroRad provides a similar level of protection to the most robust shelter configuration while also “allowing the astronaut wearing it to move around the cabin and continue mission-critical tasks,” radiation physicist Jordan Houri, lead scientist for space exploration at StemRad, tells Physics World.
To maintain flexibility, the vest is constructed from thousands of hexagonal tessellated rods of high-density polyethylene (HDPE) sandwiched between two layers of elastic fabric. The shielding components can also slide past one another and stretch. HDPE was chosen for its high proportion of hydrogen – which is extremely effective at shielding against charged particle space radiation.
While Artemis I did not encounter a solar storm, Orion traversed the inner Van Allen belt, whose protons cover a similar energy range to those in SPEs. This enabled the team to construct a Monte Carlo model of the experiment for testing different radiation environments.
“We created digital twins of Helga and Zohar, the AstroRad vest, radiation detectors and spacecraft shielding,” explains Houri. “Using this model, we generated hundreds of billions of virtual protons and electrons representing the radiation environment of the inner Van Allen belt, before comparing the predicted detector responses directly with the measurements recorded during Artemis I.”
With close agreement found, the researchers then simulated measured SPEs from August 1972 and October 1989. As detailed in their recent Science Advancespaper, this revealed that wearing AstroRad would reduce effective dose by around 60% in an August 1972-type scenario, and by almost 40% for a 1989-type SPE – sparing astronauts the dose equivalent from up to 193 and 131 days of deep space travel, respectively.
Combining these results with those from previous experiments, which tested the vests’ ergonomics on the International Space Station, is allowing the researchers to improve comfort and ease of motion, and reduce mass. They are also exploring whether lighter, empty vests could be filled with recycled polyethylene after launch.
Alongside the health benefits, reducing radiation exposure makes economic sense as it extends astronauts’ careers, concludes Milstein, who hopes that the AstroRad vests can help “make lunar habitation and Mars travel truly sustainable and not just a dream”.
NASA’s Transiting Exoplanet Survey Satellite (TESS) mission has notched up its first discovery of an exoplanet via a method known as microlensing. The planet is a “super Jupiter” known as Gaia23bra b, and TESS observed it when the planet and its host star acted as a gravitational lens, magnifying the light from a second, more distant background star.
Astronomers have several ways of finding planets beyond our solar system. The most successful of these by far – and the one that TESS was designed for – is the transit method, which is responsible for roughly 75% of all exoplanet detections to date. This approach relies on observing the periodic dimming of a star’s light as a planet passes between the star and an observer here on Earth.
The transit method does have limitations, however. The main limitation is that we can see transits for only a small number of planets, namely those with orbital planes that are almost exactly edge-on to Earth. An alternative approach known as photometric microlensing is somewhat more flexible in this respect, as it relies on the star-planet system magnifying the light from a background star, which is known as the source. This magnification occurs because the gravitational pull of the planet-star system warps space, bending and magnifying the source’s light (as Albert Einstein predicted as part of his general theory of relativity) like a lens and producing characteristic spikes in its brightness.
A second bite at the exoplanetary cherry
Astronomers initially identified a planet in the Gaia23bra system using observations made in 2023 by the European Space Agency’s now-retired Gaia space telescope. However, while Gaia picked up the unexpected brightening of a background star, it did not identify this event as coming from a binary-star system, and it could not pick out the planet itself because its observations were too sparse, explains Mallory Harris, an astronomer at the University of New Mexico, US who led the TESS study.
In the new work, Harris and colleagues scoured TESS data from the same period. Because TESS’ observations were much denser – it observed the region every 200 seconds for nearly 60 days – they were able to identify extra features in the brightness of the light curve that indicated the presence of a planet in the system. Subsequent analyses revealed that this planet is about 1.63 times the size of Jupiter, and it orbits its host – an orange dwarf star 20% smaller than our Sun – at a distance similar to that of Jupiter from our Sun.
Complementary techniques
The transit technique is particularly sensitive to planets that orbit close to their star because these planets are the most likely to transit and block out most of their host stars’ light as they pass in front of them. In contrast, Harris explains that microlensing is most sensitive to planets orbiting at Earth-like distances or further from their stars, making it better for studying planetary systems more like our own solar system. “With microlensing, we can find smaller planets with greater orbital distances, including worlds in the habitable zone of their star and even farther away,” she says.
The transit technique and microlensing are therefore complementary because each reveals a category of planet that the other may not be able to detect, adds team member Diana Dragomir. The only problem, Harris notes, is that microlensing observations are limited-time opportunities. “Microlensing events happen once and they’re gone – they don’t repeat,” Harris says. “I like to joke that we’ll probably find the first Earth analogue with microlensing and then wave at it as it goes by because we’ll never see it again.”
That said, Harris says that Gaia23bra will be an important observing target for the Nancy Grace Roman Space Telescope. “Microlensing is currently the only method capable of detecting Earth‑mass planets at Earth‑like orbital distances,” she explains. “We already knew that this technique could find planets, because it has done so in the past using ground-based observatories.
“What we demonstrated in this work is that high-cadence observations (even with low spatial precision) and high-precision long-baseline observations can work together to find a microlensing planet. And that it is possible to specifically do this by pairing TESS observations with those from another instrument.”
This synergy between long-time-scale surveys and high cadence observations could be therefore applied towards future searches for potentially habitable worlds, she tells Physics World. Although Gaia was retired last January, making it unlikely that astronomers will find many additional events via a Gaia–TESS combination, Harris adds that there could nevertheless be other microlensing planets in the past eight years of archived TESS observations. “I’m excited to see whether there are other events like this already hiding in the TESS data and whether future surveys can work together with TESS to find more microlensing planets in different parts of the galaxy,” she says.
A collaboration of researchers in North America has reported their findings from the first diagnostic X-ray imaging performed in space. X-ray images recorded during an orbital spaceflight exhibited similar overall quality to those taken preflight on Earth, demonstrating the feasibility of adding radiography as a diagnostic tool for crew health.
With humans venturing further into space and spending more time in this harsh environment, the risk of adverse medical events increases. Accurate and timely diagnosis and treatment is a must-have. Currently, the only reliable medical imaging modality available to astronauts in spaceflight is ultrasonography – which is operator dependent, requires substantial training and relies on limited acoustic windows.
X-ray imaging, on the other hand, benefits from low operator dependence, rapid acquisition and typically higher spatial resolution than ultrasound. Digital radiography could also offer superior diagnostic capabilities for many medical conditions of concern during spaceflight, including dental disease, musculoskeletal trauma, inhalational injury, collapsed lung and arthritis.
Traditional X-ray scanning systems are bulky, produce a lot of radiation and are sensitive to motion – making them less than ideal for sending into space. But a new generation of portable X-ray scanners shows potential to survive the spaceflight and be operated by crew members with minimal training.
“It’s been a dream for aerospace medicine to have more than one imaging modality for diagnosing illnesses and injuries in space,” says lead researcher Sheyna Gifford, an assistant professor of aerospace medicine at the Mayo Clinic in Rochester, MN, in a press statement.
Scanning in space
In a study led by co-author David Lerner, the researchers first demonstrated the feasibility of X-ray imaging in simulated microgravity in 2022. During a parabolic flight, they used a commercial off-the-shelf digital radiography system to successfully capture radiographs of a human subject and a phantom during lunar gravity (1/6g), Martian gravity (1/3g) and microgravity.
In this latest project, reported in in Radiology, Gifford and her team investigated the performance of a similar portable digital radiography system aboard the Dragon spacecraft, during the Fram2 spaceflight mission, a 3.5-day polar orbital flight launched on 31 March 2025 on a SpaceX Falcon 9 rocket. The imaging system comprised a commercial off-the-shelf, FDA-cleared, portable, digital X-ray generator (Impact Wireless; MinXray) along with an FDA-cleared flat-panel detector.
Chest radiographs Representative X-ray images acquired preflight by a crewmember (A), in-flight on day 3 after launch by a crewmember (B, C) and postflight by a non-crew operator using the same imaging protocol (D). (Courtesy: RSNA)
Prior to the mission, three crew members received 4 hr of training on the portable X-ray system and acquired preflight X-ray images of the hand, forearm, abdomen, pelvis, chest and a quality control phantom. They then recorded the same anatomic and phantom images whilst in space, and also imaged a smartwatch to investigate the potential for non-destructive testing.
During anatomic imaging, the devices were handheld by the crew members, while the phantom and smartwatch were secured to the detector for imaging. The crew reported that they found it easy to use the X-ray system and follow the imaging protocols.
Back on Earth
To assess the quality of the seven X-ray images acquired by the crew, three independent radiologists evaluated and compared the preflight and in-flight anatomic radiographs, finding no differences in overall image quality, contrast resolution or spatial resolution. For central-body radiographs (chest, abdomen and pelvis), image positioning was worse in-flight than preflight. Despite this, all X-rays achieved good or near-excellent diagnostic quality (rated on a 5-point Likert scale).
Phantom radiographs recorded in space exhibited good spatial and contrast resolution, imaging low-contrast targets down to the smallest 2-mm target and easily visualizing high-contrast meshes ranging from 20 to 60 lines per inch, with 80 lines per inch remaining visible. The smartwatch radiograph clearly showed the watch’s internal components at the submillimetre scale.
The research team found that the X-ray generator had sustained minor re-entry damage, but its internal components and X-ray output were not affected. Similarly, the detector passed visual inspection and quality control tests. The researchers also recorded a set of postflight X-rays (on non-crewmembers) following the same in-flight protocols. These showed no qualitative differences from the preflight or in-flight radiographs.
“By acquiring the first human and equipment X-rays in space, our study demonstrates the feasibility of in-orbit radiography and expanded diagnostic capabilities for crew health and hardware evaluation,” says Gifford. “Acquiring diagnostically useful X-rays in space is something that anyone can do. Three very talented nonmedical people with four hours of training in one of the harshest environments did it right and did it well.”
Gifford points out that a spaceflight-ready radiography system could also prove indispensable for mission-critical non-medical tasks. “For sustained human presence in space, X-rays are critical not just for crew members but also for other mission components like electronics and spacesuits. The only way to look inside these objects without taking them apart is to X-ray them,” she explains.
A compact optical technology that has already proved its worth in Earth-bound applications could be on its way to space after researchers at the University of California San Diego, US showed that it can map the Sun’s magnetic field just as well as traditional instruments. By making polarization gratings from specially engineered metasurfaces rather than a complex assembly of optics, the researchers say that future solar-observing missions could benefit from reduced complexity and cost as well as size.
“Our work makes use of recent advancements in nanoscale optical technologies to help improve the hardware for making astronomical observations of the Sun,” says study leader Noah Rubin of UC San Diego’s Jacobs School of Engineering. “We believe this is one of the first times that metasurface optics – which have been a subject of intense interest in both academic research and industry for about a decade – have been used to improve scientific instrumentation of any kind outside of a lab/academic proof-of-concept.”
Polarized light and solar magnetic fields
Although light emitted by the Sun is generally unpolarized – that is, the light waves do not vibrate along a particular axis – strong magnetic fields that develop near sunspots can polarize this light via the quantum mechanical Zeeman effect. These magnetic fields are closely associated with space weather events such as solar storms that can damage electronic infrastructure both on Earth and in orbit. Studying the Sun’s magnetic activity by monitoring areas of polarized light is thus an important step towards detecting or predicting such storms in time to take protective action.
Usually, measuring the polarization state of light means analysing different polarization directions using a device such as a waveplate that mechanically rotates between exposures. Rubin compares this process to taking several photographs through polarized sunglasses held at different angles, then combining them to obtain a fuller picture of what’s going on.
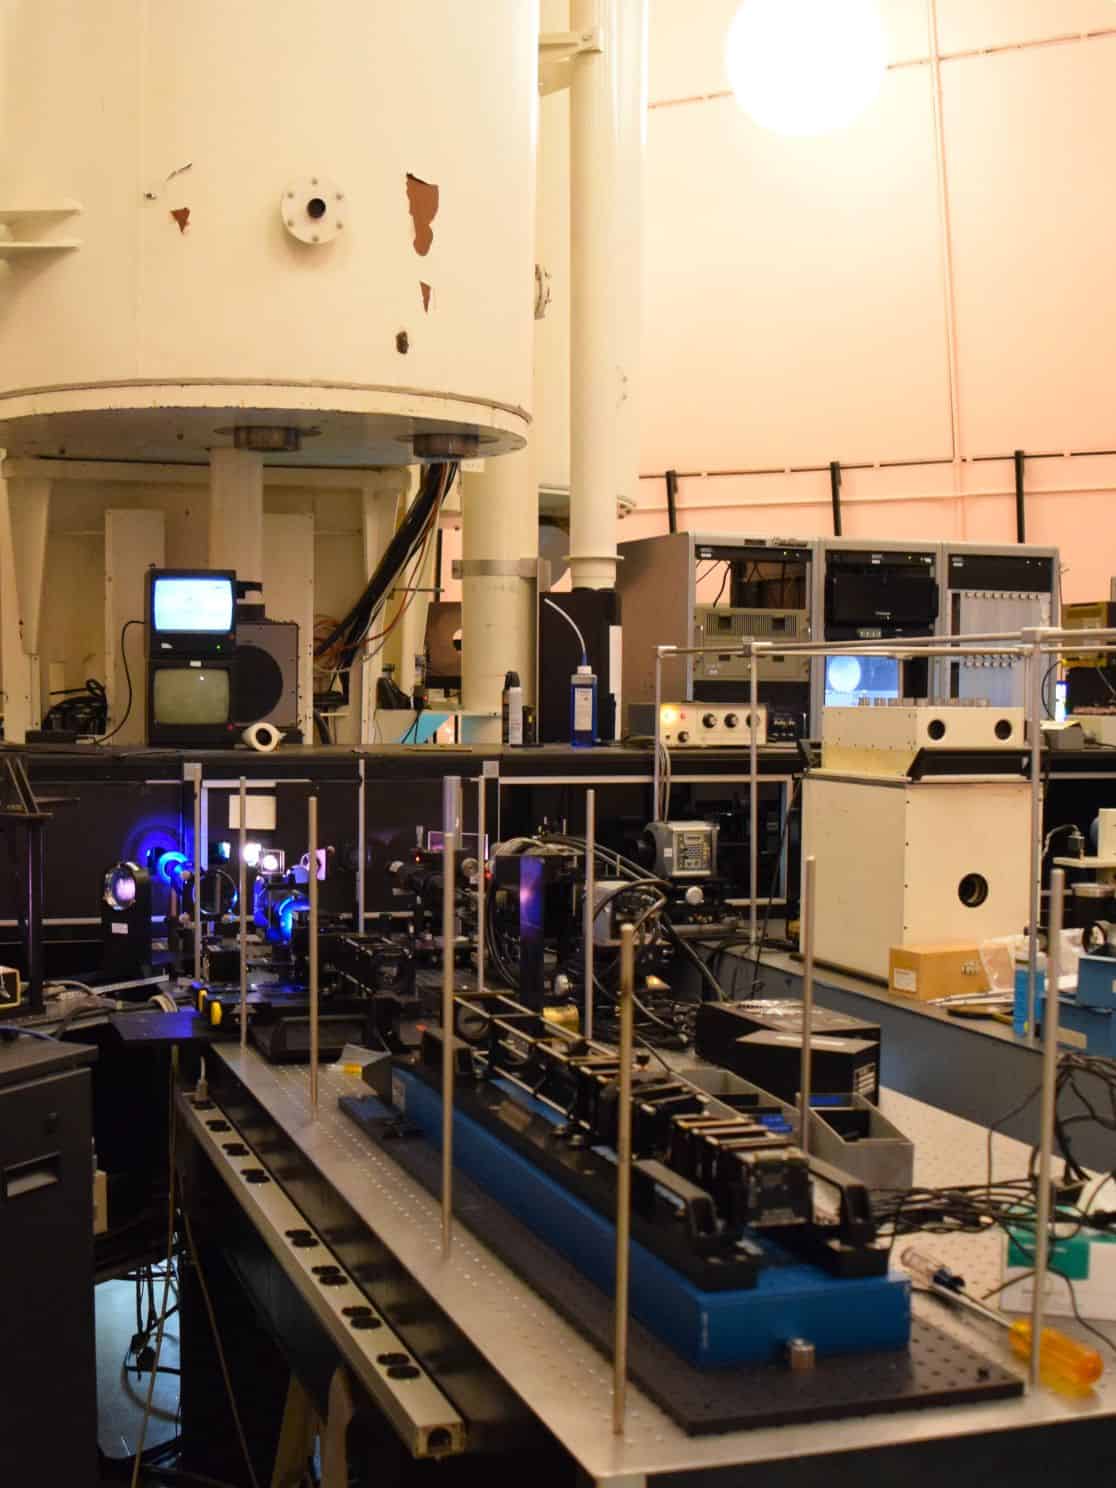
Test rig: Sunlight from the top of the Dunn Solar Telescope’s 136-foot-tall tower travels 228 feet underground and is reflected back up to this room at ground level, where it passes through an optical system (blue lights, background) before reaching the team’s custom-built telescope (foreground). (Courtesy: Noah Rubin)
While this technique works, and instruments that use it have already been sent into space, the image analysis process is very time-consuming. It also requires an external power source, and the need to mechanically rotate the waveplate introduces extra complexity and cost, says Rubin.
“In space-based applications, a satellite itself can be moving while this component reorients, causing a highly undesirable blurring effect,” he explains. “As a result, designers of these systems often invest considerable resources into mechanical remediation and engineering to correct the motion of the telescope on the satellite, and this frequently ends up being substantially more expensive than the telescope optics themselves.”
A metasurface solution
In the new study, which is detailed in Science Advances, Rubin and colleagues solved this problem by creating a polarization-sensitive metasurface that splits light into its different polarization components. A camera-like system containing this metasurface polarization grating can then form multiple images of a scene in parallel. Rubin explains that each image in this scene is analysed with respect to a different polarization state, meaning that the system can measure the polarization of light simultaneously and passively in a single camera frame.
Working with industrial partners at BAE Systems Space & Mission Systems in Colorado, US (formerly known as Ball Aerospace, which Rubin describes as “well-known for its involvement in the development of the James Webb Space Telescope, Hubble and countless other NASA missions”), the team designed a specialized telescope built around such a metasurface polarization grating. They also deployed their instrument on the Dunn Solar Telescope in New Mexico, US, and showed that they could quantitatively map the magnetic fields in sunspots by capturing simultaneous polarization images of these spots.
The researchers report that their results were comparable to those obtained by the state-of-the-art NASA Solar Dynamics Observatory mission in-orbit, highlighting what Rubin calls “the significant advantages that these metasurface components can offer when designed in conjunction with more traditional optical systems”. The UC San Diego team is now exploring ways of integrating its technology into future NASA solar-observing space missions.
A galaxy that formed around a billion years after the Big Bang is in its death throes thanks to a powerful galactic wind that is blasting its gas into space, say astronomers at Australia’s Swinburne University of Technology. The discovery, which is based on data from the James Webb Space Telescope (JWST) and the Atacama Large Millimeter/submillimeter Array (ALMA) in Chile, could help explain why some of the universe’s earliest massive galaxies ceased to form new stars.
One of the JWST’s most surprising discoveries is that when the universe was between one and two billion years old, it already contained large numbers of massive galaxies. Astronomers think these galaxies may have acquired most of their mass in intense bursts of star formation. But at some point, that process stopped: in technical terms, the galaxies became quiescent.
“These galaxies seemed to have formed all their stars very quickly and then they suddenly died, all within the first two billion years of the universe being formed,” says Rebecca Davies, who led the new research.
The CRISTAL-02 galaxy
One possible explanation for the onset of quiescence is that when galaxies collide with each other, the resulting winds “blow away” the hydrogen fuel required for new stars to form. To investigate this hypothesis, Davies and colleagues focused on a galaxy called CRISTAL-02, which was one of 20 galaxies in the recent ALMA-CRISTAL survey of early star-forming galaxies.
“When we looked at the data, it stood out because it was the only one that showed strong evidence for a galaxy wind,” Davies explains. “We saw this as an excellent opportunity to study how winds impacted the evolution of galaxies in the early universe.”
The light from CRISTAL-02 travelled for approximately 12.7 billion years to reach us, meaning that we see it as it was one billion years after the Big Bang. Because the universe has been expanding since then, the galaxy’s spectra appear highly red-shifted. This meant the Swinburne astronomers needed the JWST’s infrared-sensing capabilities to analyse a spectral feature known as the hydrogen-alpha (Hα) line that is normally red. They also used ALMA to analyse CRISTAL-02’s C II line, which comes from ionized carbon and has a (non-redshifted) wavelength of 158 mm. Both emission lines can yield important information about the properties of early galaxies.
Living fast and dying young
From the ALMA-CRISTAL survey’s measurements of Hα luminosity, astronomers knew that CRISTAL-02 forms stars at a rate of around 260 M☉ per year. This is about three times the average value for “main-sequence” star-forming galaxies at similar mass and redshifts.
The latest observations, however, suggest that it won’t maintain this pace for long. Davies and colleagues identified a huge plume of C II emissions that extends as far as 7 kiloparsecs (kpc) to the north-east of CRISTAL-02, making it almost as long as the galaxy itself. This is a telltale sign that gas is being driven out of the galaxy. The fact that the gas in this plume is blue-shifted by 100 km s-1 lends further support to this explanation.
If this rapid blowout continues, Davies says that CRISTAL-02 will cease to exist in less than 50 million years. But the team’s findings may have implications beyond the fate of this single galaxy. “Our results could help to explain how some of the earliest massive quiescent galaxies in the universe behave,” she tells Physics World. “When the JWST started observing distant galaxies in 2022, it found far more evolved galaxies in the early universe than models predicted. These galaxies seemed to have formed all their stars very quickly and then suddenly died, all within the first two billion years of the universe. The galaxy we discovered seems to be following this path.”
Learning about the early universe
Davies explains that because the early universe was much more compact than it is now, collisions between galaxies were common. During such collisions, gas funnels towards the galactic centres, triggering strong bursts of star formation but also producing strong winds that eventually drive the gas away. “If many early galaxies collide and experience rapid growth, then it may not be surprising at all that we see so many dead galaxies in the early universe,” she says.
The researchers stress that the present work, which is detailed in the Monthly Notices of the Royal Astronomical Society, is based on a case study of just one galaxy. They now need to observe other early, massive galaxies caught during periods of intense growth to determine whether they, too, experience powerful winds that could rapidly expel their gas and stop them from forming stars.
Black carbon particles released by rocket launches remain in the upper atmosphere for much longer than sooty particles produced by sources on the ground. This finding, which comes from a study led by researchers at University College London (UCL), UK, suggests that the soot created in deploying “megaconstellations” containing hundreds or thousands of satellites could have poorly understood and potentially serious consequences for the Earth’s climate.
“Rocket launches are a unique source of pollution, injecting harmful chemicals directly into the upper layers of the atmosphere and contaminating Earth’s last remaining relatively pristine environment,” says the study’s lead author, UCL atmospheric chemist Connor Barker.
The number of rockets being launched into space has increased dramatically since 2019, and the trend shows few signs of stopping. This year has already seen more launches than the whole of 2020, and space industry experts believe the eventual total could surpass 2025’s figure of 329. The increase has primarily been driven by the Falcon 9 rockets launched by the US firm SpaceX, though China also logged a record 92 launch attempts in 2025.
“An unregulated geoengineering experiment”
In the new work, Barker and colleagues analysed data from rocket launches and satellite re-entries from 2020 to 2022. Their results, which they detail in Earth’s Future, show that the soot particles lingering in the upper atmosphere are 540 times more effective at altering climate than ground-based soot emissions from sources such as cars and power plants.
“Space industry pollution is like an unregulated geoengineering experiment,” says Barker. Soot particles from burning kerosene in rocket fuel absorb sunlight, he explains, which prevents it from reaching the Earth’s surface. The result is a small cooling effect, which might sound like a good thing in the context of rising global temperatures. However, Barker stresses that this cooling is minimal compared to the global warming caused by other human-generated emissions, while the particles themselves could have “many other serious unintended consequences”.
Predictions likely to underestimate future impact
As well as quantifying recent space industry emissions, the researchers make predictions about future ones. According to their calculations, by 2029 the space industry will be releasing about 870 tonnes of soot into the atmosphere each year. By way of comparison, Baker notes that according to the latest UK government figures, the annual emissions of the country’s entire passenger car fleet amounted to just 728 tonnes.
The team based its predictions on projections of data from 2020-2022, which is considered the beginning of the megaconstellation satellite era. Because of this, Barker cautions that they are likely to be underestimates, making the problem even more urgent. “It is critical that we understand the environmental impacts of satellite megaconstellations now while their impact is small, before any unforeseen consequences are difficult to reverse or repair,” he tells Physics World.
While scientists have made great progress in the last few years, Baker says that are still large uncertainties in our emission estimates for the industry and our understanding of how they affect the atmosphere. “We hope that this work spurs further research to measure space industry emissions and highlights the need to regulate the geoengineering impacts of the space industry,” he says.
Team leader Eloise Marais, a professor of atmospheric chemistry and air quality at UCL, echoes this sentiment. “So far, there has been limited effort to effectively regulate this type of pollution,” she says.
The researchers are now working on an emissions tracker to visualize these emissions across the entire space age. “We are also using satellite imagery to remotely detect and quantify rocket launch emissions,” Barker reveals.
Thanks to new “transit” observations of the hot Jupiter exoplanet WASP-94A b using the James Webb Space Telescope (JWST), researchers at Johns Hopkins University in the US have discovered a striking weather pattern on this distant world. Their work could help provide a clearer picture of the atmospheres on exoplanets, which has been very limited until now.
When an exoplanet passes in front of (or transits) its host star, some of the light from that star passes through the planet’s atmosphere. By detecting this light using telescopes, either ground-based or in space, astronomers are able to obtain the exoplanet’s atmospheric light spectrum.
A team led by Sagnick Mukherjee and David Sing has now analysed data on WASP-94A b from the space-based JWST and have found that the mornings on this exoplanet are extremely cloudy – with water absorption features in the spectrum – while its evenings are very clear. Clouds likely form on the planet’s colder, permanent nightside where temperatures are low enough for minerals to condense. Winds then carry those clouds towards the morning limb (the leading edge of the atmosphere), explains Mukherjee.
“As these cloud particles are dragged farther toward the hotter dayside, the clouds evaporate or sink deeper, leaving the evening side much clearer,” he says. “This is a clear discovery of a planet-wide cloud cycle in action on a distant exoplanet.”
Part of a broader survey
The researchers, who detail their findings in Science, decided to study WASP-94A b as part of a broader survey of exoplanet atmospheres with the JWST called the “Grand Tour Program”. The goal of this project, says Mukherjee, is to better understand the composition of these exoplanets and the physical processes at play in their atmospheres.
One of the main difficulties encountered during such observations is how small the signals that we are trying to look at are, he explains. However, in this case, the asymmetry between the morning and evening side of the planet was rather dramatic, which made it possible to separately probe the two.
Until now, researchers only had access to a single averaged spectrum of WASP-94A b – and indeed most other exoplanets studied over the last decade –from observations made by the Hubble telescope, for example. The chemical composition of the exoplanet’s atmosphere was therefore highly biased, says Mukherjee, and it was thought that the levels of oxygen and carbon there were hundreds of times higher than on the Sun. “This finding baffled us because this result could not be explained by planet formation theories. The new data show that WASP-94A b only contains only about five times as much oxygen and carbon.”
“Being able to resolve the cloudy morning and clear evening separately therefore gives us a much cleaner view of what the atmosphere is actually made of,” Mukherjee tells Physics World. “And this is not just relevant to hot-Jupiters like WASP-94A b, but might be extended to all exoplanet atmospheres that we are trying to understand using the transit method.”
“One of the most exciting aspects”
For Mukherjee, this is one of the most exciting aspects of the JWST era. “We are taking a step beyond simply detecting the atmospheres of distant planets and are now beginning to map their weather, chemistry, and three-dimensional structure in extraordinary detail.”
Indeed, using WASP-94A b as a benchmark, the Johns Hopkins team has already studied eight other hot gas giants and discovered the same distinctive cloud cycle on two other worlds: WASP-39 b and WASP-17 b. “Inspired by these observations, our collaboration, co-led by David Sing, myself and our colleague Guangwei Fu, is about to receive more than 180 hours of new JWST data to understand weather on diverse exoplanets and measure how their weather and cloud-coverage vary with planet temperature and gravity,” reveals Mukherjee.
The Federal Communications Commission (FCC) has approved the launch of Reflect Orbital's Earendil 1 satellite — a space mirror 18 meters wide designed to reflect sunlight to the ground.
Many observations of solar flares suffer from saturation and blooming, causing crucial information to be lost. Researchers recently validated a technique for retrieving information from saturated flare images, unlocking a treasure trove of powerful solar flares for examination.
Solutions for Saturation
Since 2010, the Atmospheric Imaging Assembly (AIA) on the Solar Dynamics Observatory (SDO) has been capturing nearly continuous extreme-ultraviolet images of the Sun’s disk, revealing our star’s dramatic high-energy behavior. Though SDO/AIA’s observations have transformed our understanding of the Sun’s activity, they have limitations: powerful solar flares can saturate the detector, spilling charge into nearby pixels.
This saturation and overflow compromises our ability to study the most energetic solar flares — but the “lost” information may actually be recoverable. When light from an intense flare enters SDO’s instruments, not all of it pools in the saturated region of the detector: some of the light is diffracted by the optics, and by mathematically inverting this pattern of diffracted light, researchers can attempt to extract the encoded information about the saturated region. Researchers have used this technique for more than a decade, but options for validating the results were limited until now.
Solar Orbiter Lends a Hand
Launched almost 10 years to the day after SDO, the Solar Orbiter spacecraft provides an excellent opportunity to test inversion techniques for recovering information from saturated solar images. Solar Orbiter’s Extreme Ultraviolet Imager snaps brief photos of the Sun at a rapid cadence, and its images remain unsaturated even when faced with energetic solar flares.
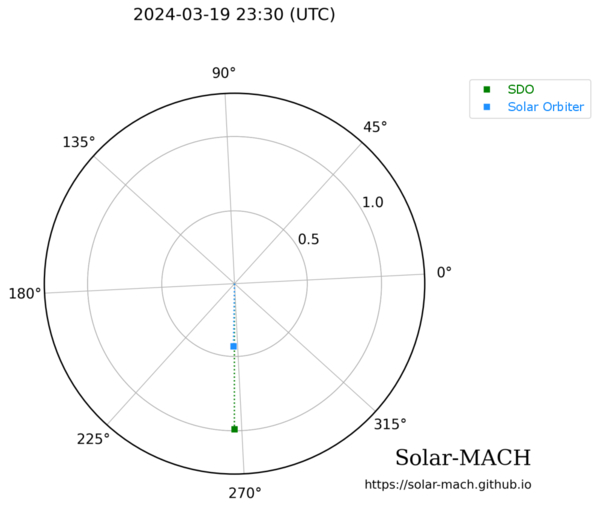
Positions of SDO (green) and Solar Orbiter (blue) during a solar flare on 19 March 2024. Click to enlarge. [Guastavino et al. 2026]
As described in a recent research article by Sabrina Guastavino (University of Genoa; Italian National Institute for Astrophysics) and collaborators, the ideal setup for testing the inversion technique arose on 19 March 2024, when SDO and Solar Orbiter both viewed a solar flare while separated by just 1 degree in longitude.
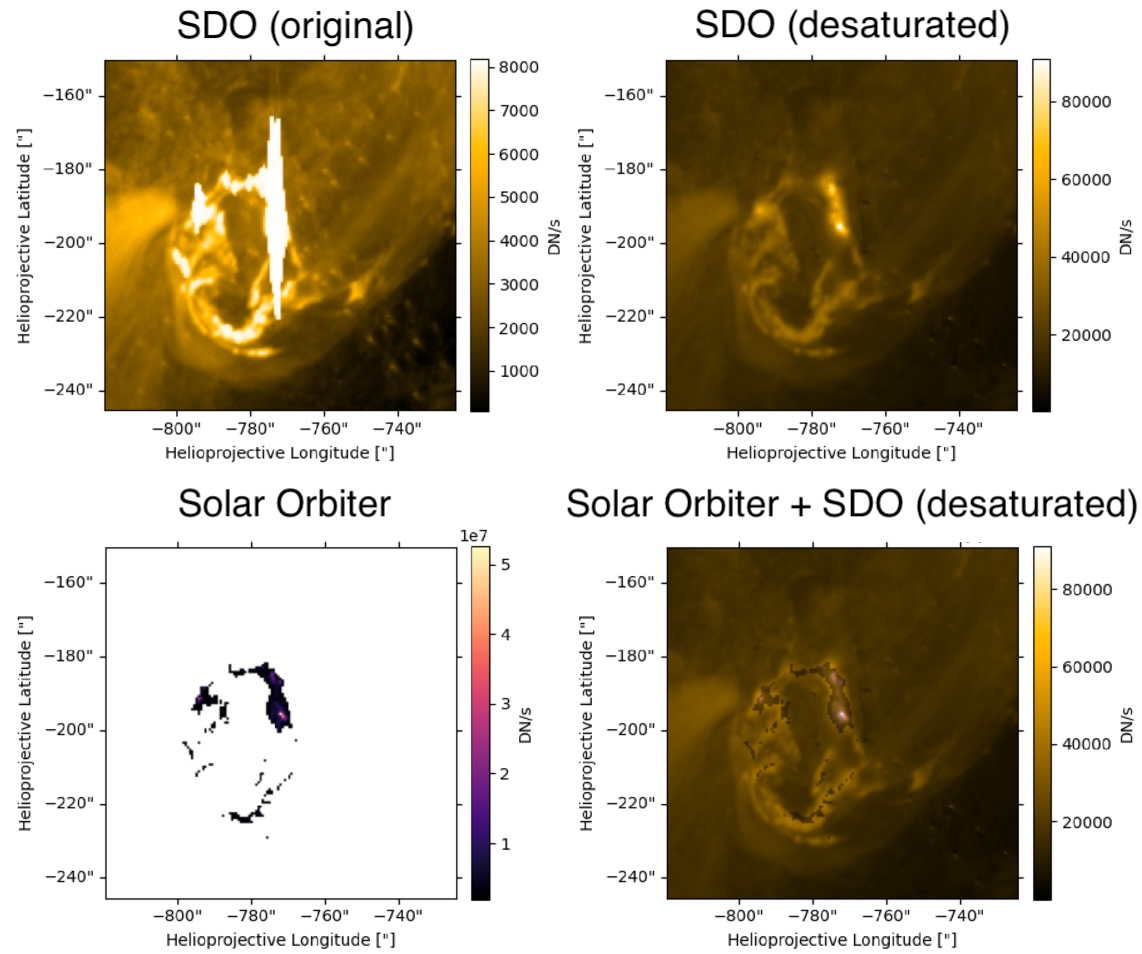
Guastavino’s team aligned and reprojected the data, accounting for the slightly different viewing angles of the two spacecraft, then applied an algorithm called Adaptive SE-DESAT to reconstruct the flux within the saturated portion of the SDO image. The team compared the desaturated SDO images to the unsaturated Solar Orbiter images over the course of the flare, finding the same flare morphology and similar time evolution between the two data sets.
Example of unprocessed SDO data (top left), desaturated SDO data (top right), Solar Orbiter data (bottom left), and a combination of the two data sources (bottom right). Note that the Solar Orbiter observations have been clipped so that only the highest flare intensities were recorded. Click to enlarge. [Adapted from Guastavino et al. 2026]
A Treasure Trove of Desaturated Data
Overall, these results demonstrate the effectiveness of the inversion technique, though Guastavino and coauthors noted that improvements could be made during the impulsive phase of the flare, when the emission is increasing. The team identified several reasons why the results may not match during this phase, including rapid evolution of the flare during individual exposures.
Despite these areas that require further attention, the validation of this technique unlocks 16 years of solar flare observations from SDO. This especially enhances our sample of powerful solar flares, increasing the available records of the most energetic solar flares by orders of magnitude.
Citation
“Validation of an Extreme-Ultraviolet Desaturation Technique for the Atmospheric Imaging Assembly on Board the Solar Dynamics Observatory Using Observations from the Extreme Ultraviolet Imager on Board Solar Orbiter,” Sabrina Guastavino et al 2026 ApJL1005 L50. doi:10.3847/2041-8213/ae7d2e
NASA is once again sending scientific missions to the Moon. But under the new commercial framework for getting there, researchers need to invent a new method for how to pick where to land.
A New Process for Picking Sites
NASA’s Commercial Lunar Payload Services program is a bold innovation in organizing robotic missions to the Moon. Under this model, rather than keeping the mission process entirely in-house, the agency selects the scientific mission they want to support then simply buys a ride to the lunar surface from a commercial vendor. But, how do you pick a landing site before you know exactly how you’re getting there?
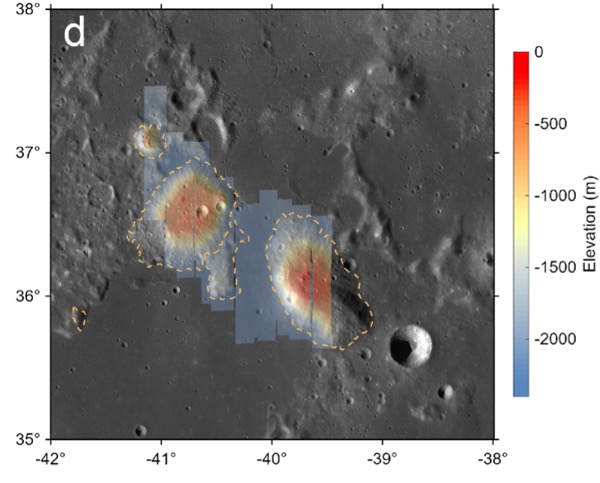
The Gruithuisen domes region, the broad area the Lunar-VISE team searched for potential landing sites. Click to enlarge. [Adapted from Williams et al. 2026]
The Lunar Vulkan Imaging and Spectroscopy Explorer (Lunar-VISE) mission, set to launch in mid-2028, was one of the first programs to go through this new landing site selection process. After being officially selected in 2022, the team had just nine months to nail down exactly where their mission should touch down. A recent article led by Jean-Pierre Williams (University of California, Los Angeles) detailed exactly how the team accomplished this task and presented some lessons they learned along the way.
No Parking Lots on the Moon
Picking a landing site is no small task: for context, selecting the landing sites for each of the most recent Mars rovers took five years and multiple community workshops. The Lunar-VISE team therefore took a streamlined and logic-driven approach. They started by explicitly laying out their science objectives: Lunar-VISE’s purpose is to investigate some strangely silicate-rich volcanic formations called the Gruithuisen domes, so they had to land either on or near those. They also had to have access to boulders that were excavated from deep within the domes during a crater formation event, so they had to pick a spot with boulders relatively nearby.
In addition to objectives, they also laid out a slew of constraints. Although they needed boulders nearby, they couldn’t have too many boulders, or any particularly large boulders, since those could pose hazards for landing. There also couldn’t be any steep slopes in the field. Most of the area had to maintain a line of sight with a supporting orbiter for communications, so they couldn’t set down near any ridges. Also, they had to consider how the terrain would cast shadows as the lunar day progressed, since they didn’t want their mission cut short by freezing temperatures and a lack of solar power. As the team quipped, “many interesting, high-science value locations on the Moon may not be in proverbial ‘parking lots.'”
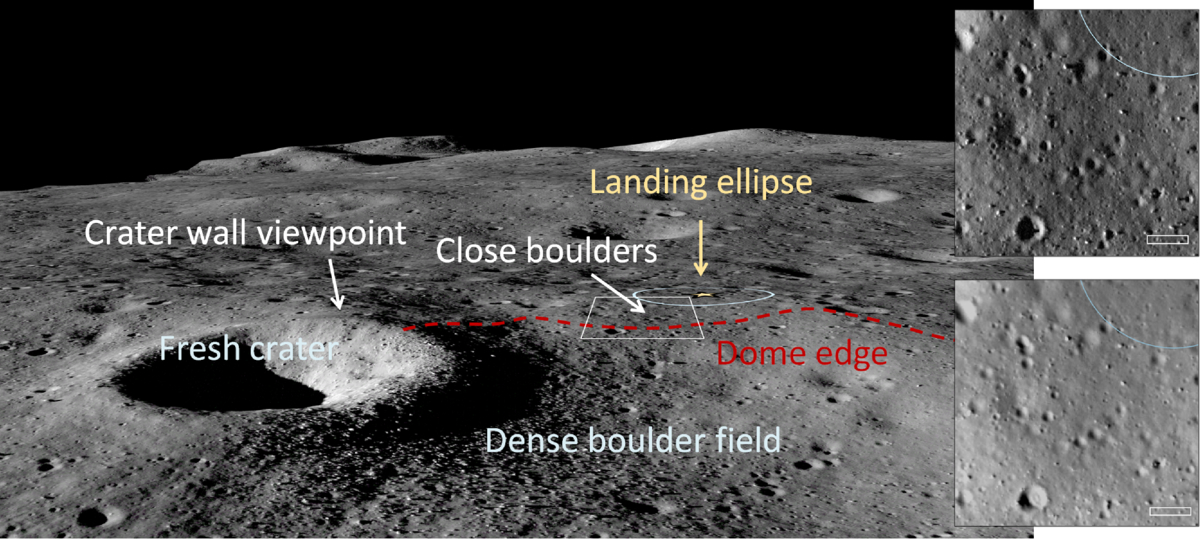
An image from the Lunar Reconnaissance Orbiter overlaid onto a terrain model of the final landing site. Click to enlarge. [Williams et al. 2026]
By combing through archival data and working with the team that operates the Lunar Reconnaissance Orbiter Camera, a key asset for making detailed maps of the Moon, the researchers found the perfect spot: alongside a 190-meter-diameter crater named Mareta. This feature is named after Mareta West, one of the first female planetary geologists at the United States Geological Survey and the scientist who selected the landing site for Apollo 11’s historic touchdown.
In addition to presenting their landing site, the researchers offered a handful of lessons to others who may someday be in the fortunate and thrilling position of needing to pick a landing spot on the Moon. For one, they urged teams to coordinate with the Lunar Reconnaissance Orbiter specialists as early as possible, since processing the imaging data for lander-quality maps is a specialized and intensive task. For another, they recommended that all of the software tools used be made publicly available so that future missions don’t need to duplicate their work.
As this article laid out, the Commercial Lunar Payload Services program and Lunar-VISE take us one step closer to making missions to the Moon routine — but we’re still figuring out exactly how to do that.
Citation
“Lunar-VISE Landing Site Selection and Characterization at Mons Gruithuisen Gamma,” Jean-Pierre Williams et al 2026 Planet. Sci. J.7 161. doi:10.3847/PSJ/ae7d2c
The Lucy spacecraft, en route to its primary mission targets, zipped past the main-belt asteroid Dinkinesh and revealed its tiny satellite, Selam. New research examines the surfaces and histories of these small rocky worlds.
A Stop Along the Way
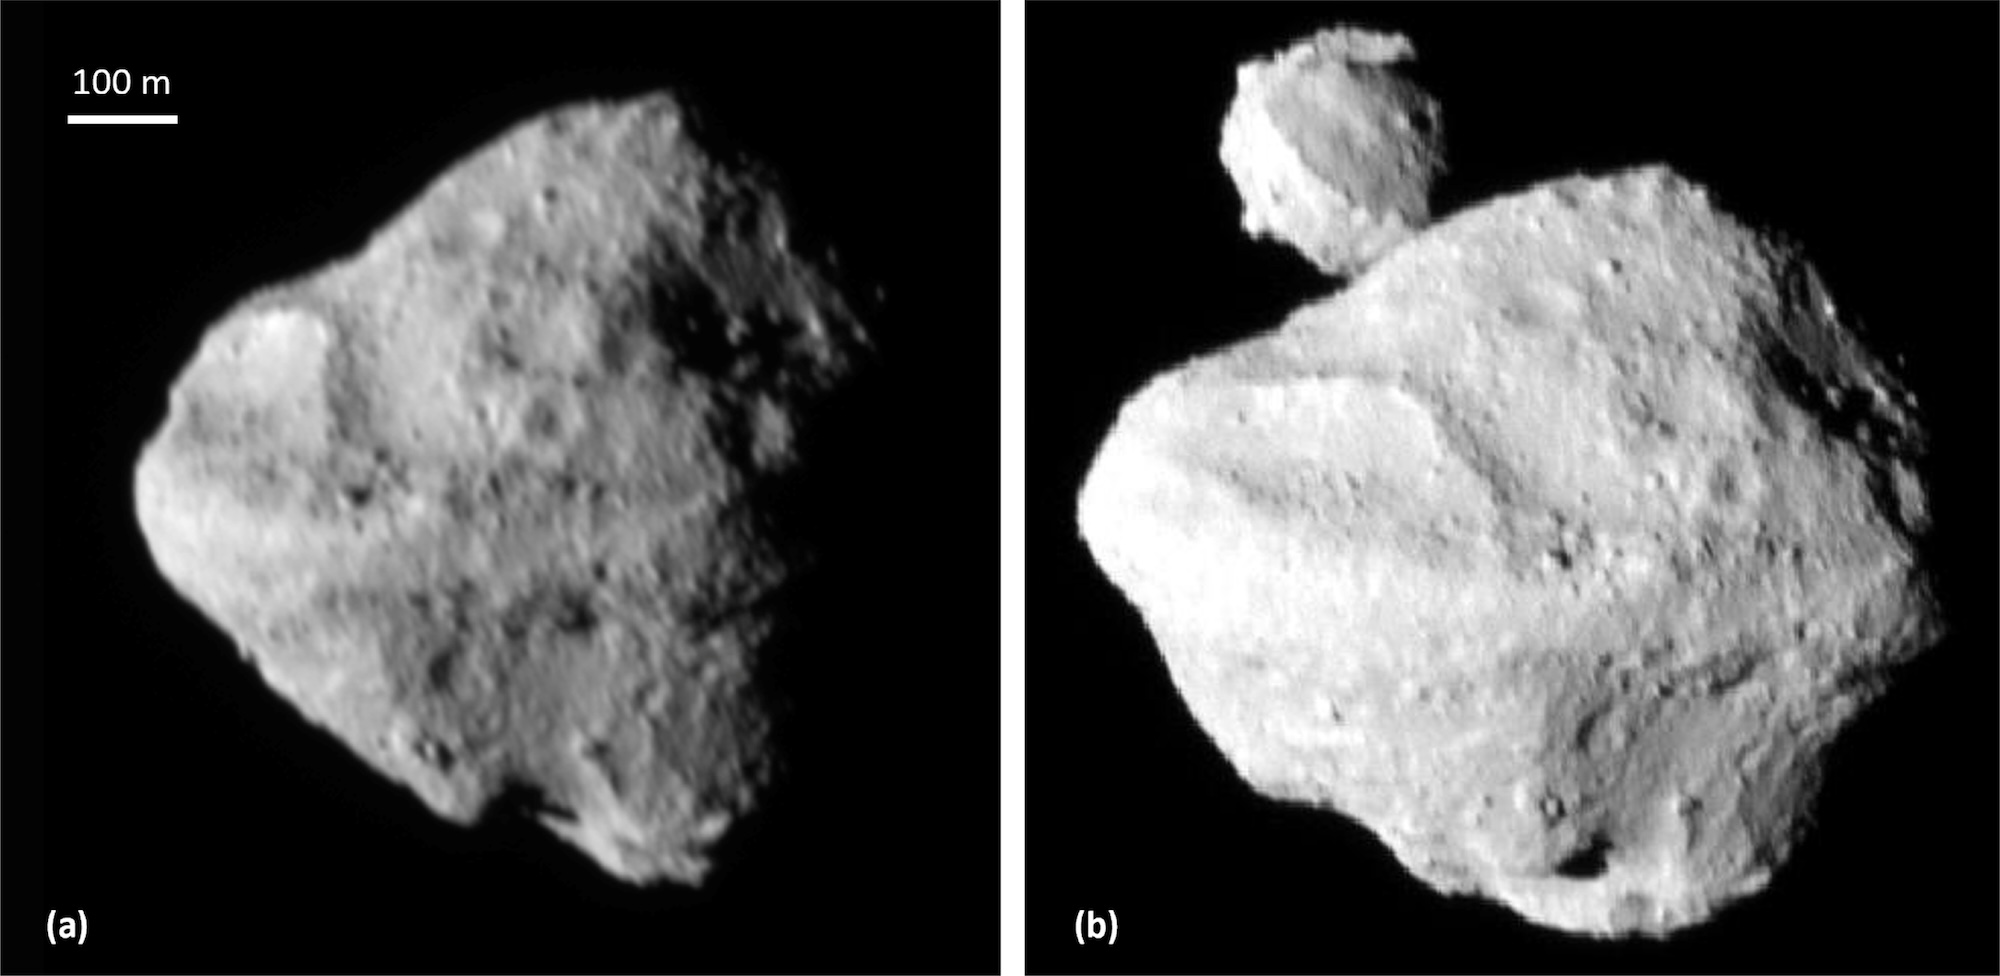
In 2021, the Lucy spacecraft embarked on a 12-year mission to study several Jupiter trojan asteroids, which share Jupiter’s orbit. The spacecraft won’t have its first encounter with a Jupiter trojan until 2027, but it hasn’t been idle during its long journey. In November 2023, Lucy performed a dress rehearsal of its trojan-encounter maneuvers during a flyby of a 738-meter-wide main-belt asteroid called (152830) Dinkinesh.
Two images of Dinkinesh from the Lucy mission. The second image features its satellite, Selam. [Bierhaus et al. 2025]
During this flyby, Lucy flew within 430 km (267 mi) of the asteroid and made a surprise discovery: Dinkinesh has a tiny companion, which has been named Selam. (The name Dinkinesh comes from the Amharic name for the Lucy fossil discovered in 1974; Selam is similarly named after a hominid fossil that is sometimes called “Lucy’s baby.”) Remarkably, Selam is the first known asteroid satellite that is a contact binary, made up of two separate bodies that have gently merged into one.
Craters and Boulders
In a recent research article, Edward Bierhaus (Lockheed Martin Space) and collaborators analyzed Lucy flyby images to study the surfaces of Dinkinesh and Selam. The team analyzed global features like troughs and ridges and measured visible craters and boulders.
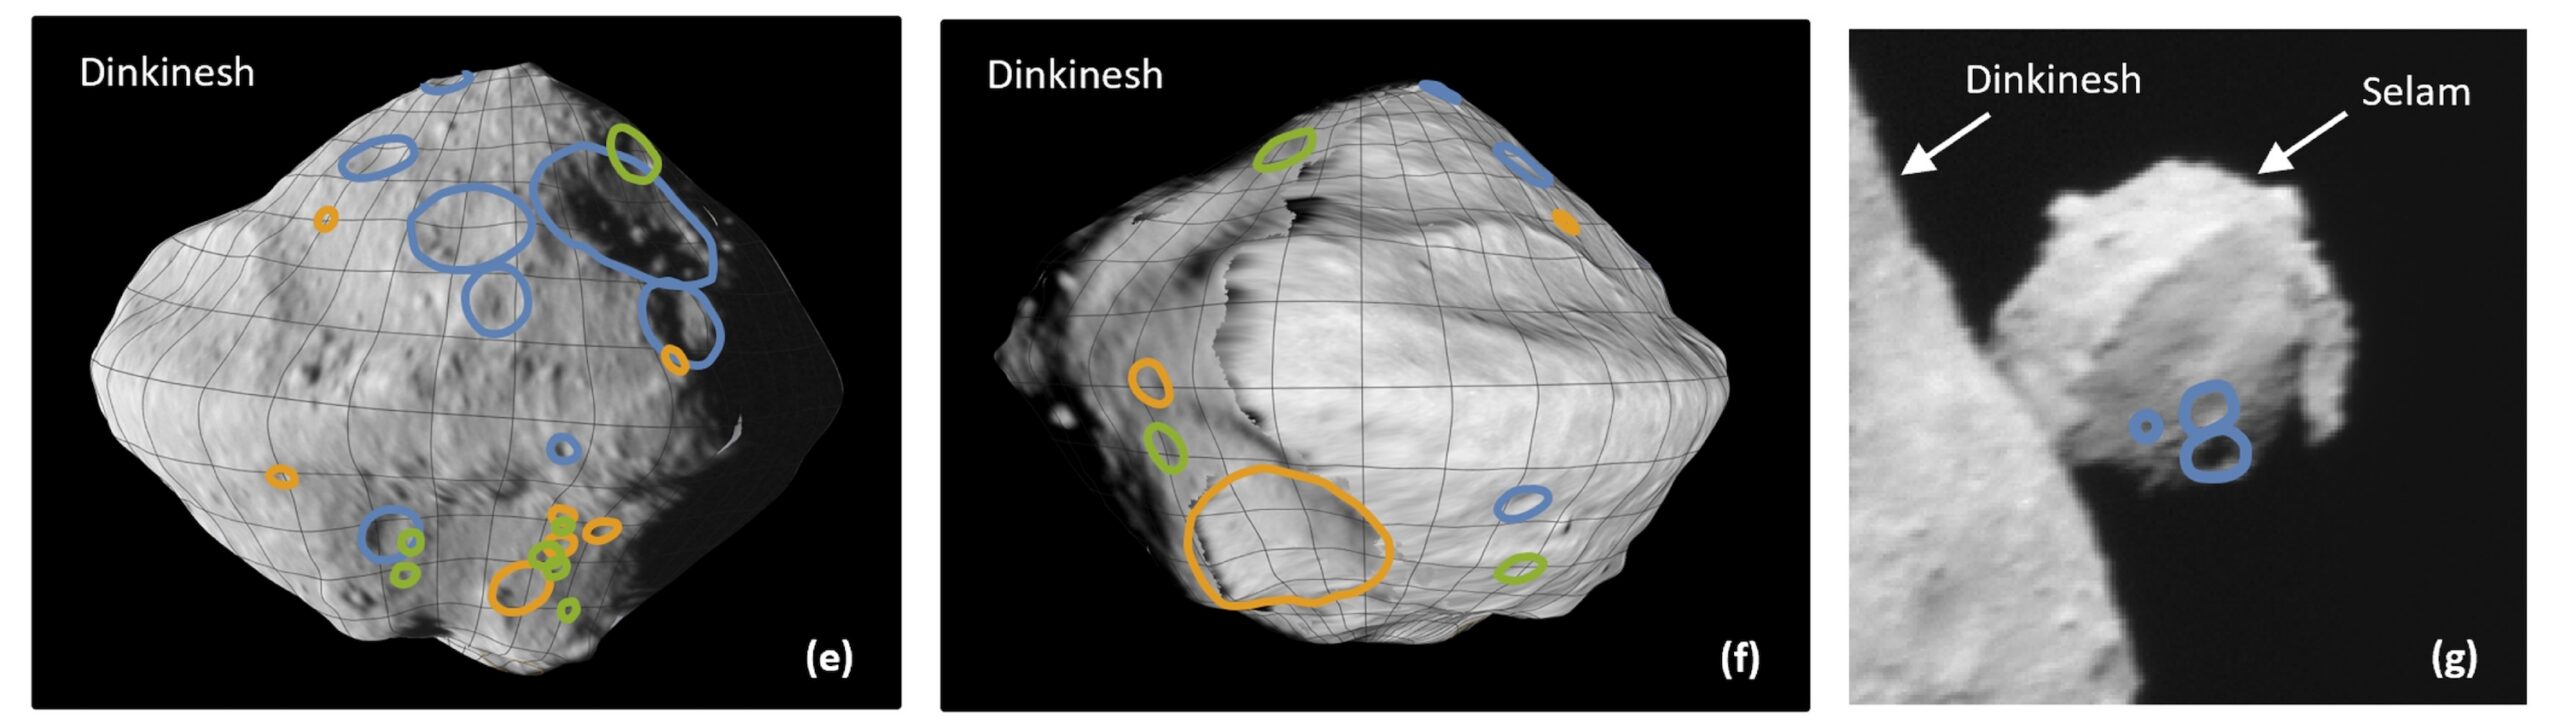
Locations of craters on Dinkinesh and Selam. The blue lines indicate the most confidently identified craters; orange and green lines mark craters identified less confidently. Click to enlarge. [Bierhaus et al. 2025]
While the small numbers of craters detected — 29 for Dinkinesh and 3 for Selam — makes further analysis difficult, the team determined that Dinkinesh’s crater size–frequency distribution is shallower than expected, though similar to that of small near-Earth asteroids (e.g., Ryugu). The seemingly shallow distribution may be an effect of the phase angle and resolution of the observations, or it could be a sign of impact armoring or other surface processes.
The size–frequency distribution of Dinkinesh’s boulders, on the other hand, is somewhat steeper. This discovery may mean that S-type (stony) asteroids like Dinkinesh have different boulder size distributions than C-type (carbonaceous) asteroids.
Possible Histories
An analysis of the collisional timescales in the main asteroid belt suggests that Dinkinesh is a fragment of a larger asteroid that was split apart at least once, though it’s not yet possible to say which parent body it might have come from. After splitting off from its parent asteroid, Dinkinesh appears to have been subjected to the Yarkovsky–O’Keefe–Radzievskii–Paddack (YORP) effect. This effect arises when sunlight falls on a small asymmetric asteroid, creating a torque that can alter its spin rate. In extreme cases, the YORP effect can crank up an asteroid’s spin rate so much that it sheds some of its surface material or flies apart altogether.
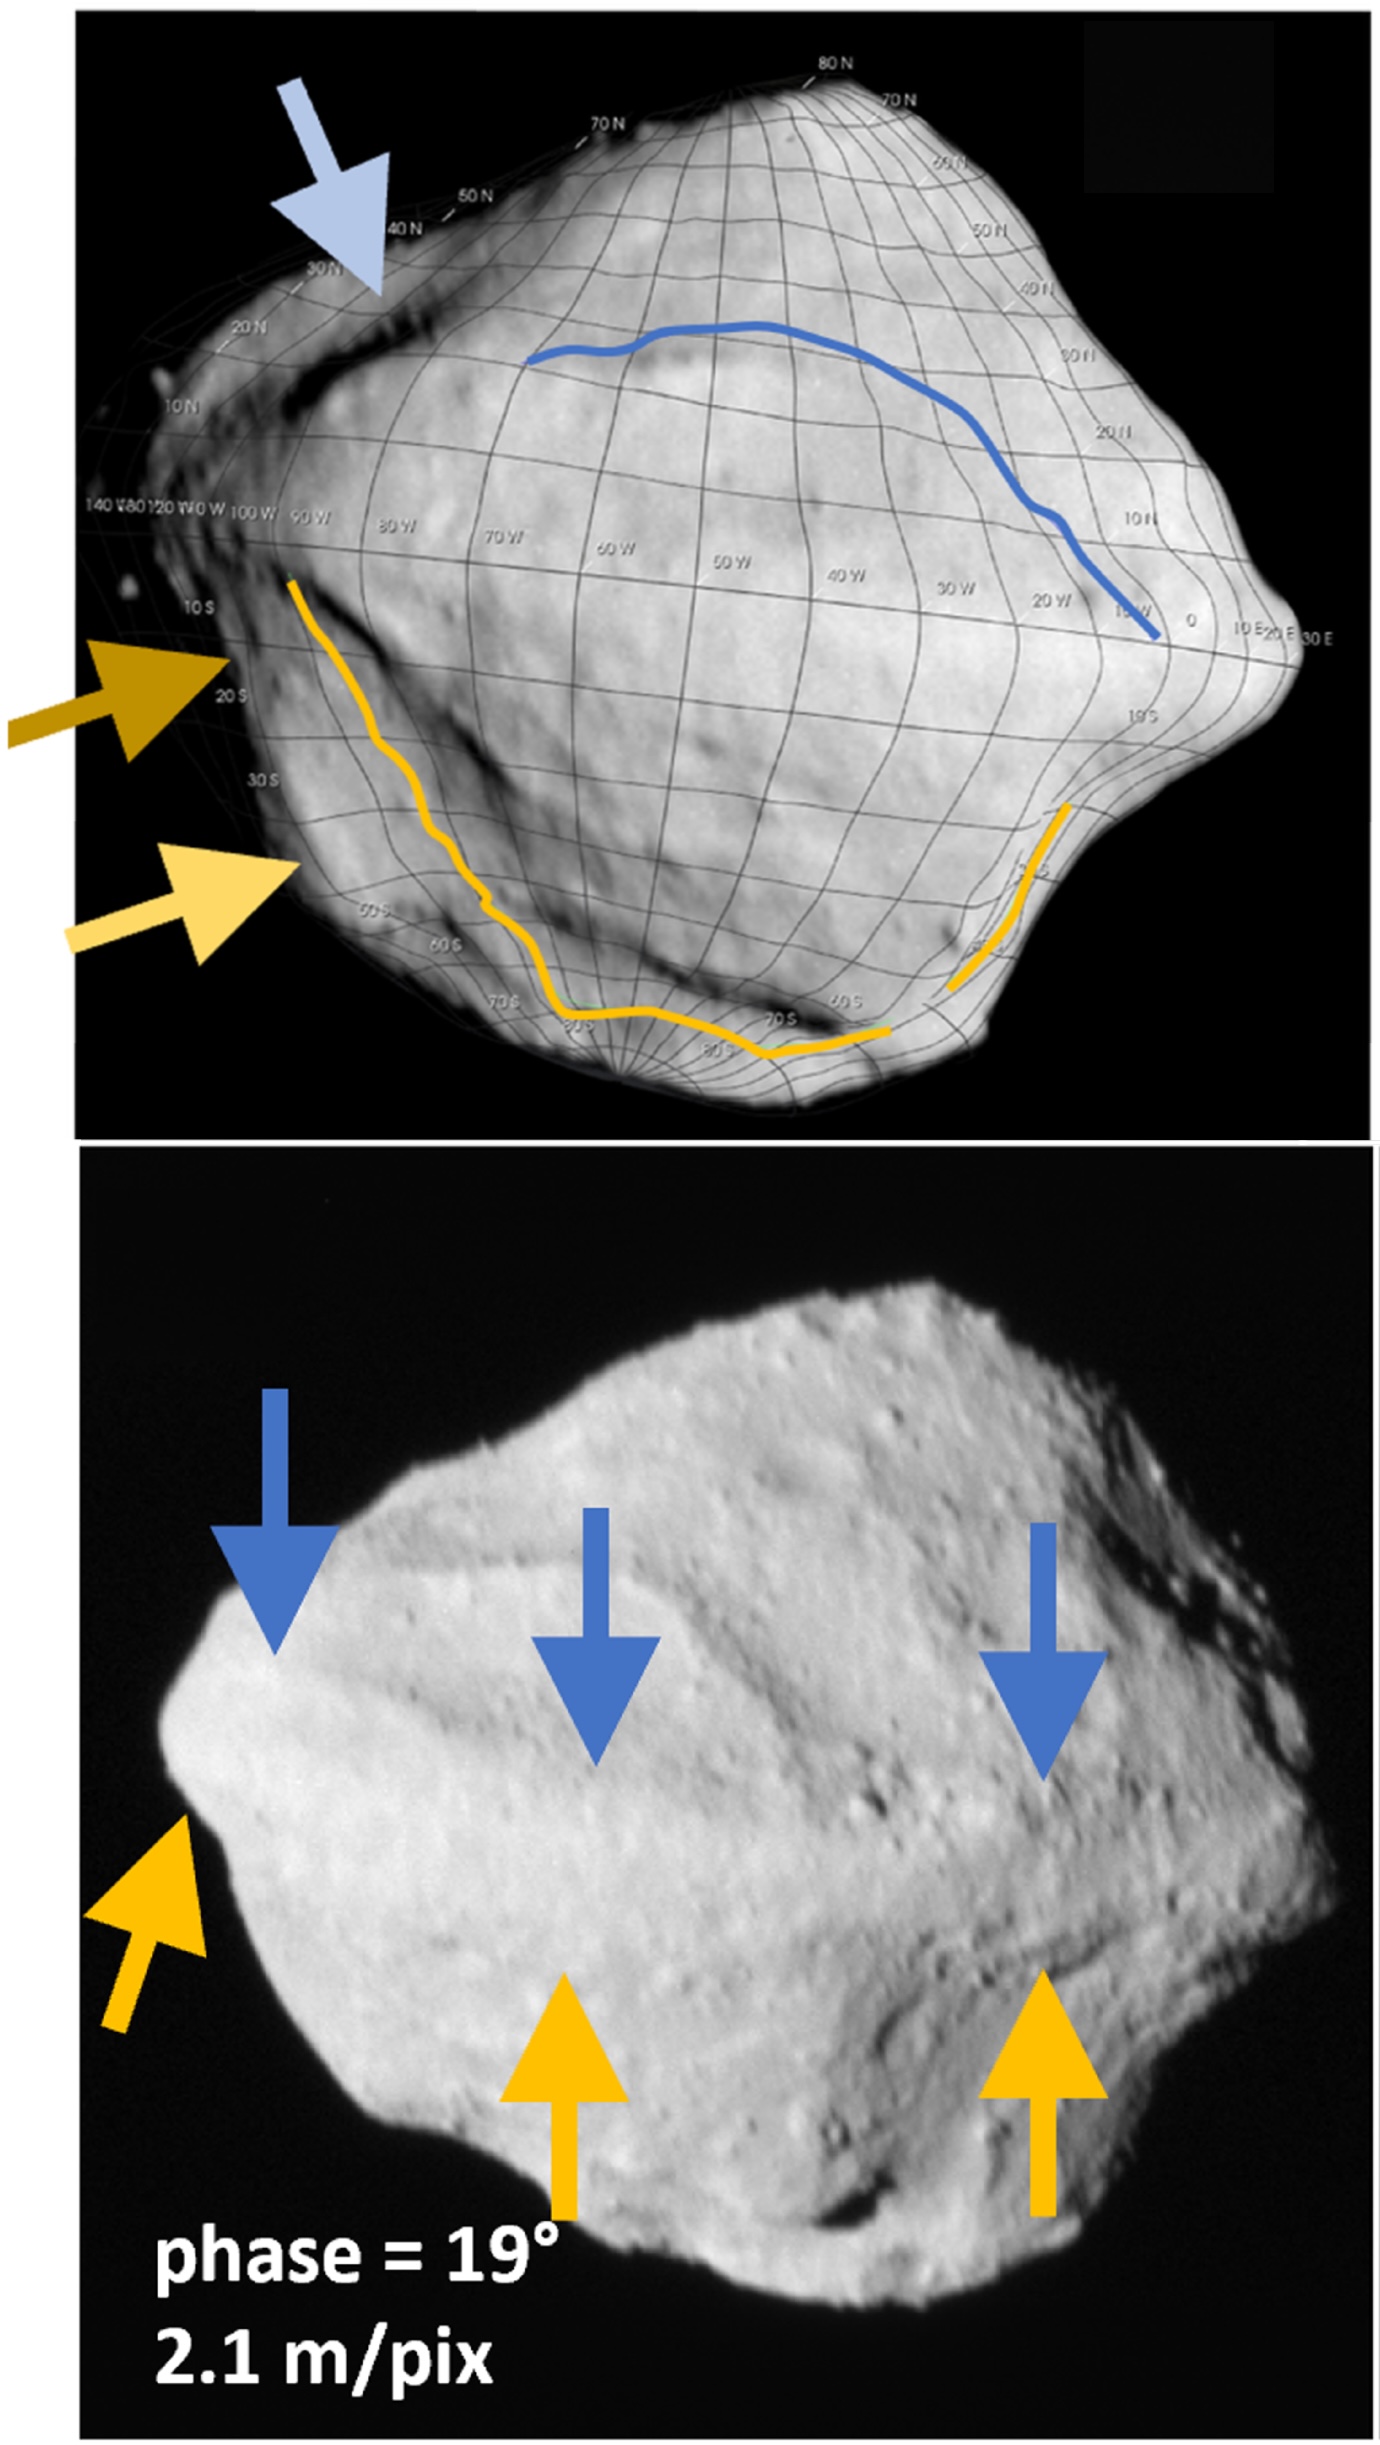
Locations of Sumak Fossa (top) and Fab Dorsum (bottom) indicated with arrows. [Adapted from Bierhaus et al. 2025]
Dinkinesh seems to show clear signs of YORP-driven structural failure. Sumak Fossa (a large trough) and Fab Dorsum (a ridge running along the asteroid’s equator) may have formed through this process. If Sumak Fossa was excavated by a YORP-induced mass-shedding event, both Fab Dorsum and Selam could have formed out of the cast-off material.
With Lucy en route to its primary objective, there’s still much for us to learn from this mission about the small bodies of our solar system. In the meantime, be sure to check out the full article linked below, as there are far more details about Dinkinesh and Selam than could be included in this short summary!
Citation
“The Geology of a Small Main-Belt S-Class Binary Asteroid System: Dinkinesh and Its Contact Binary Satellite Selam as Observed by the Lucy Mission,” E. B. Bierhaus et al 2025 Planet. Sci. J.6 299. doi:10.3847/PSJ/ae1968
In September 2022, the Double Asteroid Redirection Test (DART) mission served as the first attempt at redirecting a near-Earth asteroid — an experiment testing humanity’s ability to fend off any threatening Earth-bound asteroids. A recent study presents the first 3D reconstruction of the impact ejecta, suggesting that the blown-out material is more complex than previous models considered.
DART-ing into Dimorphos
The DART spacecraft intentionally smashed into Dimorphos, the small and unassuming moon of the larger asteroid Didymos. This space-based crash test aimed to determine if kinetic impactors like DART could successfully change an asteroid’s course through the solar system. Dimorphos’s orbit was indeed shortened by roughly 30 minutes, confirming that ramming an asteroid with a spacecraft could be a viable method of planetary defense. However, determining exactly how much an asteroid’s path will be altered is not necessarily straightforward. When a spacecraft collides with an asteroid, the impactor imparts momentum to the target, and any material excavated from the impact site can also alter the asteroid’s course.
DART’s impact launched a significant spray of rubble, or what researchers call an ejecta curtain. The ejecta curtain is typically modeled as a cone, using a simple geometry to determine its contribution to momentum transfer. However, when looking closely at imaging taken soon after the collision, the real physical structure of the ejecta appears to be more complex. Untangling the true 3D distribution of the ejecta is necessary to understand how momentum was actually distributed among escaping ejecta, better estimate the total mass ejected from Dimorphos, and improve modeling of the Didymos system’s orbit after impact.
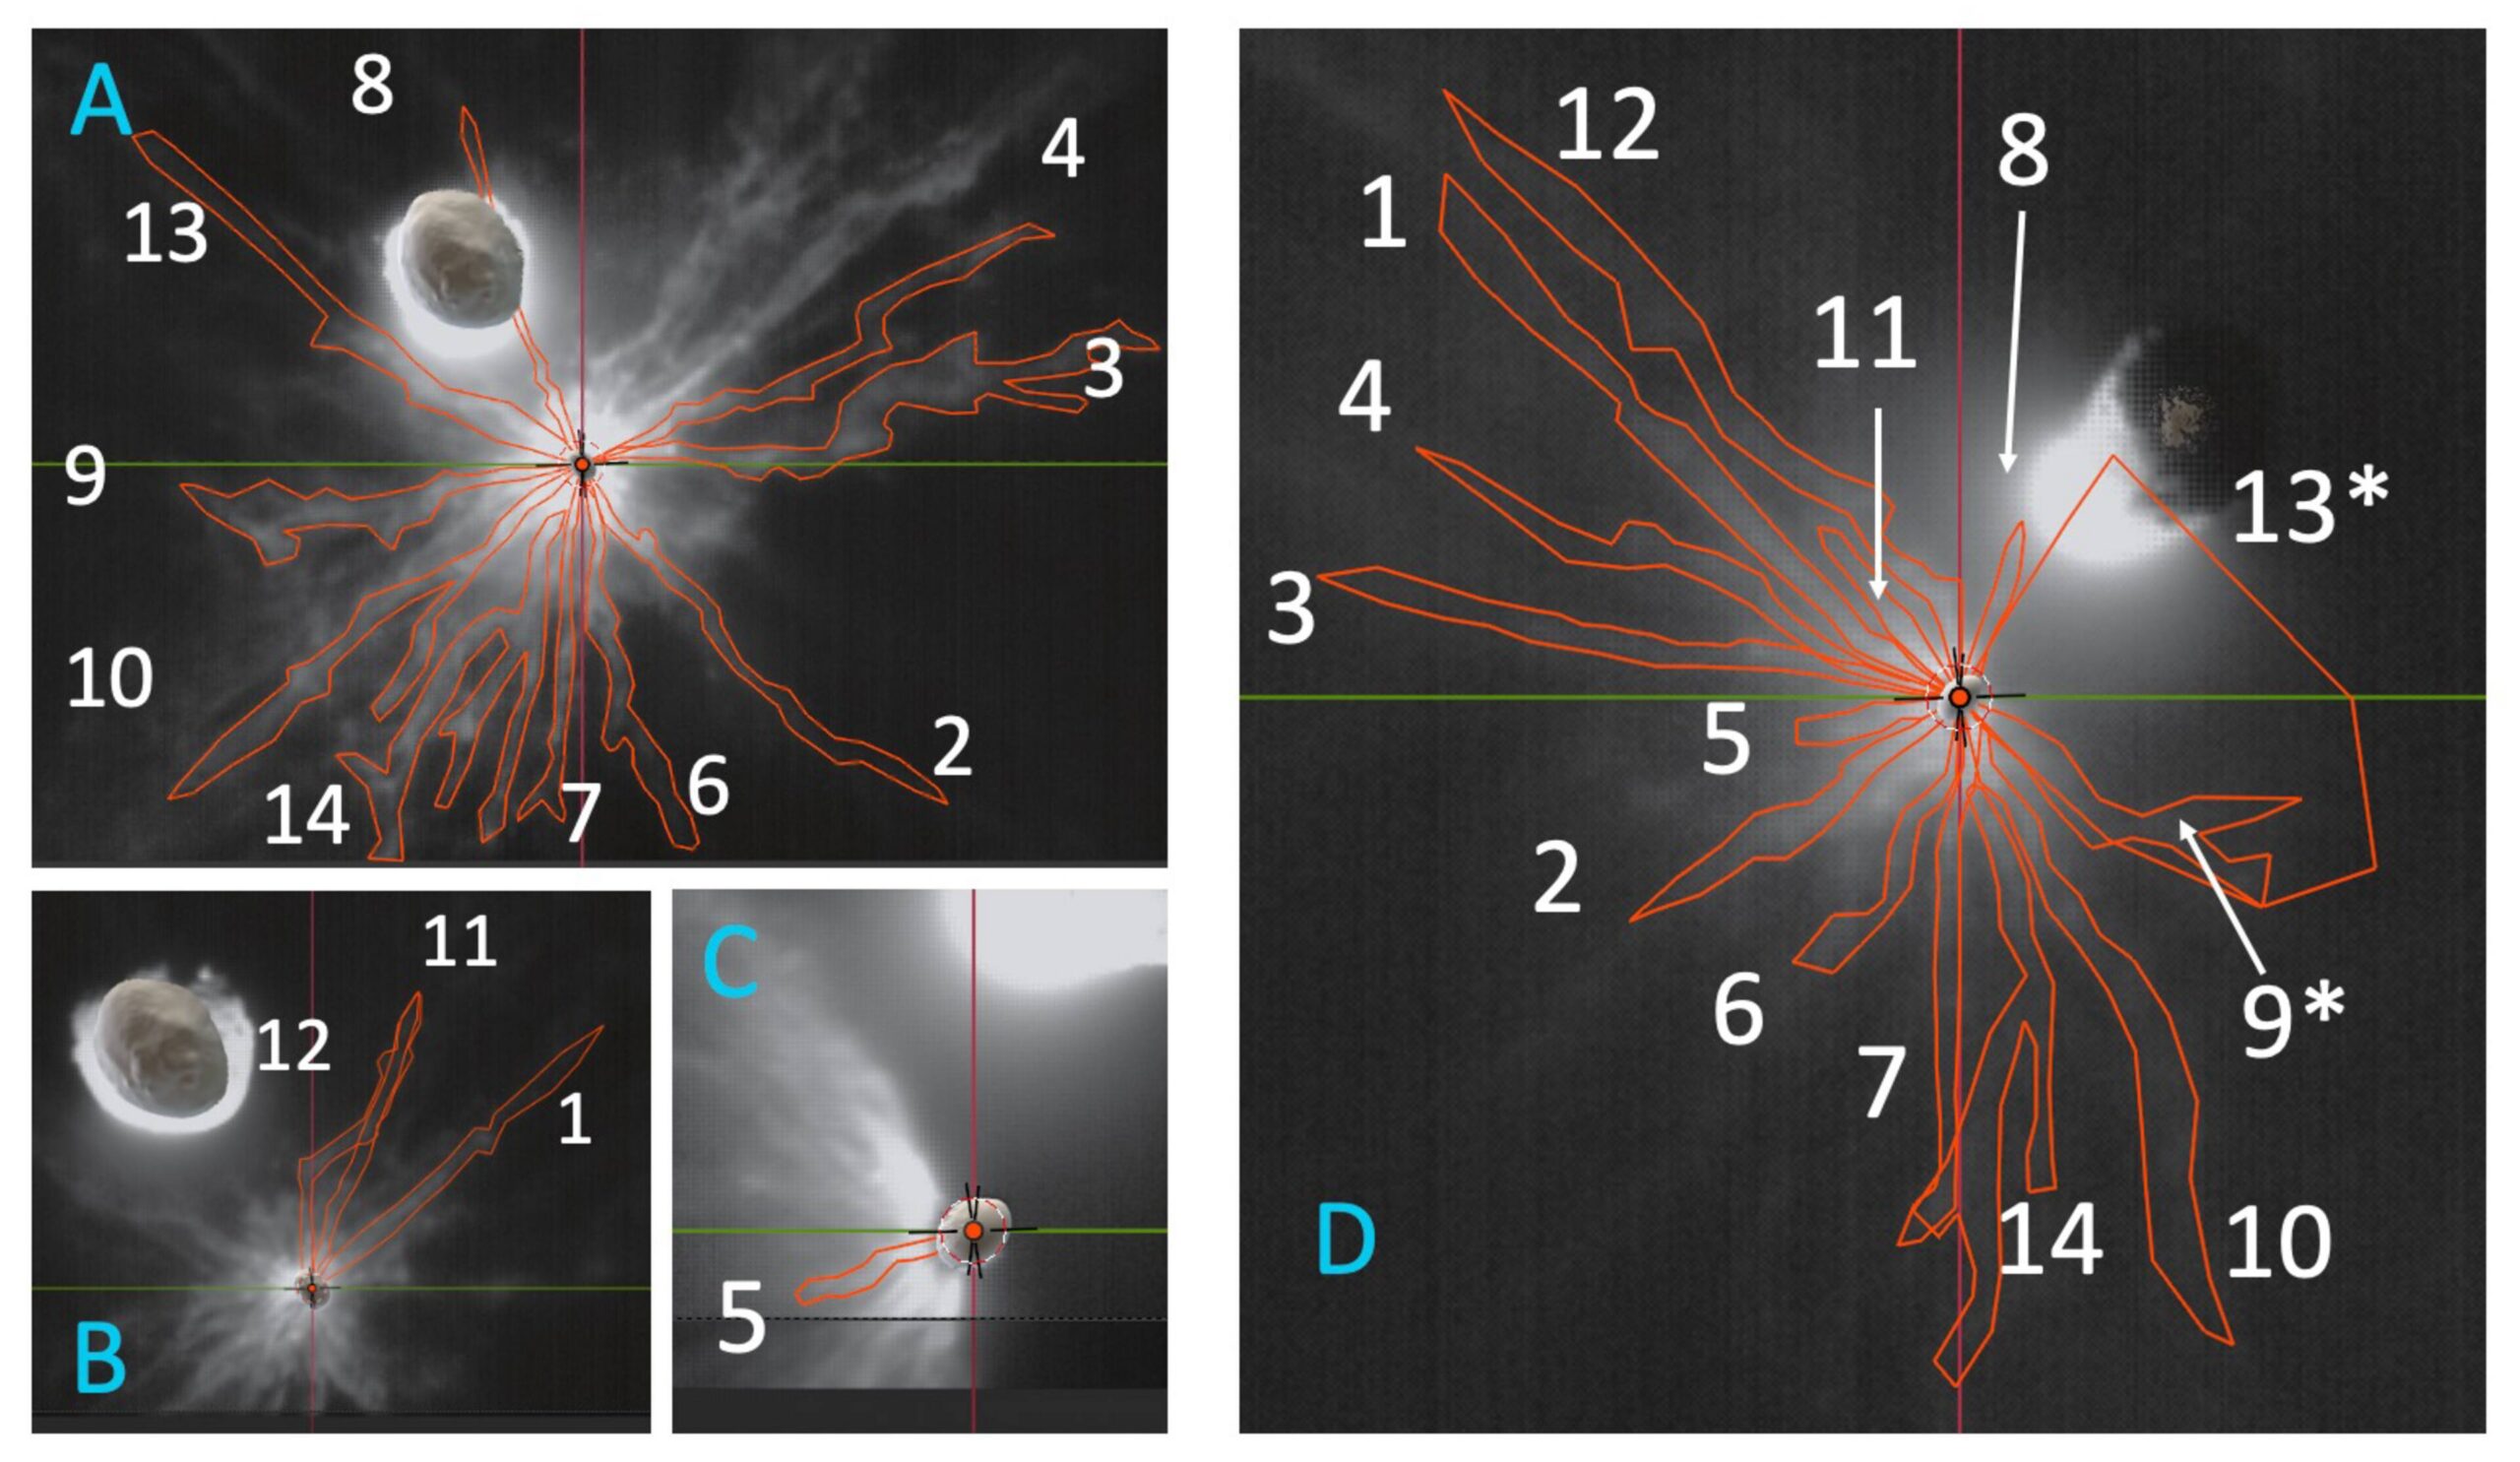
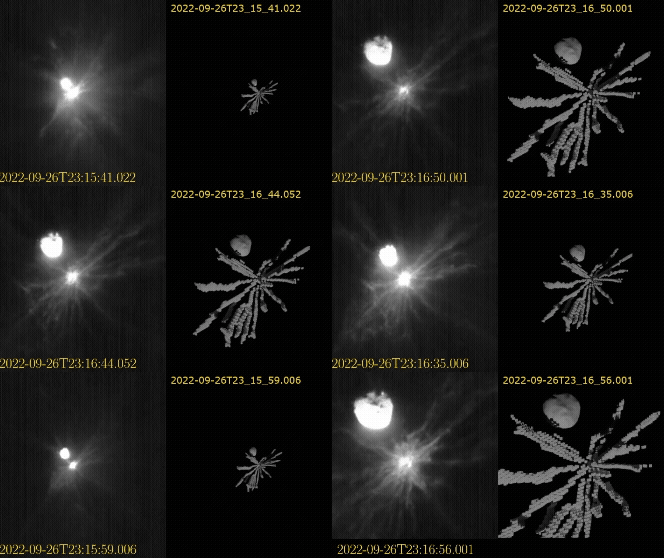
LICIACube images of the DART ejecta curtain with the 14 distinct features identified in this study outlined in red. Click to enlarge. [Deshapriya et al 2026]
Determining Debris Distribution
Seeking to better characterize the ejecta curtain, a team led by J. D. P. Deshapriya from Italy’s National Institute for Astrophysics used data from the Light Italian CubeSat for Imaging of Asteroids (LICIACube) that flew behind the DART spacecraft to capture images of the system shortly after the impact. After careful image handling to bring out diffuse and faint material, the researchers identified 14 distinct ejecta features across the flyby imaging. LICIACube viewed the aftermath both side on and face on, providing valuable 3D information about the distribution and motion of the ejecta.
Animation of the DART ejecta as the LICIACube spacecraft approached the impact. The left shows the images taken by the spacecraft, and the right shows the 3D model produced for the ejecta. Click to play animation. [Deshapriya et al 2026]
Using 3D modeling software, the researchers traced each of the 14 distinct features across the images and reconstructed a 3D representation of the ejecta morphology. While earlier models assumed symmetric cone-like geometries, this 3D modeling revealed clear asymmetric and non-uniform structures within the ejecta curtain. These variations point to underlying heterogeneities in the impact site on Dimorphos — surface and subsurface composition naturally link to the resulting ejecta distribution according to previous laboratory experiments. The spatial and directional features uncovered in this study highlight the limitations of models that attempt to characterize ejecta curtains with symmetric and uniform distributions. Refining these model parameters will better match observations and better predict momentum transfer in future missions.
Planetary Defense
What does this mean for planetary defense? While simplified symmetric cone models provide helpful approximations for kinetic impactor missions, they do not fully capture the true complexity of the impact. This study shows that local variations in an asteroid’s surface and interior properties can directly influence the resulting ejecta distribution and motion. The true momentum imparted to the target asteroid depends heavily on the specific ejecta material, and these details inform how effective planetary defense missions can be in redirecting asteroids. Incorporating realistic, observation-driven ejecta distributions into modeling frameworks is essential to achieve reliable predictions for future planetary defense missions.
Citation
“3D Reconstruction of DART Ejecta at Dimorphos Reveals an Anisotropic, Filamentary Structure,” J. D. P Deshapriya et al 2026 Planet. Sci. J. 7 4. doi:10.3847/PSJ/ae2c64
Earthlike yet alien, Titan is the only solar system body other than Earth known to host persistent liquid on its surface. The glint of sunlight on this surface liquid provides a means to study the complex interplay between Titan’s seas, shorelines, and atmosphere.
When the Sun Hits the Sea as Seen by Cassini, That’s a Mare
The first image of specular reflection of sunlight off Titan’s hydrocarbon seas, taken on 8 July 2009 by Cassini. [NASA/JPL/University of Arizona/DLR]
In 2009, the Saturn-orbiting Cassini spacecraft spotted the glare of sunlight reflecting off a sea of liquid on the surface of Titan, Saturn’s largest moon. This observation of specular (i.e., “mirror-like”) reflection, or sunglint, confirmed the presence of liquid on Titan’s surface — what researchers now know to be oily lakes and seas of liquid hydrocarbons like methane and ethane.
A recent research article from Michael Heslar and Jason Barnes (University of Idaho) yields new insight into the behavior of Titan’s seas and coastal regions in Punga Mare. Punga Mare, located nearly at the north pole, is the smallest of Titan’s named seas and holds the distinction of being the first place where extraterrestrial waves were definitively identified.
Summering at Punga Mare
In the Cassini observation selected for this study, it’s summertime in the northern hemisphere, with balmy temperatures hovering just above 90K (−298℉/−183℃). Cassini viewed Punga Mare from an altitude of roughly 6,000 kilometers and at an oblique angle of 126 degrees. From this angle, Titan’s landmasses appear dark and the sea appears bright.
The geometry of specular reflection (sunglint) and sun glitter. The incidence and emission angles, i and e, are equal. Click to enlarge. [Heslar et al. 2020]
Several anomalously bright features, collectively called specular features, appear in and near Punga Mare. These features are examples of sunglint and sun glitter. Sunglint occurs when sunlight reflects off a smooth surface as light reflects off a mirror, with the angle of the incoming sunlight equal to the observer’s viewing angle. Sun glitter is a related phenomenon that occurs outside the sunglint zone, where localized changes in the angle of the surface — from waves, for example — reflect sunlight toward the observer.
Coasts, Islands, and Inlets
Cassini Visual and Infrared Mapping Spectrometer observation of Punga Mare at wavelengths of 5.0 (red), 2.8 (green), and 2.0 (blue) μm. Click to enlarge. [Adapted from Heslar & Barnes 2025]
Heslar and Barnes identified specular features along the coastline, bordering a chain of islands, out at sea, and in coastal inlets.
The bright areas along the coast appear to overlap both the sea surface and the land surface. While it’s not yet clear exactly what causes this brilliant coastal outline, Heslar and Barnes speculated that it may be evidence for waves along the coastline; rough seas may also be the cause of the sun glitter illuminating the Hawaiki island chain and out at sea.
The specular features associated with inlets may mark where rivers flow into or out of Punga Mare. Rather than wave activity, these bright areas might mark where nitrogen has bubbled up to the surface.
Altogether, this study demonstrated the variety and depth of information that can be gleaned from a single sunglint observation — and the authors closed by noting how effective an orbiter would be for studying ocean behavior on Titan. NASA’s upcoming Dragonfly mission may also be able to capture sunglint as the spacecraft leapfrogs across Titan’s surface.
Citation
“Sea Surface and Hydrological Activity Observed in Titan’s Punga Mare,” Michael F. Heslar and Jason W. Barnes 2025 Planet. Sci. J.6 74. doi:10.3847/PSJ/adbc9e

 Login