
 Login

SPHEREx: The Niftiest Space Telescope You May Not Have Heard Of

Editor’s Note: Astrobites is a graduate-student-run organization that digests astrophysical literature for undergraduate students. As part of the partnership between the AAS and astrobites, we occasionally repost astrobites content here at AAS Nova. We hope you enjoy this post from astrobites; the original can be viewed at astrobites.org.
Title: The SPHEREx Satellite Mission
Authors: James J. Bock et al.
First Author’s Institution: California Institute of Technology; Jet Propulsion Laboratory
Status: Published in ApJ
You know JWST. You’ve likely heard about the recently launched Nancy Grace Roman Space Telescope. But did you know that NASA launched a third space telescope focused on infrared astronomy just last year? That telescope, called SPHEREx (short for Spectro-Photometer for the History of the Universe, Epoch of Reionization, and Ices Explorer, but we’ll forgive the tortured acronym), is currently carrying out its ambitious mission to record an infrared spectrum for every point in the sky. Let’s break down SPHEREx’s three main science goals and then discuss how SPHEREx will accomplish its mission.
Goal #1: Stress-Testing Cosmic Inflation
According to our best current models of cosmology, the very early universe experienced a rapid burst of accelerating expansion called cosmic inflation. During inflation, small regions of the universe that by chance had slightly higher energy density than their neighbors (due to quantum fluctuations) expanded to huge scales. Because these regions were very gravitationally attractive, once inflation ended, they became the seeds where matter accumulated and eventually formed galaxies.
This means that the distribution of galaxies that we see today is a reflection of the properties of inflation (i.e., what the quantum fluctuations were like and how inflation supersized them). SPHEREx will assemble the largest atlas of galaxies ever, recording the three-dimensional positions of hundreds of millions of galaxies across the entire sky. To do this, SPHEREx must figure out how far away these galaxies are from Earth, using their redshifts. SPHEREx’s low-resolution infrared spectroscopy allows for moderately precise measurements of these redshifts. By performing statistical analyses of how galaxies are separated from each other, SPHEREx will test different theories of inflation, like whether inflation was driven by multiple fields.
Goal #2: Frozen Assets
Astronomers are racing to find evidence for life (or at least habitability) in the atmospheres of exoplanets through transmission spectroscopy. However, we don’t know for sure how molecules that could be used in biological processes (called biogenic molecules, these include water, carbon dioxide, carbon monoxide, and methanol) even end up on planets.
We think that a large fraction of these molecules are frozen onto dust grains throughout the interstellar medium. When a new star forms in the interstellar medium, this ice and dust would become part of the star’s protoplanetary disk. The ice species can help create planetesimals (which may grow into planets) or can later deliver biogenic molecules to planetary surfaces. Earth’s oceans likely came (at least in part) from collisions with icy asteroids. As Figure 1 shows, SPHEREx will measure the abundance of ice species in different environments that track the history of solar system formation, from dense clouds in the interstellar medium that may soon form stars to regions around newborn stars and evolving protoplanetary disks. In this way, SPHEREx will track how biogenic molecules from the interstellar medium can end up on planets.
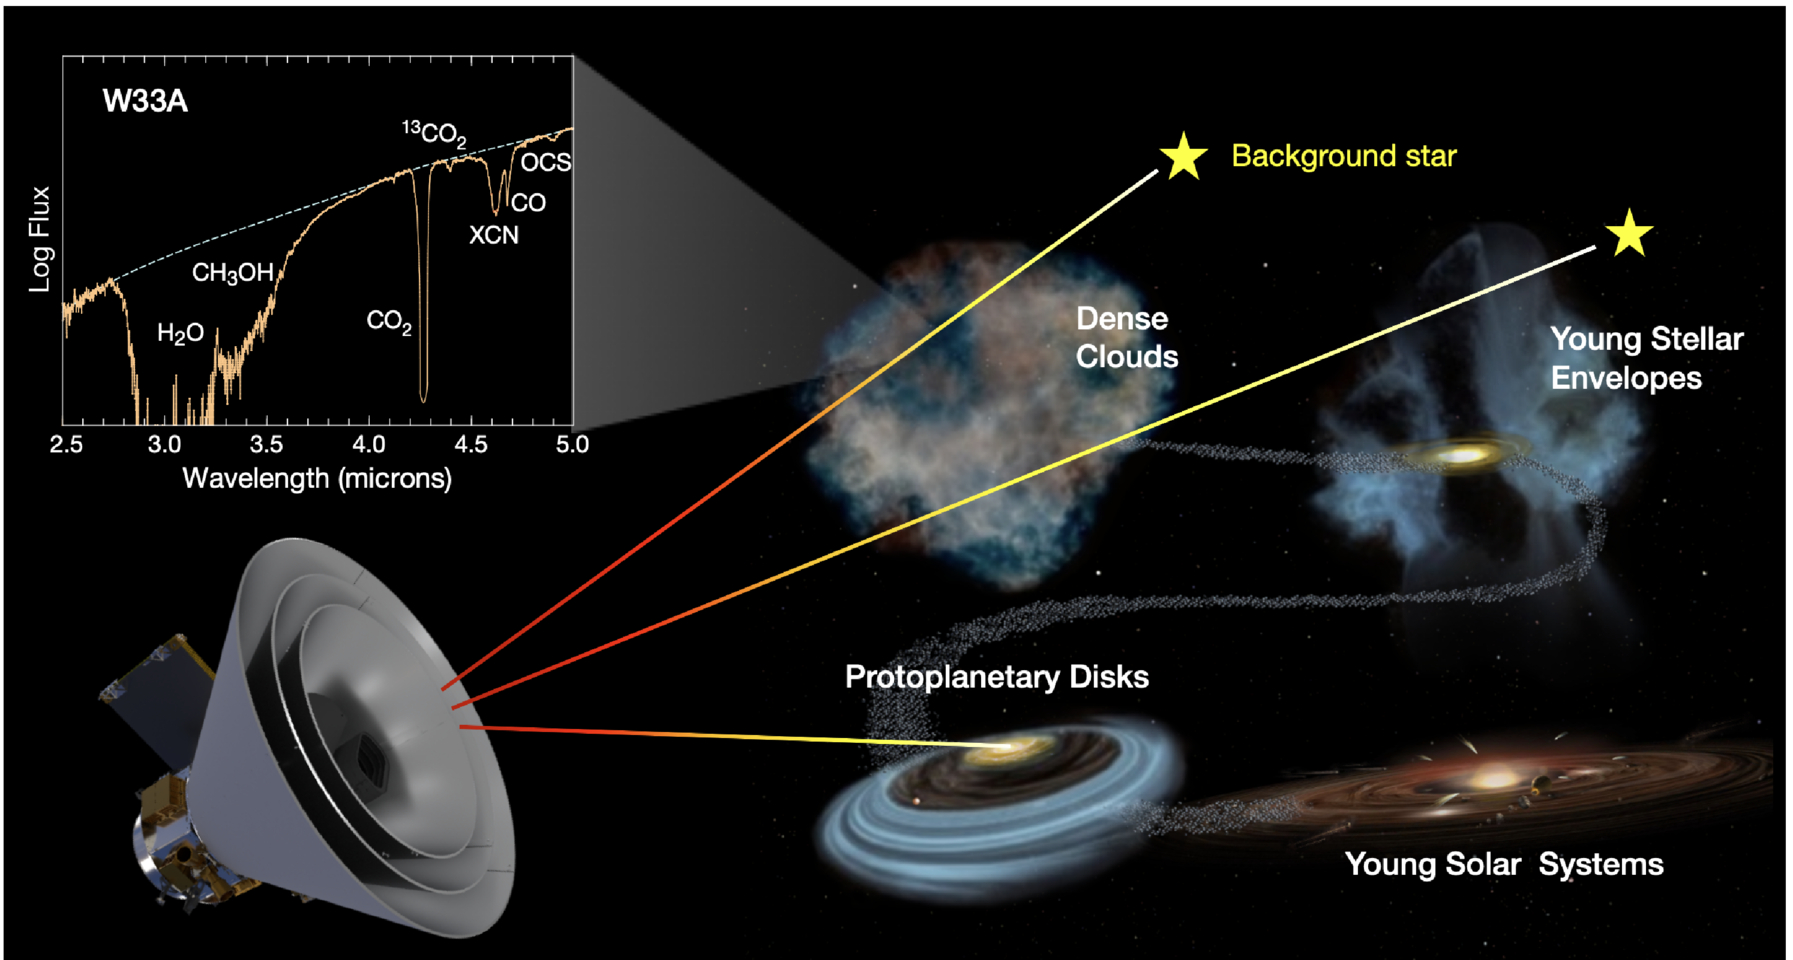
Figure 1: Examples of the sources SPHEREx will look at to search for biogenic ice species. In the top left, what the spectra of these sources will look like if those species are present: each type of ice leaves a distinct fingerprint in an infrared spectrum. [Bock et al. 2026]
Goal #3: Your Noise Is SPHEREx’s Signal
SPHEREx will measure an infrared spectrum for every point in the sky — even those that don’t contain galaxies or stars that we can resolve. These points are instead dominated by diffuse extragalactic background light. This light comes from many different sources, including stars, dust, and quasars, from the early universe to the present day, all added together incoherently. For most telescopes, the extragalactic background light is just a frustrating source of noise. For SPHEREx, it’s a treasure trove. We can compare the properties of the extragalactic background light that SPHEREx measures (its spectrum and how it fluctuates across the sky) to theoretical predictions and see if we seem to be missing anything. SPHEREx’s very broad infrared spectra — capturing redshifted light from the very early universe — and total sky coverage are crucial for this purpose. For instance, the SPHEREx team will try to isolate emission from the first stars and galaxies, which ionized most of the gas in the universe in the epoch of reionization. By understanding this and other contributions to the extragalactic background light, we can test hypotheses about how galaxies form and evolve.
Making It Happen
Beyond inflation, ices, and extragalactic background light, SPHEREx’s all-sky infrared spectra will be invaluable for countless other science cases, like studying asteroids, characterizing the atmospheres of stars that host exoplanets, and even understanding the upper atmosphere of Earth, through which SPHEREx orbits.
But how can SPHEREx even make a spectrum for every point in the sky? An image of some part of the sky is fundamentally two-dimensional, and measuring how the brightness of every point changes with wavelength adds a third dimension. Astronomers have come up with many ways to solve this problem. Integral field spectroscopy approaches typically involve splitting an image into small regions or strips, then using a dispersive element like a prism or grating to make a spectrum of each region, and finally putting these spectra side by side on a camera. Figure 2 shows an example of this strategy, as well as what the final three-dimensional “datacube” looks like after processing.
This approach is fairly complicated, relying on fancy optics, a prism or grating, and oftentimes optical fibers. From Figure 2, note that you could also make the final “datacube” product if you simply took many images with narrow filters that let through different wavelengths of light. This takes to an extreme the approach astronomers use for spectral energy distribution fitting. Of course, this would require an exorbitant number of filters. Here, the SPHEREx team had a stroke of genius: instead of having many different filters, what if you had a filter where the transmitted wavelength changes linearly across the filter? Each row would let through a different wavelength. To get a full spectrum for all points in an image, you could take many exposures, moving the telescope slightly between each exposure so points in the image fall on different rows each time.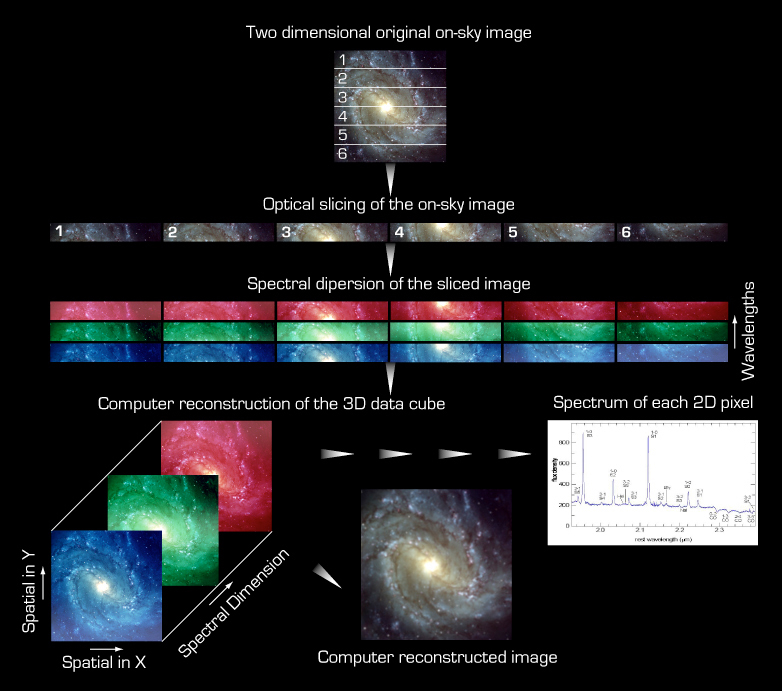
This is the SPHEREx survey strategy, with a few complications. First, before any filter, SPHEREx splits incoming light into two beams, with short-wave infrared light (SWIR, with 0.75 μm < λ < 2.42 μm) going in one direction and mid-wave infrared light (MWIR, 2.42 μm < λ < 5.00 μm) going in another. SPHEREx makes images with these two beams on different sets of detectors, so it can measure the brightness of an object at one SWIR wavelength and one MWIR wavelength simultaneously. The SPHEREx field of view covers 10.5° by 3.5°, with the SWIR and MWIR images each spread across three detectors. Every detector has a different linearly variable filter. To get a complete infrared spectrum of a given point in the sky, SPHEREx moves that point to 17 different positions on each detector. This requires 51 different telescope (17 × 3 detectors) pointings in all and yields 102 spectral values (51 × 2 for the SWIR and MWIR beams). Figure 3 shows the 17 bands on each of the six SPHEREx detectors, each corresponding to a different wavelength value.
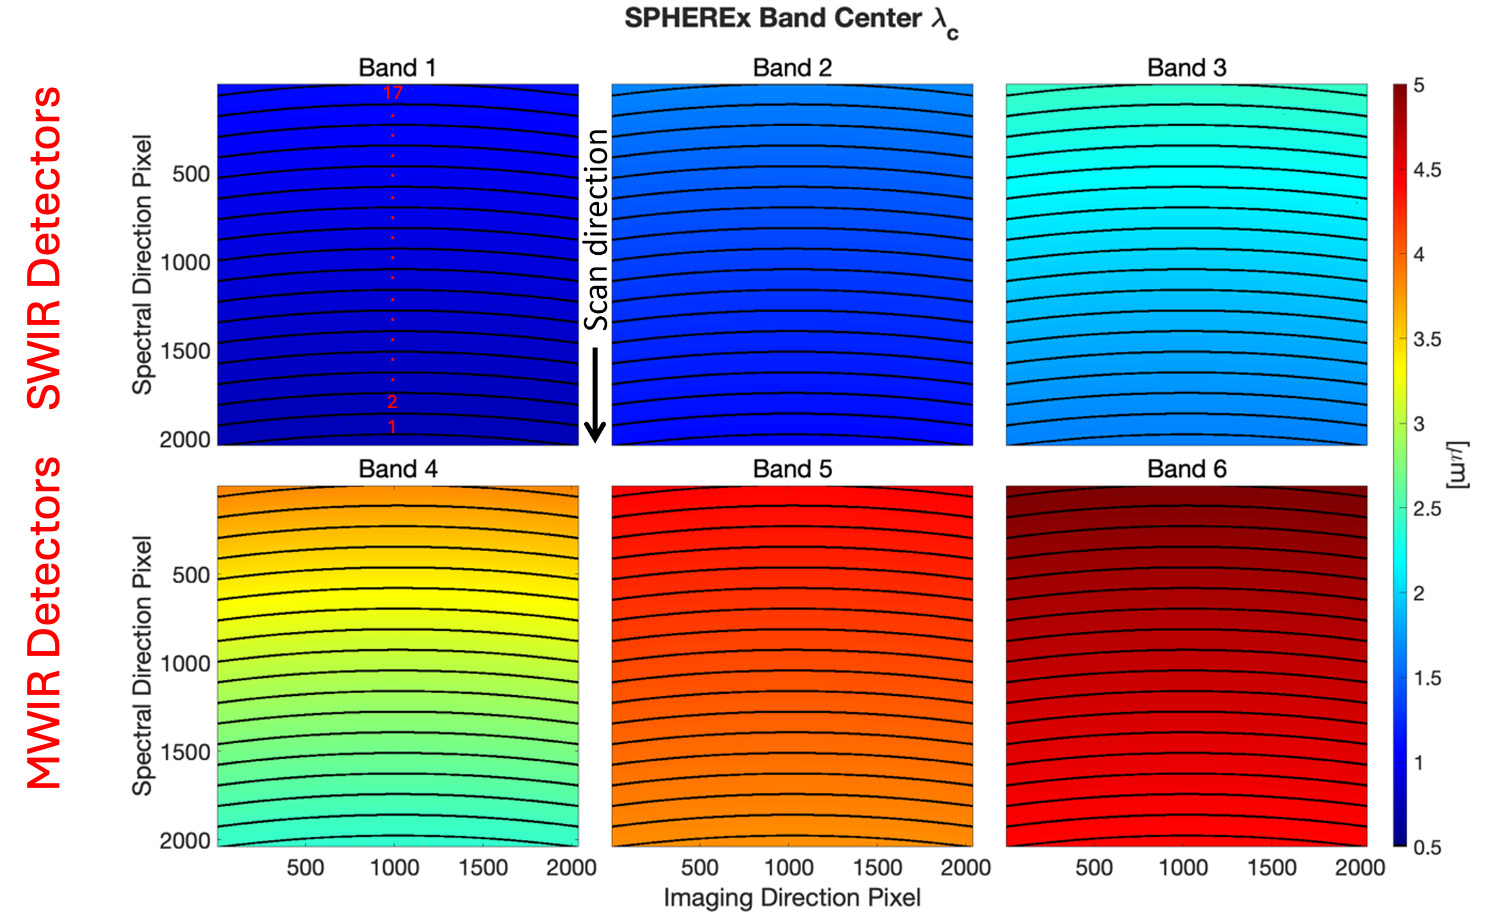
Figure 3: The wavelength of light that each part of each SPHEREx detector is sensitive to. A point in the sky is imaged on one short-wave infrared detector (top row) and one mid-wave infrared detector (bottom row) simultaneously. SPHEREx measures each point in the sky at 102 different wavelengths by placing the point at 17 different positions on each of the detectors. [Adapted from Bock et al. 2026]
Original astrobite edited by Veronika Dornan.
About the author, Chris Layden:
Chris is a PhD candidate in astrophysics at the Massachusetts Institute of Technology. His primary research interest is developing instrumentation that enables high-speed astronomical observations. With such instruments, he studies the most rapidly varying phenomena in the sky, including millisecond pulsars, accreting black holes, and solar system objects whizzing past background stars. Outside of astronomy, Chris enjoys reading classic novels, playing ultimate frisbee, and hanging out with his wife and dog.
The post SPHEREx: The Niftiest Space Telescope You May Not Have Heard Of appeared first on AAS Nova.
