❌

Normal view

The August 12 Total Solar Eclipse: Where to See It—and Why NASA Is Flying Through Its Shadow

8 August 2026 at 00:02

On Wednesday, August 12, the Moon’s shadow will sweep across a narrow stretch of the Northern Hemisphere. Greenland, Iceland, northern Russia, the Atlantic, Spain and a small corner of Portugal lie in the path of totality. Much of Europe, northwestern Africa, Canada and parts of the United States will see a partial eclipse. It is […]

The post The August 12 Total Solar Eclipse: Where to See It—and Why NASA Is Flying Through Its Shadow appeared first on Curiosmos.

Inouye Solar Telescope Discovers Hidden Plasma Vortices on Sun

7 August 2026 at 17:13
The highest-resolution image of the Sun’s surface (photosphere) ever captured, taken at 416 nm by the Inouye Solar Telescope; it reveals deformed boundaries of magnetic elements and ultra-fine scale stripes, both associated with Kelvin-Helmholtz instability. Image credit: NSF / NSO / AURA / MPS.

Astronomers using the 4-m Daniel K. Inouye Solar Telescope in Hawaii have detected tiny plasma vortices on the Sun’s surface (photosphere) for the first time, revealing a long-suspected process that could transport energy into the million-degree corona.

The post Inouye Solar Telescope Discovers Hidden Plasma Vortices on Sun appeared first on Sci.News: Breaking Science News.

Featured Image: Citizen Science and Solar Structure

3 August 2026 at 17:00

solar corona during a solar eclipse

During the 8 April 2024 solar eclipse, the path of totality swept across North America, dazzling millions of skygazers. Scattered along this path were 82 viewing sites of the Dynamic Eclipse Broadcast Initiative citizen science project, which aimed to observe the dynamics of the tenuous solar corona. Though poor weather dashed many observers’ hopes, the project managed to collect data at 11 sites spanning 2,700 kilometers, capturing 49 minutes of coronal behavior. The image above shows the solar corona as seen during totality from one of the DEB Initiative sites. In a recent research article, Matthew J. Penn (Southern Illinois University Carbondale; Tucson Amateur Astronomy Association) and collaborators described the results of the Initiative’s viewing efforts, including identification of downflows and outflows, plumes, coronal loops, and apparent motion of background stars. To learn more about these observations of the solar corona, be sure to check out the full article linked below.

Citation

“Structure and Dynamics of the Inner Corona Measured from the DEB Initiative 2024 Eclipse Image Sequence,” Matthew J Penn et al 2026 ApJL 1006 L25. doi:10.3847/2041-8213/ae8797

The post Featured Image: Citizen Science and Solar Structure appeared first on AAS Nova.

Edição especial do Apple I tem valor estimado de US$300 mil em leilão

24 July 2026 at 22:37

Um Apple I funcional, de 1977, entrou em leilão pela RR Auction. E o destaque vai para o seu valor estimado, de US$300 mil — os lances começam em US$10 mil.

Ele é um dos 50 modelos do segundo lote produzido pela Apple e está instalado em uma mala adaptada a partir de uma máquina de escrever Smith-Corona, sendo restaurado pelo especialista Corey Cohen, em junho, para funcionamento.

Apple I Neumark leiloado pela RR Auction
Divulgação/RR Auction

O modelo do leilão, “Neumark”, destaca-se por incluir mais do que a placa de circuito montada, a única coisa que os compradores do Apple I recebiam ao adquirir a máquina.

O item faz parte da segunda parte do “Steve Jobs & the Computer Revolution: The Apple 50th Anniversary Auction”, um leilão comemorativo que inclui objetos históricos da Apple, como um iPhone original lacrado, um protótipo do primeiro iPod — cada um podendo chegar a um valor de US$50 mil —, documentos como um cartão de visitas da Maçã assinado por Steve Jobs, um cheque da Apple assinado por ele (destinado a Elizabeth Holmes, primeira responsável pela contabilidade da empresa) e, ainda, itens pessoais do cofundador e ex-CEO 1Chief executive officer, ou diretor executivo. da Maçã.

Os lances poderão ser feitos até o dia 20 de agosto, às 18h (horário da Costa Leste dos Estados Unidos). Às 19h, entra em vigor a regra de prorrogação automática do leilão, que estende-o em intervalos de 30 minutos a partir do registro de novos lances.

via AppleInsider

Notas de rodapé

  • 1
    Chief executive officer, ou diretor executivo.

How Solar Flares Hint That They’re About to Happen

1 December 2025 at 17:00

Images of a solar flare at different wavelengths

Forecasting solar flares is one of the major challenges facing solar physicists today. New research finds that non-thermal emission can precede a solar flare by more than an hour, and this early emission may signal whether the flare will be accompanied by an explosion of plasma.

Flare Flavors

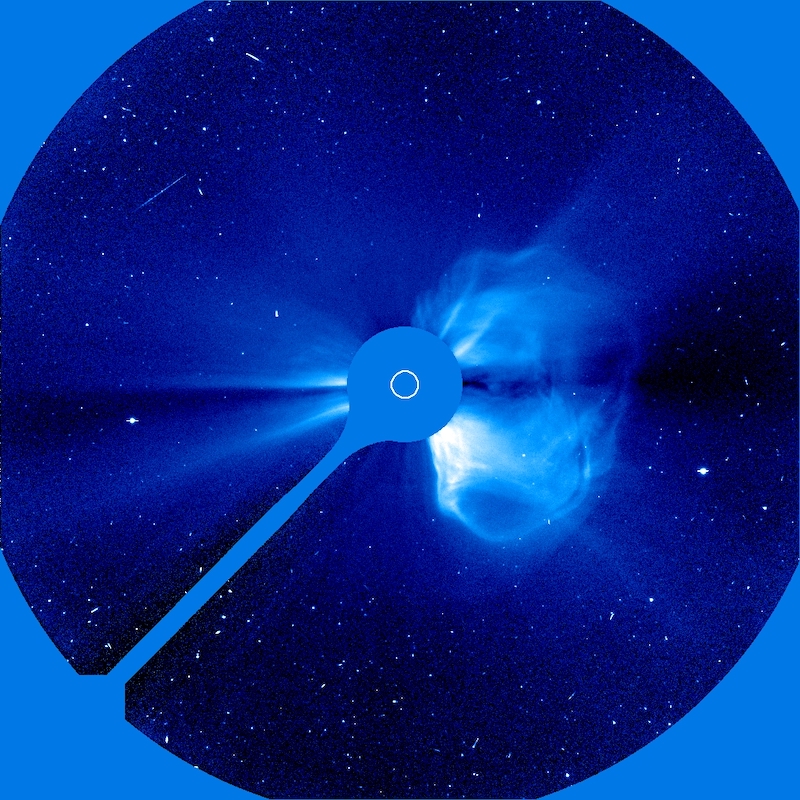
photograph of a coronal mass ejection

The Solar & Heliospheric Observatory (SOHO) took this coronagraphic image of a coronal mass ejection on 20 April 1998. [SOHO (ESA & NASA)]

Solar flares come in two basic flavors: eruptive and confined. Eruptive flares are accompanied by the launch of tangled clouds of plasma and magnetic fields called coronal mass ejections. Confined flares, so called because the solar plasma remains confined to the Sun, feature only a brief blast of high-energy radiation.

Both solar flares and coronal mass ejections can disrupt everyday life on Earth, with flares knocking out radio communications and coronal mass ejections threatening spacecraft electronics and power grids. Given these real-life risks, as well as the potential for probing the physics behind the activity on the Sun and other stars, it’s critical to be able to identify signs of upcoming flares.

Looking at the Lead-Up

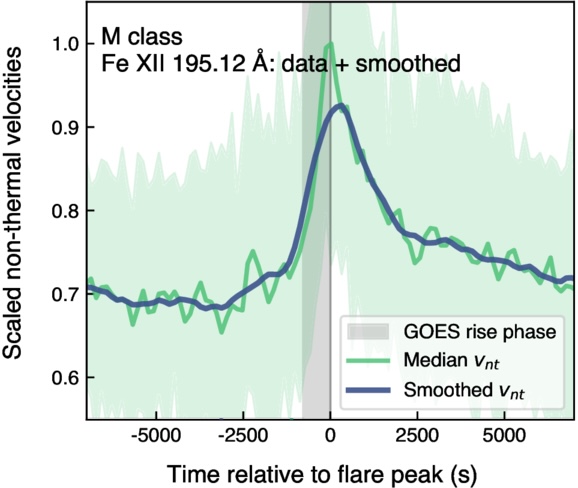
Luckily, there’s growing evidence that the Sun sends out subtle signals that a flare is soon to happen. One early sign of an impending flare is an increase in the non-thermal velocity of the plasma at the flare’s location. This phenomenon has been spotted in individual flares, but it hasn’t been studied and characterized for a large sample of flares — until now.

example of increasing non-thermal velocity before a solar flare

Demonstration of the increase in non-thermal velocity seen in an M-class flare compared to the onset and rise time of the soft X-ray flux (gray shaded area). [Adapted from To et al. 2025]

A recent research article led by Andy S. H. To (European Space Agency) takes the first systematic, large-scale approach to studying the non-thermal velocity changes that precede solar flares. The team amassed a sample of 1,449 solar flares that were seen by the Hinode spacecraft, the Geostationary Operational Environmental Satellite (GOES), and the Solar Dynamics Observatory (SDO). Hinode provided the spectral information needed to identify increases in the non-thermal velocity, GOES provided the flare start times, and SDO provided detailed information on the location and appearance of each flare.

Of the flares in the sample, 83% were moderately powerful C-class flares, 18% were stronger M-class flares, and 1% were the most powerful X-class flares. To’s team identified a clear trend across all types of flares: the non-thermal velocity increases 4–25 minutes before the flare’s X-ray emission begins to rise, peaks when the X-ray emission peaks, and decays as the flare decays. The team found some evidence that for smaller flares, the velocity increase begins in spectral lines that trace cooler plasma before spreading to lines probing hotter plasma, but more work is needed to confirm this trend.

More Details

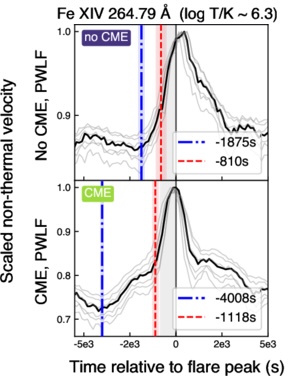
Examples of flares with and without coronal mass ejections

Examples of flares with and without coronal mass ejections. [Adapted from To et al. 2025]

Certain flares give even earlier hints of upcoming activity. M-class flares and some C-class flares exhibit what To’s team calls “precursor emission,” which emerges roughly 30–60 minutes before the flare’s X-ray emission peaks. The team also identified differences in precursor emission between confined and eruptive flares: eruptive flares display precursor emission over a broad range of spectral lines starting 45–74 minutes before the flare peaks, while confined flares show precursor emission later (31–54 minutes before peak) and in only a few spectral lines.

These results suggest that changes in the non-thermal velocity of solar plasma can not only signal when and where a flare is likely to arise, but also whether the flare will be accompanied by a potentially destructive coronal mass ejection. Upcoming missions like the Multi-slit Solar Explorer and SOLAR-C will give an even better view of the early stages of solar flares, helping to illuminate the physics behind them and enhancing our ability to forecast them.

Citation

“Systematic Nonthermal Velocity Increase Preceding Soft X-Ray Flare Onset: A Large-Scale Hinode/EIS Study,” Andy S. H. To et al 2025 ApJ 993 102. doi:10.3847/1538-4357/ae07de

The post How Solar Flares Hint That They’re About to Happen appeared first on AAS Nova.

❌