❌

Reading view

When Bright Spots Go Dark

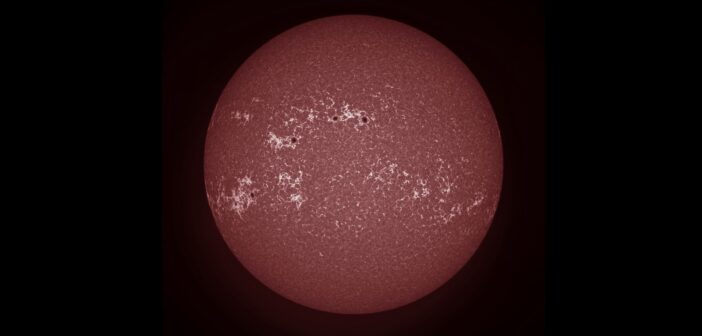
solar faculae and sunspots imaged at 1400 Angstroms

Light and dark regions speckle the Sun and other stars, complicating the interpretation of exoplanet transmission spectra. New modeling suggests that faculae — bright areas on the visible surface of the Sun — appear dark on cooler stars, adding a new wrinkle to this challenge.

Dark Spot, Bright Spot
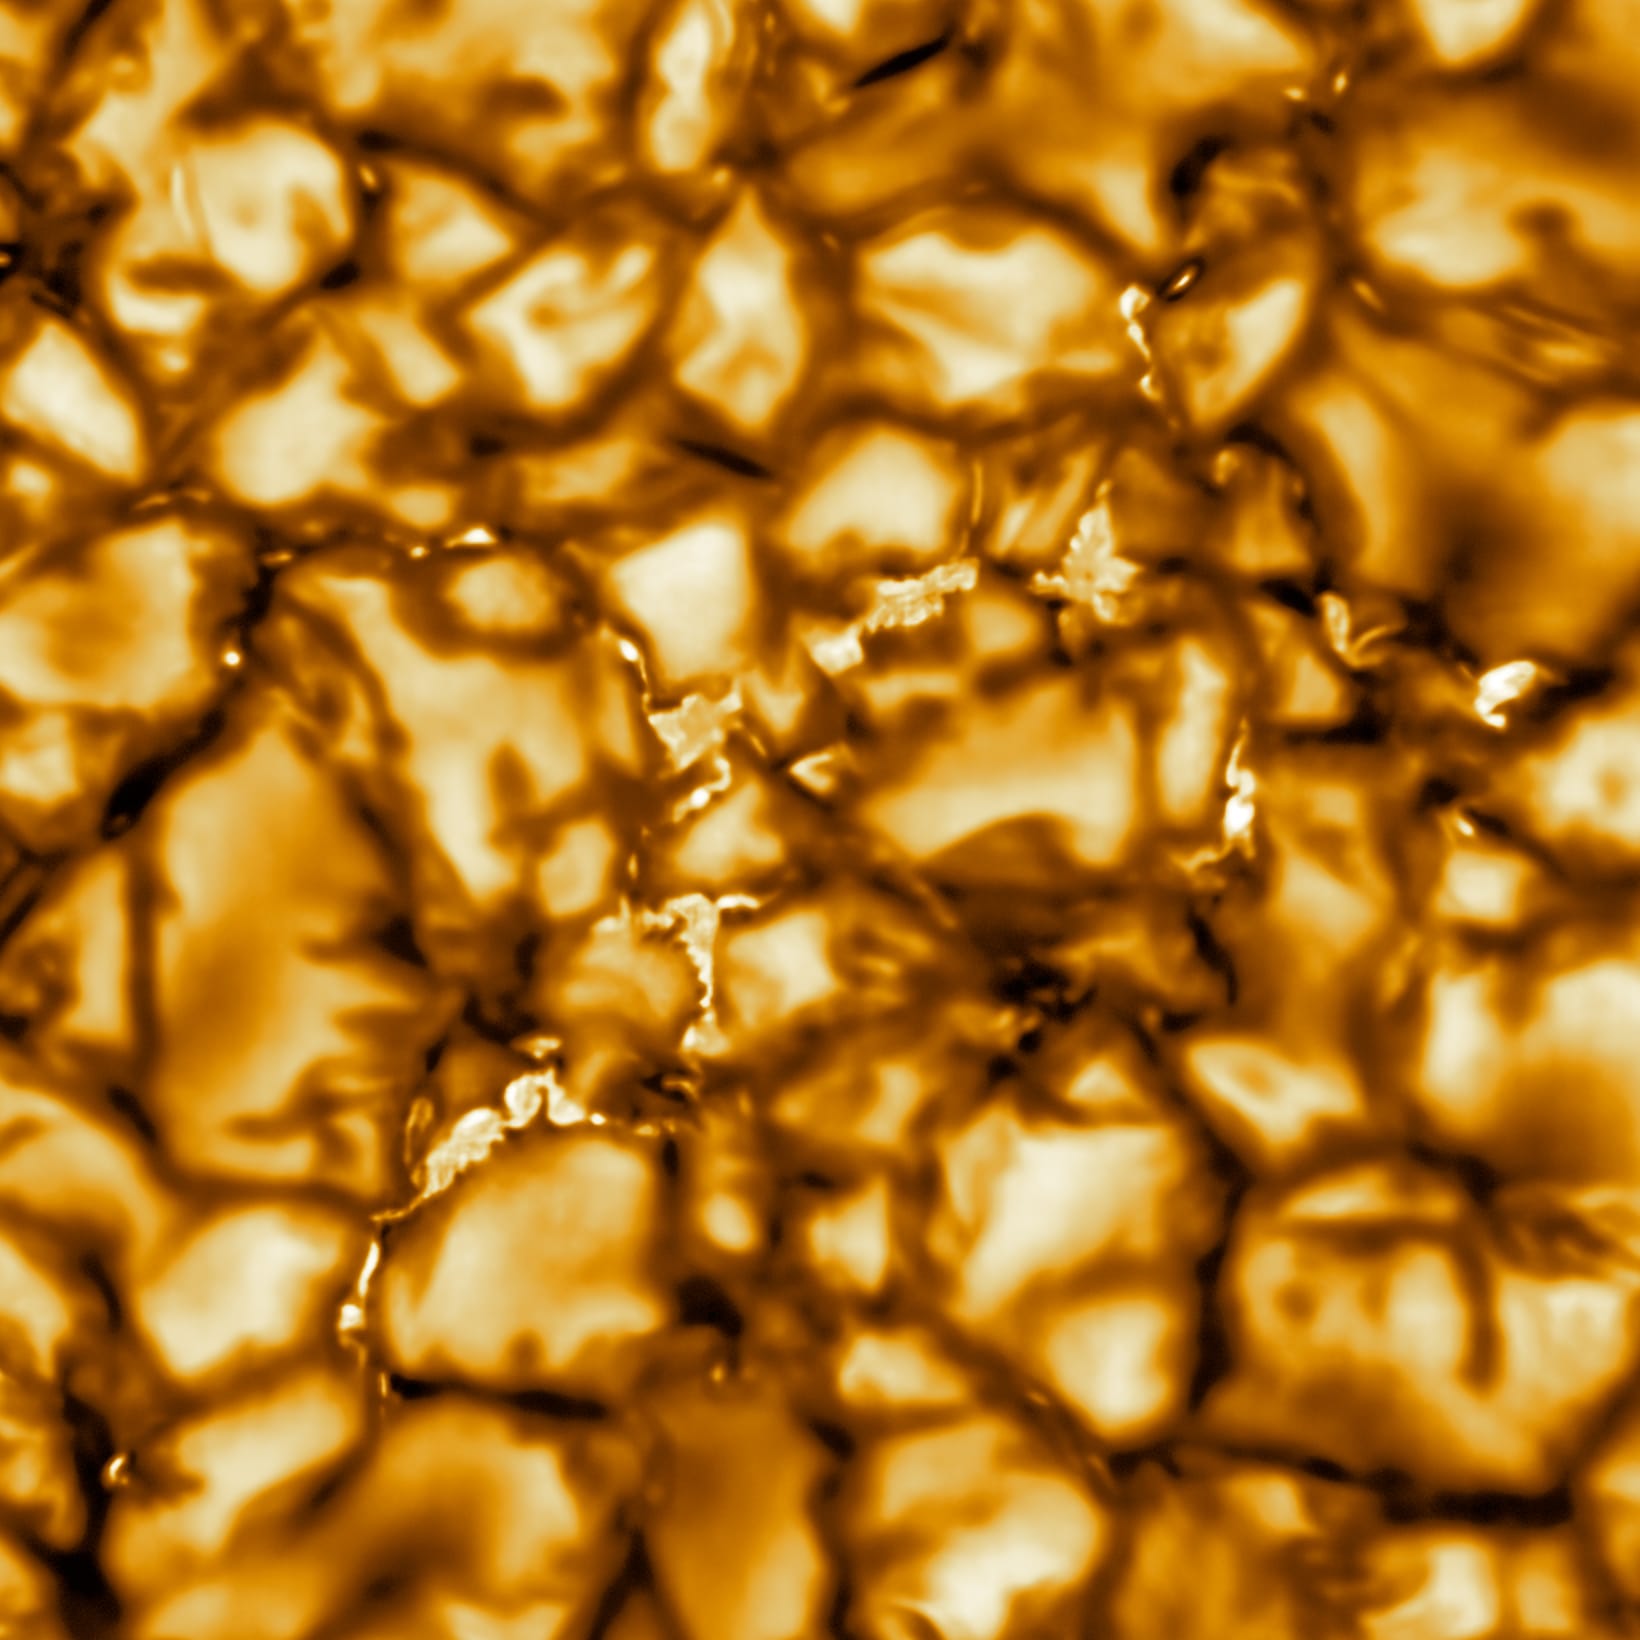
solar granules

This image from the Daniel K. Inouye Solar Telescope shows solar convective cells called granules. The bright points in the dark lanes between granules are regions of enhanced magnetic field strength. [NSO/AURA/NSF; CC BY 4.0]

It’s an adage as old as exoplanet science itself: know thy star, know thy planet. This recommendation is key when using transmission spectroscopy to tease out the components of an exoplanet’s atmosphere; the backdrop to this process is a rotating star dotted with ever-changing active regions, and the better the star’s behavior is understood, the more reliable the extracted spectrum becomes.

The Sun is freckled with dark spots — sunspots — as well as bright regions called faculae. Sunspots form where the Sun’s magnetic field bubbles up, creating pockets of cooler, less luminous plasma. Solar faculae form in regions of concentrated magnetic field, creating bright spots that line the dark crevasses between convective cells.

Other stars also have starspots and faculae, but thus far, astronomers have no direct observations of faculae on any star except the Sun. Out of necessity, researchers interpreting exoplanet spectra assume that faculae on other stars are similar to those on the Sun — but are they actually?

Would a Facula on Any Other Star Look as Bright?

To explore what faculae might look like on stars other than the Sun, Alexander Shapiro (University of Graz; Max Planck Institute for Solar System Research) and collaborators turned to three-dimensional radiative magnetohydrodynamics simulations and radiative transfer modeling. Their aim was to simulate the appearance and spectra of faculae on stars of spectral type G2, K2, M0, and M4 — from Sun-like to substantially smaller and cooler than the Sun.
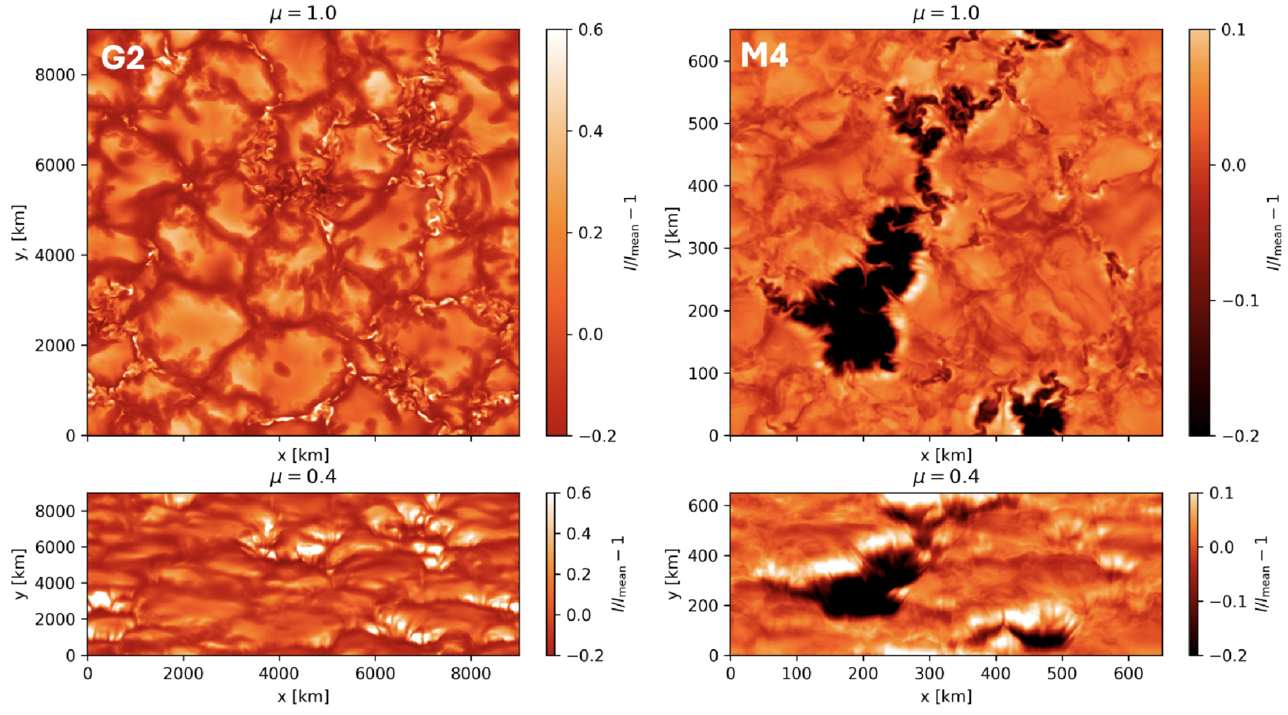
simulated faculae on a Sun-like star and a cooler M dwarf

Simulated faculae on a Sun-like star (left) and an M4 star (right). These images show the faculae at 600 nm. Click to enlarge. [Shapiro et al. 2026]

The modeled faculae on the Sun-like G2 star were bright, as expected. On the K2 and M0 star, these features were fainter, with the faculae on the M0 star being roughly as bright as the surrounding stellar surface. On the M4 star, the faculae were darker than surrounding areas, upending the assumption that faculae on all stars are brighter than the stellar surface.

Exoplanetary Effects

The transition from bright faculae on Sun-like stars to dark faculae on M4-class stars directly affects interpretations of exoplanet transmission spectra. The existence of dark faculae increases the derived exoplanet radius, whereas bright faculae on Sun-like stars decrease the derived radius. The contamination due to the faculae is wavelength dependent, with the largest contamination occurring at shorter wavelengths. This contamination, if not fully accounted for, can mimic spectral features from an exoplanet’s atmosphere.
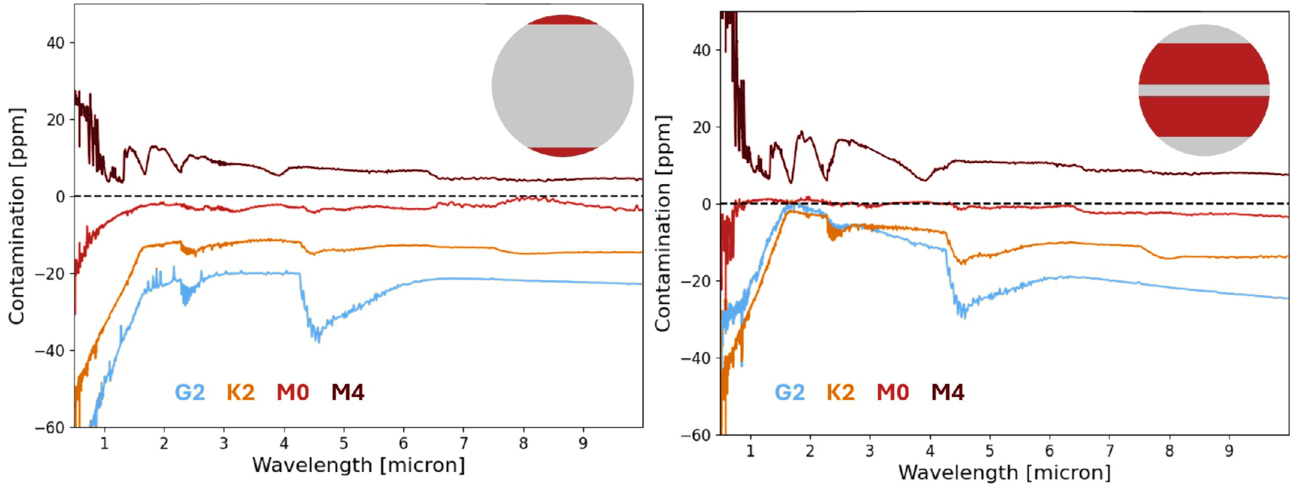
plot of spectral contamination due to faculae

Contamination of transmission spectra by faculae near a star’s poles (left) and closer to the star’s equator (right). Faculae are bright for the simulated G2, K2, and M0 stars, and they are dark on the simulated M4 star. Click to enlarge. [Shapiro et al. 2026]

What determines whether faculae appear brighter or darker than their surroundings? Using a qualitative framework, Shapiro and coauthors found that the appearance of faculae can be traced to a few competing factors: the strong magnetic fields within faculae prevent the incursion of hotter material (making the spots appear darker), while the magnetic field lowers the opacity of the gas in that region, allowing us to peer deeper and glimpse hotter material (making the spots appear brighter). On cooler stars, effects related to higher surface gas pressure tilt the balance in favor of darker faculae.

Citation

“The Curious Case of Dark Faculae on M Dwarf Stars,” A. I. Shapiro et al 2026 ApJ 1008 24. doi:10.3847/1538-4357/ae7105

The post When Bright Spots Go Dark appeared first on AAS Nova.
  •  

Complexities and Mysteries in the Atmosphere of Ultra-Hot Jupiter WASP-121b

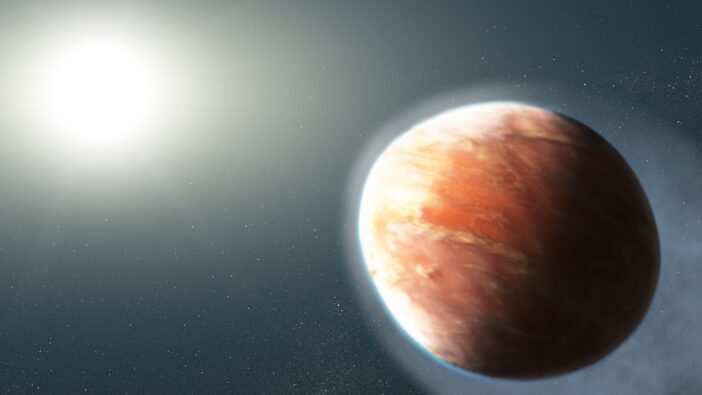
illustration of WASP-121b

Ultra-hot Jupiter WASP-121b is once again puzzling astronomers. New JWST observations have revealed aspects of this superheated planet’s atmosphere that models cannot yet explain.

An Extreme Planet

Among the more than 6,000 known exoplanets, there are many types of worlds that aren’t represented in our solar system. The most exotic and unfamiliar planets might be the ultra-hot Jupiters: giant planets nestled so close to their host stars that they are tidally locked, with temperatures on their permanently starlit sides climbing to thousands of degrees.

WASP-121b, which circles its F-dwarf host star every 30.5 hours, is one of the best-studied ultra-hot Jupiters. Previous work has started to reveal the complexity of its atmosphere, and now, data from JWST have opened a new window onto WASP-121b’s behavior.

New View from JWST

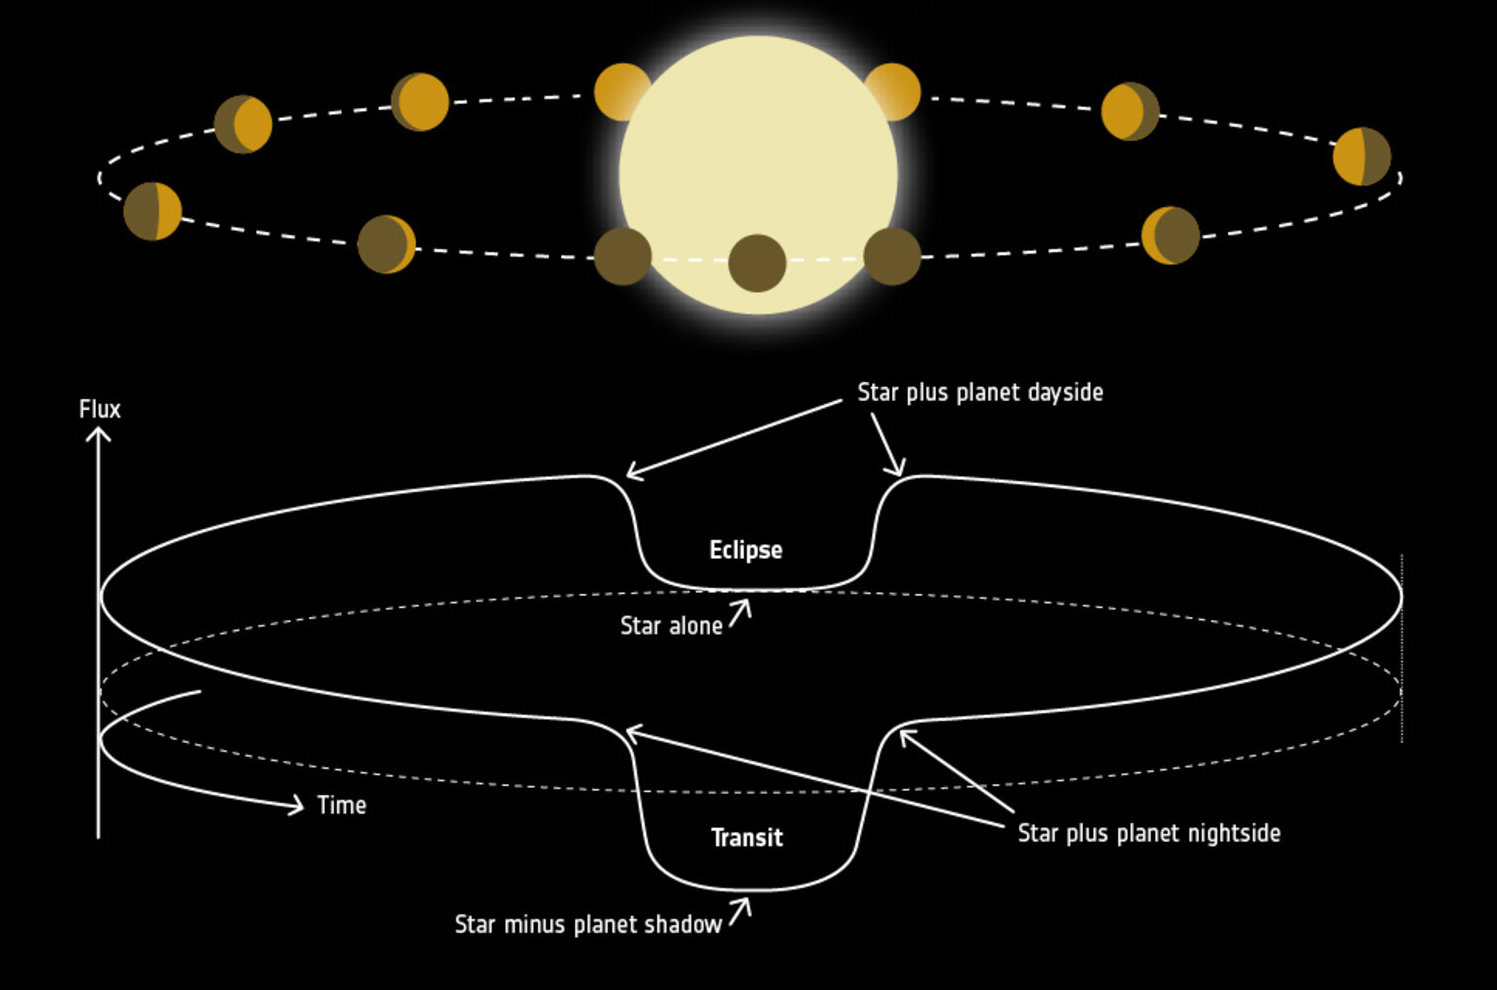
representation of an exoplanet's phase curve

A representation of an exoplanet’s phase curve. Click to enlarge. [ESA]

To learn more about WASP-121b’s atmosphere, Robert C. Frazier (University of Michigan) and collaborators analyzed JWST Near Infrared Imager and Slitless Spectrograph (NIRISS) observations covering more than one full orbit of the planet. These observations allowed them to construct the system’s phase curve, which describes the total amount of emitted and reflected light from the planet and its host star over an entire orbit.

The team used two 3D general circulation models to predict the planet’s atmospheric structure and extract synthetic spectra and phase curves to compare against the JWST observations. Using nine model configurations in total, the team varied several inputs, including sources of atmospheric opacity, sources of atmospheric drag, and assumptions about whether clouds are able to form on the planet’s cooler nightside.

Left with a Mystery

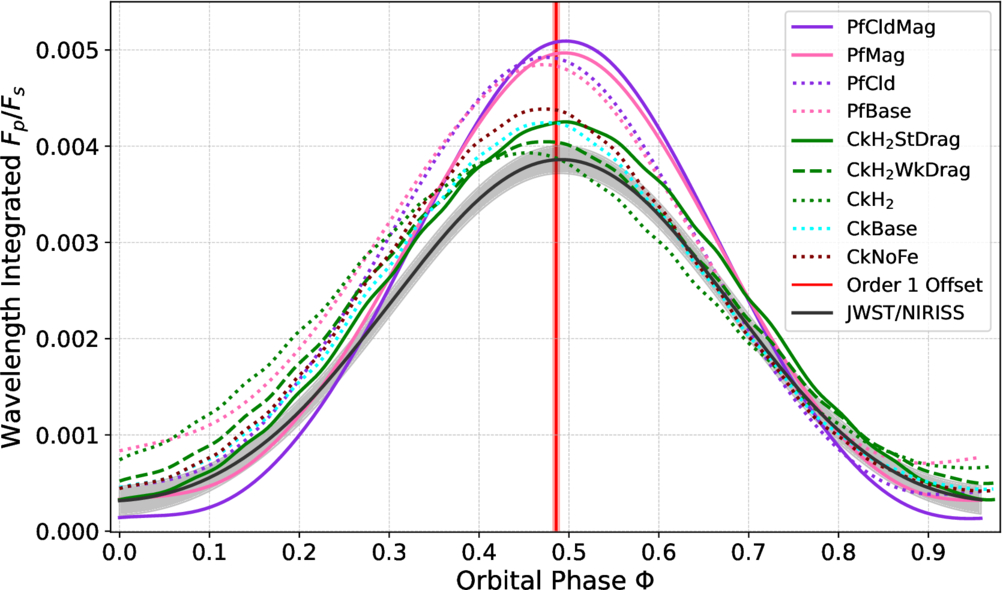
Frazier and collaborators found two aspects of WASP-121b’s phase curve that their models couldn’t explain: the planet emits less light overall than predicted, and the location of its phase-curve offset changes with wavelength.

phase curve of WASP-121b

Modeled phase curves, shown as the flux of the planet divided by the flux of the star, for WASP-121b (colored solid and dotted lines) compared to the best fit to the JWST observations (black line). Click to enlarge. [Frazier et al. 2026]

The models predict, on average, 12–15% more emission from the planet than observed. This discrepancy might be traced back to how the planet’s radius is determined, which is a simple-sounding task that can be deceptively difficult; WASP-121b isn’t perfectly spherical, and its emitting area changes with wavelength, making it challenging to normalize the planet’s radius for use in models.

The phase-curve offset is the difference between a planet’s sub-stellar point (where the star is directly overhead) and the brightest point in the planet’s atmosphere. In general, some degree of offset is expected because planetary winds tend to whisk heat away from the sub-stellar point, placing the brightest point somewhere to the east (usually). For WASP-121b, the offset is unexpectedly small — suggesting a source of drag in the atmosphere that prevents winds from transporting heat away from the sub-stellar point — and it’s larger at shorter wavelengths. This wavelength dependence isn’t predicted by any of the models, and it’s not clear what causes it.

These results demonstrate something remarkable: that our observations of a planet nearly 900 light-years away have become so precise that they’re pushing our already complex models to include more physics — an exceptionally exciting motivation for model improvement!

Citation

“The Days Drag On on WASP-121 b: Interpreting Its NIRISS Spectroscopic Phase Curve with General Circulation Models,” Robert C. Frazier et al 2026 ApJ 1004 102. doi:10.3847/1538-4357/ae69ca

The post Complexities and Mysteries in the Atmosphere of Ultra-Hot Jupiter WASP-121b appeared first on AAS Nova.

  •  
❌