❌

Reading view

An Impostor Explosion

A rendering of two purple jets streaming away from a central explosion.

Over many centuries of observing the night sky, astronomers have found only a single visible afterglow of a collision between neutron stars. For a few days in the summer of 2025, it seemed like observers may have found another of these treasured but elusive prizes; unfortunately, the promising candidate turned out to be a supernova in disguise.

A Rare Prize

kilonova as seen by Hubble

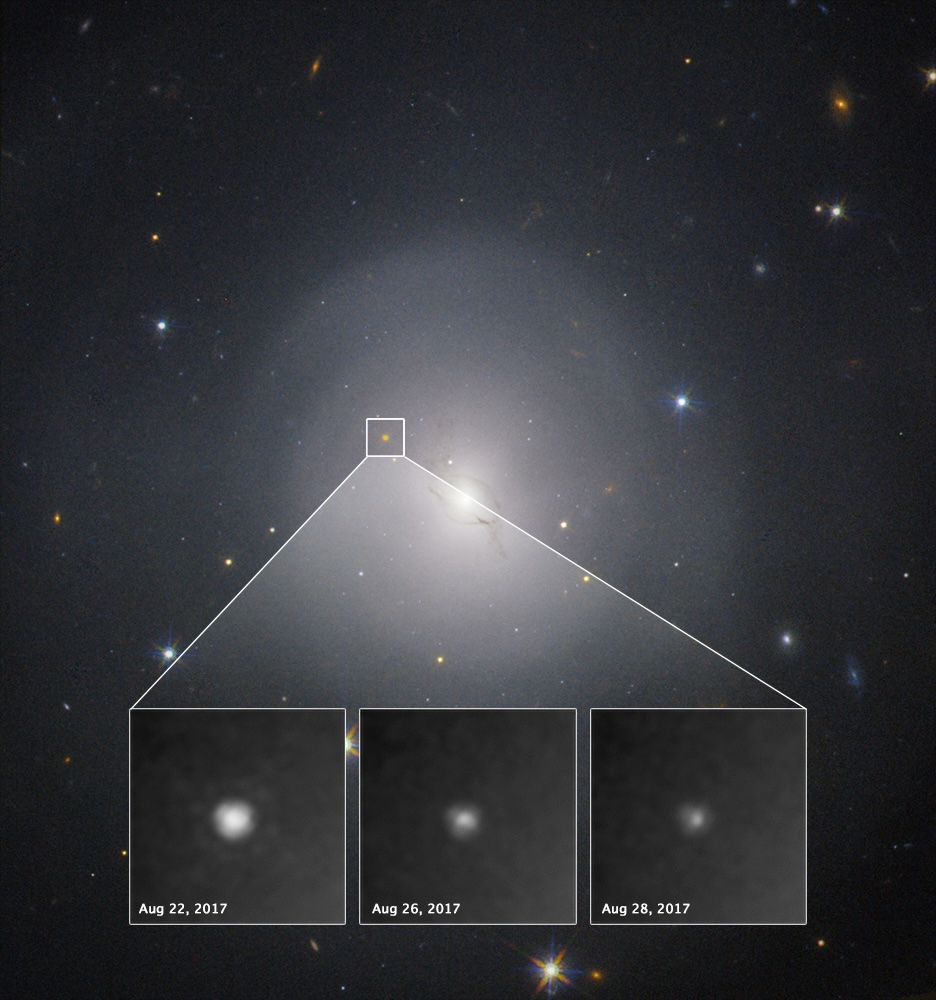
These images from the Hubble Space Telescope show the fading light of the kilonova associated with the gravitational wave event GW170817. [NASA and ESA Acknowledgment: A. Levan (U. Warwick), N. Tanvir (U. Leicester), and A. Fruchter and O. Fox (STScI)]

When two neutron stars (the ultra-dense remnants of massive stellar explosions) spiral together and collide, the cataclysm is energetic enough to release strong gravitational waves, forge heavy elements, and briefly glow across the electromagnetic spectrum. These events are called kilonovae, and they’re quite rare; while we may have detected a handful at high energies, there is only one event for which astronomers managed to record both gravitational waves and an optical transient.

That one kilonova, found back in 2017, taught astronomers much about how heavy elements are formed and left the scientific community hungry for more data. Since then, each time a gravitational wave detector like LIGO reports that it may have spotted a neutron star merger, telescopes across the world scramble to look in the probable region of the sky, hoping to find the short-lived electromagnetic counterpart.

Too Good to Be True

On 18 August 2025, the LIGO/Virgo/KAGRA collaboration sent out an alert that it may have detected a neutron star–neutron star merger. The odds that their signal was real weren’t great, and the researchers gave it just a 29% chance of being a genuine astrophysical signal. Still, given the potential payoff of finding the next kilonova, several telescopes quickly began searches for the optical counterpart. The gravitational wave signal suggested that the event likely came from a curved patch of sky delightfully referred to as the “northern banana,” and after trawling that region for a few nights, astronomers hauled in 47 new transients. Any one of these could have been the kilonova, and all of them received extensive follow-up observations.

A team led by James Gillanders (University of Oxford) recently summarized some of these follow-up observations carried out with the Pan-STARRS and ATLAS telescopes. In the initial exciting few days after the alert went out, one candidate transient stood out as the most promising. Named AT2025ulz, it was first spotted by the Zwicky Transient Facility and initially started fading rapidly and changing colors, just as models of kilonovae predict. For four days, it seemed like the world may have witnessed its second-ever kilonova. But then the telescopes began their fifth night of observations.

Supernova Unmasked

A scatter plot showing a rapidly fading, then reversing and spiking, light curve.

The light curve of SN2025ulz. Note that the source appeared to grow brighter again after about 5 days. Click to enlarge. [Gillanders et al. 2025]

The light curve of AT2025ulz, after fading steadily in the preceding days, suddenly turned upwards; in other words, whatever was causing the transient got brighter. Models of kilonova evolution predict no such brightening, but Type IIb supernovae are known to follow just this behavior. AT2025ulz showed itself to be another run-of-the-mill stellar explosion, not the sought-after fireworks of two neutron stars slamming together.

Frustrating as this particular result may be, the effort was far from wasted. The team could use their non-detection of the true kilonova to place limits on its timing and peak magnitude, assuming it existed in the first place. And, as gravitational wave detectors grow more sensitive and alerts like this more common, hindsight will likely frame this scramble as a dress rehearsal for an ultimately successful kilonova recovery effort. Until then, astronomers will keep searching, and will keep their guard up against cosmic impostors.

Citation

“Pan-STARRS Follow-Up of the Gravitational-Wave Event S250818k and the Light Curve of SN2025ulz,” J. H. Gillanders et al 2025 ApJL 995 L27. doi:10.3847/2041-8213/ae2125

The post An Impostor Explosion appeared first on AAS Nova.

  •  

Ia’m Just Getting Started: A Type Ia Supernova’s First Day

G299.2-2.9

Editor’s Note: Astrobites is a graduate-student-run organization that digests astrophysical literature for undergraduate students. As part of the partnership between the AAS and astrobites, we occasionally repost astrobites content here at AAS Nova. We hope you enjoy this post from astrobites; the original can be viewed at astrobites.org.

Title: The First Day of a Type Ia Supernova from a Double-Degenerate Binary
Authors: Gabriel Kumar, Logan J. Prust, and Lars Bildsten
First Author’s Institution: University of California, Santa Barbara
Status: Published in ApJ

Much like distance markers along the highway, Type Ia supernovae have long been used as distance indicators in space. These supernovae were originally theorized to form in binary systems. In this system, a white dwarf (a dense, collapsed remnant of a star) steals surface material from a non-degenerate star like our Sun and then explodes. Because of the initial conditions and properties of those two stars, the explosion would shine with the same intrinsic brightness regardless of the binary system’s location in space.

Research and observations, however, show that this is not entirely true; not all Type Ia supernovae are equally luminous. There are various theories regarding the different formation scenarios and explosion mechanisms that might create a Type Ia supernova. Developing ways to sleuth out the origins of these systems can be useful because it may tell us more about their luminosity.

One emerging theory of formation is the “double-detonation scenario.” In this case, two white dwarfs exist in a binary system. The more massive primary (the “accretor”) steals material from the less massive white dwarf secondary (the “donor”). After the primary steals the donor’s outer thin shell of helium, the helium surrounding the accretor detonates. This explosion induces a shock wave that travels into the dense core of the accretor and causes another detonation. The two detonations — one on the surface and one in the core — produce enough energy to explode the star into a supernova, a powerful stellar explosion. When the material from the exploding star reaches its companion star, it forms a mysterious, conical wake within the gaseous material, or “ejecta,” expelled from the accretor. This wake might be an important clue for distinguishing a supernova’s origins.

Since these explosions are incredibly powerful and would be difficult (and dangerous!) to perform in a lab, astronomers turn to computer simulations to model these events. Hydrodynamical simulations, in particular, are helpful for researchers because they model how fluids “flow” by solving complex equations that are too tricky to do by hand. (Remember that stars are just balls of gas, and hence fluid!) The authors of today’s article ran hydrodynamical simulations of the explosion and subsequent evolution of the ejecta from a double-detonation scenario.

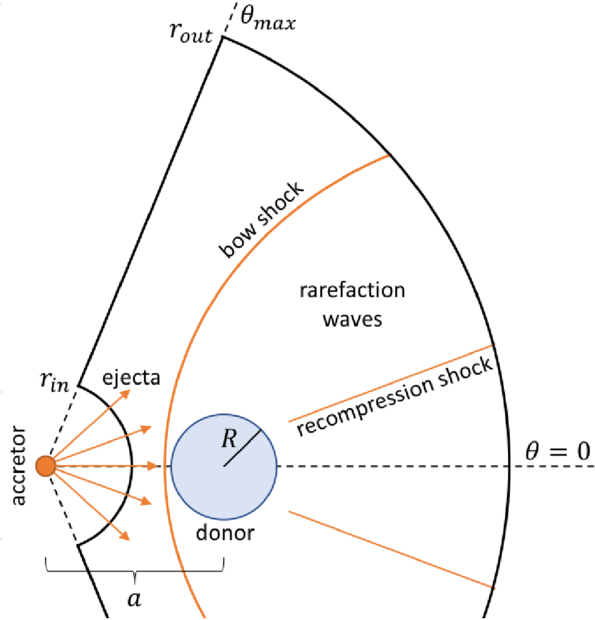
In the diagram of the team’s setup (see Fig. 1), you can see a “bow shock.” This shock is from the wave produced in the accretor’s detonation and is bowed since it bends around the donor star. This shock moves quickly through the cone of ejecta, modifies its structure, and leaves clues within the ejecta as it settles.

schematic of the simulation setup

Figure 1: A visual schematic of the simulation setup. The accretor is the exploding star, which produces a “bow shock” from the detonation. The bow shock and recompression shock modify the structure of the ejecta, which fills the space between rout and rin. The ejecta is full of gaseous stellar material. [Kumar et al. 2025]

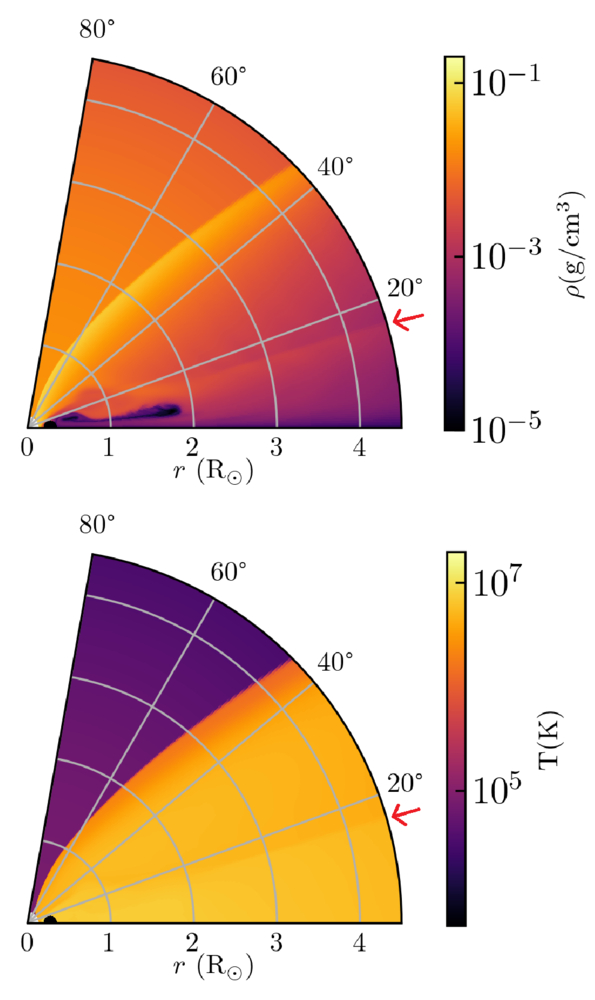
After simulating 1,000 seconds after the explosion, the authors recreated a high-density, low-temperature “wake” from the shock. You can see imprints of this wake in Fig. 2, as denoted by the red arrow.
visual slice of the simulated ejecta

Figure 2: A visual “slice” of the ejecta surrounding the donor star just 200 seconds after detonation. The bottom-left corner (r = 0) has a faint white spot, indicating the donor. The density (top) and temperature (bottom) of the ejecta are shown. The faint line marked by the red arrow indicates the secondary shock from the explosion, highlighting changes in both density and pressure. [Kumar et al. 2025]

Once they were able to produce this wake, the authors evolved the ejecta over time to see what the radiation from this material might reveal. They discovered that the “shocked,” or compressed and heated, ejecta flew out much further than the unshocked ejecta (see Fig. 3).
simulation snapshot at 2 hours of simulation time

Figure 3: A slice of the simulation taken later, at 2 hours of simulation time. The ejecta in the shocked region has flown out farther than the ejecta in the unshocked region. Note that the horizontal scale has changed from Figure 2. [Kumar et al. 2025]

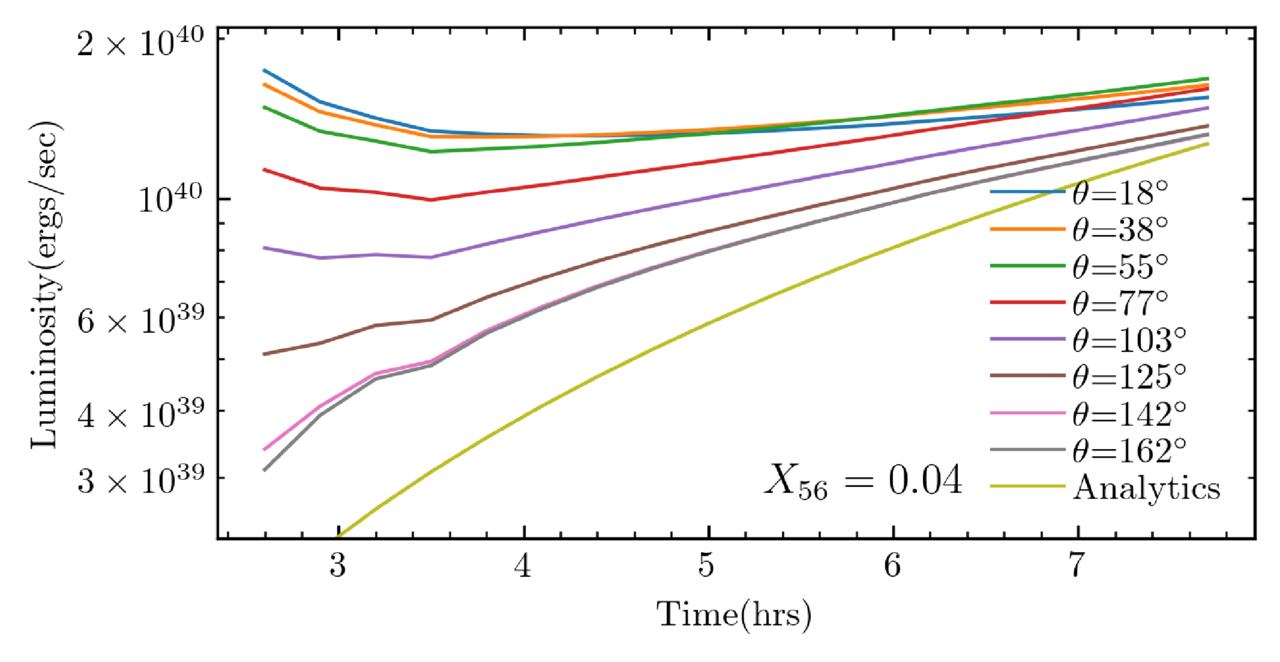
This ejecta can be seen from different viewing angles, influencing an observer’s measurement of the explosion’s luminosity. The strongest features of the wake are visible up to about 55 degrees, while some effects can still be seen up to about 140 degrees — almost half of the sky (see Fig. 4). Overall, an observer’s position relative to the explosion axis might change their reported luminosity of the explosion. The authors estimate that this wake might cause Type Ia supernovae from a “double-detonation” scenario to appear up to 15% fainter, depending on the observer’s viewing angle. Therefore, if scientists use Type Ia supernovae as cosmic distance indicators, their calibrations might be slightly off. This isn’t the best news for those using measurements of Type Ia supernovae to measure the expansion rate of the universe.
plot of luminosity versus time after detonation of a supernova

Figure 4: A comparison of luminosity vs. time over the course of 6 hours shortly after detonation. The different lines indicate different viewing angles from the axis of explosion. The line “Analytics” describes a light-curve prediction by Piro (2012) for a supernova that was not shock-heated. The luminosities for this model span almost one order of magnitude. [Kumar et al. 2025]

We’ve talked a lot about the accretor and ejecta in this scenario, but what might happen to the donor star? One idea is that the donor star is “kicked” away by the high velocity of the blast. In this simulation, the authors were able to calculate a “kick” velocity, or speed imparted by the blast to the donor star, that was much higher than estimates from other detonation models. One observed Type Ia supernova, SN 2021aefx, is believed to have the fastest observed ejecta to date. The mechanism that today’s authors modeled might explain how the ejecta of this event got its super-fast “kick.”

While there is always more work to be done, this work presents a first step at identifying double-detonation Type Ia supernovae from early observations. With an influx of observations from new observatories, like the Vera C. Rubin Observatory, we should expect to see many more early supernova detections.

Original astrobite edited by Ansh Gupta.

About the author, Mckenzie Ferrari:

I’m currently a PhD student in the geophysical sciences program at the University of Chicago. While I now study the atmosphere and oceans of Earth, most of my previous research focused on simulations of Type Ia supernovae and galaxy formation and evolution. In my free time, I foster cats for a local organization, enjoy cooking, and can often be found running along Lake Michigan.

The post Ia’m Just Getting Started: A Type Ia Supernova’s First Day appeared first on AAS Nova.

  •  

Selections from 2025: A Search for Gravitational Waves from SN 2023ixf

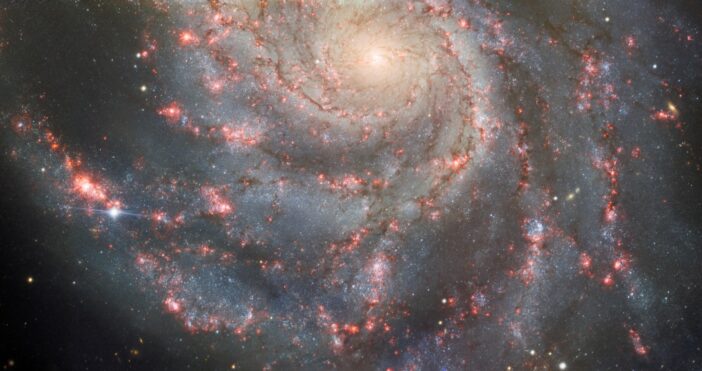
Messier 101 and SN 2023ixf

Editor’s Note: For the remainder of 2025, we’ll be looking at a few selections that we haven’t yet discussed on AAS Nova from among the most-downloaded articles published in AAS journals this year. The usual posting schedule will resume January 2nd.

Search for Gravitational Waves Emitted from SN 2023ixf

Published May 2025

Main takeaway:

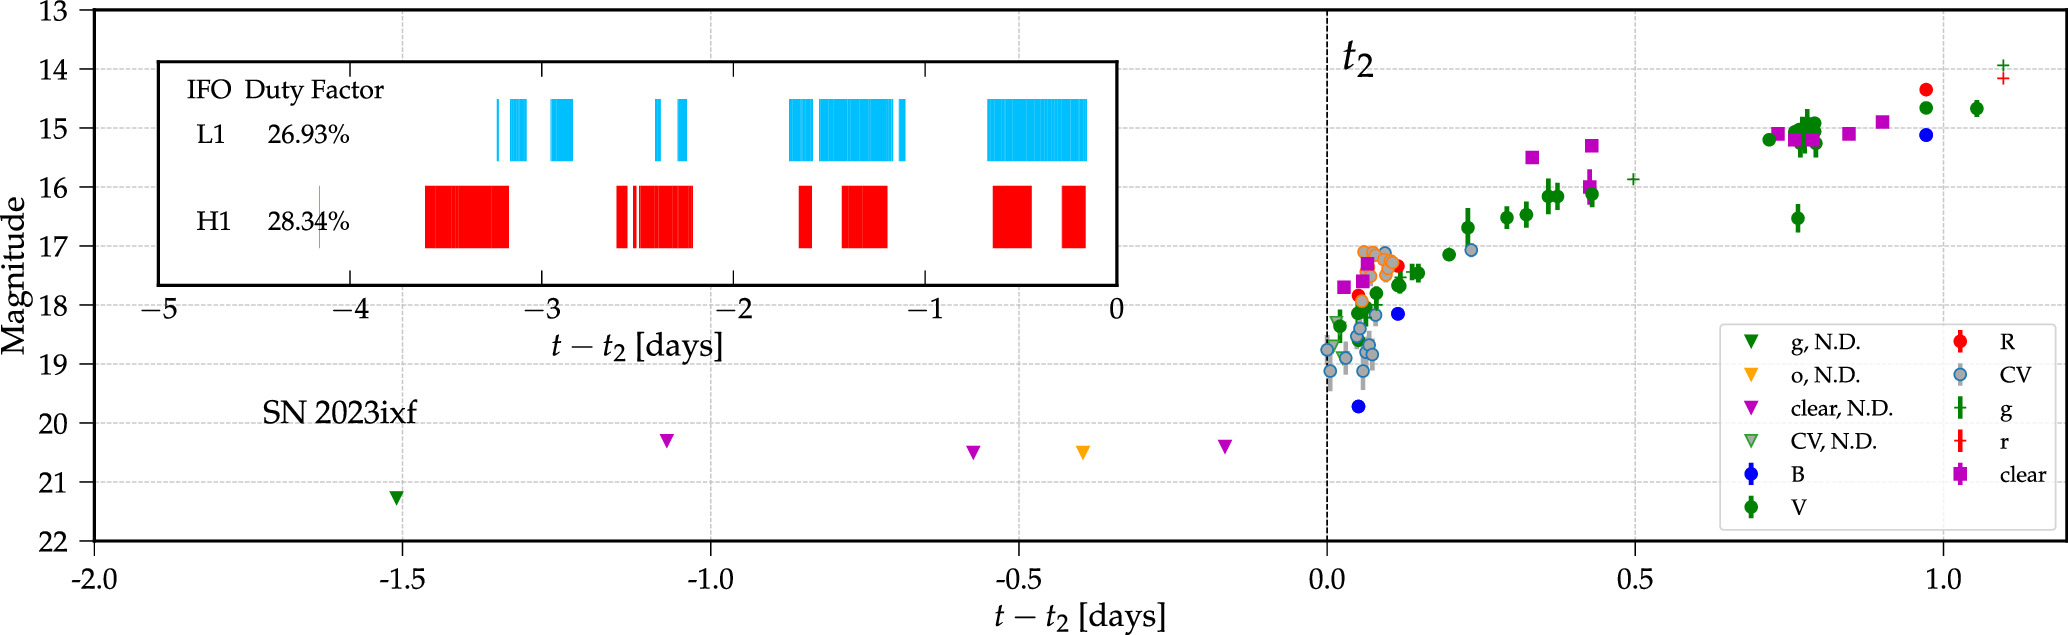
The LIGO, Virgo, and KAGRA collaborations searched for gravitational waves from the core-collapse supernova SN 2023ixf. Though no significant gravitational wave events were detected during times when two or more gravitational wave detectors were online, the non-detection of gravitational waves from this nearby supernova places constraints on the amount of energy emitted by the explosion in the form of gravitational waves, the shape of the proto-neutron star produced in the collapse, and more.

Why it’s interesting:

When a massive star expires in a core-collapse supernova, the collapse of the stellar core into a neutron star or black hole produces gravitational waves. These gravitational waves, along with a stream of neutrinos, should arrive at Earth before the light from the explosion does; gravitational waves and neutrinos can easily escape the dense, roiling ejecta from the explosion, but photons take some time to claw their way through the debris. Gravitational waves from a supernova have never been detected, but the nearby supernova SN 2023ixf, which occurred in a galaxy about 20 million light-years away, offered the best recent opportunity to detect these waves.

photometric evolution of SN 2023ixf and gravitational wave coverage of the event

Photometric evolution of SN 2023ixf in its early days and gravitational wave coverage leading up to the supernova’s discovery (inset image). [LIGO-Virgo-KAGRA Collaborations 2025]

What we learned from this non-detection:

Using the non-detection of SN 2023ixf, researchers placed stringent constraints on the gravitational wave energy and luminosity of a supernova explosion, but an even closer supernova is still needed to begin to rule out model predictions for these quantities. To estimate the distance out to which we can expect to detect gravitational waves from collapsing stars, the collaboration members injected synthetic supernova signals into their data. The majority of non-rotating explosions can be detected out to about 22,000 light-years — meaning events on the far side of our galaxy remain inaccessible to current detectors — while rapidly rotating explosions should be detectable out to nearly 100,000 light-years, pushing the detection horizon beyond the borders of the Milky Way.

Citation

A. G. Abac et al 2025 ApJ 985 183. doi:10.3847/1538-4357/adc681

The post Selections from 2025: A Search for Gravitational Waves from SN 2023ixf appeared first on AAS Nova.

  •  

Bumpy Road Ahead: Can Binary Interactions Make Supernovae Periodically Brighter?

Hubble image of a supernova in the galaxy NGC 2525

Editor’s Note: Astrobites is a graduate-student-run organization that digests astrophysical literature for undergraduate students. As part of the partnership between the AAS and astrobites, we occasionally repost astrobites content here at AAS Nova. We hope you enjoy this post from astrobites; the original can be viewed at astrobites.org.

Title: Supernova-Induced Binary-Interaction-Powered Supernovae: A Model for SN2022jli
Authors: Ryosuke Hirai (平井遼介) et al.
First Author’s Institution: RIKEN Pioneering Research Institute, Monash University, OzGrav: The ARC Centre of Excellence for Gravitational Wave Discovery
Status: Published in ApJ

There are thousands of dying stars that go bang in the night. These explosions are known as supernovae, and they are classified primarily on what spectral lines they show in the days and weeks following their initial explosion. Most broadly, they are separated into Type I (spectra that show little or no evidence of hydrogen) and Type II (spectra that show hydrogen). The physics leading to each type of supernova is different, and astronomers use all of the information at their disposal to learn about these cosmic fireworks.

One of the most useful tools for monitoring and learning about a supernovae is its light curve — the plot of the explosion’s brightness over time. This light curve usually appears as a steep incline up to a peak in brightness several days after the initial detonation, and then a shallow decline in brightness over the following weeks. There are, however, a few examples of supernovae that break this mould.

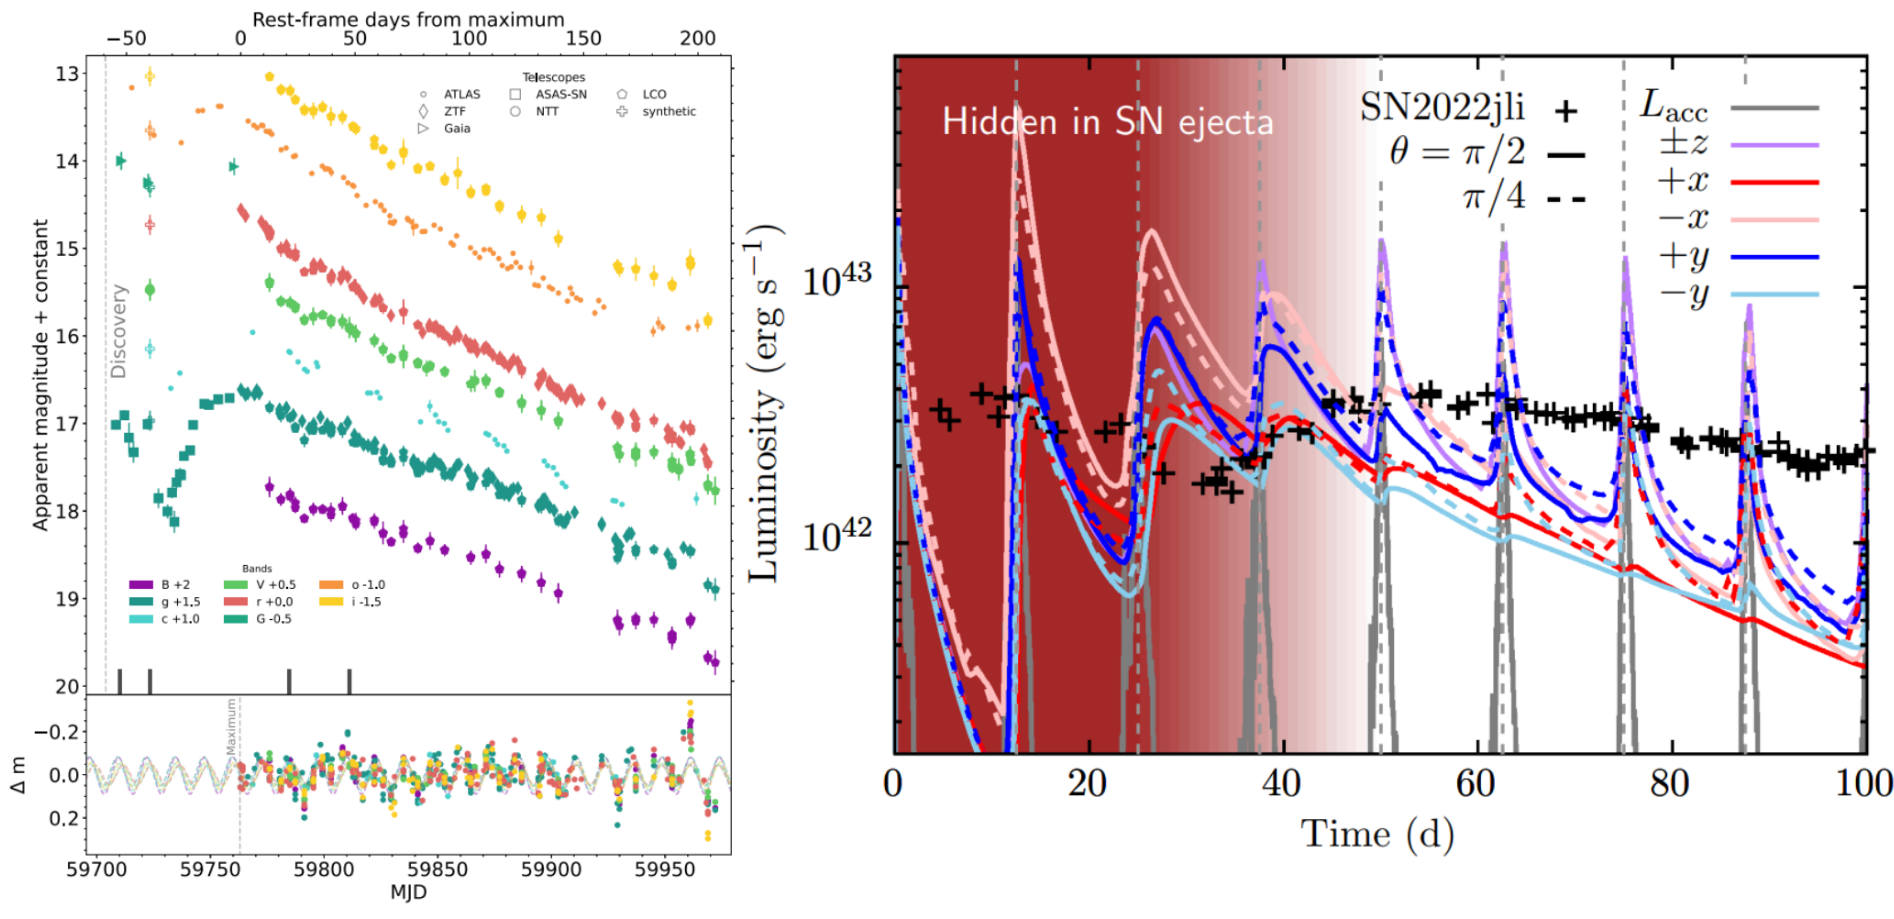
Today’s article seeks to understand the curious case of supernova SN2022jli. Unlike the typical gradual fade in brightness, the light curve of this supernova shows a periodic bump of brightness every 12.5 days (see Figure 1). The proposed mechanisms to explain this include the blown-apart supernova material interacting with concentric and regularly spaced shells of circumstellar matter, or a binary companion that interacts with the supernova remnant each orbital period. The authors of today’s article investigate the latter scenario by running 3D hydrodynamical simulations of an interacting, post-supernova binary to try to recover SN2022jli’s periodic light curve and constrain the orbital characteristics of the system.

light curve of SN2022jli

Figure 1: The light curve of SN2022jli shows periodic oscillations in the brightness, superimposed on top of the typical fading luminosity of a supernova. The left plot shows the light curve across various colours, and the associated bottom panel shows the oscillations with the typical fading supernova signal subtracted. The right plot shows the light curve of the authors’ proposed mechanism, where the different coloured lines are for different viewing angles on the system at the heart of the supernova. [Moore et al 2023 (left) and Hirai et al. 2025 (right)]

The authors only have the supernova’s light curve to go off of, so they explore a range of orbital scenarios to explain SN2022jli. They run a series of models evolving a neutron star — the degenerate core left over after a low-mass supernova — together with a main-sequence stellar companion, varying the orbital eccentricity and companion mass, while fixing the orbital period (at the observed 12.5-day oscillatory period) and neutron star mass to 1.4 solar masses — a typical mass for a newborn neutron star.

Why a neutron star? SN2022jli is a sub-class of Type I supernovae involving a “stripped” massive star which has lost its hydrogen — most likely through interactions with a close companion. These interactions typically circularise the pre-supernova orbit, and the subsequent explosion most commonly yields neutron stars. To explain the necessarily highly eccentric post-supernova orbit that may cause the periodic oscillation in SN2022jli, there was most likely a “natal kick” — a sudden and asymmetric burst during the supernova that rockets the neutron star in a random direction — which widened the orbit and de-circularised it, giving further evidence for a neutron star remnant.

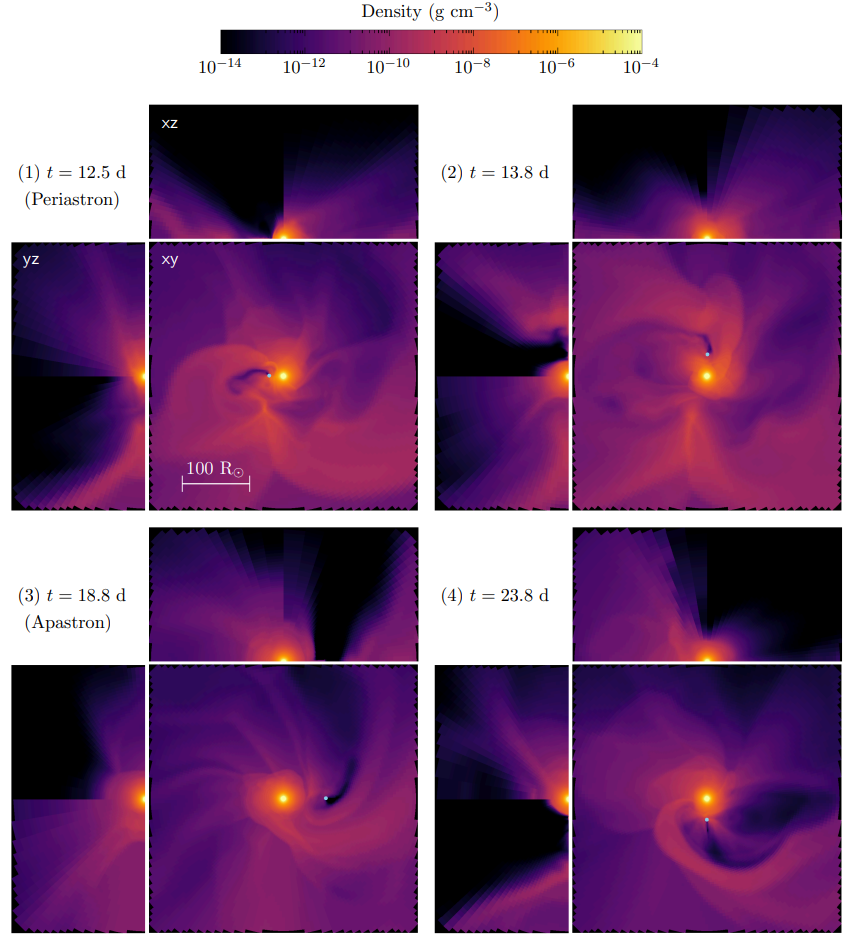
Immediately following the supernova explosion, ejecta interacting with the main-sequence companion star would heat the star and cause it to swell up. This inflated companion then feeds matter to the orbiting dense neutron star, and the accretion is most intense when the stars are closest in their orbit (called the periastron). During accretion, however, mass is not perfectly absorbed onto the neutron star, and there is some feedback onto the surrounding gas due to the complex thermal and magnetic physics around the neutron star. In this study, the authors model cases where there is no feedback, feedback from thermal radiation due to accretion, or feedback from bipolar outflows via jets or disk winds. Snapshots from the simulation involving a 5-solar-mass companion on an orbit with eccentricity of 0.5 and bipolar feedback is shown in Figure 2.

simulations of a neutron star with an inflated main-sequence companion

Figure 2: Several density snapshots of the 3D hydrodynamic simulations show how the neutron star (blue point) in the binary accretes and sculpts matter from the inflated main-sequence companion star (bright diffuse blob in the centre of each panel). The xy panels are a top-down look onto the orbital plane, while the xz and yz panels show a cross section through the plane. [Hirai et al. 2025]

The authors evolve the simulation for several orbits and show that periodic bursts of accretion onto the neutron star are capable of producing the oscillatory behaviour seen in SN2022jli’s light curve. The scale of the brightness oscillations are best recreated if the plane of the binary’s orbit is aligned with our line of sight (shown with the +x red line on the right side of Figure 1). Still, the profile of the undulations is not exactly reproduced by the model, and the outcome is very sensitive to our viewing angle of the binary orbit.

SN2022jli is just one of an emerging class of oscillatory supernovae, with more and more being discovered with highly sensitive modern all-sky surveys. Today’s authors rigorously modelled one proposed scenario to explain this periodic oscillation in brightness and showed that it is viable. More modelling using this interacting-binary mechanism on other oscillating supernova light curves — those with longer periods and different supernova classifications — will show whether this explanation is ubiquitous, or if the population of dancing supernova light curves is due to some other process!

Original astrobite edited by Anavi Uppal.

About the author, Ryan White:

I am a masters student at Macquarie University in Australia, working mainly on binary/multiple systems with massive stars (Wolf–Rayets in particular!). Outside of study, I’m a novice film buff, baking sourdough all the time, probably drinking coffee, and trying to get more into reading and frisbee/squash. You can also find me procrastinating on Bluesky @astroryan.bsky.social.

The post Bumpy Road Ahead: Can Binary Interactions Make Supernovae Periodically Brighter? appeared first on AAS Nova.

  •  

Chandra Spies a Supernova Shock Front Speeding Along

Supernova remnant N132D

Beautiful bubbles of hot ionized gas, supernova remnants trace the dying days of massive stars. A recent study uses the Chandra X-ray Observatory to detail the motion and understand the origins of one supernova remnant.

Retracing Supernova Remnants

Massive stars, about 8 solar masses or larger, will end their short lives in violent core-collapse supernovae. These explosions barrel into any surrounding interstellar medium, carving out low-density cavities and blowing material outward. Appearing as a bubble or shell of hot gas, a supernova remnant carries the signatures of the type of star that produced it and the ways that star shaped its environment throughout its life. 

Nearby, in the Large Magellanic Cloud, is the 2,500-year-old supernova remnant N132D — the most X-ray luminous supernova remnant within the Local Group. Though N132D’s size, likely progenitor mass, and chemical composition are well constrained, astronomers have yet to nail down the velocity of the X-ray shock front — the outer edge of the supernova remnant that rams into the interstellar medium. This measurement is critical to understanding the local conditions the supernova first encountered and how its expansion will continue to impact the interstellar medium over time.

Chandra Observations of N132D

Determining the shock front velocity requires astronomers to focus on the thin outer edge of the soaring supernova remnant — how do we measure the motion of such a narrow strip of gas? X-ray spectroscopy of N132D yields a measurement from a single epoch of observations, but it cannot isolate the narrow shock front, making a reliable velocity measurement difficult to attain.

supernova remnant velocity

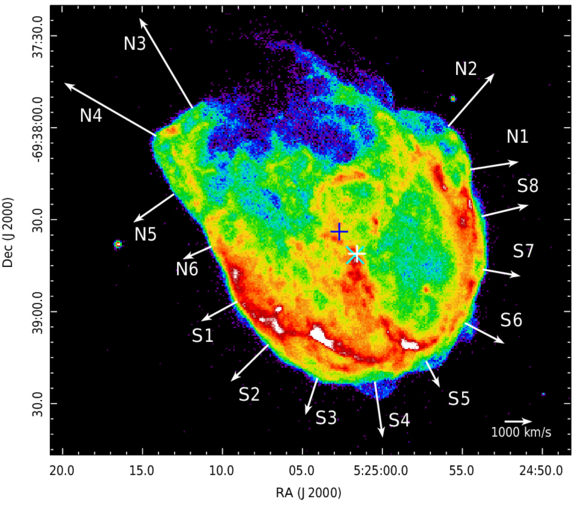
The expansion of supernova remnant N132D around the rim for each of the regions analyzed in this study. The arrow lengths are proportional to their estimated expansion velocities. Click to enlarge. [Long et al 2025]

Circumventing the challenges of spectral analyses, Xi Long (University of Hong Kong) and collaborators used two sets of X-ray observations of N132D from the Chandra X-ray Observatory taken about 14.5 years apart to measure the motion of the shock front across the sky over time. This measurement, known as proper motion, compares the location of the foreground supernova remnant to stationary background stars to estimate its angular speed. 

The authors focus on small regions on the very edge of the supernova shock front, six northern and eight southern, to carefully measure the motion of the shock between the two sets of observations. In separating the shock front into smaller regions, the authors can determine any variations in speed along the shock front. The southern edge of N132D moves with the same expansion rate of 1,620 km/s. The northern edge has an average expansion rate of 3,820 km/s, but its speed is more varied, which isn’t unexpected given its blown-out appearance.

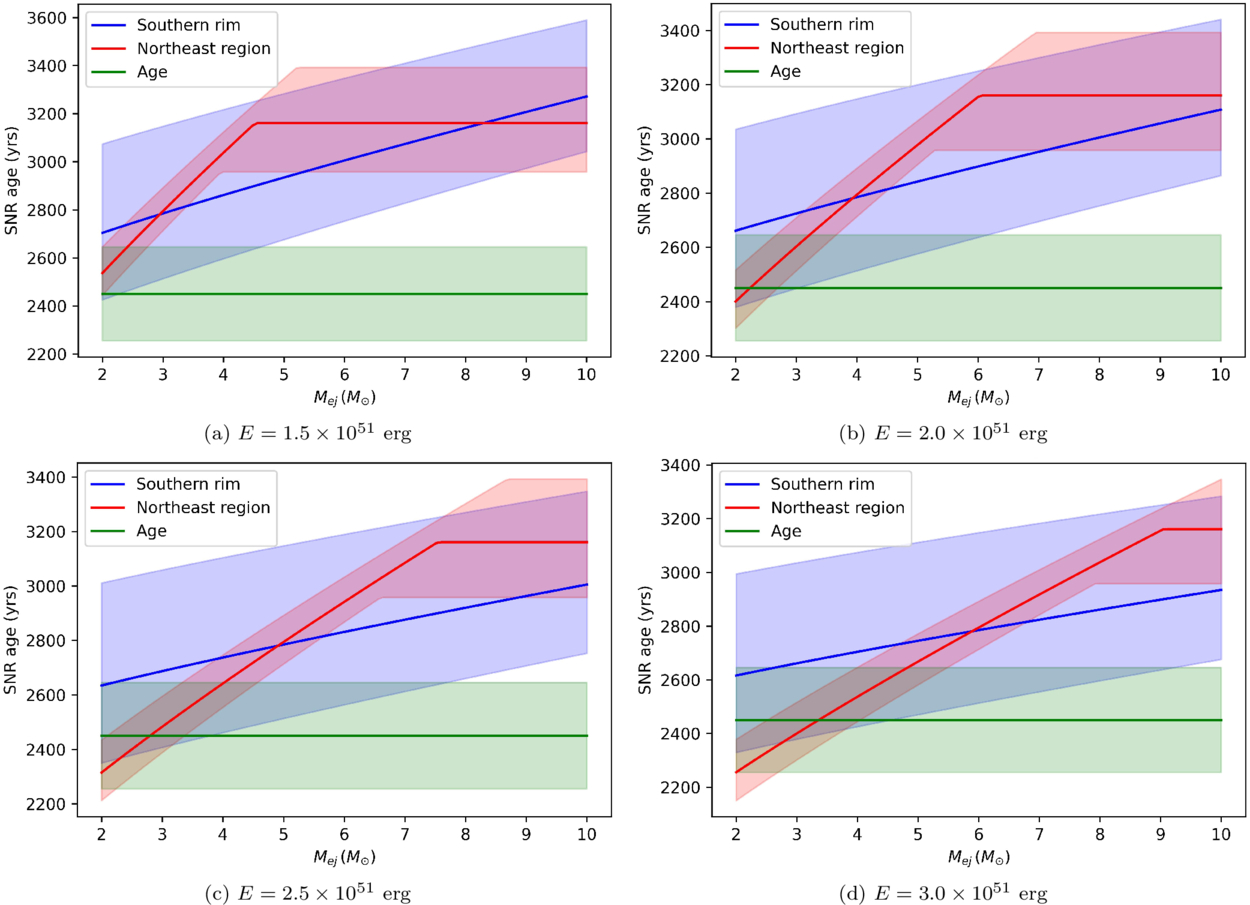
Modeling results showing the supernova age versus ejecta mass for the northern (red) and southern (blue) regions compared to the age estimate from an optical study of N132D. For the explosion energies and estimated ejecta masses between 2 and 6 solar masses, the models are consistent for all three. Click to enlarge. [Long et al 2025]

Comparing to Prior Studies

In addition to determining the velocity of the forward shock, the authors model the evolution of the supernova remnant to estimate the initial conditions of N132D including progenitor star mass, explosion energy, and ejecta mass. Their results agree with other studies that suggested N132D originated from a roughly 15-solar-mass star that exploded 2,500 years ago into a low-density cavity. 

This study showcases the unique ability of Chandra’s high-resolution instruments to carefully measure the evolution of supernova remnants, and further studies will continue to determine the detailed characteristics of supernova remnants across the Local Group.

Citation

“Chandra Large Project Observations of the Supernova Remnant N132D: Measuring the Expansion of the Forward Shock,” Xi Long et al 2025 ApJ 993 136. doi:10.3847/1538-4357/ae07c7

The post Chandra Spies a Supernova Shock Front Speeding Along appeared first on AAS Nova.

  •  

Kickin’ It into Overdrive with Stellar Escapees

Illustration of a binary system containing two white dwarfs

Editor’s Note: Astrobites is a graduate-student-run organization that digests astrophysical literature for undergraduate students. As part of the partnership between the AAS and astrobites, we occasionally repost astrobites content here at AAS Nova. We hope you enjoy this post from astrobites; the original can be viewed at astrobites.org.

Title: The Evolution of Hypervelocity Supernova Survivors and the Outcomes of Interacting Double White Dwarf Binaries
Author: Ken J. Shen
Author’s Institution: University of California, Berkeley
Status: Published in ApJ

Even stars get kicked around sometimes. When a white dwarf — a dense stellar corpse that’s run out of its nuclear fuel — gets pushed past its limit, the result is a spectacular thermonuclear explosion called a Type Ia supernova. Two stars are needed to trigger a Type Ia supernova explosion. In a binary system that gives rise to a Type Ia supernova, the more massive star, called the primary, steals mass from the less massive companion star. As the primary gains mass, it undergoes a runaway thermonuclear reaction and explodes. Despite the violent nature of the blast, it doesn’t always destroy everything in sight. While the primary star is obliterated, the companion star might survive the explosion by being launched, or “kicked,” into space at incredibly high speeds.

A few of these hyper-velocity survivors have been detected in surveys, particularly from the Gaia mission. Understanding how these stars survived a supernova provides important clues about how a supernova forms and explodes in the first place.

The D6 Model: (Double the Trouble) + (Double the Double the Trouble)

In today’s post, we explore the “dynamically driven double-degenerate double-detonation” model, fortunately shortened to the D6 model. (Try to say that ten times fast!) The D6 model describes a binary star system of two white dwarfs, each of which is generally composed of an even mix of carbon and oxygen. (Sometimes white dwarfs composed of helium or a mix of oxygen and neon are also possible.) As the white dwarfs spiral toward each other, the more massive primary star steals material, often helium, from the less massive companion star’s outer shell. If this mass transfer is violent enough, it can trigger a detonation within the helium shell of the primary star. This detonation then triggers an explosion deep within the core of the primary star, causing a supernova.

For a Type Ia supernova, it takes two stars to tango. What happens to the secondary (donor) star? One theory suggests that it can be blasted away from the scene of the crime at speeds ranging from approximately 1,000 to 3,000 km/s, becoming a so-called hyper-velocity star. Of these observed “survivors,” the hottest of the bunch have been theorized to be heated by the supernova explosion itself. But some of these survivors have been cooler (in temperature). If these companion stars were in the vicinity of the blast, how could they not be heated by the explosion? What can their temperature tell us about their origin?

Defining the Model

To explore the origins of these cool hyper-velocity stars, today’s author used the stellar evolution code MESA to model the evolution of different types of white dwarf companion stars after (presumably) surviving a Type Ia supernova. A key focus was on the Kelvin–Helmholtz mechanism, which is the process by which a star cools and therefore contracts over long periods as it radiates away its internal heat.

Because white dwarfs come in many flavors, they explored a range of possible elemental compositions for the companion white dwarf: helium-rich (He-rich), carbon/oxygen-rich (C/O-rich), and oxygen/neon-rich (O/Ne-rich).

One important detail of these models is that the stars were assumed to be fully convective, which is a common property of low-mass stars with masses less than around 0.4 M☉. (You can think of a fully convective star almost like a massive lava lamp where the heat source is at the center of the sphere.) Extensive mass loss can cause a more massive non-convective star to become less massive and convective, which in turn makes it susceptible to cooling quickly and avoiding a fiery death as a supernova. (Hotter gas rises to the surface, where the particles lose kinetic energy by doing work, gradually slowing down and cooling off.) This is key if we want to produce cool, fast-moving stars.

Detonate First, Simulate Later

For helium-rich survivors, the simulations suggest that if the companion star loses enough mass either before or during the explosion, the star’s natural Kelvin–Helmholtz evolution can potentially explain why we observe some cool hyper-velocity survivors. In the case of a star called D6-2, the simulations reproduced its low temperature and luminosity, assuming that it began its life as a helium white dwarf that was shredded but not entirely destroyed. This produces a tiny, convective, hyper-velocity supernova survivor.

D6-2 is an interesting object, however, because it has a fairly low velocity for a potential hyper-velocity survivor. Its velocity is estimated to be about 1,050 km/s, which simulations suggest should be higher based on its estimated mass. It’s likely that either the simulations and models need refining or D6-2 had an altogether different origin.

What About the Others?

So far, we’ve mainly talked about He-rich stars, but what about those C/O-rich ones? These stars would likely appear cooler and redder since they evolve at a nearly constant temperature before moving onto the standard white-dwarf cooling track. (This is called the Hayashi track.)

Red objects are harder for telescopes to detect and often get mistaken for other stars or objects, partially due to a pesky phenomenon called dust extinction, or interstellar reddening. To expand the search for these hyper-velocity candidates, surveys like Gaia might benefit by expanding their search limits to include redder stars, although this opens up the possibility of increasing the number of false positives.

A different class of fast-moving, faint stars — like LP 40-365 — could be related to this population. They are theorized to be remnants of white dwarfs around 1.4 M☉ that only partially exploded. Low-mass, O/Ne-rich survivors might match the observed temperatures and luminosities of LP 40-365, but the ages don’t line up as well as one might hope. (More work will be needed to figure out this particular puzzle.)

The Odds of Stellar Survival

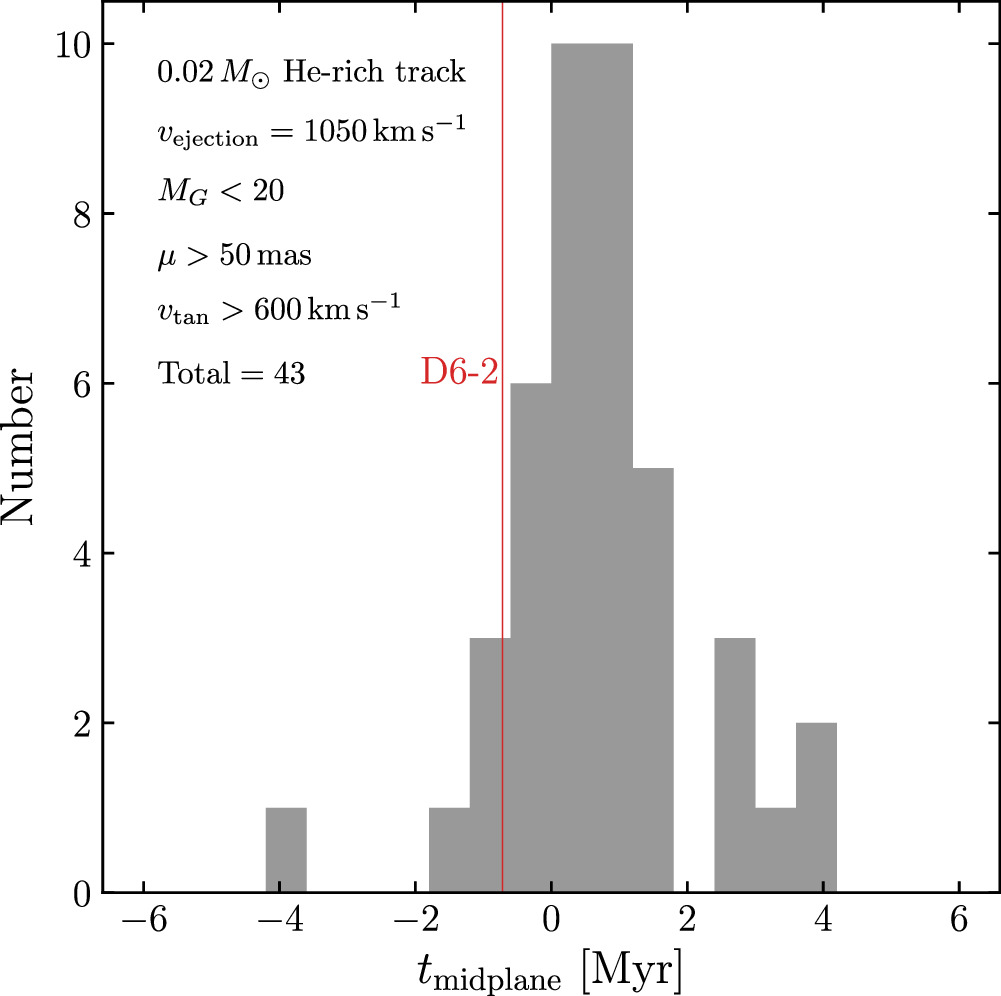
Based on these simulations, it’s estimated that about 2% of Type Ia supernovae might leave behind a He-rich hypervelocity star like D6-2 (see Fig. 1). If we consider C/O-rich survivors (like D6-2’s cousins D6-1 and D6-3), the rate drops to about 0.2%, which is intriguingly close to the estimated rate of SN 2003fg-like events: unusually bright, slowly evolving Type Ia supernovae that often display tell-tale signs of unburned carbon and oxygen in their spectra.

A histogram of detectable hypervelocity survivors from the He-rich track

Figure 1: A histogram of detectable hyper-velocity survivors from the He-rich track assuming every Type Ia supernova produces a companion with a mass of 0.02 solar mass. These survivors are assumed to be ejected from their Type Ia supernovae at a velocity of 1,050 km/s, matching D6-2. The x-axis, tmidplane, describes the apparent travel time from the midplane of the simulation’s galaxy. A negative value means the survivor was observed before it passed through the plane. A total count of 43 hyper-velocity survivors from every Type Ia supernova yields an estimated survival rate of about 2%. [Shen 2025]

The presence of these hyper-velocity survivors might be linked to rare types of supernovae, which would provide an interesting way to look into the origins of these oddball events.

Choose Your Own (Stellar) Adventure

This article suggests different evolutionary paths for how binary white dwarfs might evolve. Depending on the properties of the merger, the system might do any of the following:

  1. Trigger nuclear reactions within the outer shell of the primary without detonating the primary’s core
  2. Become a normal Type Ia supernova
  3. Leave behind a hyper-velocity remnant
  4. Become a SN 2002es-like supernova, which is a fainter type of Type Ia supernova

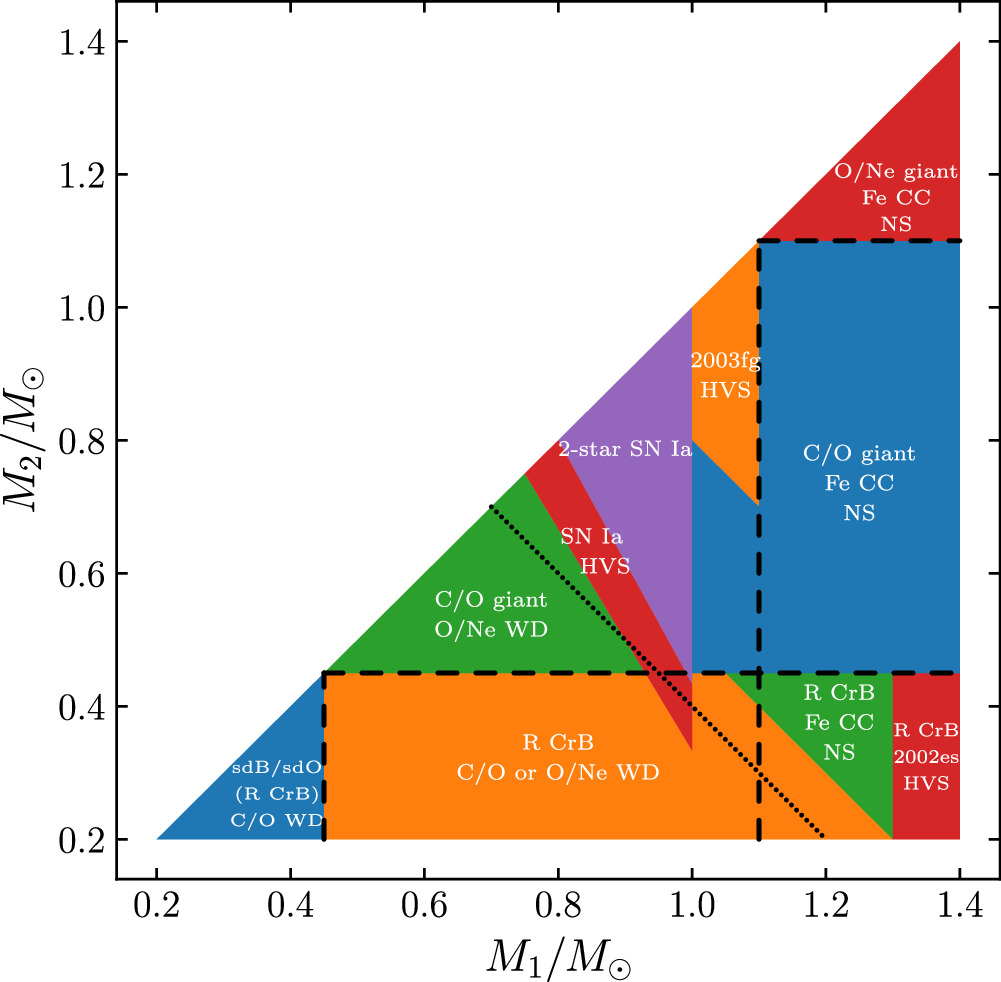
There are lots of potential outcomes for these types of binaries, and hyper-velocity survivors indicate just a tiny fraction of a particular configuration of binary white dwarfs (see Fig. 2).

diagram of the speculative outcomes for a white dwarf–white dwarf binary

Figure 2: A diagram of the speculative outcomes for a white dwarf–white dwarf binary. The y-axis shows the secondary’s initial mass, whereas the x-axis shows the primary’s initial mass. The dashed lines indicate where the combined white dwarf mass is 1.4 M☉. The plot illustrates the wide variety of outcomes of white dwarf–white dwarf binaries, of which hyper-velocity survivors (HVS) are rare. sdB/sdO = subdwarf B/O stars; R CrB = R Coronae Borealis, variable star; Fe CC = iron core-collapse supernovae; HVS = hyper-velocity survivor; NS = neutron star. [Shen 2025]

These stellar survivors are rare and fast. Cooler hyper-velocity survivors, in particular, are fascinating because they may originate from white-dwarf binaries with unusual properties. Studying these fast-moving stars helps piece together our understanding of Type Ia supernovae as a whole. With improved surveys and simulations, we may discover more about these elusive escapees.

Original astrobite edited by Chloe Klare.

About the author, Mckenzie Ferrari:

I’m currently a PhD grad student in the Geophysical Sciences program at the University of Chicago. While I now study the atmosphere and oceans of Earth, most of my previous undergrad and grad research focused on simulations of Type Ia supernovae and galaxy formation and evolution. In my free time, I foster cats for a local organization, enjoy cooking, and can often be found running along Lake Michigan.

The post Kickin’ It into Overdrive with Stellar Escapees appeared first on AAS Nova.

  •  

Kicking Neutron Stars from the Nest

A blue/white star with lines representing magnetic fields sprouting from the poles against a black background.

Neutron stars don’t stick around for long after they’re born. Recent research has now uncovered just how fast they flee.

They Grow Up So Fast

Human beings require many years of care and support from their parents before they’re able to venture forth into the world. This is an embarrassingly long process compared to the standard for animals like deer and horses, whose offspring are ready to walk mere minutes after birth. However, baby neutron stars, some of the densest objects in the known universe, put all life on Earth to shame with their immediate self-reliance: after a fiery birth from a supernova explosion, these stars flee the site of their creation at hundreds of kilometers per second.

Crab Nebula supernova remnant

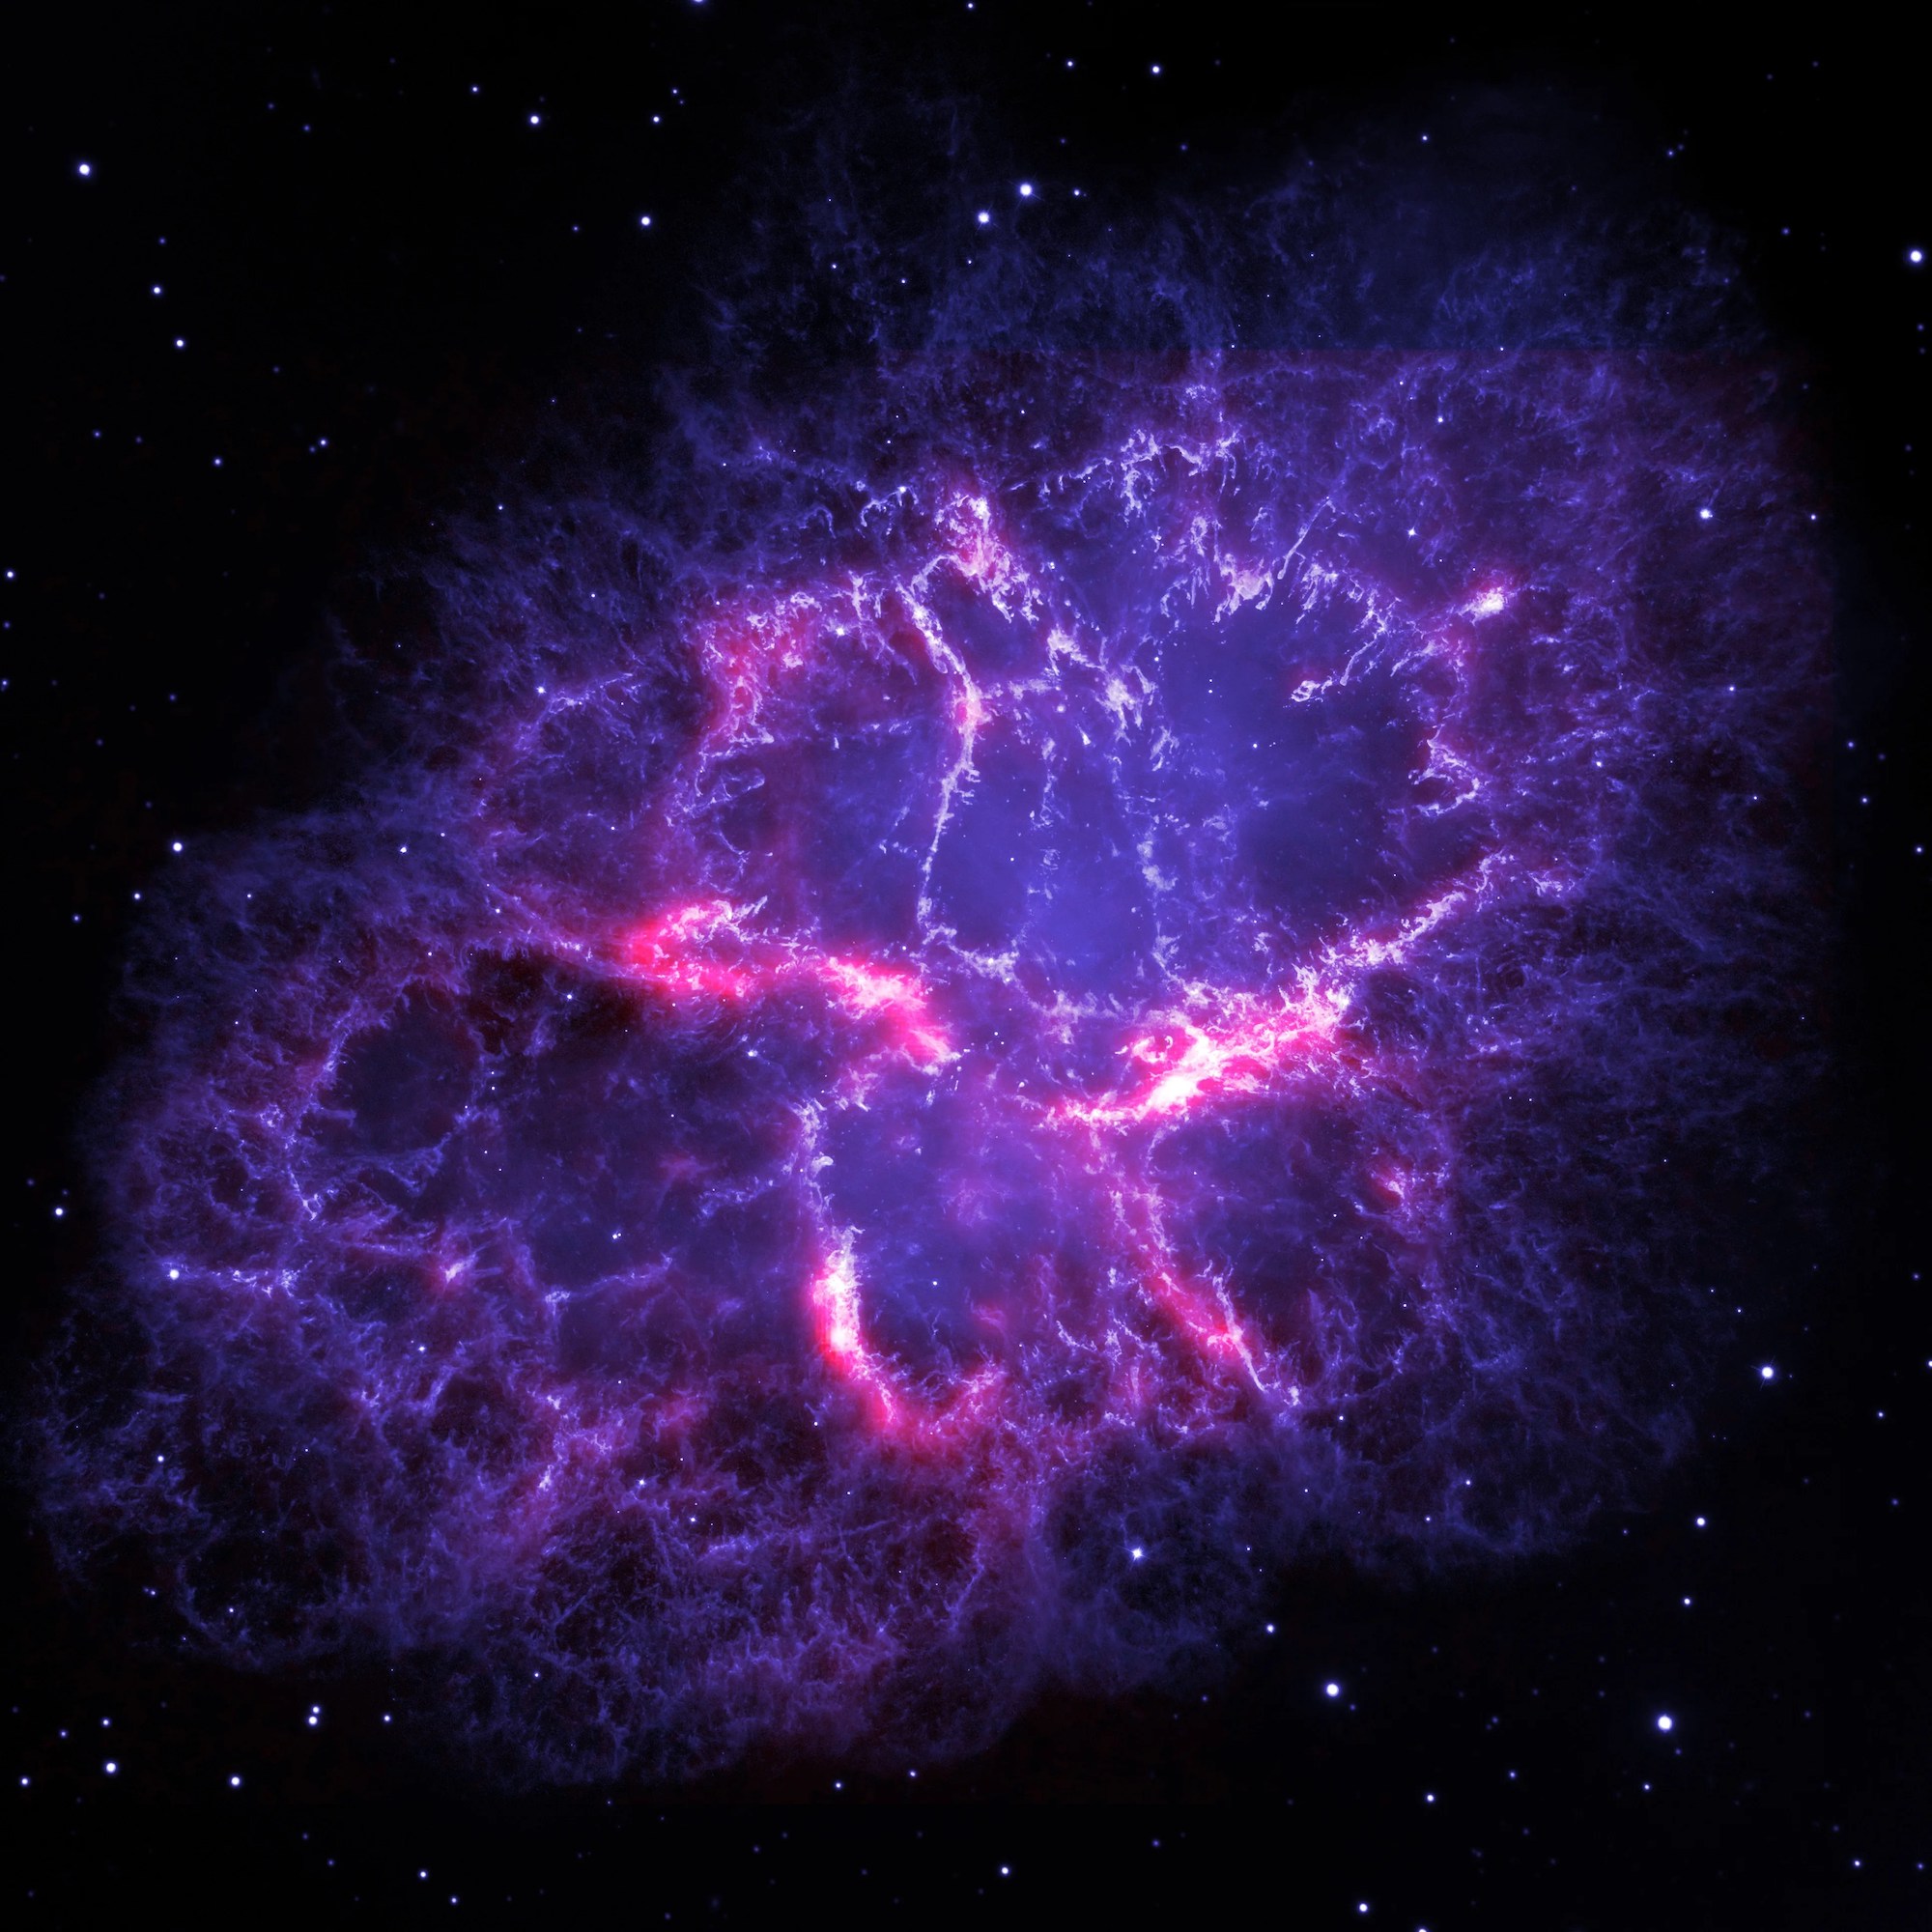
Hubble Space Telescope and Herschel Space Observatory image of the Crab Nebula, which is the remnant of a supernova explosion. [ESA/Herschel/PACS/MESS Key Programme Supernova Remnant Team; NASA, ESA and Allison Loll/Jeff Hester (Arizona State University)]

These “natal kicks,” as they’re called in research literature and in recent work by Paul Disberg and Ilya Mandel (Monash University and OzGrav) are a natural consequence of neutron star formation. When a massive star burns through the last of its fuel and surrenders to its own gravity, it collapses inward and compresses its core into a neutron star before rebounding in an explosion. This collapse is never perfectly symmetric, however, and the slight imbalance gives the resulting neutron star a shove.

By measuring the characteristic speeds of these “kicks,” astronomers can deduce how asymmetric the preceding collapse must have been, along with other information about the earliest moments of the supernova. Though measuring the speed of something so small from the other side of the galaxy is no easy task, Disberg and Mandel’s recent publication in The Astrophysical Journal Letters takes on the challenge.

Quantifying the Kicks

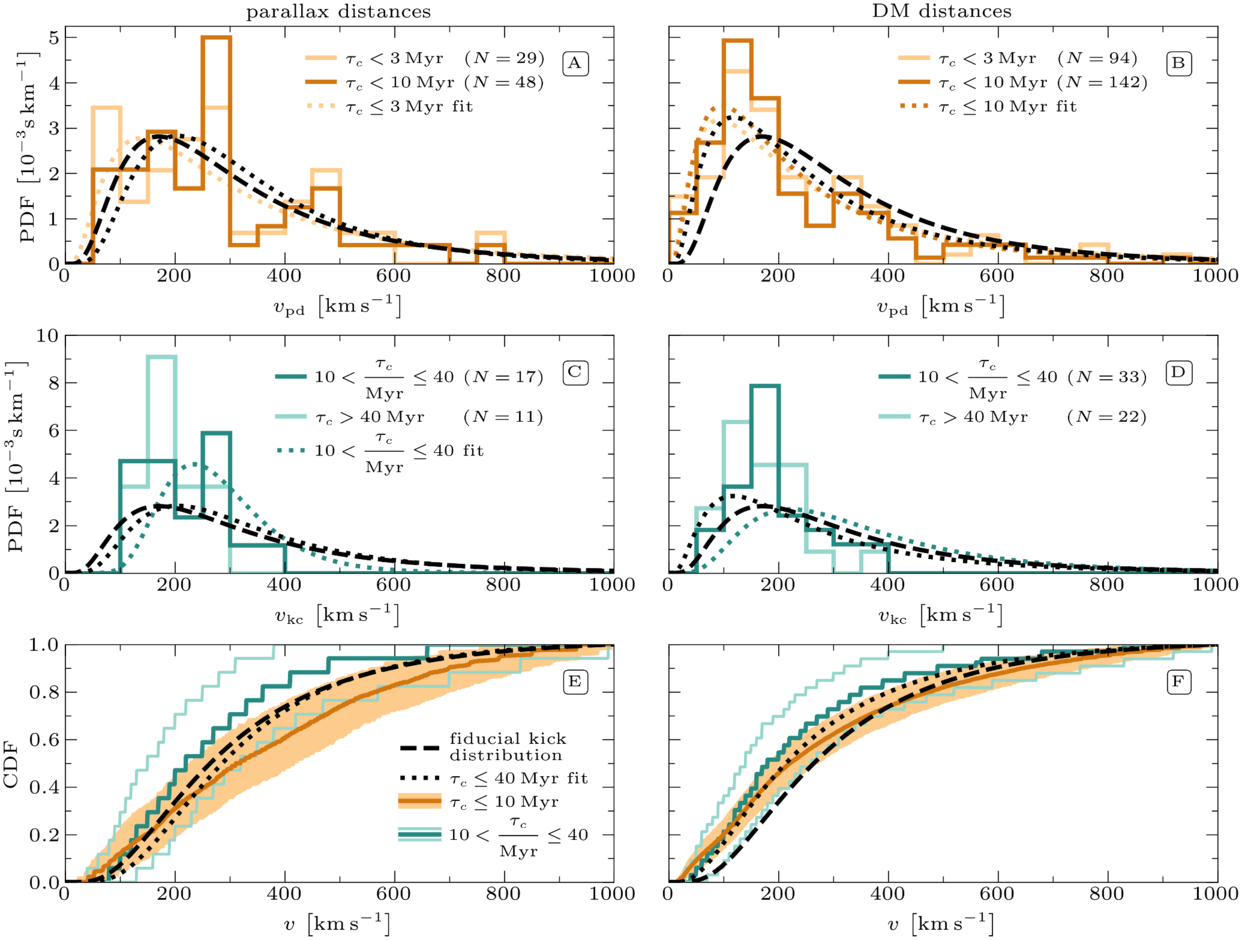
The pair first began by examining measurements of neutron stars known to be less than 10 million years old, which is extremely young in an astronomical context. Since these objects haven’t had time to be slowed down or altered from their course by passing stars or the galactic tide, their present-day speeds should be the same as their natal kicks. The researchers found that while every neutron star had its own unique kick velocity, the distribution of all the velocities followed a log-normal pattern with a peak near 150–200 km/s.

Measured kick velocities and fit distributions

Measured kick velocities (histograms) and fit distributions (curves) for different subsamples. Click to enlarge. [Disberg & Mandel 2025]

Next, Disberg and Mandel examined the distribution of velocities from older neutron stars. These, which had to be measured via a different method, turned out to be very similar to the distribution assigned to the younger stars. Finally, they re-examined previous studies that attempted their own models of the kick distribution. Though several of these studies conflicted with one another, the team found that these discrepancies could be explained by different sample sizes and mistaken statistical interpretations. On the whole, the team’s distribution fit all the available data well and the most succinctly of any alternative framework.

Going forward, other astronomers focused on modeling supernovae, orbits within the galaxy, and binary-star evolution can use this distribution either to sanity check their models or as inputs to other simulations. Through slow accumulation of studies like this, each with its own quantified measurement of some property in the galaxy, we come to understand our universe more fully and unlock our ability to make ever more models and predictions.

Citation

“The Kick Velocity Distribution of Isolated Neutron Stars,” Paul Disberg and Ilya Mandel 2025 ApJL 989 L8. doi:10.3847/2041-8213/adf286

The post Kicking Neutron Stars from the Nest appeared first on AAS Nova.

  •  

Get a Kick Out of This: Researchers Waited 15 Years to Measure a Neutron Star’s Journey

Crab Nebula

With a measurement 15 years in the making, astronomers have pinned down the path of a neutron star launched by a collapsing star. This finding helps to explain how neutron stars are “kicked” into space by supernovae.

Just for Kicks

Crab Nebula pulsar

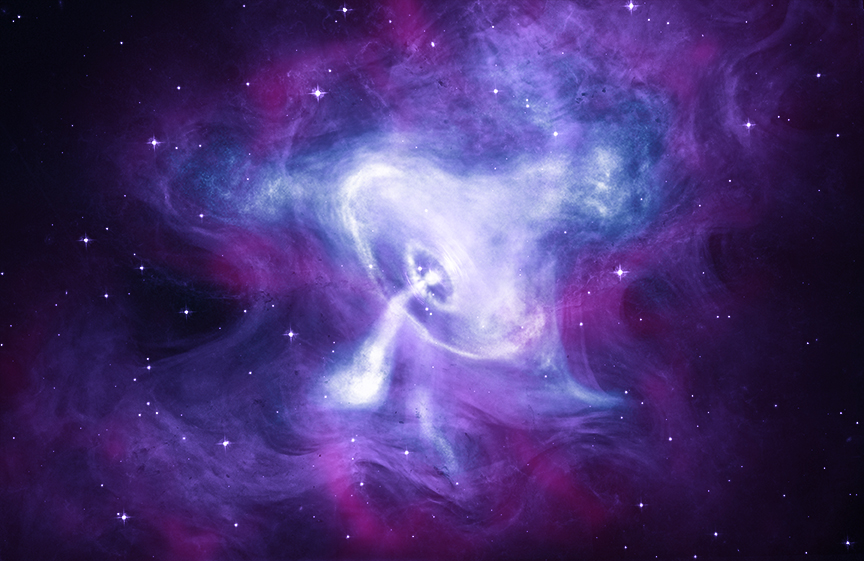
This multiwavelength image shows the pulsar — a type of neutron star — at the center of the Crab Nebula supernova remnant. [X-ray: NASA/CXC/SAO; Optical: NASA/STScI; Infrared: NASA-JPL-Caltech]

When massive stars reach the end of their lives, they expire in a final, fantastic cosmic display: a core-collapse supernova. These events can leave behind remnants called neutron stars, which are composed of highly compressed neutrons arranged in a sphere roughly as wide as the island of Manhattan is long.

Many neutron stars have been observed to zip through space at hundreds of kilometers per second, which suggests that these stars get a “kick” when they’re born in a supernova. However, the details of this kick are not yet clear. Are neutron stars launched into space in the opposite direction from the material ejected in the explosion, as some studies suggest? Or is the neutron star’s motion determined by the burst of neutrinos that carries off most of the supernova’s energy, as other studies hint?

Worth the Wait

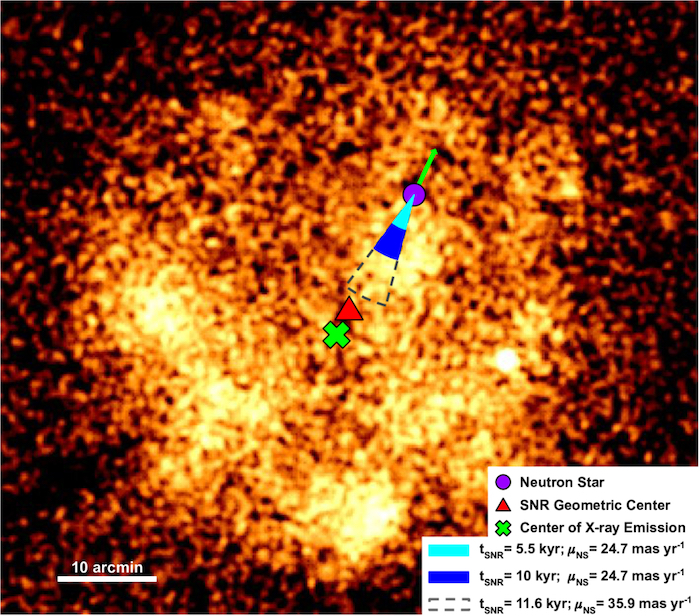
To answer these questions, astronomers must compare the velocities of young neutron stars to the movement of their associated supernova remnants. In a recent research article, Tyler Holland-Ashford (NASA Goddard Space Flight Center) and collaborators measured the motion of the neutron star affiliated with the G18.9–1.1 supernova remnant, using Chandra observations made 15 years apart in September 2009 and July 2024.

Chandra images of the field containing the neutron star

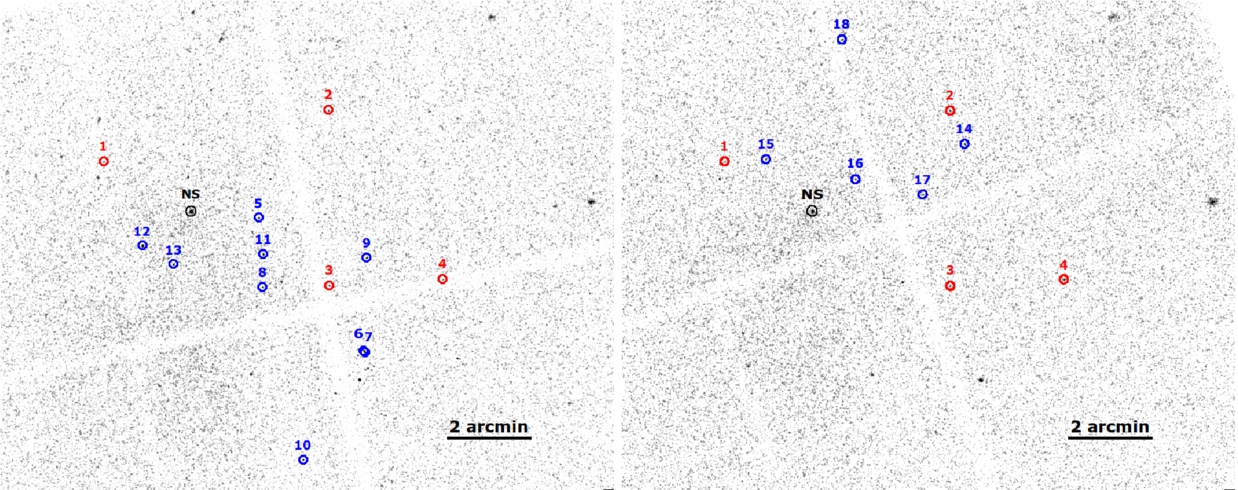
Chandra images from 2009 (left) and 2024 (right; this image is the merged product of two observations). The neutron star is shown in black. Blue and red sources were used for astrometric correction. The red sources were present in both observations. Click to enlarge. [Holland-Ashford et al. 2025]

Making this measurement is trickier than it sounds, requiring more finesse than simply charting the location of the neutron star at different times. Holland-Ashford’s team used measurements from the ultra-precise star-mapping Gaia spacecraft to account for the proper motions of other sources in the images and to put the observations from the two time periods into the same frame of reference. After these adjustments, they measured the proper motion of the neutron star to be 24.7 milliarcseconds per year.

Because the distance to the supernova remnant is uncertain, this proper motion could correspond to a range of transverse velocities. For distance estimates of 6,800 and 12,400 light-years, this puts the neutron star’s transverse velocity at 264 or 474 km/s, respectively.

A Distinct Offset

supernova remnant and neutron star location

Current location of the neutron star (purple) compared to the geometric center of the supernova remnant (red) and the center of its X-ray emission (green). Even assuming the oldest reasonable age for the supernova remnant, there is a distinct offset between the neutron star’s birthplace and the center of the remnant. Click to enlarge. [Holland-Ashford et al. 2025]

What does this velocity tell us about the kick this neutron star received at birth? To probe the origin of the kick, the team first used the neutron star’s measured velocity and the likely age of the supernova remnant to trace the neutron star’s trajectory back to its birth site. This showed that the neutron star’s birthplace is offset from the center of the supernova remnant by several arcseconds, though both locations fall along the trajectory set by the neutron star’s motion. This suggests that the ejected stellar material and the newborn material were kicked in opposite directions by the supernova, most likely by a theorized “conservation-of-momentum-like” process.

Currently, Chandra is the only X-ray observatory with fine enough resolution to make the kind of measurement needed in this study. Luckily, Chandra’s observations of neutron stars stretch back to 1999, and combining this wealth of data with sensitive measurements from future high-resolution X-ray instruments should provide the long time baselines needed to trace the trajectories of more neutron stars and further explore the origins of neutron star kicks.

Citation

“Proper Motion of the Neutron Star in the Supernova Remnant G18.9–1.1,” Tyler Holland-Ashford et al 2025 ApJ 988 218. doi:10.3847/1538-4357/adeb7e

The post Get a Kick Out of This: Researchers Waited 15 Years to Measure a Neutron Star’s Journey appeared first on AAS Nova.

  •  

Double-Star Discovery Suggests There’s a New Nearby Supernova Progenitor

DEM L 190 supernova remnant

New data suggest that the second-brightest star in the constellation Sagittarius is not one star but two. The two stars will someday merge to form a single star with a mass of 12 solar masses, and at just 228 light-years away, the resulting star will be the nearest core-collapse supernova progenitor to Earth.

One Star of Two?

The star Sigma Sagittarii, formally named Nunki by the International Astronomical Union, has been under scrutiny for decades. Various studies published in the last half-century have found Nunki to be either two stars in a tight binary system or a single star, depending on the methods and instruments used.

Paranal Observatory

Three of the Very Large Telescope Interferometer’s 1.8-meter Auxiliary Telescopes, which can be maneuvered into different positions. [Y. Beletsky (LCO)/ESO; CC BY 4.0]

Now, a team led by independent researcher Idel Waisberg has performed an interferometric investigation of the star, aiming to discern its single or binary status. The team used the GRAVITY instrument on the Very Large Telescope Interferometer (VLTI) at Paranal Observatory in Chile.

The VLTI encompasses eight telescopes, including four 8.2-meter telescopes that are fixed in place and four 1.8-meter telescopes that can travel between different stations, changing the resolving power of the interferometer. For this search, Waisberg and collaborators positioned the smaller telescopes so that the greatest distance between them was 130 meters, achieving a resolution of just 3.5 milliarcseconds.

Future Site of a Supernova

The VLTI data clearly show that Nunki is a close binary star system. The two stars have nearly the same mass — 6.5 and 6.3 solar masses — and are separated by just 0.60 au, orbiting one another every 50 days. Stellar isochrone modeling suggests that the stars are roughly 30 million years old.

illustration of a star filling its Roche lobe

Diagram of a binary star system in which one star has filled its Roche lobe. The blue shaded areas indicate the stars, while the black lines outline the two stars’ Roche lobes. [Philip D. Hall; CC BY 4.0]

Though the new data have shown that Nunki is in fact two stars, further analysis showed that this configuration is only temporary. As the two stars evolve, the more massive of the two will be the first to expand into a red giant. In 20 million years, the growing star will spill out of its Roche lobe — the volume in which gas is gravitationally bound to that star — and donate gas to its smaller companion. Unstable mass transfer will eventually lead the stars to merge, forming a single star of about 12 solar masses.

At 12 solar masses, Nunki will be massive enough to undergo core collapse, and at just 228 light-years away, it is the nearest core-collapse supernova progenitor system to Earth. Be sure to mark your calendar for tens of millions of years in the future — such a close supernova promises to be spectacular!

Citation

“Hidden Companions to Intermediate-Mass Stars. XXVI. Uncovering Nunki = Sigma Sagittarii as a 6.5 M⊙ + 6.3 M⊙, 0.60 au Binary,” Idel Waisberg et al 2025 Res. Notes AAS 9 71. doi:10.3847/2515-5172/adc739

The post Double-Star Discovery Suggests There’s a New Nearby Supernova Progenitor appeared first on AAS Nova.

  •  
❌