Global oil giant Shell continued operating a compromised pipeline in Nigeria’s Niger Delta despite knowing it posed a pollution risk in the surrounding coastal wetland environment, newly disclosed internal company communications reveal. The emails and memos, reviewed by Mongabay, show senior leadership knew of the poor conditions of the 97-kilometer (60-mile) Nembe Creek Trunk Line as early as 2008. Despite concerns it was operating outside technical integrity standards and proposals to shut it down, a top executive decided to keep pumping oil through the line. Carrying 150,000 barrels of oil per day to the export terminal at Bonny Island Rivers state, the Nembe Creek Trunk Line is a critical oil artery in Nigeria. Throughout the years, theft from the pipeline using illegal connections caused spills into the vast mangrove ecosystem of true (Rhizophora sp.) and flowering black (Avicennia sp.) tree species. An internal 2013 Shell document coded such tampered lines as “red,” requiring either their immediate shutdown or immediate action to remove all illegal connections. Locals from the nearby riverine Bille community said the oil spills killed about 2,000 hectares (4,900 acres) of mangrove swamps around the village while impacting an area of 13,200 hectares (32,600 acres). The contaminated waterways and degraded ecosystem, they told Mongabay, killed fish and other aquatic life. Satellite imagery surrounding the village shows massive degradation of the mangroves. “The aquatic life is gone. Our people can no longer go to the river and catch reasonable fish — they can’t even find the fish in the…This article was originally published on Mongabay
Leoncia Ramos has lived her 65 years in the lush Dominican Republic town of La Piñita, but now says she is fearful for her health and wants to leave. She’s among 450 families asking the government and the company behind the Pueblo Viejo gold mine to be relocated because of concerns of pollution from the nearby mine. They allege the site, controlled by Canadian giant Barrick Mining Corp., is harming their health and the environment, and fear that if a tailings dam about a kilometer away were to collapse, it would be disastrous. Ramos’s community has spent 15 years fighting to have its concerns addressed and now says Canada, where Barrick Mining is headquartered, could play a role. In 2019, the Canadian government created an office of an ombudsperson to handle complaints from communities like Ramos’s. But the government has left the role vacant for the past year, and its work has seemingly come to a standstill. Canada is home to about half of the world’s publicly traded mining and mineral exploration companies, with operations both in Canada and overseas, including some of the world’s largest miners, like Barrick Mining. The government created the office of the Canadian Ombudsperson for Responsible Enterprise (CORE) in 2019 to address human rights complaints about Canadian companies’ operations overseas. But the office has now been without an ombudsperson since May 2025, and advocates say its work has stalled at a critical moment, as demand for transition minerals and a changing geopolitical climate are driving…This article was originally published on Mongabay
NASA’s Artemis II Moon Mission Research Continues on Earth
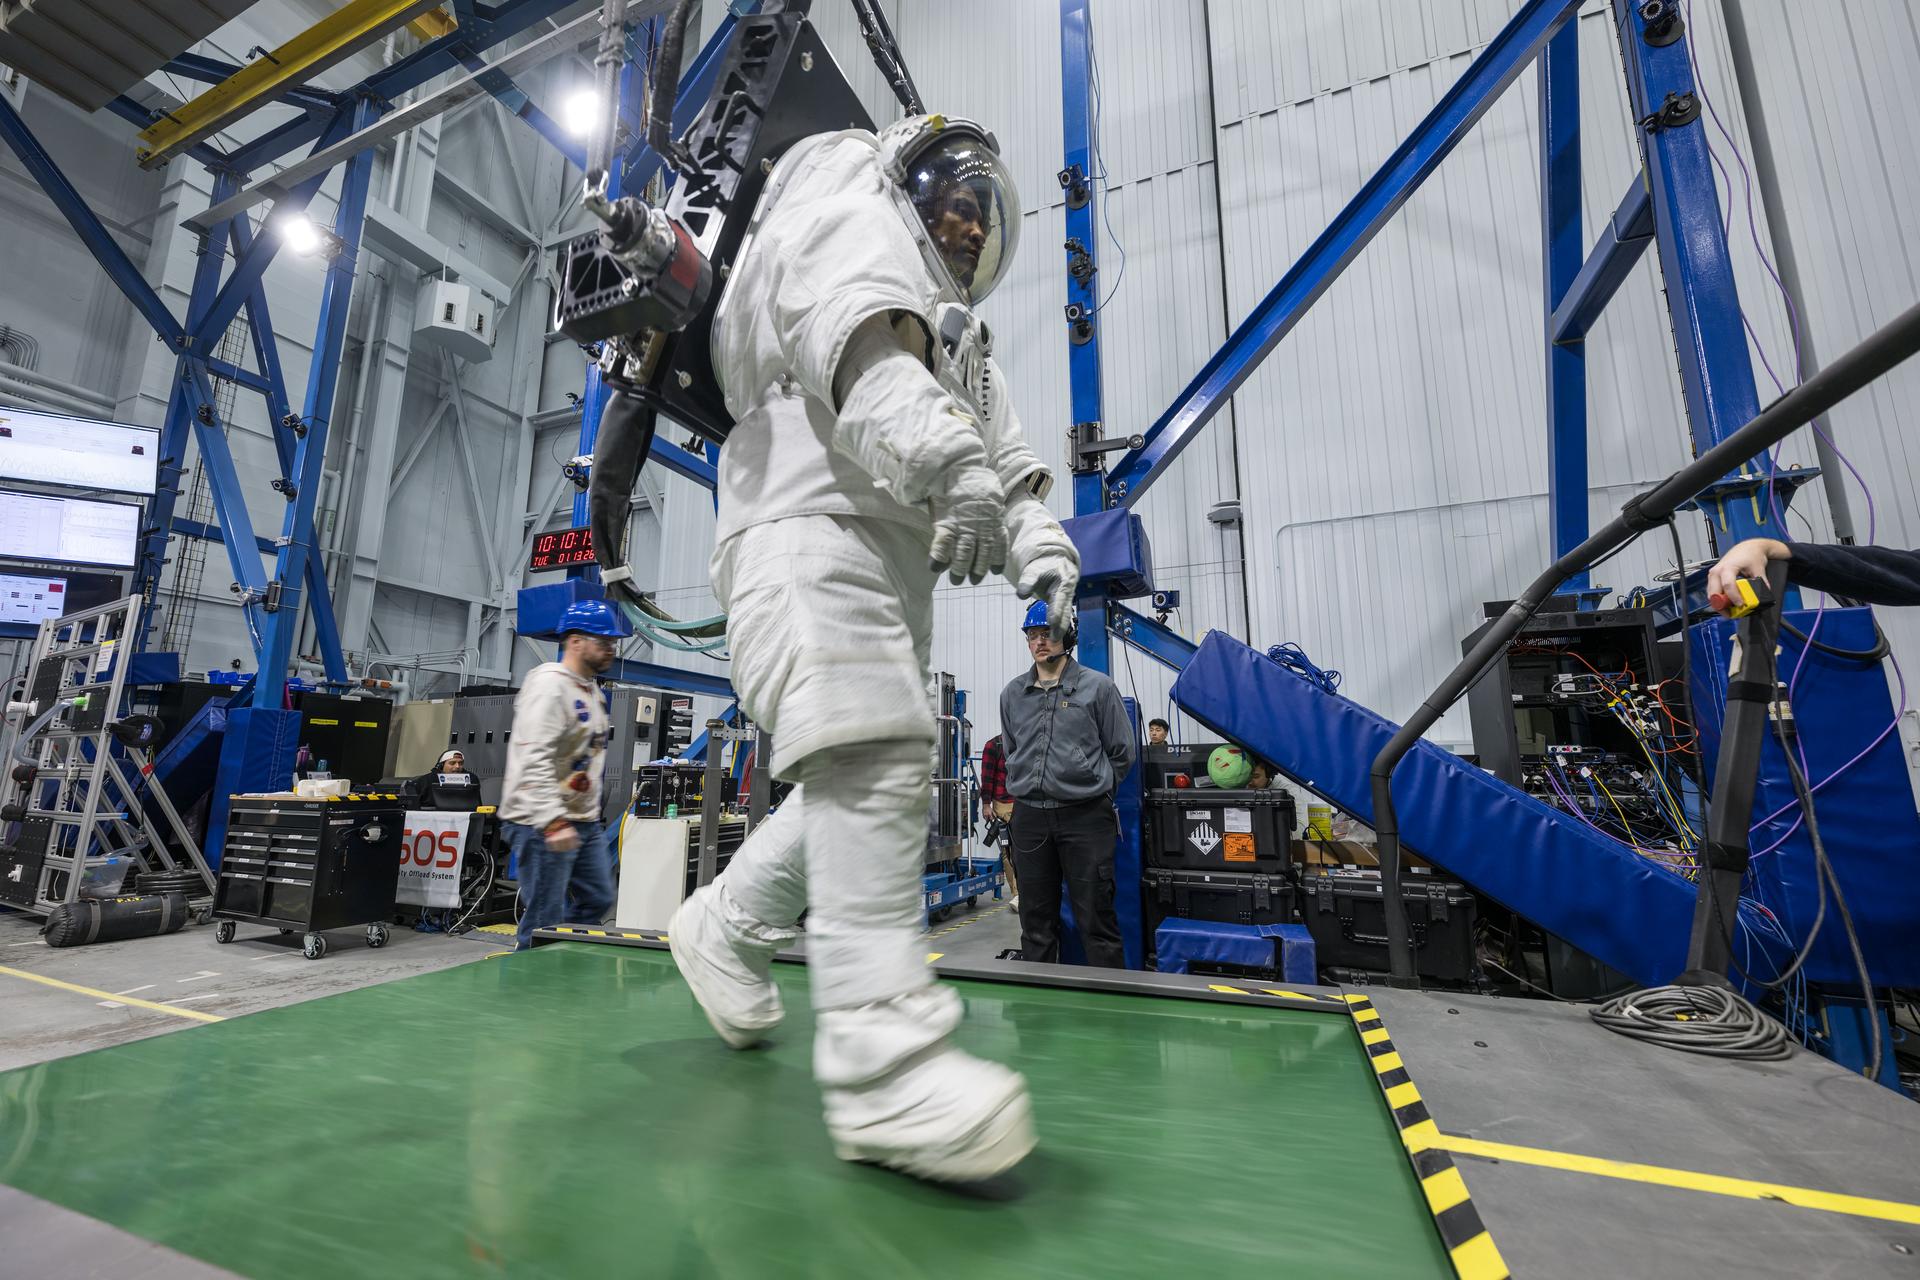
Artemis II astronaut Victor Glover walks on a treadmill while in a space suit harnessed to NASA’s Active Response Gravity Offload System at NASA’s Johnson Space Center. Glover is simulating a walk on a planetary surface while in a suit that has been offloaded to lunar gravity. Artemis II astronauts completed this and other suited tasks before their mission launched and within a few days of landing, giving researchers a chance to assess how quickly upon landing crews’ bodies adapt to a different gravity. Results will help scientists better understand how soon after landing crews can complete mission-critical tasks on the surface of the Moon or Mars.
NASA/Robert Markowitz
Since NASA’s Artemis II crew members safely splashed down in the Pacific Ocean on April 10 after their record-setting mission around the Moon, science teams have been busy collecting more data and combing through observations collected on the test flight. Results from these science investigations will help support safe human exploration of deep space and provide a blueprint for how future missions will conduct science on the lunar surface as NASA builds a Moon Base and develops an enduring human presence there.
Postflight crew health, performance data
In the hours, days, and weeks after landing, the Artemis II crew members, NASA astronauts Reid Wiseman, Victor Glover, Christina Koch, and CSA (Canadian Space Agency) astronaut Jeremy Hansen, contributed critical data to help the agency understand how the human body reacts to spaceflight. Collecting this data as soon as possible after landing was important to understand how the body adapts from microgravity to Earth’s gravity. The data will inform NASA’s understanding of how quickly crews can complete mission-critical tasks after landing on a planetary surface like the Moon or Mars, where there won’t be landing support personnel to assist.
Within a day of splashdown, researchers collected a suite of data for the Artemis II Spaceflight Standard Measures study, which is part of a larger effort across the astronaut corps to gather a baseline set of health measurements on blood pressure, heart rate, eye health, and motor control. Crew members also completed a mini obstacle course, which included lying down, standing up, unfurling a rope ladder, ladder climbing, and more, to assess how their bodies were adapting to Earth’s gravity.
Once the crew returned to NASA’s Johnson Space Center in Houston, researchers guided them through further medical check-ups and tests of motor control. Over the next several days, the crew completed obstacle courses wearing spacesuits offloaded to lunar gravity, which is roughly one-sixth the force of Earth’s gravity. Researchers are now analyzing this data to gain insight into how crews may perform as they adapt to the gravity of a planetary surface.
As part of the Immune Biomarkers study, researchers are comparing blood and saliva samples collected after the Artemis II splashdown with samples collected preflight and during the mission. Among other topics, the study investigates whether and how dormant viruses reawaken in astronauts’ bodies while in space.
Some crew members completed postflight cognition tests and a simulated manual spacecraft docking task to assess motor control for the ARCHeR (Artemis Research for Crew Health & Readiness) study. This, combined with data collected through a wrist-worn device while crew members were in space, is used to understand the effect of space hazards on well-being and performance.
Initial data collections for Artemis II health studies concluded 45 days after splashdown. However, medical teams will continually monitor astronaut health throughout the Artemis II crew members’ lifetimes.
Once this data is processed and anonymized, information will be available for scientists to study the effects of spaceflight via a request to NASA’s Life Sciences Data Archive. The results from this work could lead to new technologies and studies that help predict the adaptability of crews on future missions to the Moon and Mars.
Analyzing astronaut-derived organ chips flown around Moon
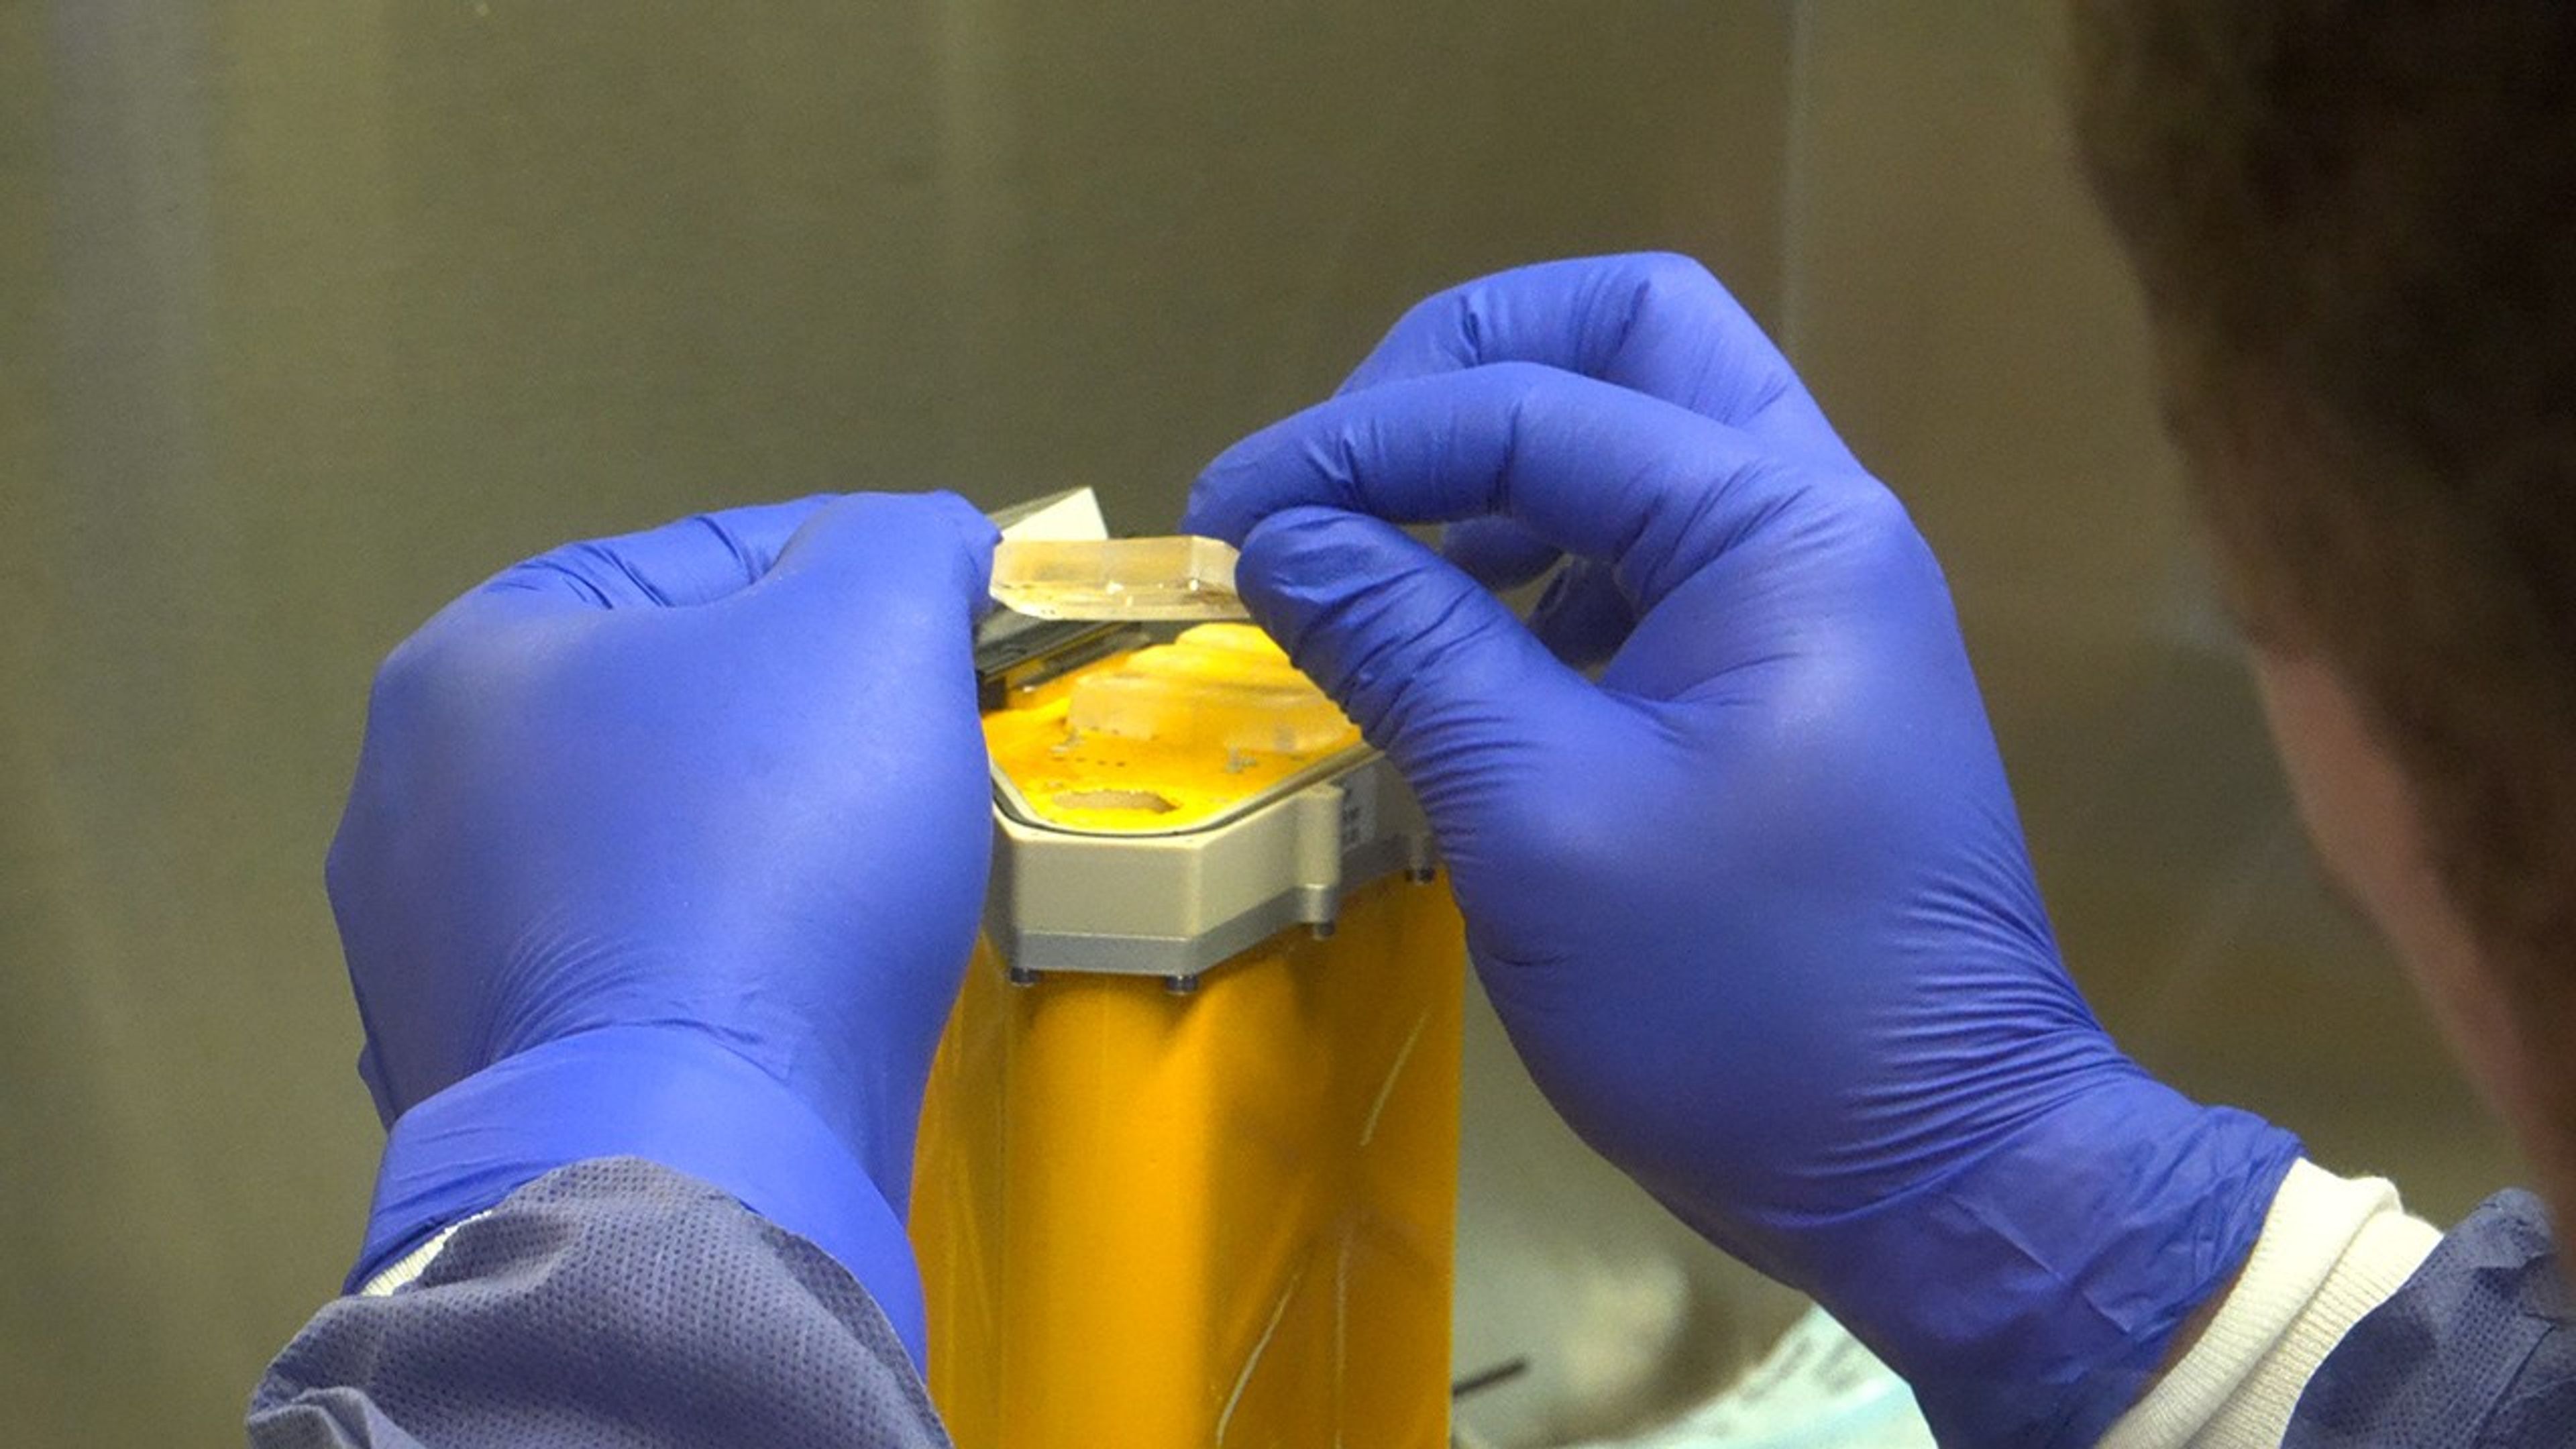
A scientist handles AVATAR organ chips following their journey around the Moon aboard Orion. The chips contain cells from each astronaut and are being prepared for detailed analysis.
NASA
Organ chips from NASA’s AVATAR (A Virtual Astronaut Tissue Analog Response) investigation are being analyzed at chip developer Emulate’s laboratory in Boston. The organ chips included bone marrow cells from each Artemis II astronaut. They flew around the Moon with the astronauts, and now researchers are studying these organ chips to determine how deep space radiation and microgravity affect human health at the molecular level.
Scientists are comparing the chips flown aboard the spacecraft to ground controls and crew blood samples using advanced techniques, including single-cell RNA sequencing. The analysis will characterize how organ chips model individual responses to spaceflight, which is data that could allow NASA to send future astronauts’ AVATAR chips ahead on missions to develop personalized medical kits. The researchers plan to share early findings at scientific conferences while full analysis continues.
Lunar imagery, audio for data release
In this April 3, 2026, image, the Artemis II lunar science team is shown working in the Science Evaluation Room in the Mission Control Center at NASA’s Johnson Space Center in Houston. The team is putting together a plan of science observations for the Artemis II crew, which was headed toward the Moon aboard Orion. As they passed the Moon at closest approach on April 6, the crew applied the geology skills they learned in the classroom and in Moon-like environments on Earth as they photographed and described nuances of geologic features such as impact craters, ancient lava flows, and surface cracks and ridges. The crew noted differences in color, brightness, and texture — details that provide clues to surface composition and history.
NASA/Bill Stafford
On April 6, the Artemis II crew members studied features on and around the Moon for nearly seven hours during Orion’s closest approach to the lunar surface. Their work was guided by a minute-by-minute observation plan developed by the Artemis II lunar science team.
Scientists are reviewing the data collected from the mission, which includes images, video, and audio files, to release a report of their initial data interpretations later this year. The report will cover observations of impact flashes, variations in color on the lunar surface, and the shape and texture of faults and ridges. The team also will publish a report on how Artemis II lunar science observations were planned, organized, and executed for the benefit of future Artemis missions.
NASA will publish more than 100 science-related audio recordings with transcripts, as well as approximately 11,500 Earth and Moon image and video files from the mission science campaign, with accompanying data. While many of these images already are public, these records will be available through NASA’s Planetary Data System, a public archive of data from all of NASA’s planetary missions. To get the data ready, the team is converting files into standard formats that anyone can easily open and add information to make the data searchable in NASA’s archive for generations to come.
For more information on NASA’s Artemis II science efforts, visit:
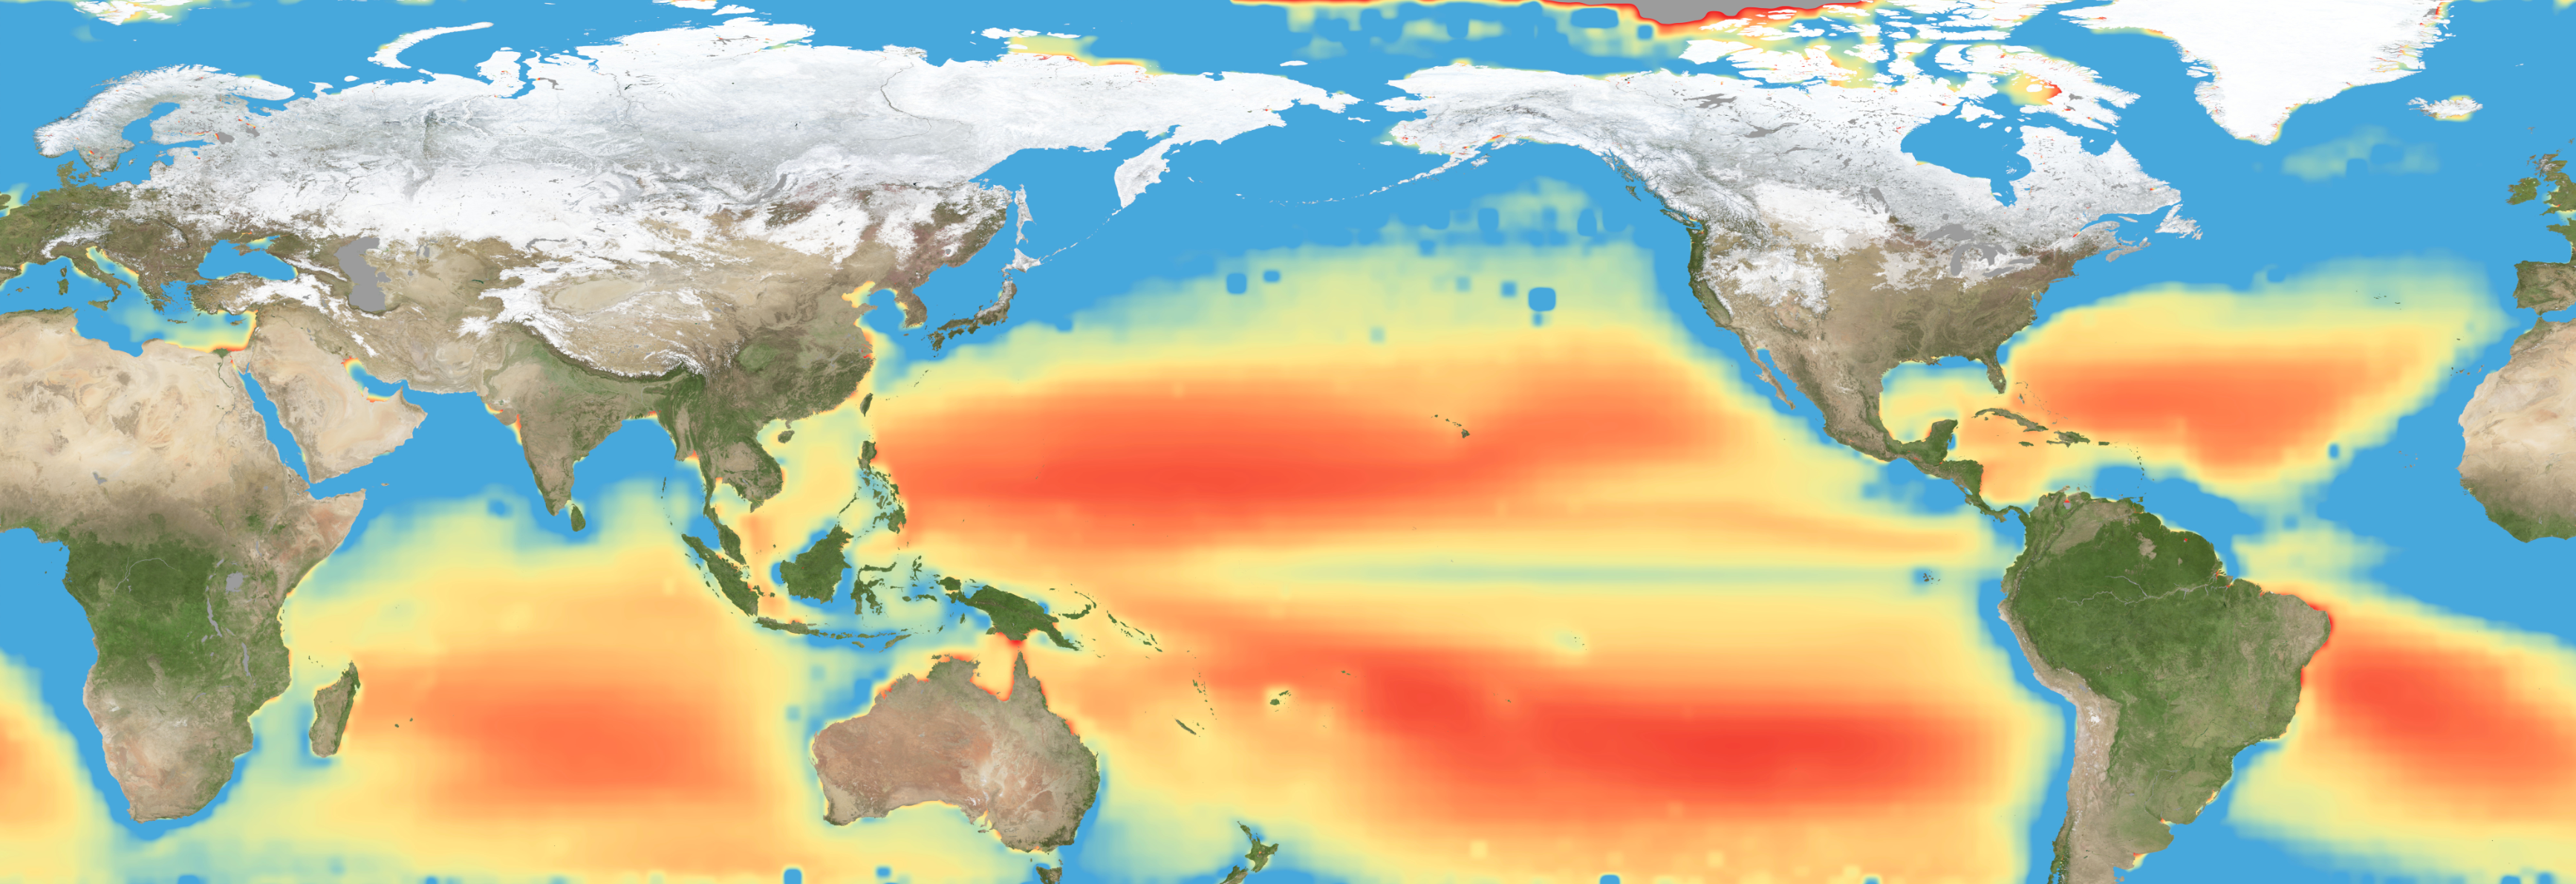
Warming waters decrease upwelling and lead to stress on marine microorganisms due to limited availability of vital nutrients. Red indicates the regions of highest nutrient-related stress.
Kel Elkins/NASA’s Scientific Visualization Studio
Editor’s note: This article was updated on June 5.
A new study combining NASA satellite observations, ocean surveys, and genetic testing on marine microorganisms found evidence that warming ocean waters may be limiting nutrient availability across much of the global ocean. The researchers report that this nutrient stress affects microscopic marine organisms and could influence marine ecosystems over time.
The research, published June 5 in Science Advances, tracked the condition of phytoplankton, which form the base of ocean food webs. Rather than measuring nutrients like nitrogen, iron, and phosphorus directly, the researchers inferred stress by tracking subtle shifts in the ratio of carbon to chlorophyll in phytoplankton observed from space. When the amount of chlorophyll decreases relative to carbon as seen in satellite data, it’s an indication that the plankton are stressed.
“As our ocean continues to change, the ability to observe and track ocean conditions through sustained, high quality remote sensing observations has never been more important,” said Laura Lorenzoni, Program Scientist for NASA’s Ocean Biology and Biogeochemistry Program at NASA Headquarters in Washington. “This is fundamental, as plankton communities are the base of the marine food web on which important economic activities rely.”
The research team combined two decades of data from NASA’s Aqua satellite’s Moderate Resolution Imaging Spectroradiometer (MODIS) sensor with plankton samples collected on research cruises around the world. The approach linked large-scale satellite observations with genetic markers in Prochlorococcus, a tiny but abundant marine microbe that shows signs of nutrient stress in its DNA. The result is a global map revealing where phytoplankton are thriving and where they’re struggling.
Ocean chlorophyll, as observed with NASA's Moderate Resolution Imaging Spectroradiometer (MODIS) instrument between January 2010 through May 2016.
Marit Jentoft-Nilsen/NASA's Goddard Space Flight Center
The strongest indications of nutrient stress on plankton appeared in the subtropical gyres, which are vast, relatively calm regions of the Atlantic, Pacific, and Indian oceans. In these areas, a layer of warm surface water stifles the flow of colder water from deeper in the ocean.
“When the surface of the ocean warms, it generates this very stable situation where a layer of low-density water sits on top of higher-density cold water,” said study coauthor Adam Martiny, an oceanographer at the University of California, Irvine. “You’ve probably experienced that if you’ve ever been to a lake in the summertime—it’s super warm right on the surface, and very cold deeper down when you stick your legs in.”
This layering blocks the upward flow of nutrient-rich water, limiting the availability of ocean surface nutrients that are crucial for plankton. In the South Pacific, one of the most nutrient-poor regions, a layer of warm surface water contributed to nitrogen and iron shortages, producing the most severe nutrient-related stress that the team discovered.
But the researchers were surprised to find that parts of the North Atlantic experience less nutrient stress than expected. Although there was evidence of a lack of phosphorus, the impact on microorganisms was comparatively mild.
That difference may reflect the biology of the organisms themselves. Phytoplankton can partially compensate for phosphorus shortages by recycling phosphorus more efficiently or replacing phosphorus-rich molecules inside their cells. Nitrogen shortages are harder to overcome because nitrogen is crucial for the proteins and cellular machinery required for photosynthesis and nutrient uptake.
The study revealed that nutrient stress is strongly correlated with seasons and major weather cycles such as El Niño and the Pacific Decadal Oscillation, which lead to warming waters in the Pacific Ocean. During La Niña events, which cool water over a large part of the Pacific, stronger upwelling brought more nutrients to surface waters and reduced stress in some regions. Superimposed on those multi-year cycles, however, was a longer-term trend.
From 2002 through 2021, average sea-surface temperatures increased across nearly 90% of the ocean area examined in the study. Over the same period, nutrient stress generally intensified, consistent with previous hypothesis that warming oceans may become increasingly stratified and less able to replenish surface nutrients.
In many nutrient-poor regions of the Southern Hemisphere, however, the researchers found evidence that nutrient stress had not increased as much as expected despite significant warming. They suspect that microbes capable of capturing nitrogen from the air may partially offset the effects of reduced nutrient mixing.
That finding hints that marine ecosystems may possess more resilience to warming climates than some models predict. It also underscores the complexity of forecasting how ocean biology will respond to continued warming.
“We have two really powerful tools,” said study coauthor Michael Behrenfeld, a biochemist with Oregon State University in Corvallis, Oregon. The tools include satellite observations and cellular studies. “Both produce big data sets, but they are kind of opposites. We have very detailed data about microscopic phytoplankton … and then we have global coverage with satellites.”
By combining satellites that monitor the entire ocean with genetic clues carried inside microscopic plankton, the researchers say they are gaining a new way to track biological responses to changing environmental conditions near real time.

 Login