❌

Reading view

Hints for Massive Galaxy Evolution from Dusty Star-Forming Galaxies

NGC 972

How do massive galaxies form and evolve? A recent study traces the stellar and dust distributions across evolutionary phases of massive galaxies to better understand how massive dusty star-forming galaxies fit into the picture.

Dusty Massive Galaxies

Massive galaxies, like the Milky Way or even larger, undergo phases of active star formation and quiescent phases of inactivity, but exactly how these galaxies evolve through these stages is not yet fully understood. Dusty star-forming galaxies, which are undergoing a period of intense star formation and shrouded in dust, might be the missing evolutionary step between star-forming and quiescent phases of massive galaxy evolution. 

Currently, the leading explanation for massive galaxy formation and evolution is inside-out growth — star formation and quenching start in the inner regions of a galaxy and progress outward. However, it’s not clear whether dusty star-forming galaxies also follow the favored inside-out pathway, or if they instead proceed outside-in, first growing their disks and then assembling a central bulge.
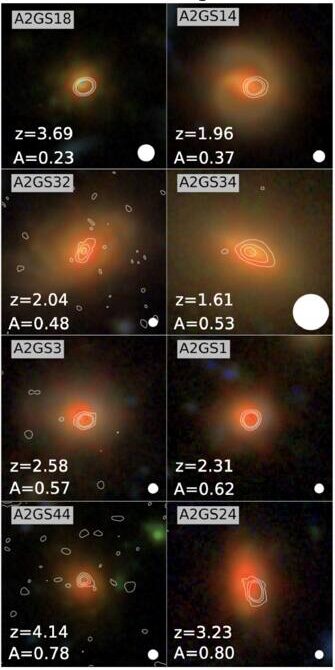
JWST NIRCam images

Example of JWST NIRCam images with ALMA contour lines overlaid for select dusty star-forming galaxies in the sample. [Modified from Bodansky et al 2026]

The spatial distribution (or morphology) of the stars and dust within dusty massive galaxies can help us trace their evolution. Thanks to high-resolution observations from JWST and the Atacama Large Millimeter/submillimeter Array (ALMA), researchers can now directly compare the morphologies of distant star-forming, quiescent, and dusty galaxies during the height of our universe’s star formation. Filling this gap will reveal how dusty star-forming galaxies may connect star-forming and quiescent galaxies in massive galaxy evolution.

Multiwavelength Morphological Comparisons

To directly compare the star and dust morphologies across massive galaxies, Sarah Bodansky (University of Massachusetts, Amherst) and collaborators selected a sample of 33 dusty star-forming galaxies from the GOODS-ALMA 2.0 survey that searched the sky for 1.1-mm dust emission as well as star-forming and quiescent comparison samples drawn from JWST observations. Combining the ALMA survey data with JWST imaging, the authors studied the rest-frame optical (stars) and rest-frame near-infrared (dust) morphologies of dusty, star-forming, and quiescent galaxies at redshifts around cosmic noon (a few billion years after the Big Bang).

When comparing optical morphologies, the authors found that dusty star-forming galaxies and typical star-forming galaxies had similar distributions, but their near-infrared morphologies showed clear differences. Dusty galaxies tended to show more compact near-infrared emission, with dust tracing their stellar populations and more concentrated in the galaxies’ central regions. Though clearly different from star-forming galaxies, the authors noted striking similarities between the near-infrared morphologies of the dusty star-forming and quiescent galaxies, especially within their centers.
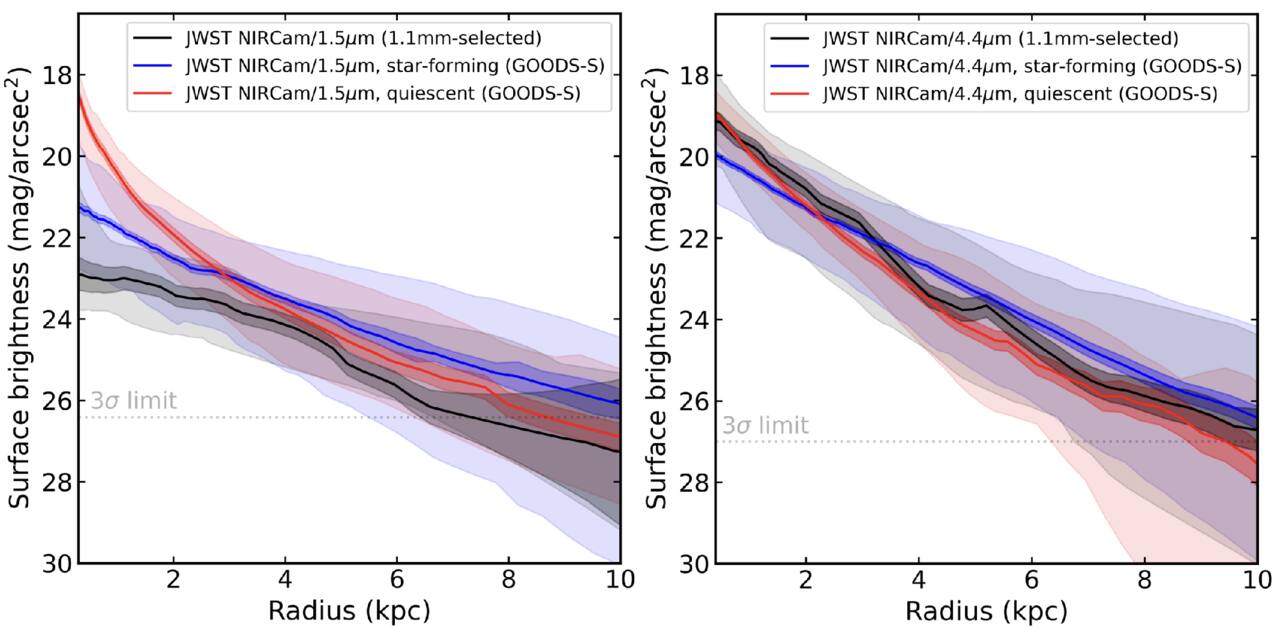
Surface brightness profiles

Average surface brightness profiles for the rest-optical (left) and rest-near-infrared (right) for the dusty (black), star-forming (blue), and quiescent (red) galaxies. In the near-infrared, the dusty star-forming galaxy profile appears very similar to the quiescent galaxy profile. [Bodansky et al 2026]

All of these properties suggest that dusty star-forming galaxies have built up stellar mass and dust in their cores, potentially forming a central bulge first and supporting an inside-out model of massive galaxy growth. This points to dusty star-forming galaxies as possible direct progenitors of early massive quiescent galaxies, hanging onto their last bit of star formation before becoming quiet as well. While this study morphologically distinguishes dusty galaxies from their star-forming and quiescent counterparts, future spectroscopic studies comparing the kinematics of these populations and investigations of molecular gas distributions are necessary to better pin down the evolutionary connection between star-forming, dusty, and quiescent massive galaxies.

Citation

“JWST+ALMA Reveal the Buildup of Stellar Mass in the Cores of Dusty Star-forming Galaxies at Cosmic Noon,” Sarah Bodansky et al 2026 ApJ 1001 235. doi:10.3847/1538-4357/ae4f64

The post Hints for Massive Galaxy Evolution from Dusty Star-Forming Galaxies appeared first on AAS Nova.

  •  

Simulations of Turbulent Mixing Close One Gap but Open Another

illustration of a white dwarf surrounded by rocky debris

Nature sometimes behaves in ways that are difficult to recreate in simulations. New research tackles the computational challenge of turbulent mixing and rules out a commonly assumed source of data–model disagreement.

Mixing Up Stellar Interiors

What do Earth’s oceans, red giant stars, and white dwarfs have in common? These are all sites of thermohaline mixing, a form of turbulent mixing that takes place when there is a vertical gradient in both temperature and chemical composition. For example, in Earth’s oceans, water near the surface is warmer and saltier than water in the depths below, setting up an unstable situation prone to mixing.

thermohaline mixing simulation results

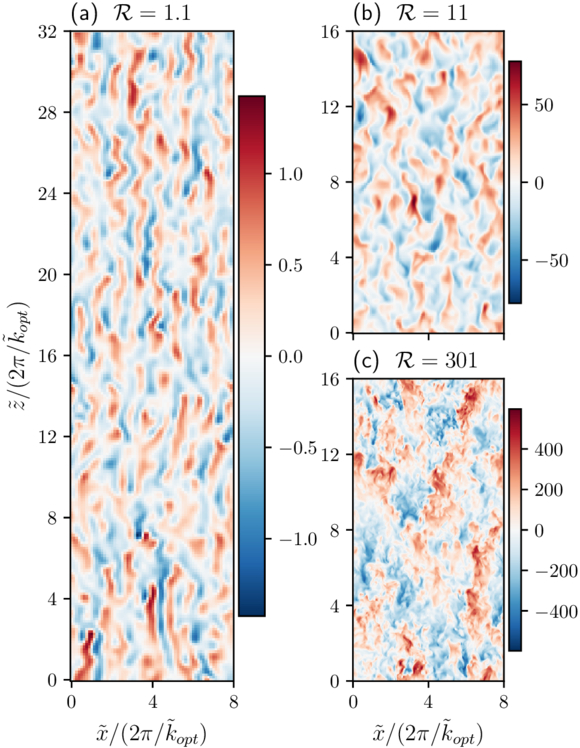
Examples of simulated thermohaline convection. These snapshots show the vertical velocity across a slice through the simulation volume. Click to enlarge. [Fraser 2026]

Thermohaline mixing has been explored in simulations to explain the evolution of red giants’ surface abundances, as well as how quickly rocky debris that accretes onto a white dwarf is absorbed into the star. However, effectively modeling this process in the interiors of stars has proven difficult.

One of the most important parameters for modeling mixing is the Prandtl number, Pr, which is the ratio of viscosity to thermal diffusivity (in other words, a way of describing whether momentum or heat diffuses more quickly within a fluid). For stellar interiors, Pr is around 10−6, but computational limitations have prevented modelers from setting this value lower than around 10−2. When tensions between models and reality arise, this gap between simulated and realistic Pr values is often assumed to be the source of the mismatch.

Bridging the Prandtl Number Gap

In a recent research article, Adrian Fraser (University of Colorado Boulder) aimed to test this assumption. Fraser carried out 3D simulations of thermohaline mixing, using a semi-implicit modeling technique that lowered the computational cost and allowed the simulations to probe Pr values of 10−1, 10−2, 10−3, 10−6, and 0.

comparison of simulations from this work and the benchmark model of thermohaline convection

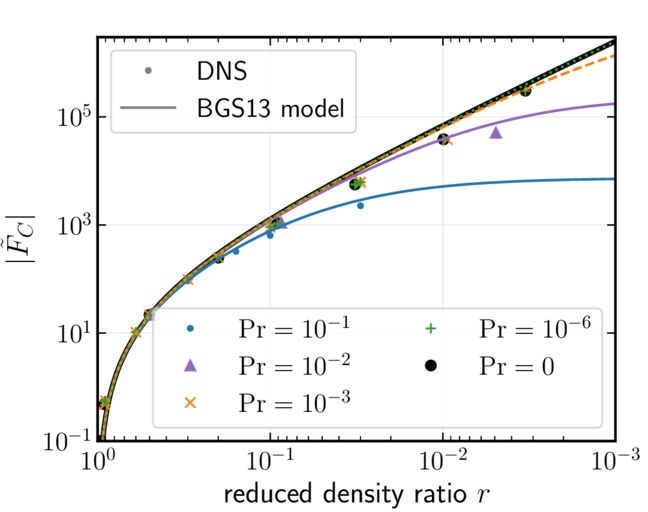
Turbulent compositional flux as a function of reduced density ratio for the simulations from this work (DNS) and the benchmark model of thermohaline convection (BGS13). Click to enlarge. [Adapted from Fraser 2026]

By comparing these results against a benchmark model of thermohaline mixing, this exploration showed that adopting a realistic value of Pr doesn’t dramatically change the dynamics of the system — meaning that data–model incompatibilities can’t be swept under a Prandtl number–shaped rug and must instead be resolved by including additional physics.

Recreating Reality

Where does this leave modelers attempting to recreate the reality of stellar interiors? First, a silver lining of this investigation: Fraser found that setting Pr = 0 delivered nearly identical results to Pr = 10−6. This suggests that valid results can be attained in a much less computationally intensive way, since setting Pr = 0 lowers the complexity of the simulation. While simulations with Pr = 0 may not be appropriate for all scenarios, including systems with strong magnetic fields, it may provide a way forward in certain situations.

For modeling of red giants and white dwarfs, Fraser suggested that incorporating magnetic fields, stellar rotation, or additional sources of mixing may resolve the current discrepancies. In fact, some modeling work has shown that magnetic fields could entirely close the gap between observations and models for red giant surface abundances — suggesting that bringing models and observations into agreement may be within reach.

Citation

“Bridging the Prandtl Number Gap: 3D Simulations of Thermohaline Convection in Astrophysical Regimes,” Adrian E. Fraser 2026 ApJL 1001 L22. doi:10.3847/2041-8213/ae5796

The post Simulations of Turbulent Mixing Close One Gap but Open Another appeared first on AAS Nova.

  •  

Featured Image: Galaxies Caught in Transition

images of six galaxies

How does environment shape a galaxy’s growth and evolution? This is the question explored in a recent study led by Gissel Montaguth (University of São Paulo). Montaguth’s team examined nearly 4,000 galaxies in low-mass, high-mass, and compact galaxy groups, as well as galaxies adrift in the field without belonging to a group. The sampled galaxies were classified as early-type, late-type, transition (generally disk galaxies with quenched star formation), or other (generally elliptical but with lingering star formation). The image above shows six transition galaxies from the sample, three of which show signs of past disturbances (top row). The team found that early-type and “other” galaxies were resilient to changes in environment, but late-type and transition galaxies could be affected by life in close groups. Late-type galaxies in compact groups tended to be somewhat smaller than their loosely grouped or field galaxy counterparts, while transition galaxies showed a significantly steeper stellar mass–size relation in group environments and smaller sizes in groups than in the field. This suggests that transition galaxies are strongly influenced by interactions, mergers, and processes like disk truncation. To learn more about the impact of environment on galaxy properties, be sure to check out the full article linked below.

Citation

“Galaxies Caught in Transition: The Role of Group Environment in Shaping the Mass–Size Relation in the Local Universe,” Gissel P. Montaguth et al 2026 ApJ 999 160. doi:10.3847/1538-4357/ae42ca

The post Featured Image: Galaxies Caught in Transition appeared first on AAS Nova.

  •  

In or Out? Using Balmer Emission to Distinguish Inflows from Outflows

M33

Galaxies pull in and pump out gas as they form and evolve, but distinguishing between the two directions is tricky. A recent study used emission lines and dust absorption to try to pin it down.

Inflow or Outflow?

Throughout their lives, galaxies churn gas into stars, stars fuse new metals, supernovae blow enriched material back out, and the cycle repeats. To maintain this process and sustain star formation, a galaxy must fuel up by accreting gas from its surroundings. However, catching galactic gas accretion has proven difficult — both emission from gas falling into the galaxy (inflows) and gas blown out by supernovae (outflows) can appear blueshifted or redshifted along an observer’s sight line, depending on if the flowing material is in front of or behind the galaxy.

While direct evidence of inflows has been identified in the Milky Way, only a few direct detections of inflowing gas in other galaxies exist due to the degeneracy of inflow and outflow emission-line features. Relying on additional absorption measurements, some studies have teased out inflows in other galaxies, but these star formation fuel pumps remain overwhelmingly evasive. The angle at which we observe a galaxy also limits our ability to detect both inflows and outflows, with face-on galaxies best oriented to detect these shifted spectral features. How then do we uncover this critical component of a galaxy’s evolution?

Breaking Through with the Balmer Decrement

Balmer decrement diagram

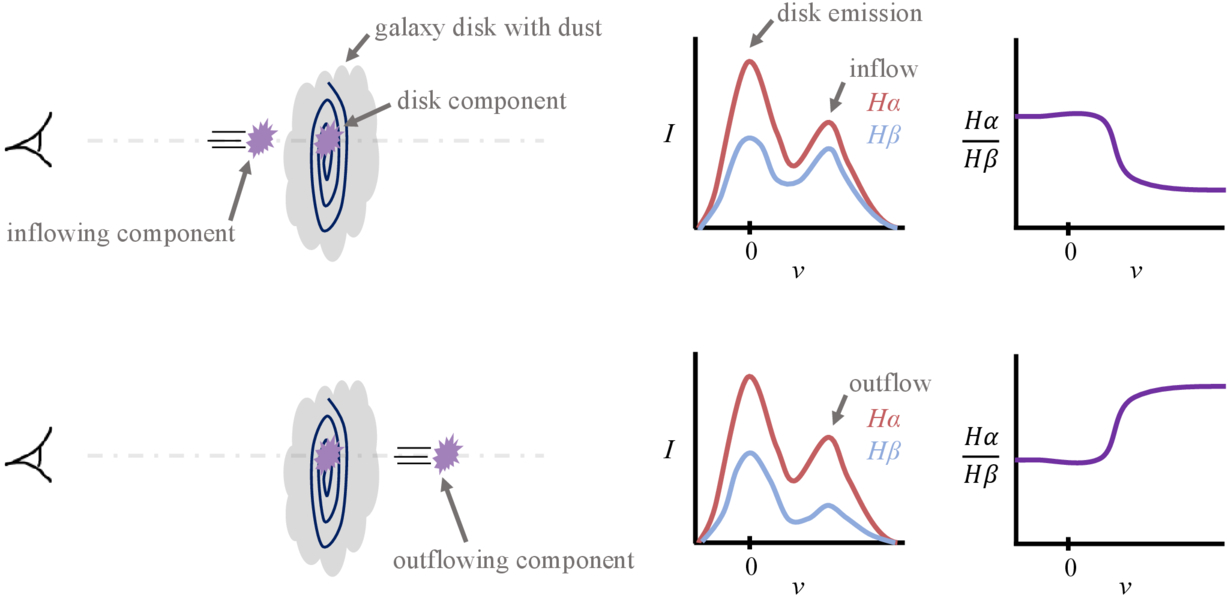
A diagram illustrating the degeneracy in emission spectra of galaxies, with the top panel showing an inflowing component and the bottom panel showing an outflowing component. While the Hα emission is similar, the Hβ emission is more affected by extinction due to dust in the galaxy’s disk, making it possible to identify inflow versus outflow based on the Balmer decrement. Click to enlarge. [Sitaram et al 2026]

To try to break through the confusion between inflows and outflows, Meghna Sitaram (Columbia University) and collaborators explored how the strengths of hydrogen emission lines vary depending on the location of the emitting gas. Referred to as the Balmer decrement, the ratio between the Hα (redder) and Hꞵ (bluer) emission lines is sensitive to dust between the emitting gas and the observer. Because dust preferentially absorbs bluer photons, an inflow or outflow behind a galaxy is expected to have a higher Hα/Hꞵ ratio due to the intervening dust in the galaxy’s disk absorbing some of the Hꞵ emission.

Testing this idea, the authors performed a hydrodynamic simulation of an isolated, face-on Milky Way–like galaxy and tracked inflows and outflows over a billion years. From the simulation, they extracted mock spectral observations to measure the ionized gas motions and Hα and Hꞵ emission lines along different sight lines throughout the galaxy. Separating gas components into three categories — inflow, outflow, and in the disk — the authors found that dust extinction does cause noticeable differences in the Balmer decrement depending on a component’s location with respect to the disk.

histograms

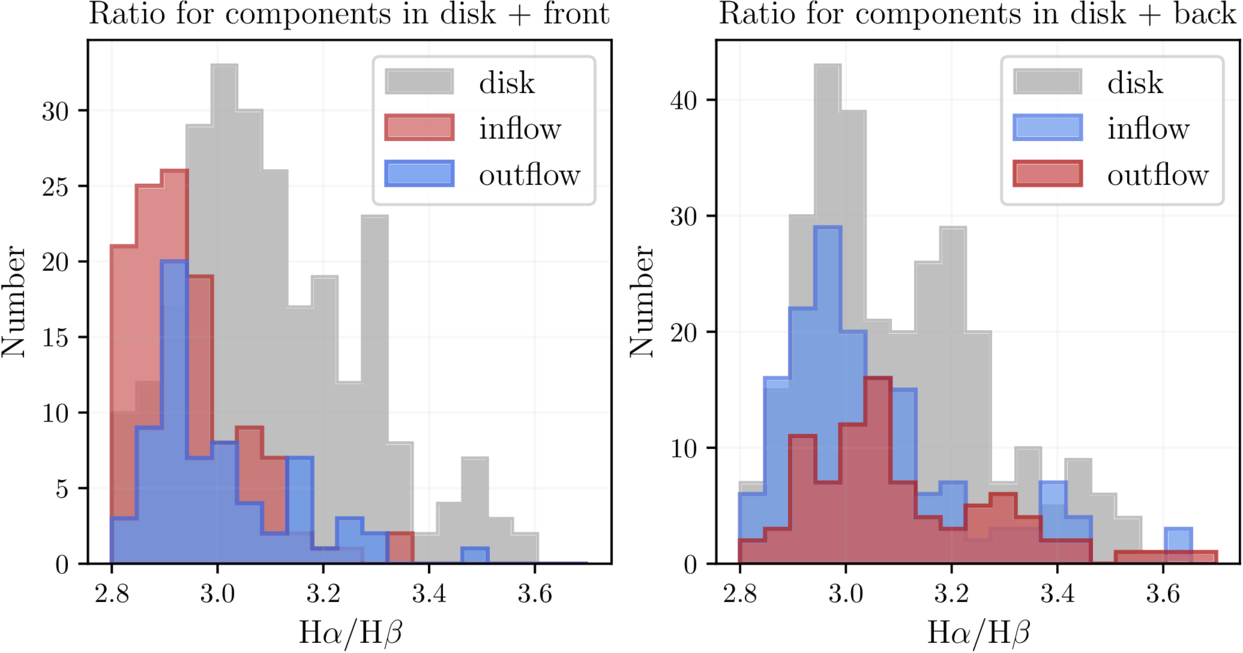
The distribution of Balmer ratios between different components in the interstellar medium and in front of the galaxy (left) and behind the galaxy (right). Material in front of the galaxy shows lower Hα/Hβ ratios. Click to enlarge. [Sitaram et al 2026]

Front Inflow Finds

What does this mean for identifying the inflows that provide galaxies with star-forming fuel? The authors reported that components in front of the galaxy — redshifted inflows and blueshifted outflows — tend to exhibit lower Hα/Hꞵ ratios compared to components behind the disk, aligning with the expectation that dust in the disk absorbs Hꞵ. In particular, these front inflows appear to be the most readily distinguished from gas in and behind the galaxy’s disk.

However, things get more complicated for gas behind the galaxy. Because the dust in the simulation is distributed nonuniformly in small clumps throughout the galaxy, it is difficult to distinguish between disk gas and gas behind the galaxy. While future simulations with improved dust modeling are necessary to resolve this issue, this study offers a useful method to distinguish inflow and outflow in dusty face-on galaxies.

Citation

“Identifying Signatures of Inflow onto Face-On Galaxies Using Balmer Decrement,” Meghna Sitaram et al 2026 ApJ 1001 87. doi:10.3847/1538-4357/ae5222

The post In or Out? Using Balmer Emission to Distinguish Inflows from Outflows appeared first on AAS Nova.

  •  

Water Vapor Around a Sizzling Supergiant: High-Resolution Spectroscopy of B[e] Supergiant LHA 115-S 18

blue supergiant

Prior to exploding, massive stars advance through action-packed evolutionary stages that are exciting but often difficult to fully decipher. A recent study focuses on a unique late-stage star to better understand its properties and evolution.

To B[e] a Supergiant

HD 62623 disk image

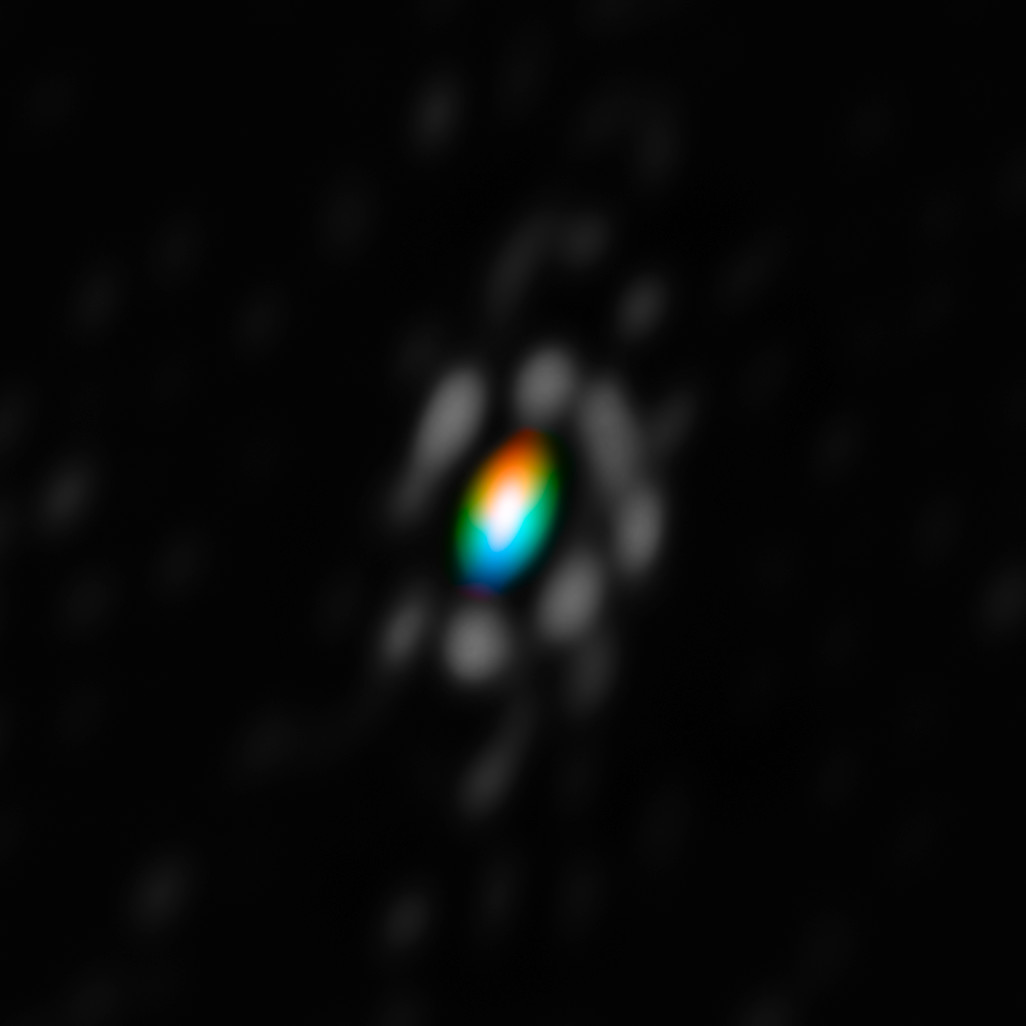
Very Large Telescope Interferometer image of the circumstellar disk around the B[e] supergiant star HD 62623. The colors indicate the rotation of the disk with blue coming toward us and red going away. [ESO/F. Millour; CC BY 4.0]

After depleting their cores of hydrogen, massive stars journey off the main sequence through a series of evolutionary phases before ending in dramatic supernova explosions. A massive star’s post-main-sequence evolution is intense, often sloughing off layers of material that can settle into a circumstellar disk. The B[e] supergiant phase describes a blue supergiant star surrounded by a cool, dense circumstellar disk where oxygen is more abundant than carbon. These environments often lock up carbon atoms in carbon monoxide molecules, leaving excess oxygen available to form other molecules including SiO, TiO, and water vapor. These molecules can survive under different physical conditions, making them key tracers of the environments around B[e] supergiants.

One particularly interesting B[e] supergiant, LHA 115-S 18, has been the subject of numerous studies but remains poorly constrained. The star exhibits significant variability both in brightness and emission features on timescales of days to years, and previous works have suggested that the star may have an as-yet unconfirmed binary companion. Molecular line emission from CO and TiO have been identified in LHA 115-S 18, indicating a circumstellar disk, but to date, water vapor emission has not been identified in any B[e] supergiant. Identifying more complex oxygen-bearing molecules like water will further reveal the physical properties and possible binary companion of LHA 115-S 18.

Identifying Emission in LHA 115-S 18

To characterize the emission around LHA 115-S 18, María Laura Arias (Institute of Astrophysics La Plata; National University of La Plata) and collaborators obtained high-resolution near-infrared spectroscopy of the star using the Immersion Grating Infrared Spectrometer on the Gemini South telescope. From the high-resolution spectra, the team identified several atomic emission lines indicative of the star’s gaseous envelope, revealing the structure of material around the star: an inner hot disk of ionized material and an outer cool disk of neutral material. Looking at molecular emission from carbon monoxide — a tracer of both gas motions and stellar age — the authors confirmed the presence of a rotating ring of gas around LHA 115-S 18 and determined that the star is an evolved, post–red supergiant object.

LHA 115-S 18 spectrum

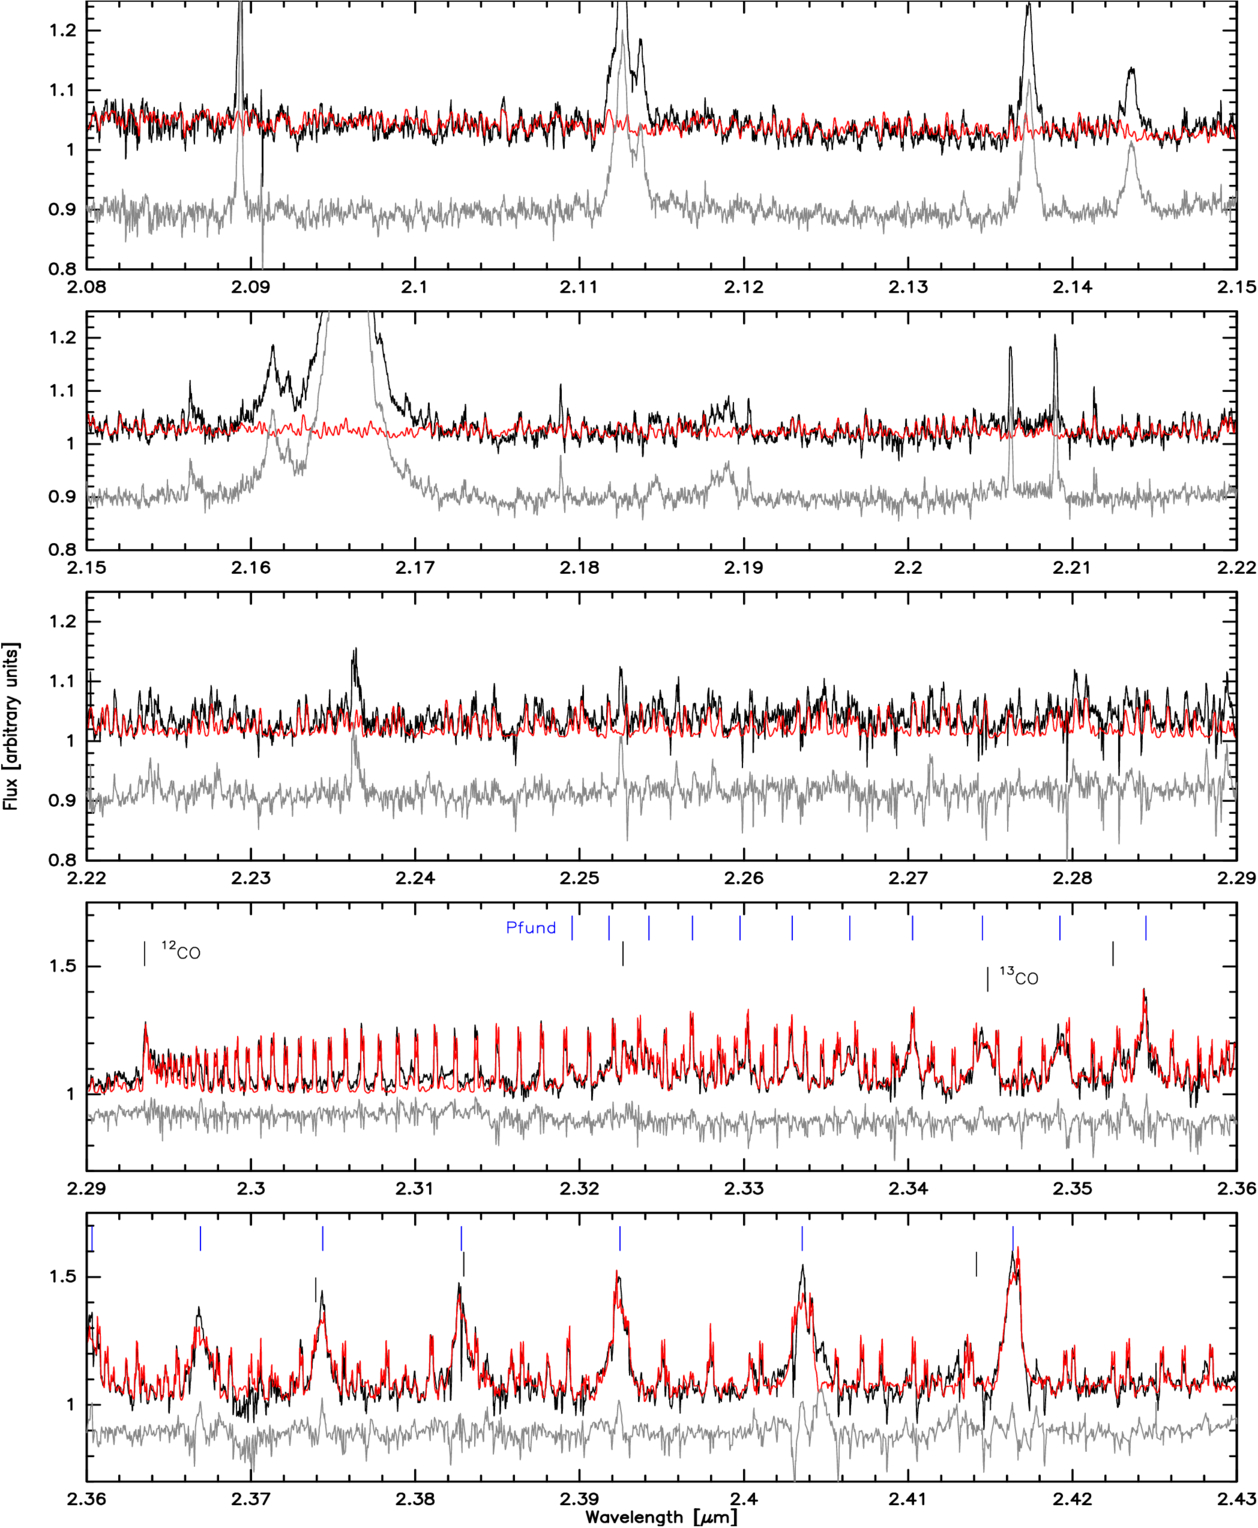
Spectrum of LHA 115-S 18 (black) with the model spectrum composed of water vapor (red, top three panels) and water vapor, CO, and hydrogen emission (red, bottom two panels) overplotted as well as residuals (gray). [Arias et al 2026]

Through computing a synthetic spectrum to compare to the observed spectrum, the authors identified many water vapor emission lines in the circumstellar environment around LHA 115-S 18. While water vapor has been detected in other evolved late-type stars, this is the first detection of water vapor from a B[e] supergiant star. For water vapor to survive the star’s intense radiation, it must exist in a dense, cool, heavily shielded disk around the B[e] supergiant.

Sustaining a cool disk around such a hot star indicates that the circumstellar environment around LHA 115-S 18 is complex and likely shaped by binary interaction. With emission features characteristic of both cool and hot evolved stars, this particular B[e] supergiant presents itself as a unique object holding critical insights into the late-stage evolution of massive stars. Further multiwavelength observations of LHA 115-S 18 will constrain its potential binarity and reveal a possible evolutionary link between B[e] supergiants and other late-stage evolutionary phases of massive stars.

Citation

“High-resolution Near-Infrared Spectroscopy of the B[e] Supergiant LHA 115-S 18: Discovery of Hot Water Vapor Emission,” María Laura Arias et al 2026 ApJL 1000 L49. doi:10.3847/2041-8213/ae524a

The post Water Vapor Around a Sizzling Supergiant: High-Resolution Spectroscopy of B[e] Supergiant LHA 115-S 18 appeared first on AAS Nova.

  •  

Featured Image: Rare Giant Galaxies

low-surface-brightness galaxies

Giant low-surface-brightness galaxies are rare and unusual members of the galactic menagerie. They host the largest galactic disks currently known, have baryonic masses of order 100 billion solar masses, and sport narrow, tightly wound spiral structures. The origins of these vast galaxies — they can be up to 10 times larger than the Milky Way — are unknown, though various theories involving mergers, accretion, and strange dark matter halos exist. Research also suggests that there may be a connection between these galaxies and compact ellipticals, which are small, dense, and contain old stars. In a recent article, a team led by Anna Saburova (Sternberg Astronomical Institute) investigated two giant low-surface-brightness galaxies with compact elliptical companions. In the image above, the colored circles represent the oxygen abundance at each location in AGC 192040 (left) and UGC 1382 (right). The red arrows point to the compact elliptical companions. Using the chemical abundance information to investigate possible formation mechanisms, Saburova and collaborators found that the two galaxies likely formed in different ways. UGC 1382 appears to be the result of multiple mergers, while AGC 192040 may have accreted gas from its halo or a galactic filament before undergoing a merger of its own. To learn more about this study of two rare galaxies, be sure to check out the full research article linked below!

Citation

“MUSE Study of Two Giant Low-Surface-Brightness Galaxies with Compact Satellites,” Anna S. Saburova et al 2026 ApJ 998 19. doi:10.3847/1538-4357/ae3139

The post Featured Image: Rare Giant Galaxies appeared first on AAS Nova.
  •  

Featured Image: Galaxy Cluster in Technicolor

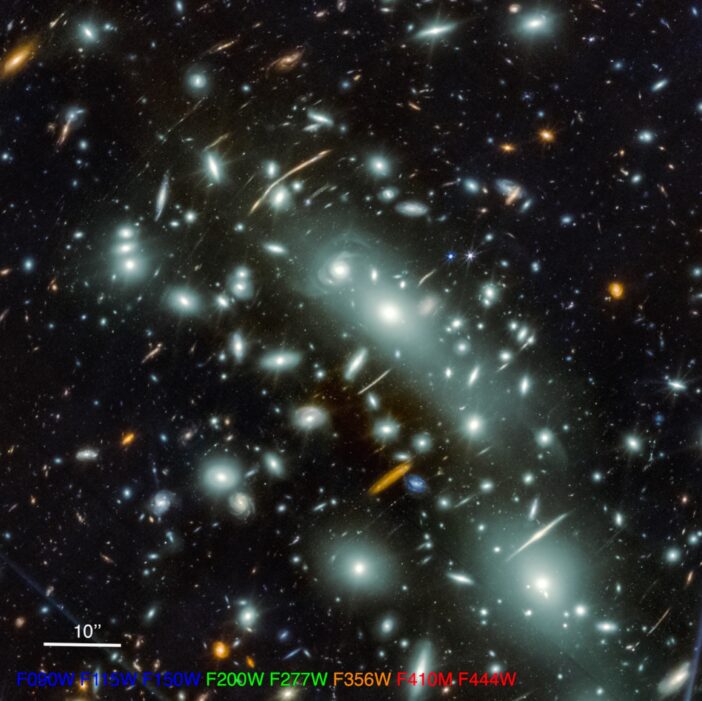
galaxy cluster MACS0416

The expansive collection of galaxies pictured here is MACS J0416, a galaxy cluster located about 4.3 billion light-years away. (Click the image for the full view!) MACS J0416 is one of five clusters targeted by the Canadian NIRISS Unbiased Cluster Survey (CANUCS). This survey takes advantage of the spacetime-bending abilities of massive galaxy clusters and uses JWST’s Near-Infrared Imager and Slitless Spectrograph (NIRISS) and Near-Infrared Camera (NIRCam) to paint a detailed multi-wavelength portrait of galaxies in the early universe. Three of the CANUCS galaxy clusters, including MACS J0416, were investigated even more closely in the follow-up JWST in Technicolor program, which added precise spectroscopic redshifts and broadened the wavelength coverage of parallel fields of view. In a recent publication led by Ghassan Sarrouh (York University), the CANUCS team outlined the design of these programs and their data products, which enabled the study of roughly 53,000 galaxies within the galaxy cluster fields and an additional 44,000 galaxies in adjacent fields. To learn more about the CANUCS and JWST in Technicolor programs, be sure to check out the full research article linked below.

Citation

“CANUCS/Technicolor Data Release 1: Imaging, Photometry, Slit Spectroscopy, and Stellar Population Parameters,” Ghassan T. E. Sarrouh et al 2026 ApJS 282 3. doi:10.3847/1538-4365/ae1611

The post Featured Image: Galaxy Cluster in Technicolor appeared first on AAS Nova.
  •  

Selections from 2025: The Nine-Ringed Bullseye Galaxy

Bullseye galaxy

Editor’s Note: For the remainder of 2025, we’ll be looking at a few selections that we haven’t yet discussed on AAS Nova from among the most-downloaded articles published in AAS journals this year. The usual posting schedule will resume January 2nd.

The Bullseye: HST, Keck/KCWI, and Dragonfly Characterization of a Giant Nine-ringed Galaxy

Published February 2025

Main takeaway:

Bullseye galaxy rings

Red ellipses overplotted on the first eight rings identified with Hubble in the Bullseye galaxy. Click to enlarge. [Pasha et al 2025]

Using a combination of the Hubble Space Telescope, the Dragonfly Telephoto Array, and the Keck Cosmic Web Imager, Imad Pasha (Yale University) and collaborators discovered and performed deep follow-up observations of a giant collisional ring galaxy aptly nicknamed the “Bullseye” galaxy (LEDA 1313424). The team identified a staggering nine rings in the Bullseye with a likely tenth that has since faded — the most rings found in any collisional ring galaxy to date. The rings are a result of a small blue dwarf galaxy shooting through the Bullseye’s core about 50 million years ago, sending ripples through the galaxy.

Why it’s interesting:

Galaxy mergers and interactions are commonplace in the universe, but it is very rare for a dwarf galaxy to strike right through a large galaxy’s core. When this does happen, the collision sends shock waves through the impaled galaxy, sweeping gas and dust outward and forming rings where star formation can occur (hence the name, collisional ring galaxy). These galaxies are valuable sites to explore galactic structure and evolution as well as provide a unique case to study galaxy mergers and interactions. Previously discovered collisional ring galaxies have at most two or three rings, so when Pasha and collaborators found the stunning nine in the Bullseye, it was clear they caught something significant.

Catching the Bullseye at a lucky time in its evolution:

Why does the Bullseye have so many rings? Theoretical studies of these head-on collisions predict that many rings will form and travel outward after the initial crash; however, the rings tend to dissolve after only a few hundred million years. Catching this collision only 50 million years after it happened means we are witnessing the earlier stages of the Bullseye’s evolution. This lucky discovery not only confirms theoretical predictions for collisional ring galaxies, it also may be a clue to how another unique galaxy type, giant low-surface brightness galaxies, originate. Given the wispy ring material found at very large radii from the Bullseye, the authors suggested that collisional ring galaxies may evolve into giant low-surface brightness galaxies as they expand outward and fade. Further investigation and a larger sample of collisional ring galaxies are necessary to confirm this hypothesis, but the Bullseye provides interesting and critical observational evidence of these predictions for the first time.

Citation

Imad Pasha et al 2025 ApJL 980 L3. doi:10.3847/2041-8213/ad9f5c

The post Selections from 2025: The Nine-Ringed Bullseye Galaxy appeared first on AAS Nova.

  •  

Intergalactic Impacts of Quasars During the Epoch of Reionization

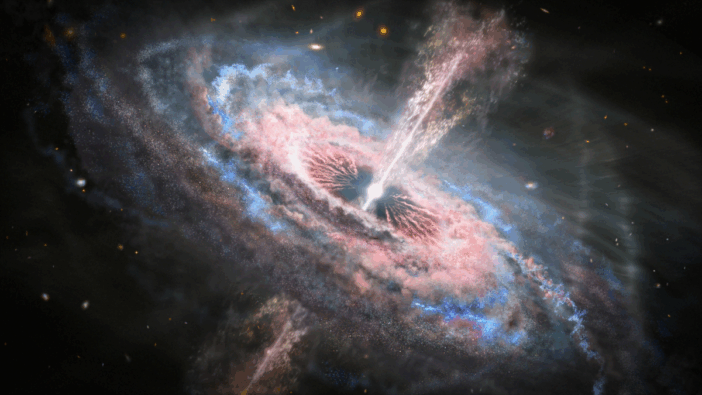
quasar artist's concept

Emitting powerful radiation into their surroundings, quasars had the ability to significantly influence their local environments. A recent study using JWST observations focuses in on one of the most powerful known quasars to determine its intergalactic impact.

Quasar Questions

Beacons of light from the very distant universe, quasars are incredibly luminous galactic cores powered by active supermassive black holes. During the first few billion years after the Big Bang, quasars pumped radiation not only into their host galaxies but also out into intergalactic space and subsequently into nearby galaxies. This radiation was strong enough to ionize any intervening material and even break up (or photodissociate) molecular hydrogen gas. With their star formation fuel evaporated, a quasar’s unsuspecting galactic neighbors were stymied from growth.

Sky map

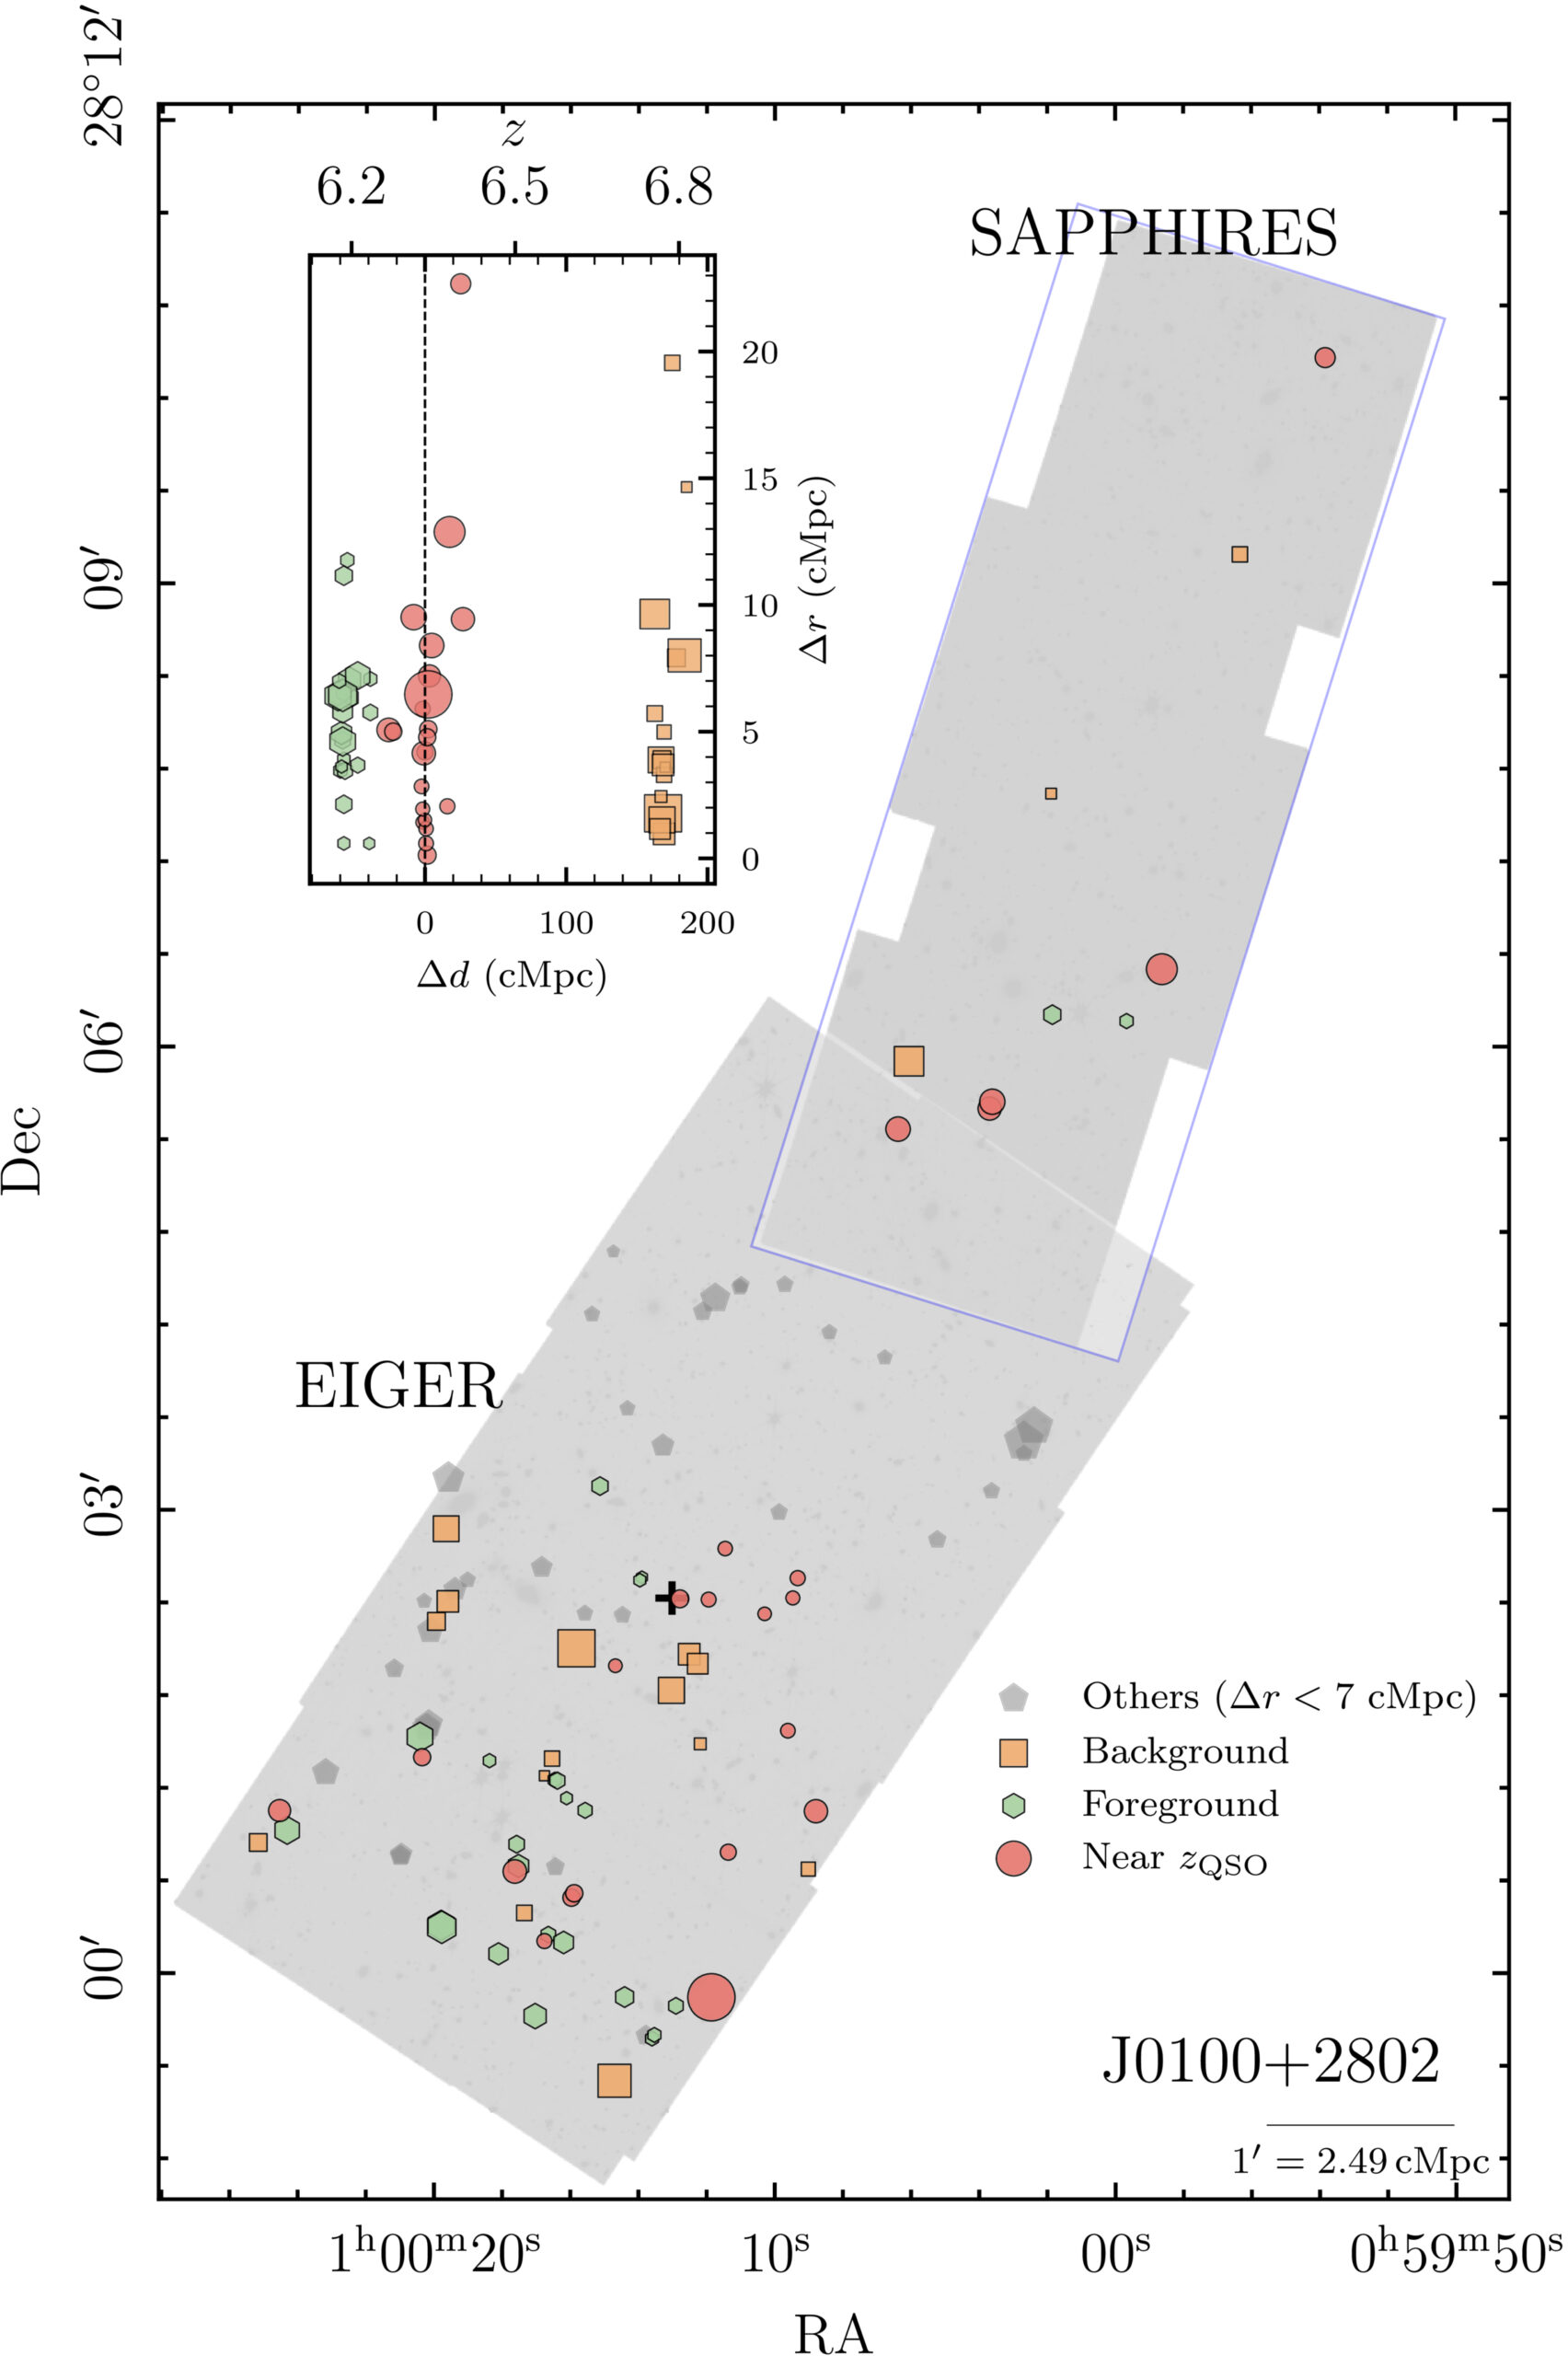
Sky map showing the location of quasar J0100+2802 (marked with black cross) and the [OIII]-emitting galaxies detected in the field. The red points are within the same redshift window as J0100+2802, and the green and orange points show foreground and background galaxies respectively. Click to enlarge. [Zhu et al 2025]

When the universe went from neutral to ionized during the epoch of reionization, quasars are thought to have occupied dense regions, tracing out the beginnings of galaxy clusters. However, studies thus far have been unable to decipher the environmental influence of quasar radiation from other mechanisms impacting the evolution of nearby galaxies. With the advent of JWST, direct measurements of rest-frame star formation tracers during the epoch of reionization are now possible, allowing astronomers to explore high-redshift quasar environments in new ways.

Searching for Suppressed Star Formation

To investigate how quasars may impact their environments, Yongda Zhu (University of Arizona) and collaborators set their gazes on J0100+2802 — the most ultraviolet-luminous quasar known at redshift z > 6. This powerful quasar lies in an overdensity, surrounded by galaxies filled with hot, young stars, making it an ideal candidate to test the impacts of luminous quasars on their neighbors. The authors used spectroscopy and photometry obtained from JWST to explore the space around J0100+2802.

Searching within the expected reach of the quasar’s radiation field, the authors identified galaxies with doubly ionized oxygen emission ([OIII] λ5008), which traces a galaxy’s recent star formation activity. After carefully separating background and foreground galaxies from galaxies at the same redshift as J0100+2802, the authors measured the total [OIII] emission and compared it to the overall ultraviolet stellar emission. From their sample, galaxies closer to J0100+2802 tend to exhibit lower [OIII]/UV ratios than those farther away, indicating that the powerful quasar may be suppressing star formation activity in nearby galaxies. 

[OIII]/UV versus distance from quasar

[OIII]/UV ratio versus distance from quasar J0100+2802. There is a clear positive correlation indicating that closer to the powerful quasar, [OIII] emission declines. The dashed line shows the expected radiation field of J0100+2802. Click to enlarge. [Modified from Zhu et al 2025]

Confirming the Culprit

To verify that the quasar is truly responsible for this declining trend, other environmental factors and intrinsic galaxy properties must be ruled out. Could the galaxies nearby J0100+2802 just happen to have elevated ultraviolet stellar continuum? Or could the overdense environment itself drive this trend? The authors performed additional analysis to control for these variables and found no strong global factors that could explain the decline in [OIII] emission — radiation from the quasar is likely the driver.

To further bolster their results and determine whether this behavior is more widespread, the authors investigated the environments around three other quasars at the same redshift as J0100+2802. Though these quasars are not as powerful as J0100+2802, a similar trend is uncovered for galaxies within the radiation field of these quasars. From this study, radiative feedback from quasars appears to disrupt the star formation activity in nearby galaxies, suppressing their growth and changing the way early galaxy formation progresses. 

Further wide-field studies are necessary to understand the full extent to which reionization-era quasars can impact their environments, but this study provides a clear path forward with JWST.

Citation

“Quasar Radiative Feedback May Suppress Growth on Intergalactic Scales at z = 6.3,” Yongda Zhu et al 2025 ApJL 995 L5. doi:10.3847/2041-8213/ae1f8e

The post Intergalactic Impacts of Quasars During the Epoch of Reionization appeared first on AAS Nova.

  •  

Featured Image: JWST Examines the Ring Nebula

Ring Nebula

The iconic and widely photographed Ring Nebula is one of the most recognizable planetary nebulae: short-lived, often brilliantly colored nebulae that form when low- to intermediate-mass stars shed their outer layers. The three images above show the central region of the Ring Nebula through the eyes of JWST’s Mid Infrared Instrument. The leftmost image clearly shows the Ring Nebula’s central star: a hot, crystallized stellar core called a white dwarf. In a recent research article, Raghvendra Sahai (Jet Propulsion Laboratory) and collaborators analyzed these JWST observations, leading to the discovery of a dusty disk around the Ring Nebula’s central star. This is just the second time that a resolved disk has been discovered around the central star of a planetary nebula. Disks with radii from 0.01 to 1,000 au have been found around evolved stars in the asymptotic giant branch phase through the planetary nebula phase, but it’s not yet clear how these disks form and how long they last. Most intriguingly, the presence of disks around highly evolved stars raises the possibility of a second phase of planet formation. To learn more about the JWST observations of the Ring Nebula, and what they tell us about the properties of the central star and its disk, be sure to check out the full research article linked below.

Citation

“JWST Observations of the Ring Nebula (NGC 6720). III. A Dusty Disk Around Its Central Star,” Raghvendra Sahai et al 2025 ApJ 985 101. doi:10.3847/1538-4357/adc91c

The post Featured Image: JWST Examines the Ring Nebula appeared first on AAS Nova.
  •  

First Confirmed Planet in a White Dwarf’s “Forbidden Zone”

white dwarf WD 1856+534

Using JWST, researchers have spotted a freezing cold 5.2-Jupiter-mass exoplanet orbiting an old white dwarf at a distance of just 0.02 au. With a temperature of 186K (−125℉/−87℃), this is the coldest exoplanet whose light has been directly detected.

The Fate of Sun-Like Stars

Low- to intermediate-mass stars eventually evolve into red giants and then white dwarfs: crystallized, superheated stellar cores that slowly cool and fade over millennia. What happens to the planets around stars that evolve into white dwarfs is an open question, one that can be answered by detecting and characterizing the planets that remain in these systems.

Planets orbiting at radii beyond 2 au are expected to weather their host star’s transition to a red giant, and dedicated searches for white-dwarf exoplanets have revealed a small number of planets at this safe distance. Observations have also begun to hint at planets orbiting white dwarfs more closely — within the “forbidden zone” thought to be scoured out by the host star’s transformation into a red giant — and researchers have now confirmed the presence of a planet eking out an existence extremely close to its white dwarf host.

Companion Detection

plot of infrared excess for WD 1856+534

Excess infrared emission of WD 1856+534b and WD 0310-688b, a planet candidate. The blue lines show the white dwarfs from the MIRI Exoplanets Orbiting WDs (MEOW) survey with no infrared excess. [Limbach et al. 2025]

The white dwarf WD 1856+534 is located roughly 82 light-years away. In 2020, researchers using data from the Transiting Exoplanet Survey Satellite and a handful of ground-based telescopes detected a Jupiter-sized object orbiting WD 1856+534 every 1.4 days at a distance of just 0.02 au — nearly 30 times closer than Mercury is to the Sun.

The original observations couldn’t discern whether the object, cataloged as WD 1856+534b, was a massive exoplanet or a low-mass brown dwarf. Now, a team led by Mary Anne Limbach (University of Michigan) has performed follow-up observations of the system. Using JWST’s Mid-Infrared Instrument (MIRI), Limbach’s team detected WD 1856+534b by subtracting a detailed model of the white dwarf’s flux from the observed flux. The object’s faint thermal glow was detected with an overall statistical significance of 5.7 sigma.

Temperature and radius of WD 1856+534b compared to other exoplanets and solar system planets

Temperature and radius of WD 1856+534b (yellow star) compared to several known exoplanets, solar system planets, and free-floating planets (FFPs). Click to enlarge. [Limbach et al. 2025]

Brown Dwarf or Planet?

By modeling this thermal emission, Limbach and collaborators definitively showed that WD 1856+534b is a planet. Its mass is likely around 5.2 Jupiter masses, though masses between 0.84 and 5.9 Jupiter masses are possible. With an exceedingly chilly temperature of just 186K — only 60K warmer than Jupiter — WD 1856+534b is the coldest exoplanet whose emission has been directly detected.

Because WD 1856+534b couldn’t have survived its host star’s transformation into a red giant at its current position, it must have migrated inward from a more distant orbit. The cause of this migration isn’t yet clear, though common-envelope evolution or gravitational nudges from another planet or star may have played a role. Upcoming JWST observations that probe WD 1856+534b’s atmosphere and search for other planets in the system could provide answers.

Citation

“Thermal Emission and Confirmation of the Frigid White Dwarf Exoplanet WD 1856+534 b,” Mary Anne Limbach et al 2025 ApJL 984 L28. doi:10.3847/2041-8213/adc9ad

The post First Confirmed Planet in a White Dwarf’s “Forbidden Zone” appeared first on AAS Nova.
  •  

Loin d'être inutiles, les petits bras du T. rex auraient eu une fonction redoutable selon ce chercheur

Ses bras font rire. Pourtant, une griffe du T. rex pouvait exercer une pression colossale sur sa proie. Ces membres minuscules, longtemps moqués, cachent peut-être l'une des armes les plus ingénieuses de la préhistoire. Et si on avait tout faux depuis le début ? 

  •  

Les scientifiques pensaient les Denisoviens introuvables : cette découverte spectaculaire change désormais tout

Pendant quinze ans, les Denisoviens n'ont eu ni visage ni contour. Juste de l'ADN extrait d'un fragment d'os sibérien grand comme un ongle. En 2025, un crâne exceptionnel découvert en Chine a tout changé. Homo longi, surnommé l'Homme dragon, donne enfin un visage à ce groupe humain fantôme. 

  •  
❌