❌

Reading view

The streamers are fighting over Halloween

A still from the film Crystal Lake.

The Toronto International Film Festival is a place to go to see the future of film, but this year it also provided a glimpse at what is coming very soon in the realm of streaming. Four different streamers - Peacock, Netflix, Amazon, and AMC - all premiered early looks at upcoming horror-adjacent series that are dropping very soon. And by doing it at TIFF, they showed just how important the month of October has become in the realm of streaming.

Perhaps the most high-profile is Carrie, which is coming to Prime Video. An adaptation of the classic Stephen King novel, which has already been turned into no fewer than three feature films, this ver …

Read the full story at The Verge.

  •  

3D imaging techniques reveal hidden damage in soybean seeds

Scientists in Brazil have demonstrated that a combination of three non-destructive imaging techniques, visible-spectrum (RGB) photography, X-ray radiography, and three-dimensional magnetic resonance imaging (MRI), can detect and characterize hidden damage in soybean seeds that conventional quality tests frequently miss. The study, published in Smart Agricultural Technology, comes at a critical moment: Brazil is the world’s largest soybean producer and exporter, with an estimated harvest of 166 million tons for the 2024/2025 growing season, and seed quality is increasingly under threat from the very climate extremes that help drive the country’s agricultural productivity.

The research, led by Rafael Mateus Alves and colleagues at institutions including the Seed Technology Center of Embrapa Soybean and the University of São Paulo, was funded by the São Paulo Research Foundation (FAPESP). Its central premise is deceptively simple: because seed quality is largely determined in the field, before harvest even begins, researchers and seed companies need tools that can look inside a seed without killing it. Destructive assays such as the tetrazolium viability test, which stains metabolically active tissue red, are the industry standard, but they end the life of the sample. That is a particular problem for breeding programs, where each seed represents a unique genetic combination that must survive analysis if it is to be planted.

The seed itself is a small miracle of engineering. A protective coat, derived from the ovule integuments and marked by a scar called the hilum, regulates water uptake and shields the embryo within. The embryo contains the plumule, which gives rise to the plant’s first true leaves; the apical meristem, precursor of the aerial plant; and the hypocotyl–radicle axis, which breaks through the soil and forms the primary root. Flanking this axis are the cotyledons, storage organs packed with macromolecules that are metabolized and shipped to the growing axis during germination. Damage to any of these structures, from insects, fungi, drought, heat, or rough handling during harvest, can silently reduce a seed lot’s vigor, the capacity for rapid, uniform germination that underpins successful crop establishment.

To interrogate this architecture non-invasively, the team assembled ten representative seeds from production fields, commercial lots, and storage samples, each embodying a distinct damage category: stink bug injury, purple seed stain caused by fungi, green seeds from incomplete maturation, wrinkled seeds from heat and drought stress, weathering-related coat ruptures, severe structural failure, mechanical harvest damage, and internal galleries bored by the cigarette beetle (Lasioderma serricorne) during storage. Every seed was imaged sequentially with each of the three modalities and then subjected to the tetrazolium test as a qualitative reference standard.

The technical pipeline was meticulously standardized. For visible-light imaging, seeds were mounted on acetate sheets and photographed with a Leica DMLB microscope equipped with a DFC 310FX digital camera, oriented in four standardized positions with the hilum consistently to the right. X-ray radiographs were acquired on a Faxitron MX-20 DC-12 system operating at 34 kilovolts, with a nine-second exposure and an object-to-source distance of 11.4 centimeters; uniform contrast settings were applied to all images to make damaged tissues directly comparable. The MRI work used a horizontal 2 Tesla superconducting magnet coupled to a Bruker Avance III spectrometer operating at 85.24 megahertz for proton nuclei. Before scanning, seeds were conditioned to raise their moisture content from roughly 8–10 percent (wet basis) by incubation on moistened germination paper for three hours at 25 °C, a step that ensured sufficient hydrogen signal for imaging. A three-dimensional FLASH pulse sequence, with a 3-millisecond echo time and 75-millisecond repetition time, collected data on a 128×128×128 matrix over a 12.8-millimeter field of view, yielding isotropic voxels of 100 micrometers per side. Datasets were zero-padded to 256³ before Fourier transformation and rendered in three dimensions using ImageJ with the 3Dscript plugin.

The resulting image galleries are striking. On seeds punctured by stink bugs, the dominant pest of Brazilian soybean fields, RGB images revealed darkened patches on the cotyledons and near the plumule, the visible legacy of insect feeding that lacerates tissue and injects yeasts that degrade it from within. X-ray images flagged zones of reduced radiation absorption in the same darkened regions, while MRI cross-sections exposed the depth of tissue destruction with unusual clarity, precisely because degraded tissue no longer absorbs water and therefore produces no magnetic resonance signal. The tetrazolium test confirmed that these zones lacked respiratory activity, meaning they were metabolically dead.

Not every symptom tells the same story, however, and the multimodal approach proved especially powerful at distinguishing superficial from structural damage. Seeds with purple seed stain, caused by Cercospora fungi that secrete the toxin cercosporin, showed internal structures that appeared entirely normal in both X-ray and MRI. Yet the tetrazolium test produced an unusually intense red coloration at the stained coat, indicating that fungal activity had compromised the seed coat’s ability to regulate water uptake, allowing the staining solution to penetrate more deeply into the embryo. Similarly, green seeds, which retain chlorophyll because heat and drought interrupted maturation, showed no structural anomalies under X-ray or MRI, but their membranes proved unusually permeable to the tetrazolium solution, hinting at the physiological deterioration typical of immature tissue.

Where MRI truly distinguished itself was in detecting damage invisible to every other method. One seed that appeared flawless in visible light and radiographically normal in X-ray images revealed, in its three-dimensional MRI reconstruction, internal ruptures running through the central cotyledons, the likely consequence of rapid, uneven drying that forces differential cellular expansion and eventual tissue collapse. In mechanically damaged seeds, the X-ray images showed a crack in the hypocotyl–radicle axis that the camera could not see, but MRI went further, revealing the full extent of the fissure and the displacement of the axis relative to the cotyledons. The team also documented a dramatic structural failure nicknamed the “popcorn effect,” in which alternating wetting and rapid drying cycles tear the seed coat and force the cotyledons apart, a phenomenon increasingly reported in Brazilian seed lots as late-season weather grows more erratic.

To move beyond qualitative observation, the researchers extracted grayscale histograms from each X-ray image, normalizing pixel frequencies across the full 0–255 intensity range. Two statistical descriptors, mean gray level and Shannon entropy, were then compared across damage categories using one-way ANOVA followed by Tukey’s honest significance test. The analysis yielded clear separation: undamaged seeds showed the narrowest distributions with peaks at high grayscale values, while beetle-infested seeds and wrinkled seeds displayed the broadest distributions with heavy weight in the lower gray ranges, reflecting hollowed-out tissues and sparse, deformed structures. Mean gray level differed significantly across categories, peaking in undamaged seeds and bottoming out in wrinkled ones, while Shannon entropy, a measure of histogram complexity, was highest in beetle-damaged seeds and lowest in healthy ones. Because each damage category produced a characteristic radiographic fingerprint, the authors suggest these histogram metrics could support automated, quantitative screening in commercial seed laboratories.

Each modality, the authors stress, occupies a distinct niche. RGB imaging is fast, cheap, and ideal for surface screening but blind to anything beneath the coat. X-ray radiography, already a mainstay of seed testing labs, reveals internal voids, malformations, and cavities rapidly and non-destructively, though it cannot report on metabolic viability and demands careful standardization. MRI, with its superb soft-tissue contrast and genuine three-dimensional resolution, excels at detecting subtle physiological and structural alterations, latent mechanical injury, hydration-induced ruptures, and moisture redistribution, but its cost and acquisition time currently confine it to research settings. The tetrazolium test remains valuable as a reference but is destructive and subject to interpreter bias.

The authors argue the techniques should be viewed as complementary rather than competing, and they sketch a future in which RGB and X-ray screening handle high-throughput commercial quality control while MRI resolves ambiguous or high-stakes cases, such as breeding lines and seed physiology studies. Advances in imaging hardware, automation, and artificial intelligence-based analysis, they note, could eventually fuse these modalities into scalable phenotyping workflows. For now, the message is clear: in an era when a single season of heat, drought, and hungry insects can undermine an entire seed lot, the ability to see damage in all three dimensions, without sacrificing the seed itself, may prove as transformative for agriculture as it has been for medicine.

Subject of Research: Non-destructive multimodal imaging (RGB, X-ray, and MRI) for detecting abiotic- and biotic-stress-induced damage in soybean seeds

Article Title: When damage goes deep: a multi-technique approach including 3D for soybean seed damage assessment

Article References: Alves, R. M., Teixeira, J. M., Marassi, A. G., Henning, F. A., Umburanas, R. C., Gomes-Junior, F. G., & Tannús, A. (2026). When damage goes deep: a multi-technique approach including 3D for soybean seed damage assessment. Smart Agricultural Technology, 15, Article 102523. https://doi.org/10.1016/j.atech.2026.102523

Image Credits: AI Generated

DOI: 10.1016/j.atech.2026.102523

Keywords: soybean seeds, seed quality, MRI, X-ray imaging, RGB imaging, seed vigor, multimodal imaging, stink bug damage, tetrazolium test, non-destructive testing, seed coat rupture, cigarette beetle

  •  

Meta’s Muse AI works and creeps me out

A screenshot of Meta’s Muse AI assistant
I turned my Muse assistant into a purple cat. | Screenshot: The Verge

Meta has launched its new Muse assistant, marking the company's first real foray into AI-powered productivity tools. The company says its AI agent can "take the busywork off your plate" by helping you with online shopping, emails, trip-planning, and more. I decided to try out the new tool and see how well it performed - especially from a company that previously prioritized entertainment over productivity. Though the AI assistant generally worked as I expected it to, the unnerving amount of information it autonomously gleaned about me largely overshadowed my experience.

One of the first tasks I assigned Muse, which carries out actions using …

Read the full story at The Verge.

  •  

Simulating Fluid–Structure Interaction in Eyes with Detached Descemet Membrane

In a finding that could reshape how ophthalmologists think about one of the most delicate complications of corneal surgery, a team of computational engineers has built the first detailed computer model of a human eye in which the Descemet membrane—the paper-thin basement layer at the back of the cornea—has become detached. By simulating the fluid–structure interaction between the aqueous humor sloshing inside the eye’s anterior chamber and the flexible, detached membrane itself, the researchers have produced quantitative predictions about the mechanical stresses such a detachment imposes, and about how different transplanted corneas might alter those stresses during post-operative thermal therapy.

The study, published in the Annals of Biomedical Engineering, addresses a long-standing blind spot in ocular biomechanics. Detachment of the Descemet membrane is a recognized complication of cataract surgery, corneal transplantation and certain corneal dystrophies, and it can cause significant corneal swelling and vision loss if the membrane does not reattach. Yet most previous computational examinations of the anterior chamber have treated the eye’s interior as rigid-walled plumbing, focusing on fluid flow or heat transfer while excluding the complex two-way coupling between the intraocular fluid and the fragile ocular structures suspended within it. The new work changes that by modeling the detached Descemet membrane as a deformable, elastic solid that bends, stretches and deforms under the pressure and shear of the aqueous humor flowing around it.

The researchers, led by Ammar I. Alsabery of the Islamic University in Najaf, Iraq, together with colleagues from the University of Basrah, King Khalid University in Saudi Arabia, Saveetha School of Engineering in India, and Universiti Kebangsaan Malaysia, employed a coupled numerical scheme that solves simultaneously for the buoyancy-driven flow of aqueous humor and for the structural deformation of the membrane. The geometry represents the anterior chamber—the fluid-filled space between the cornea and the iris—with a warm region corresponding to the lens contact zone held at an isothermal hot temperature, mimicking the thermal gradients that arise in ocular warming therapies and in normal physiological conditions.

At the heart of the analysis is the Rayleigh number, a dimensionless parameter that governs the strength of natural convection: warmer, less dense fluid rises while cooler fluid sinks, generating circulating currents within the chamber. The team varied the Rayleigh number across three orders of magnitude, from 10³ to 10⁶, which corresponds to temperature differences spanning from a fraction of a degree to 250 Kelvin. This range deliberately encompasses both the mild thermal gradients present in the living eye and the much more aggressive temperature differences applied during clinical thermal therapy of the cornea, allowing the same model to speak to both resting physiology and active treatment.

Equally central to the study is the elasticity modulus of the detached membrane. The researchers swept this property across nine orders of magnitude, from 10⁸ to 10¹¹, a range designed to represent everything from highly compliant, freshly detached tissue to the much stiffer mechanical character of donor corneal tissue used in transplantation. Because the Descemet membrane’s stiffness varies with age, disease state and surgical history, this parametric approach lets the model answer a question that clinicians genuinely care about: does the type of cornea grafted into a patient change the mechanical load experienced by a detached membrane during recovery? The answer, according to the simulations, is nuanced. The cornea type does affect the stress imparted on the detached Descemet membrane, but it does not affect the thermal characteristics of the anterior chamber or the overall displacement behavior within it. In other words, stiffer transplanted tissue changes the mechanical environment at the membrane itself without appreciably altering the convective heat transfer patterns of the aqueous humor circulating beneath it.

The fluid dynamics of the anterior chamber turned out to be far more sensitive to geometry than to tissue stiffness. One of the most striking results concerns the iris, the pigmented diaphragm whose length in the model determines the extent of the hot, isothermal contact region associated with the lens. When the team simulated a shrinkage of the iris—effectively reducing the length of the contacting part of the lens held at the hot temperature—they found that the convective thermal characteristic of the anterior chamber rose by approximately 78 percent. This dramatic enhancement arises because the reduced iris length reshapes the buoyancy-driven circulation cells, allowing warmer fluid to travel more freely and exchange heat more efficiently with its surroundings. For clinicians, the implication is that the geometry of the anterior chamber, shaped in part by the iris and the lens, is a first-order determinant of how heat is distributed during thermal therapy, potentially more important than the material properties of the graft itself.

The temperature difference applied during thermal therapy also proved to be a powerful lever. Raising the applied thermal gradient from 2.5 Kelvin to 25 Kelvin—a tenfold increase—promoted heat transfer within the anterior chamber by 47.6 percent. While the scaling is sublinear rather than directly proportional to the temperature difference, the result confirms that modest increases in therapeutic temperature can yield meaningful gains in convective heat delivery without requiring a hundredfold jump in applied thermal load. The finding offers a quantitative framework for calibrating thermal treatments of the anterior segment: therapy protocols could, in principle, be tuned to achieve target heat transfer rates while respecting the narrow thermal safety margins of living ocular tissue.

Technically, the simulations belong to a class of problems known as fluid–structure interaction, or FSI, in which the fluid equations and the solid mechanics equations are coupled and solved together rather than in isolation. In this case, the aqueous humor—an essentially water-like fluid—drives natural convection under the influence of gravity, while the detached Descemet membrane responds to the pressure and viscous stresses exerted by that flow. The membrane’s deformation, in turn, modifies the shape of the fluid domain, feeding back into the flow field. This two-way coupling is computationally demanding but essential, because a rigid-wall approximation would entirely miss the bending and displacement of the detached membrane, along with the localized stress concentrations that could determine whether the membrane reattaches, tears further, or remains stable during healing. The methodology builds on the team’s earlier FSI studies of flexible fins, baffles and partitions in convective systems, as well as their prior work applying FSI modeling to blood flow in abdominal aortic aneurysms under thermal treatment, adapting those engineering tools to the peculiar geometry and physiology of the human eye.

The choice to represent the detached Descemet membrane as a flexible structure rather than a fixed boundary is what gives the study its clinical bite. Prior models of aqueous humor flow, including foundational work on fluid flow in the anterior chamber of the human eye published decades ago, captured the buoyancy-driven currents but assumed static, impermeable walls. By letting the membrane move, the new simulations capture the interplay between hemodynamics-like fluid loading and tissue compliance—precisely the interplay that governs how a detached membrane flutters against the aqueous humor, how stresses concentrate at its edges and attachments, and how different graft stiffnesses redistribute those stresses across the corneal structure. The team’s results suggest that surgeons and biomaterials scientists selecting corneal grafts for patients prone to Descemet membrane detachment could use stress predictions of this kind to weigh graft stiffness as part of the decision, even though the overall thermal environment of the chamber will remain largely unchanged.

Beyond transplantation, the model has direct relevance to thermal therapy of the eye, a class of treatments in which controlled warming is applied to manage conditions of the anterior segment. Because the simulations connect an easily controlled clinical variable—the applied temperature difference—to a measurable outcome in convective heat transfer, and because they quantify the role of iris geometry in shaping the thermal flow field, they provide a template for patient-specific treatment planning. A clinician armed with imaging of a patient’s anterior chamber geometry could, in principle, use models of this type to predict how a planned thermal protocol will distribute heat in the presence of a detached membrane, and whether the resulting stresses on the membrane fall within tolerable limits.

The work is not without its simplifications, as the authors themselves frame the study as an evaluation of corneal transplantation processes rather than a complete clinical simulator. The anterior chamber geometry is idealized, the aqueous humor is treated with standard transport properties, and the elasticity modulus range, while broad, samples the problem in parametric steps rather than matching every individual patient’s tissue. Real eyes also feature aqueous production and drainage, blinking, saccadic motion and ocular pulse effects that a steady natural-convection FSI model does not capture. Nonetheless, the paper’s central contribution—demonstrating that corneal stiffness governs membrane stress while iris geometry and thermal gradient govern heat transfer—stands as a clean separation of effects that future, more detailed models will need to reproduce.

The research was supported by the Universiti Kebangsaan Malaysia Research Grant GP-2024-K006388 and by the Deanship of Research and Graduate Studies at King Khalid University through a large Research Group Project. As computational biomechanics continues to migrate from engineering journals into clinical planning, studies like this one mark a shift toward treating the eye not as a static optical instrument but as a living, deformable, fluid-filled machine—one in which a membrane thinner than a human hair can dominate the mechanical conversation, and where the difference between a compliant and a stiff cornea may one day inform the surgeon’s graft choice.

Subject of Research: Fluid–structure interaction analysis of aqueous humor flow, heat transfer and membrane stress in the human eye with Descemet membrane detachment, with application to corneal transplantation and thermal therapy

Article Title: Fluid–Structure Interaction Analysis of Human Eye with Descemet Membrane Detachment

Article References: Alsabery, A. I., Ismael, M. A., Raizah, Z., Ghalambaz, M., & Hashim, I. (2026). Fluid–Structure Interaction Analysis of Human Eye with Descemet Membrane Detachment. Annals of Biomedical Engineering. https://doi.org/10.1007/s10439-026-04317-0

Image Credits: AI Generated

DOI: 10.1007/s10439-026-04317-0

Keywords: Descemet membrane detachment, anterior chamber flow, fluid–structure interaction, human eye, cornea transplantation, natural convection, thermal therapy, Rayleigh number, elasticity modulus, aqueous humor, corneal biomechanics, numerical simulation

  •  

Integrated Chromosomal and Bioinformatics Analysis Reveals Genetic Causes of Recurrent Pregnancy Loss

Recurrent pregnancy loss affects an estimated one in a hundred couples trying to build a family, yet in a striking proportion of cases no cause is ever identified, leaving patients and clinicians alike without answers. A new study from researchers at the Institute of Medical Sciences, Banaras Hindu University in Varanasi, India, published in the journal Biochemical Genetics, offers a detailed picture of the genetic abnormalities lurking in lost pregnancies and points to a two-tier testing strategy that could substantially improve diagnostic yield. Combining rapid aneuploidy screening with high-resolution chromosomal microarray analysis and a layer of computational biology, the team has mapped not only which chromosomes go wrong in recurrent miscarriage but also which biological pathways those errors may disrupt.

The research team, led by Shivani Mishra and corresponding author Royana Singh, recruited 125 fetal specimens from pregnancies that ended in loss, ultimately analyzing 118 samples after applying predefined exclusion criteria designed to guard against contamination and degraded tissue. The specimens, which included products of conception and fetal tissues such as skin, muscle, and cartilage obtained during autopsy, underwent DNA extraction and quantitative fluorescent PCR, a technique that amplifies short tandem repeat markers scattered across chromosomes 13, 18, 21, X, and Y. By measuring the relative quantity of fluorescent signals at these markers, QF-PCR can detect the most common whole-chromosome imbalances, the trisomies and monosomies that account for the majority of chromosomally abnormal miscarriages, often within a day or two of sample receipt.

The results were sobering but clinically rich. Of the 118 samples analyzed, QF-PCR identified aneuploidy in 36 cases, a detection rate of 30.5 percent. Twenty of these were monosomies, in which an entire chromosome is missing from the fetal genome, and sixteen were trisomies, in which an extra copy is present. The remaining 82 samples appeared normal by this rapid screen. That nearly one in three lost pregnancies carried a whole-chromosome imbalance confirms the central role of aneuploidy in early pregnancy failure, and it also carries a practical message for genetic counseling: when an aneuploidy is identified as the cause of a loss, the recurrence risk for future pregnancies is generally low, information that can meaningfully reduce anxiety for couples facing the aftermath of repeated loss.

Beyond the raw detection numbers, the study teased out clinical associations that matter for patient management. Maternal age showed a statistically significant relationship with the presence of chromosomal abnormalities, echoing decades of reproductive biology linking the aging oocyte to meiotic segregation errors. More intriguing was the finding of a weak but statistically significant negative correlation between gestational age and aneuploidy risk, with a correlation coefficient of −0.238 and a p-value of 0.008855. In other words, the earlier the loss, the more likely it was to be chromosomally abnormal, a pattern consistent with the idea that grossly imbalanced embryos tend to fail early in development, while losses later in gestation are more often driven by other mechanisms, including immunological, endocrine, thrombotic, and anatomical factors.

But QF-PCR has a well-known blind spot. It interrogates a limited set of chromosomes and cannot see submicroscopic copy number variations, the deletions and duplications of genomic segments too small to alter chromosome number but large enough to remove or duplicate genes. To peer beneath that resolution floor, the team selected a subset of 30 samples, stratified by their QF-PCR outcomes, and subjected them to array comparative genomic hybridization. In aCGH, differentially labeled fetal and reference DNA are co-hybridized to a microarray carrying hundreds of thousands of immobilized genomic probes, and the fluorescence ratio at each probe reveals whether the corresponding region is deleted or duplicated in the fetal genome. This technique can detect imbalances ranging from roughly 100 kilobases upward, an order of magnitude finer than conventional karyotyping.

The aCGH analysis proved its worth. Within the 30-sample cohort, the researchers identified clinically relevant copy number variations spanning the spectrum of pathogenicity, including pathogenic and likely pathogenic variants as well as variants of uncertain significance, the latter category reflecting regions whose dosage sensitivity has not yet been firmly established. Each variant was interpreted according to the joint guidelines of the American College of Medical Genetics and the Clinical Genome Resource, the standard framework that weighs factors such as gene content, inheritance pattern, and overlap with established disease loci before assigning a clinical classification.

Among the genes caught in deleted or duplicated segments were several with compelling biological narratives. CFHR3, a member of the complement factor H-related gene family, participates in the regulation of the complement cascade, the arm of innate immunity whose dysregulation has been implicated in inflammatory damage at the maternal-fetal interface. TNFRSF4 encodes a tumor necrosis factor receptor superfamily member with roles in immune cell signaling and tolerance. UGT2B17 belongs to the uridine diphosphate glucuronosyltransferase family, a set of metabolic detoxification enzymes whose variation has previously been linked to recurrent miscarriage, possibly through altered clearance of environmental and endogenous compounds. CD24 and MSR1 are involved in immune signaling and macrophage scavenger function, respectively, while the pregnancy-specific glycoprotein gene family, or PSG genes, is expressed almost exclusively in the placenta and is thought to modulate maternal immune tolerance of the fetus.

To move from gene lists to mechanism, the authors turned the implicated genes loose on a battery of bioinformatics tools. Using FunRich and WebGestalt for functional annotation, KEGG for pathway enrichment, and STRING for protein-protein interaction network construction, the team asked what biological themes united the disrupted loci. The answer converged on a coherent set of processes: immune-inflammatory signaling, endocrine regulation, lipid metabolism, extracellular matrix remodeling, and placental development. The involvement of TNF receptor signaling, MAPK cascades, and interleukin-1-related pathways emerged from the network analyses, weaving the copy number variations into the same immunological tapestry that independent studies have implicated in unexplained recurrent loss, including work on maternal B cell signaling and natural killer cell-mediated immunopathology.

The authors are careful, appropriately so, to frame the pathway findings as exploratory. The cohort of 30 microarray samples is modest, and several of the variants of uncertain significance may prove benign as genomic databases mature. The statistical associations between individual CNVs and miscarriage phenotypes will require validation in larger, well-powered cohorts with matched controls before they can inform clinical decision-making. Still, the architectural message of the study is clear: sequential testing with QF-PCR followed by aCGH captures abnormalities that neither method detects alone, and it does so at a fraction of the cost and turnaround time of broader approaches such as whole-genome sequencing.

That message lands at a moment of ferment in reproductive genetics. European Society of Human Reproduction and Embryology guidelines define recurrent pregnancy loss as two or more consecutive losses, and professional societies have been wrestling with the optimal diagnostic workup of lost pregnancy tissue for years. Previous studies comparing karyotyping with molecular methods have shown that conventional cytogenetics suffers from culture failure and maternal cell contamination, problems that DNA-based methods largely sidestep. The Banaras Hindu University team’s approach, anchored in a real clinical diagnostic laboratory serving a population with limited access to advanced genomic testing, demonstrates that a tiered molecular protocol is feasible and productive outside of well-funded Western centers.

For couples enduring the grief of repeated loss, the study’s findings translate into a concrete recommendation worth discussing with a genetic counselor: comprehensive cytogenetic analysis of lost pregnancy tissue is not merely an academic exercise. Identifying an aneuploidy or a pathogenic copy number variant can close the diagnostic loop, refine recurrence risk estimates, and in some cases guide the management of subsequent pregnancies, including targeted prenatal or preimplantation genetic testing. Conversely, a normal molecular karyotype redirects the clinical search toward the non-genetic contributors, from antiphospholipid syndrome to uterine anomalies.

The work also adds to a growing map of the genomic landscape of pregnancy failure, in which the PSG gene cluster on chromosome 19, the complement factor H-related locus, and immune receptor genes recur across independent cohorts. As genome-wide datasets accumulate and functional studies test the dosage sensitivity of these loci, variants of uncertain significance will gradually be reclassified, and the exploratory pathway signals reported here may harden into causal mechanisms. Until then, the study stands as both a practical diagnostic template and a hypothesis-generating catalog of the fragile genetic architecture underlying one of medicine’s most quietly devastating problems.

Subject of Research: Genetic risk factors in recurrent pregnancy loss, identified through combined QF-PCR and aCGH chromosomal analysis with bioinformatics pathway enrichment analysis of fetal specimens

Article Title: Decoding Genetic Risk Factors in Recurrent Pregnancy Loss: An Integrative Chromosomal and Bioinformatics Approach

Article References: Mishra, S., Ashish, A., Rai, S., Yadav, A. K., & Singh, R. (2026). Decoding Genetic Risk Factors in Recurrent Pregnancy Loss: An Integrative Chromosomal and Bioinformatics Approach. Biochemical Genetics. https://doi.org/10.1007/s10528-026-11424-z

Image Credits: AI Generated

DOI: 10.1007/s10528-026-11424-z

Keywords: recurrent pregnancy loss, QF-PCR, aCGH microarray, copy number variations, aneuploidy, gene ontology, chromosomal abnormalities, placental development, immune-inflammatory pathways, bioinformatics

  •  

Open-source software tracks wrist bone motion in 3D and 4D CT scans

In a development that could reshape how scientists study the mechanics of human movement, a team of biomedical engineers and computer scientists has unveiled an open-source software tool capable of tracking the tiny, intricate bones of the wrist as they glide and rotate during motion. The new tool, called Hierarchical 3D Registration, or 3DH, is a module within the SlicerAutoscoperM extension of the widely used 3DSlicer computing environment. Described in a study published in BioMedical Engineering OnLine, the software was validated against previously established methods using both sequential three-dimensional computed tomography, or 3DCT, scans of living participants performing thumb tasks and dynamic four-dimensional CT, or 4DCT, images of cadaveric wrists moving through flexion and extension. The results demonstrate that the open-source approach can match the accuracy of independent, previously published methodologies while offering researchers everywhere a free and reproducible path to quantifying skeletal kinematics.

The wrist has long been one of the most challenging joints for biomechanists to study. It contains eight small carpal bones, including the scaphoid and lunate, along with the radius of the forearm and the metacarpal bones of the hand, all articulating in a tightly packed arrangement that allows the remarkable range of motion humans rely on every day. Understanding how these bones move relative to one another, a field of study known as arthrokinematics, is essential for unraveling the causes of wrist instability, osteoarthritis, ligament injuries and the long-term outcomes of surgical repairs. Yet measuring those movements in living, moving joints has historically required either invasive techniques, labor-intensive manual analysis or proprietary software that few laboratories can access or verify.

Quantitative tracking of skeletal structures in vivo, with both efficiency and high temporal resolution, matters to a wide range of questions in biomechanical research, and the authors of the new study argue that the field has been held back by a shortage of accessible, semi-automated registration tools. Image registration, the computational process of aligning one three-dimensional image volume to another, lies at the heart of motion tracking from CT data. When a bone moves between two scans, its position and orientation change, and a registration algorithm must find the transformation that best overlays the bone’s image from one time point onto the next. Done well, this yields precise measurements of rotation and translation. Done poorly or inconsistently, it introduces errors that can swamp the small movements of carpal bones, which may shift by only a few millimeters and a few degrees during normal function.

The new 3DH module addresses this problem with a hierarchical strategy for registering bones across sequences of image volumes. The researchers presented and evaluated the software using two distinct classes of data drawn from previous studies. The first consisted of sequential 3DCT datasets of human participants performing various thumb tasks, in which the radius, the first metacarpal and the trapezium were the target bones. The second consisted of dynamic 4DCT datasets capturing simulated flexion-extension motion in cadaveric wrists, providing time-resolved, three-dimensional image volumes of the scaphoid and lunate in motion. By testing the tool on both static sequential scans and true dynamic imaging, the team was able to demonstrate that 3DH is not limited to a single imaging paradigm but can serve as a unified tracking solution across modalities.

To determine whether the new open-source tool could be trusted, the investigators compared the arthrokinematics computed with 3DH against values that had been previously calculated using independent approaches for the same 3DCT and 4DCT datasets. The statistical framework for this comparison was the Bland-Altman analysis, a standard method for assessing agreement between two measurement techniques. Rather than simply correlating the two sets of results, Bland-Altman analysis quantifies the mean bias, the systematic difference between methods, and the 95 percent limits of agreement, the range within which most individual differences between the methods are expected to fall. This approach is particularly well suited to method-comparison studies because it reveals whether a new technique introduces systematic error and how widely individual measurements might deviate from those of the established gold standard.

The performance figures reported in the study are striking. For the 3DCT data, in which the radius, first metacarpal and trapezium were tracked, the mean bias for the helical angle, a single-axis description of three-dimensional rotation, was just minus 0.06 degrees, with 95 percent limits of agreement ranging between minus 1.87 degrees and 1.74 degrees. Translation measurements fared nearly as well: the mean bias was 0.12 millimeters, with limits of agreement spanning from minus 2.23 millimeters to 2.00 millimeters. In practical terms, the open-source tool reproduced the rotational and translational measurements of the earlier methods to within roughly two degrees and two millimeters at the extremes, differences small enough to preserve the biological signal in most wrist kinematics experiments.

The dynamic 4DCT results told a similar story for the carpal bones. Tracking the scaphoid and lunate through simulated flexion-extension, 3DH produced mean biases of the Euler angle rotations, which decompose three-dimensional rotation into three orthogonal components, of less than 0.77 degrees about any direction. The widest 95 percent limits of agreement ranged between minus 7.11 degrees and 8.65 degrees. For translations, mean biases were less than 0.5 millimeters in any direction, with the widest limits of agreement ranging between minus 2.36 millimeters and 1.43 millimeters. The wider limits of agreement for rotations in the dynamic data likely reflect the added challenges of time-resolved imaging, including motion blur and the smaller, more complexly shaped carpal bones, but the near-zero mean biases indicate that the tool does not systematically drift away from established values.

Crucially, all target bones were successfully tracked in both the 3DCT and 4DCT datasets, meaning the hierarchical registration algorithm converged on correct solutions in every case tested. This robustness matters because registration algorithms can occasionally fail, locking onto incorrect alignments or diverging entirely, and such failures typically demand time-consuming manual intervention. A semi-automated tool that reliably succeeds across diverse bones, motion tasks and imaging protocols removes a significant bottleneck. Manual bone tracking in CT volume sequences can take hours per bone per trial, and the labor multiplies rapidly in studies involving multiple participants, multiple bones and dozens of motion cycles. By automating this process within a validated framework, 3DH promises to accelerate the pace at which wrist biomechanics data can be collected and analyzed.

The choice to build the module inside 3DSlicer, and specifically within the SlicerAutoscoperM extension, is a deliberate strategic decision with implications well beyond the wrist. 3DSlicer is a free, open-source platform for medical image computing and visualization with a large international user base spanning research, clinical and educational communities. By embedding 3DH in this ecosystem, the developers have made the tool immediately available to any laboratory already working with 3DSlicer, complete with the platform’s established infrastructure for loading DICOM data, segmenting anatomical structures and visualizing results. The authors note that the ability to track bones from both 3DCT and 4DCT data sources, with agreement to prior methodologies, demonstrates that the 3DH approach is a capable tool that could promote collaboration and consistency of results through open-source software.

Consistency is a quietly urgent issue in biomechanics. When different laboratories use different proprietary tools with undisclosed algorithms, it becomes difficult to distinguish true biological differences between study populations from mere methodological discrepancies. Open-source registration changes that calculus: the code can be inspected, verified, extended and reused, and results from different institutions become directly comparable because they are produced by identical algorithms. This transparency also lowers the barrier to entry for research groups in settings that cannot afford commercial licenses, potentially broadening the global community capable of conducting rigorous skeletal kinematics research.

The study itself emerged from a collaboration spanning several institutions. The team included Joseph J. Crisco, Amy M. Morton and John D. Holtgrewe of the Department of Orthopedics at The Warren Alpert Medical School of Brown University and Rhode Island Hospital; Cesar Lopez, Andrew Thoreson and Kristin D. Zhao of the Assistive and Restorative Technology Laboratory and the Department of Physical Medicine and Rehabilitation at the Mayo Clinic in Rochester, Minnesota; and Jean-Christophe Fillion-Robin and Beatriz Paniagua of Kitware Inc. in Clifton Park, New York. The involvement of Kitware, a company known for its leadership in open-source scientific computing, underscores the blend of academic rigor and software engineering expertise required to produce a research tool robust enough for widespread distribution. Funding was provided by the National Institute of Arthritis and Musculoskeletal and Skin Diseases of the National Institutes of Health under award numbers AR059185, AR078924 and AR071338.

The implications of this work extend naturally to the future of musculoskeletal imaging. As newer CT technologies, including photon-counting detector systems, deliver ever-finer spatial resolution and as dynamic 4DCT becomes more widely available, the volume of image data available for kinematic analysis will grow dramatically. Tools like 3DH, which are fast, semi-automated and validated across modalities, will be essential for converting that imaging bounty into quantitative biomechanical knowledge. For patients with wrist disorders, the downstream promise is equally tangible: better measurements of how carpal bones actually move in living joints can inform more accurate diagnoses, improved surgical planning, more realistic computational models of joint loading and ultimately better-designed treatments for conditions ranging from scapholunate instability to thumb-base arthritis. With the tool now openly available in the 3DSlicer environment, researchers around the world can begin putting it to work.

Subject of Research: Open-source kinematic tracking of the small bones of the wrist in sequential 3DCT and dynamic 4DCT images using Hierarchical 3D Registration

Article Title: Kinematic tracking of the small bones of the wrist in sequential 3DCT and dynamic 4DCT volume images using open-source Hierarchical 3D Registration, a module within SlicerAutoscoperM

Article References: Crisco, J. J., Morton, A. M., Lopez, C., Thoreson, A., Zhao, K. D., Holtgrewe, J. D., Fillion-Robin, J.-C., & Paniagua, B. (2026). Kinematic tracking of the small bones of the wrist in sequential 3DCT and dynamic 4DCT volume images using open-source Hierarchical 3D Registration, a module within SlicerAutoscoperM. BioMedical Engineering OnLine. https://doi.org/10.1186/s12938-026-01601-x

Image Credits: AI Generated

DOI: 10.1186/s12938-026-01601-x

Keywords: Computed tomography, 3DCT, 4DCT, Bone tracking, 3DH, 3DSlicer, Image registration, Wrist kinematics, Arthrokinematics, Open-source software, SlicerAutoscoperM, Bland-Altman analysis

  •  

AI predicts prolonged air leak after lung surgery in elderly patients

When surgeons remove a portion of a cancerous lung, one of the most frustrating complications they can face is air. A persistent leak from the lung’s cut surface or staple lines — known as prolonged air leak — keeps chest tubes in place far longer than anyone would like, extends hospital stays, inflates costs, and elevates the risk of infection and other downstream problems. Now, a research team in China has developed a machine learning tool that predicts, with striking accuracy, which older lung cancer patients are most likely to develop this complication before it ever occurs. The study, published in BMC Cancer, combines cardiopulmonary exercise testing data with an interpretable artificial intelligence model and could reshape how thoracic surgical teams prepare for and manage one of the most common postoperative challenges in lung surgery.

The research was led by Zixiao Wang, Jiabao Ding, Huagang Liang and colleagues at the First Hospital of Qinhuangdao, in collaboration with Kai Wang of Tianjin Chest Hospital. It addressed a well-recognized gap in thoracic surgical practice. While prolonged air leak — typically defined as air leaking from the chest drainage system for more than five days after surgery — is among the most frequent complications following video-assisted thoracoscopic anatomical lung resection, the prediction models available to clinicians have historically lacked rigorous external validation and, critically, interpretability. Surgeons have been asked to trust risk scores without understanding where those risks come from, a barrier that has limited clinical uptake of computational tools in the operating room planning process.

To build their model, the investigators enrolled patients aged 60 and older with lung cancer who underwent thoracoscopic anatomical lung resection — either lobectomy, the removal of an entire lung lobe, or segmentectomy, the removal of a smaller anatomical segment. The study was designed as a dual-centre cohort investigation with both retrospective and prospective components. A total of 471 patients treated at Qinhuangdao First Hospital between January 2024 and June 2025 formed the model development cohort. A separate group of 140 patients from Tianjin Chest Hospital, enrolled prospectively between June and August 2025, provided the external validation set — a crucial test of whether the model generalized beyond the institution where it was built.

The methodology followed the emerging best-practice playbook for clinical machine learning. After preliminary data processing, the development cohort was randomly split into a training set containing 70 percent of patients and an internal validation set holding the remaining 30 percent. Because prolonged air leak affects only a minority of surgical patients, the training data were inherently imbalanced, with far more non-leak cases than leak cases — a condition that can fool machine learning algorithms into simply predicting that no one is at risk. The researchers countered this with SMOTE, the Synthetic Minority Over-sampling Technique, which generates synthetic examples of the underrepresented class to rebalance the dataset and force the algorithms to learn the genuine signature of risk.

Feature selection was performed using LASSO regression — least absolute shrinkage and selection operator — a statistical technique that penalizes model complexity and drives the coefficients of irrelevant variables to zero, effectively filtering a large panel of candidate variables down to the most predictive few. From this process, four predictors of prolonged air leak emerged: a history of emphysema, the smoking index, a previous history of thoracic surgery or chest trauma, and the ventilatory equivalent for carbon dioxide, abbreviated VE/VCO₂. This last variable is drawn directly from cardiopulmonary exercise testing, a stress test performed on a bicycle or treadmill that measures how the heart, lungs, and circulatory system respond together to increasing exertion. VE/VCO₂ reflects the efficiency of ventilation during exercise — how much air a patient must move to eliminate a given amount of carbon dioxide — and elevated values signal impaired pulmonary gas exchange and often underlying parenchymal lung disease.

With the four features in hand, the team constructed six competing machine learning models: logistic regression, support vector machine, decision tree, extreme gradient boosting, and artificial neural networks, among others. Each was evaluated using a battery of metrics including the area under the receiver operating characteristic curve, or AUC, the F1 score, and the Brier score, which measures the accuracy of probabilistic predictions. The winner was XGBoost, an ensemble method that builds a sequence of decision trees, with each new tree trained to correct the residual errors of its predecessors. In internal validation, XGBoost achieved an AUC of 0.903 (95 percent confidence interval, 0.834 to 0.960) — well within the range conventionally considered excellent discrimination — along with the highest F1 score of 0.717 and the lowest Brier score of 0.092 among all six candidates.

The external validation was arguably the study’s most important test. A model can memorize the quirks of its home institution’s patient population, equipment, and surgical practices, only to falter elsewhere. Yet when applied to the 140 previously unseen patients from Tianjin Chest Hospital, the XGBoost model maintained an AUC of 0.800 (95 percent confidence interval, 0.656 to 0.913), with a sensitivity of 0.700, a specificity of 0.833, and a Brier score of 0.133. In practical terms, the model correctly flagged seven out of ten patients who went on to develop prolonged air leak while correctly reassuring more than eight out of ten of those who did not — performance that, if replicated in routine practice, would give surgeons a meaningful window to intervene preemptively.

Interpretability was treated not as an afterthought but as a core design requirement. The researchers applied SHAP — Shapley Additive Explanations — a technique borrowed from cooperative game theory that assigns each feature a contribution value for every individual prediction. Rather than presenting clinicians with an opaque probability, SHAP reveals how much each of the four variables pushed a given patient’s risk up or down, and in which direction. Through this analysis, VE/VCO₂ emerged as the single most influential feature, followed by the other three predictors ranked by correlation. The finding is physiologically plausible: patients whose lungs ventilate inefficiently under the stress of exercise are precisely those whose lung tissue is most fragile and least likely to seal spontaneously after surgical manipulation. A history of emphysema, a heavy smoking history, and prior chest surgery or trauma each independently compound this tissue vulnerability.

The clinical utility of the work extends beyond prediction to prevention. Armed with a preoperative risk estimate, surgical teams can tailor their approach for high-risk patients. Options include more meticulous staple-line reinforcement, the use of sealants or pledgeted sutures on fragile lung tissue, choosing segmentectomy over lobectomy where oncologically appropriate, planning for ambulatory drainage systems on discharge, or scheduling earlier follow-up to catch and manage leaks before they become complicated. To lower the barrier to bedside use, the team built a web-based risk calculator that allows clinicians to enter a patient’s four variables and receive an individualized probability of prolonged air leak — no programming expertise required.

The significance of incorporating cardiopulmonary exercise testing into a surgical prediction model deserves particular emphasis. Traditional preoperative pulmonary assessment in lung cancer surgery has relied on static spirometric measures such as forced expiratory volume in one second, or FEV1, and the diffusing capacity for carbon monoxide, DLCO. These tests measure lung function at rest and provide only a partial picture of cardiopulmonary reserve. CPET, by contrast, captures the integrated response of multiple organ systems under physiological stress, and the VE/VCO₂ slope in particular has gained recognition as a sensitive marker of ventilatory inefficiency in chronic obstructive pulmonary disease and heart failure. The present study suggests that this dynamic measure carries prognostic information for surgical outcomes that static tests do not fully capture — a finding with implications well beyond air leak prediction.

Several caveats frame the work appropriately. The study population was limited to Chinese patients aged 60 and above undergoing video-assisted thoracoscopic resection, and generalization to younger patients, other surgical techniques such as robotic-assisted resection, or different health care systems remains to be demonstrated. The external validation cohort, while methodologically essential, comprised 140 patients, and wider multicenter prospective trials would strengthen confidence in the model’s performance. The published article is an accepted, peer-reviewed author manuscript shared early ahead of the final version of record. The study was funded by the Beijing Kechuang Medical Development Foundation, with the funder playing no role in study design, analysis, or manuscript preparation, and the authors declare no competing interests.

Even so, the study stands as a compelling example of where predictive medicine is heading. By pairing a rigorous dual-centre validation strategy with explainable artificial intelligence and a physiologically grounded predictor, the researchers have moved machine learning in thoracic surgery closer to genuine clinical utility rather than proof-of-concept novelty. For the growing population of older patients facing lung cancer surgery, a simple preoperative test and a few clicks in a web calculator may soon determine who needs extra surgical vigilance — and spare many of them the days of tethered chest drainage that have long been an accepted, if unwelcome, part of recovery.

Subject of Research: Machine learning-based prediction of prolonged air leak after video-assisted thoracoscopic anatomical lung resection in older lung cancer patients using cardiopulmonary exercise testing

Article Title: Machine learning-based prediction of prolonged air leak after video-assisted thoracoscopic anatomical lung resection in older patients using cardiopulmonary exercise testing: a dual-centre development and validation study

Article References: Wang, Z., Wang, K., Zhu, N., liu, H., Li, J., Liang, H., & Ding, J. (2026). Machine learning-based prediction of prolonged air leak after video-assisted thoracoscopic anatomical lung resection in older patients using cardiopulmonary exercise testing: a dual-centre development and validation study. BMC Cancer. https://doi.org/10.1186/s12885-026-16933-z

Image Credits: AI Generated

DOI: 10.1186/s12885-026-16933-z

Keywords: Machine learning, Prolonged air leak, Cardiopulmonary exercise testing, XGBoost, Lung cancer surgery, Video-assisted thoracoscopic surgery, Prediction models, VE/VCO₂, SHAP interpretability, Thoracic surgery, Predictive medicine, COPD

  •  

Rapid Wildfire Structure Risk Assessment Helps Fire-Adapted Communities

Wildfire scientists have unveiled a new rapid risk-assessment tool that shows substantial wildfire danger to homes and buildings in three major Arctic communities, revealing that between 14% and 26% of structures in Anchorage, Fairbanks, and Whitehorse face high or very high risk from approaching flames. The study, led by Jennifer I. Schmidt of the University of Alaska Anchorage together with Robert H. Ziel, Monika P. Calef, Anna Varvak, and Julio C. Postigo, was published in the International Journal of Disaster Risk Science. Rather than relying on complex fire-behavior simulations that demand specialist analysts and expensive software, the approach combines datasets that most local governments already possess: building footprints, zoning maps, and readily available vegetation layers. The result is an updatable, affordable portrait of which buildings face the greatest threat and where mitigation dollars can do the most good.

The urgency behind the work is hard to overstate. Wildfire costs and damages in the United States alone are now estimated at between USD 394 billion and 893 billion annually, and the 2019 to 2020 Australian fire disasters cost nearly USD 100 billion. The Arctic, often imagined as too cold and wet to burn, is not immune: since 1980, wildfires have cost Alaska between USD 2 billion and 5 billion, with projections suggesting costs could rise 68% by the end of the century. Canadian suppression expenses are expected to climb by 60 to 110% relative to the 1980 to 2009 baseline. Meanwhile, structure loss from wildfire has doubled over the past two decades in the western United States, and western Canada has suffered major structure-loss events in four of the last eight fire seasons. Nearly half the global population now lives within the wildland-urban interface, the zone where people and forests meet or intermingle, making tools that translate fire science into actionable local maps increasingly vital.

The researchers’ central premise is conceptually simple but technically consequential: for a structure to be at high risk, a flammable hazard must exist nearby, within roughly 500 meters, and the surrounding landscape must exhibit high wildfire exposure. The method begins with a flammability hazard layer at 30-meter resolution, built from a modified version of NASA’s ABoVE Landcover dataset in which generic evergreen classes were refined to reflect locally flammable species such as black spruce, white spruce, lodgepole pine, and subalpine fir, each assigned hazard ratings from 0 to 100. Critically, the team treated structures themselves as fuel. Each building contributes three fuel units to the surrounding flammability score, a value chosen after systematic testing of one through ten fuel units; three proved optimal, nudging densely built environments up a hazard category without causing wholesale reclassification. Structure density was computed at 90-meter resolution, multiplied by three, and added to the vegetation-based hazard to produce an enhanced flammability hazard layer.

Wildfire exposure, the second pillar of the assessment, captures the potential for hazard to travel. It is calculated as the average flammability hazard within a 100-meter or 500-meter radius, representing the likelihood that fire can reach and burn a given location even if the local fuels themselves are sparse. Exposure values, also ranging from 0 to 100, are classified into five tiers from very low to extreme, and concentrated pockets of flammable vegetation drive scores upward. The third ingredient is structure vulnerability, produced by multiplying the enhanced flammability hazard by a structure importance factor derived from zoning data: residential buildings and critical infrastructure such as hospitals, schools, and nursing homes receive the highest weight, followed by commercial and other structures. Where zoning was unavailable, as on military installations like Joint Base Elmendorf-Richardson in Anchorage and Fort Wainwright and Eielson Air Force Base in Fairbanks, the team collaborated with base personnel or interpreted aerial imagery to classify neighborhoods. The final risk score synthesizes hazard, exposure, and vulnerability into six categories, from extremely low to very high.

The results paint a nuanced picture of Arctic fire danger. Fairbanks showed the greatest proportion of structures in the top two risk categories at 26%, followed by Whitehorse at 22% and Anchorage at 14%. Anchorage, paradoxically, had the highest share of buildings in the top vulnerability tiers, 42%, yet the lowest risk, a consequence of its large urban footprint where dense housing raises vulnerability but fragmented, less-flammable vegetation and abundant developed ground suppress exposure. Fairbanks and Whitehorse, with structures woven into spruce- and pine-dominated boreal landscapes, showed closer alignment between vulnerability and risk. Anchorage was also the only study area where more than 1% of cells jumped two or more flammability categories when buildings were counted as fuel, at 7%, reflecting its 27% share of structure area containing seven or more buildings per cell. The analysis also confirmed the primacy of exposure: when a structure’s wildfire exposure was extreme, at least 87% of such buildings landed in the highest risk category across all three communities.

A key innovation lies in how the team redrew the wildland-urban interface itself. Traditional WUI maps distinguish urban, interface, and intermix zones; the researchers added a fourth category, the transmission zone, marking areas roughly 2.4 kilometers beyond the WUI boundary where fire could move into a community and where fuel breaks might be sited. Within the 500-meter buffer around structures, urban areas were defined by exposure values of 20 or less, interface zones by 21 to 60, and intermix by values above 60, cross-referenced with Alaska and Yukon wildfire management designations that prioritize suppression from critical down to unplanned or wilderness levels. Fairbanks claimed the largest overall WUI footprint, and the transmission zone proved the largest category in every study area, spanning 23,347 square kilometers around Anchorage, 6,180 square kilometers around Fairbanks, and 665 square kilometers around Whitehorse. Across all sites, most structures fell within interface zones, 52 to 61%, followed by intermix at 20 to 35%. Thousands of buildings sit in the high-risk interface and intermix zones where mitigation should concentrate: 15,537 structures in Anchorage, 16,212 in Fairbanks, and 3,734 in Whitehorse.

The method faced its most demanding test against a real disaster. On 17 August 2019, during southcentral Alaska’s hottest and driest summer on record, the likely human-caused McKinley wildfire was driven by high winds across 13.3 square kilometers in three days, destroying 52 residential structures, 84 outbuildings, and three commercial buildings, affecting 1,028 properties and forcing roughly 350 to 400 people to evacuate. By comparing pre-fire aerial imagery from 2017 with post-fire imagery from 2020 at 0.3-meter resolution and linking vanished buildings to the Matanuska-Susitna Borough structure database, the team identified exactly which structures burned. The verdict was statistically compelling: burned structures had significantly higher wildfire exposure than those that survived, and the proportion of burned structures with exposure values above 60 was significantly larger than among unburned ones. Structure risk scores above 60 were also significantly associated with burning. Notably, the test held even under conditions so extreme that normally resistant, low-flammability fuels were igniting.

The study’s design was shaped by sustained community engagement. Through workshops in 2019, 2021, and 2023, along with 15 to 20 meetings organized by Anchorage community councils and landowner associations and public events ranging from wildfire awareness days to Arbor Day, residents and agency staff reshaped everything from color schemes to model parameters. One consequential example: Anchorage residents and fire managers insisted that the maps reflect the spruce beetle outbreak first detected in 2016 and peaking around 2020, which killed and removed many spruce trees. The team responded with rules derived from aerial detection surveys, reclassifying white spruce cells in areas of beetle intensity of 11% or greater to mixed forest, and shifting mixed forest cells to open shrub, while a succession model updated vegetation on areas burned within the last 30 years. This iterative dialogue ensured outputs that both wildfire practitioners and the general public can interpret, a prerequisite the authors see as central to building fire-adapted communities.

The practical implications for planning are direct. Because mitigation funding is often tied to officially designated WUI areas, the ability to rapidly recalculate boundaries from updated building layers expands funding opportunities and keeps pace with community growth. The framework also points to different interventions in different zones: structures in intermix areas, surrounded by vegetation, benefit most from fuel treatments, while those in interface zones, where flammable vegetation is scarcer, are better served by home hardening measures such as fire-resistant roofs, siding, decks, screens, and unburnable buffers. Given that wildfire activity tends to occur where exposure exceeds 60, the authors recommend concentrating resources on the top two risk categories. Where national products like wildfirerisk.org rely on generalized fuel layers that can overestimate unburnable area in WUI zones and are updated too slowly for annually burning landscapes, this approach trades complexity for transparency, using local data that governments already collect. The underlying wildfire exposure toolbox is publicly available on GitHub, and the team argues that empowered residents, equipped with accurate, current, neighborhood-scale information, are crucial to reducing wildfire risk, particularly where communities may prefer action without government intervention.

Subject of Research: Rapid assessment of wildfire risk to structures and wildland-urban interface delineation in Arctic communities using local vegetation, building footprint, and zoning data.

Article Title: Fueling Fire-Adapted Communities Through a Rapid Wildfire Structure Risk Assessment

Article References: Schmidt, J. I., Ziel, R. H., Calef, M. P., Varvak, A., & Postigo, J. C. (2026). Fueling Fire-Adapted Communities Through a Rapid Wildfire Structure Risk Assessment. International Journal of Disaster Risk Science, 17(2), 351-362. https://doi.org/10.1007/s13753-026-00716-y

Image Credits: AI Generated

DOI: 10.1007/s13753-026-00716-y

Keywords: Arctic, Wildfire, Risk assessment, Wildland-urban interface, WUI, Mitigation planning, Structures, Fire-adapted communities, Wildfire exposure, Flammability hazard, Alaska, Yukon

  •  

New Genetic Evidence of an Ancient Killer Has Surfaced After Being Concealed in Medieval Texts for Centuries

The story of a Medieval European plague is coming into focus through historic manuscripts, but not in the way you might think. Instead of providing mere historical accounts, the animal skins from which these Medieval volumes are constructed provide genetic evidence for reconstructing the 3,500-year story of the sheepox virus (SPPV), which decimated European livestock.

In a recent paper published in Science Advances, an international team of interdisciplinary researchers ranging from geneticists and virologists to historians and conservators explored the history of this pre-modern plague.

The new work combs through Medieval history to reveal the lineages of diseases plaguing modern herds, providing new insight into the viruses threatening modern animal agriculture.

Medieval Texts

Chosen for the work were some of the most important Medieval manuscripts that Europe has to offer, including the millennium-old York Gospels, one of the best surviving examples of an early Anglo-Saxon illuminated manuscript. Another work used in the study was one of the earliest known English dictionaries, the Corpus Glossary of Corpus Christi College, Cambridge. Beyond these notable examples, the team exploited a variety of English and continental European works.

Medieval volumes did not contain paper pages like modern books, but instead, vellum pages made of calfskin, as well as the skins of goats and sheep. Therefore, these works are preserved as hundreds-of-years-old biological specimens for modern geneticists.

SPPV tends to target younger animals, such as the calves from whom vellum is made, and is highly contagious, rapidly spreading through large portions of a herd. While these factors made the disease easier for modern researchers to study via vellum samples, it also made it devastating to wool, meat, and milk production.

Extracting DNA

“The recording of ancient DNA of pathogens has completely changed our understanding of infectious disease in the past, and here we show that parchment can also preserve animal pathogen DNA. It is possible that archives and libraries around the world also contain the genetic traces of disease outbreaks in animals in the past,” said lead author Louis L’Hôte, PhD candidate at the University of Cambridge, Dublin.

“These genomes help us understand how these pathogens evolved and how they impacted past societies – such as sheeppox virus, which we show has been affecting Eurasian sheep herds for at least three and a half millennia,” L’Hôte added.

With the rapid spread of SPPV across herds, many manuscripts contained SPPV DNA on multiple pages within the same manuscript. Additionally, finding SPPV DNA on pages made from both calf and goat skin marks it as a rare example of cross-species infection.

“Parchment making has been considered a vanishing craft, but we are beginning to understand just how much of the past it has retained. This project shows that parchments not only preserve our cultural history for hundreds of years, but also the landscape of disease in our livestock in the medieval period,” said supervising author Dr Kevin G. Daly, Associate Professor at UCD School of Agriculture and Food Science.

“This kind of exciting, surprising discovery is only possible when researchers from a range of disciplines come together to share their expertise and data,” Day said, calling this “a generosity and trust that collaborative science depends on.”

Exploring Medieval DNA

The Medieval manuscripts combine with even older surviving biological records, such as teeth, to show the virus reaching back 3,700 years. Between the manuscripts and archaeological finds, the team identified 41 samples containing related viruses.

Along with the goatpox virus and the lumpy skin disease virus, SPPV belongs to a category called capripoxviruses. The new research allowed the team to compare the ancient and modern sequences to determine that the division between the various viruses in the group occurred between 3,700 and 11,500 years ago, around the time animal domestication took hold in Europe as sheep came off the steppe.

“Ancient genomes can help us understand how these pathogens affecting us today evolved. We find that, unlike the smallpox virus, the sheeppox virus genome was very stable over the last few millennia,” L’Hôte concluded. “This might mean that genetic changes before this point were very important to how the sheeppox virus evolved to infect its host, which may help us fight the pathogen in the future.”

The paper, “3,500 years of Sheeppox Virus Evolution Inferred from Archaeological and Codicological Genomes,” appeared in Science Advances on September 2, 2026.

Ryan Whalen covers science and technology for The Debrief. He holds an MA in History and a Master of Library and Information Science with a certificate in Data Science. He can be contacted at ryan@thedebrief.org, and follow him on Twitter @mdntwvlf.

  •  

Seismic waves reflected from Earth’s core moved parts of Japan 5 mm east

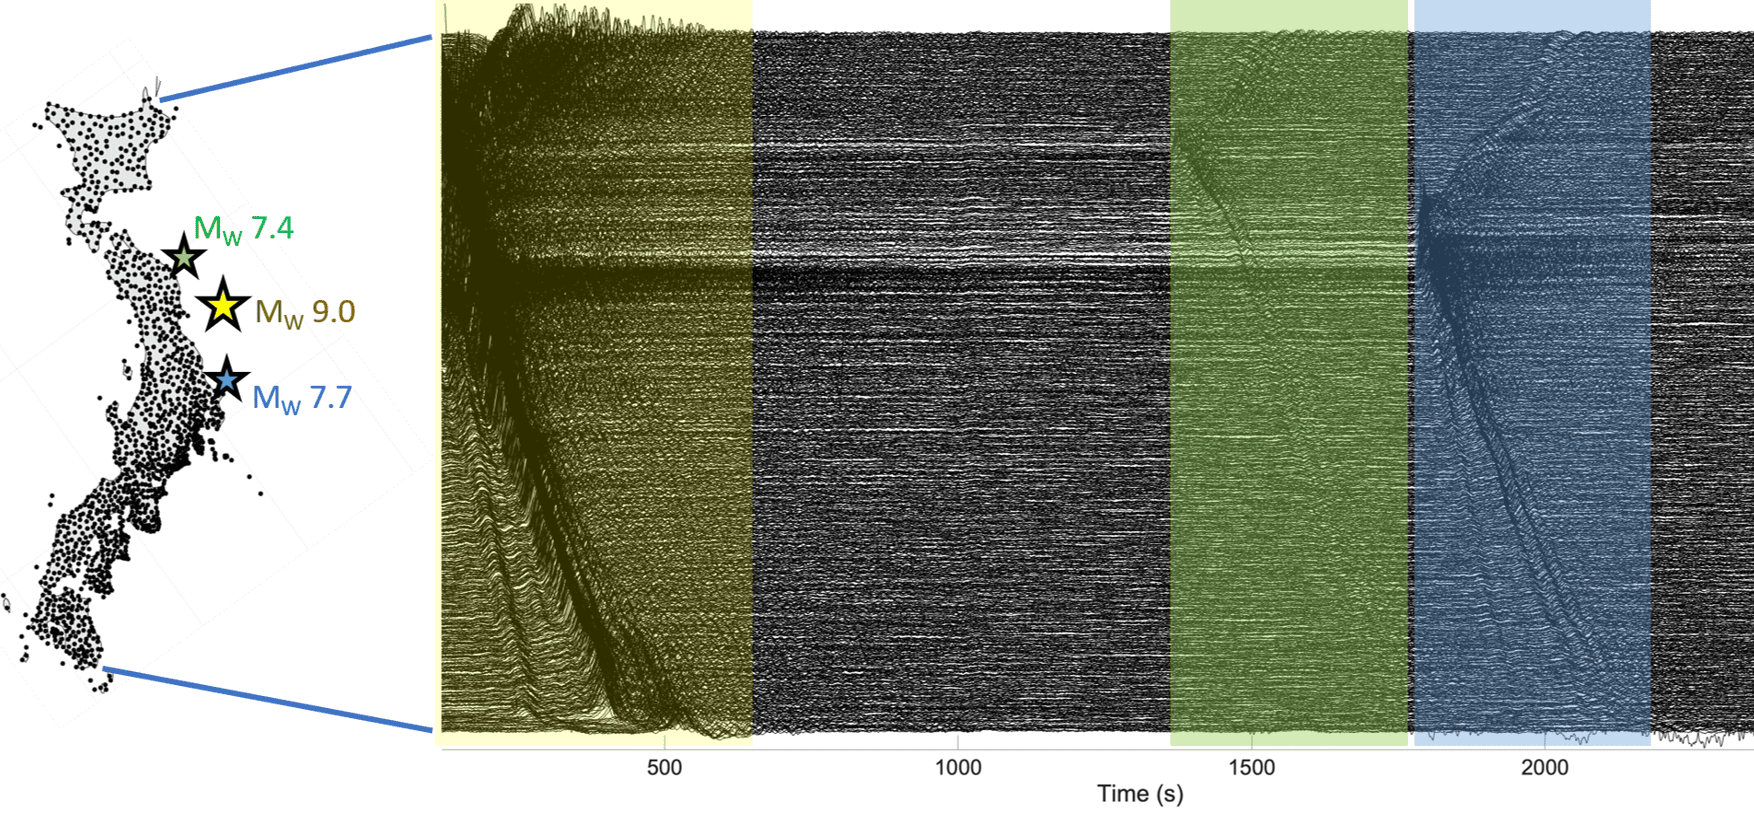
(left) A map of Japan densely covered with dots. Three stars off its eastern coast show the locations of the epicentres. (right) Graph showing eastward components of ground motion at each site. The graph resembles a bunched-up sheet, with the biggest bunches associated with the main quake (a period of up to ~600 s shown in yellow) and the two aftershocks shown in green and blue at 1500s and 2000s respectively.
Shifting eastward (left) A map of Japan showing the epicentres of the main shock (Mw 9.0) and two strongest aftershocks (Mw 7.7 and 7.4) in the Tohoku-Oki earthquake. Each black dot represents a GNSS station. (right) The observed eastward components of ground motion at each of the GNSS sites from northeast (top) to southwest (bottom) of Japan are shown in black traces, with the shaded areas representing ground motion corresponding to the main shock and the aftershocks. (Courtesy: Sunyoung Park; motion data from P Xu et al. Earth, Planets and Space 71 43 2019)

A previously unrecognized source of seismic hazard caused parts of Japan to move eastwards by up to 5 mm within minutes of the 2011 Tohoku-Oki earthquake. Conventionally, such shifts occur when seismic waves generated by rupturing tectonic plates cause the plates to slip, triggering movements of the land mass and the ocean floor. But a new study finds that in the Tohoku-Oki quake, the real culprit was waves that travelled down to Earth’s core and back – a phenomenon more usually associated with efforts to image structures deep inside the Earth.

The 2011 Tohoku-Oki quake occurred at the boundary between the Pacific plate and the North American plate, with an offshore epicentre around 130 kilometres east of Sendai. At magnitude 9, it was one of the largest recorded earthquakes in history, and it caused widespread devastation, including thousands of fatalities. The tsunami that followed exacerbated this damage, with meltdowns of three out of six nuclear reactors at the Fukushima Daiichi power station releasing radioactive caesium into the air and water and prompting a large-scale evacuation with long-term health impacts.

The earthquake was bigger than most models estimated, which compelled seismologists to examine and revise existing models of the largest possible earthquakes and their frequencies in the boundaries of tectonic plates. Instrumented records of this earthquake are still revealing new information about geophysical processes in the boundaries of tectonic plates.

Surface to core and back

In the new work, researchers led by Sunyoung Park at the University of Chicago, US studied shear waves recorded following the earthquake in Japan’s dense network of high-rate Global Navigation Satellite System instruments. Along with the expected seismic waves from the earthquake rupture, the team found so-called ScS waves that travelled thousands of kilometres through the Earth, bounced off the core and travelled back to the surface, arriving across Japan almost simultaneously 13 minutes after the main shock. “The name ScS reflects that path: S[hear] through the mantle, c for reflection at the core-mantle boundary, and then S again on the return path,” Park explains.

Although seismologists have studied ScS waves extensively, they have mostly done so for the purpose of imaging the deep Earth. “Because [ScS waves] reflect from the core-mantle boundary, they have helped constrain the depth and properties of the core-mantle boundary; the structure of the lowermost mantle; attenuation and anisotropy in the mantle; and source characteristics of large earthquakes,” Park explains.

The team’s study offers the first evidence that ScS waves can also trigger significant displacement-causing slip after an earthquake, meaning that earthquake hazard researchers may need to consider these waves to fully capture consequences of earthquake ruptures on the land as well as deep within tectonic plates.

A high-quality, high-resolution dataset

Two aspects of the Tohoku-Oki earthquake made it an incredible opportunity to study the role of ScS waves in triggering a slip event. The first is the nature of the earthquake itself. As well as releasing tremendous amounts of energy, it occurred on a shallow tectonic fault that is dipping down. This combination sent strong shear wave energy travelling nearly vertically down to the core, generating ScS waves strong enough to trigger movement in the tectonic plates.

The second was the quality and resolution of data. “Because Japan is so densely instrumented, we can look for small, coherent signals that would likely be invisible elsewhere,” Park says. “This made it a natural case in which to ask whether delayed seismic phases might trigger additional deformation.”

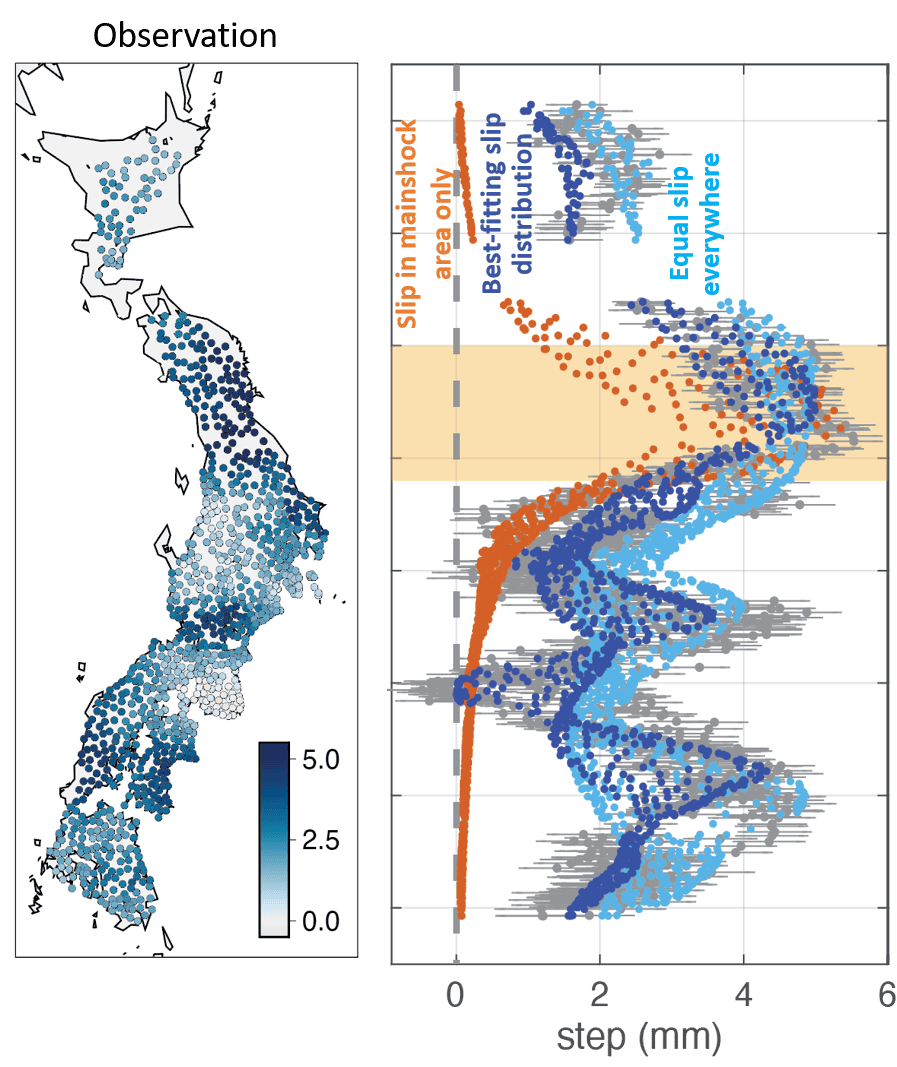
Working with Hiroo Kanamori at the California Institute of Technology (Caltech), US, and Luis Rivera at the University of Strasbourg, France, Park considered whether Earth’s elastic response to the main shock could explain Japan’s 5-mm displacement. To better understand this possibility, they calculated displacements at all the instrumented locations for many possible configurations of the earthquake rupture. However, the results did not reproduce the observed eastward motion.

At left, a map of Japan covered with dots in different shades of blue, with lightest blue representing no displacement and the darkest blue representing 5mm displacement. Large areas of Japan, especially the northeast, are dotted in dark blue. At right, a set of orange, dark blue and light blue dots representing the results of different models of displacement. The simulated data for equal slip everywhere fits the observed data better than the data for slip in main shock area only.
Competing models (left) Observed displacements in mm shown with coloured dots at each GNSS site across Japan. (right) The calculated displacement that would have occurred for slip only in the main shock area (orange dots), equal slip across the tectonic plates (light blue dots) and best fit slips corresponding to the observed displacement (dark blue dots). (Courtesy: Sunyoung Park)

The researchers then simulated possible slip scenarios across the tectonic plate interfaces, hoping to better characterize the levels and spatial extent of the slip that caused the eastward displacement. “The inferred slip event likely involved interfaces where the Pacific plate subducts beneath the Okhotsk Plate, and where the Philippine Sea plate subducts beneath the Eurasian plate,” Park says. Exactly how far this slip propagated, however, is still unknown because of the paucity of instrumented locations beyond Japan.

A slow-motion slip

Although the most memorable earthquakes and tsunamis are the ones that manifest havoc on Earth’s surface, the tectonic plates underneath are in perpetual but slow motion. At higher depths, these slow-moving plates produce earthquake events that unfold over days or weeks. Such events are called slow-slip or silent earthquakes and are important for accumulating and releasing stress as part of the earthquake cycle.

Rather than triggering a fast earthquake rupture, the ScS waves from the Tohoku-Oki quake appear to have set off a slow slip event spread over a very large area at intermediate depths of 20–60 km. This is the depth range where seismologists commonly observe silent earthquakes, and it provides avenues for understanding the dynamic processes that impact the earthquake cycle. This continuous flux in Earth’s deeper layers is a source of curiosity for many seismologists, including Park.

“A broader motivation for me is a general interest in deep-shallow interaction in the Earth,” Park tells Physics World. “I am especially interested in cases where processes or wave propagation involving the deep interior can influence faulting and deformation in the shallow lithosphere or vice versa.”

The researchers report their findings in Science.

The post Seismic waves reflected from Earth’s core moved parts of Japan 5 mm east appeared first on Physics World.

  •  

New Evidence Reshapes Understanding of Cereal Domestication’s Earliest Stages

Around 11,000 years ago, communities in southwest Asia began one of the most consequential experiments in human history: growing their own food. Wild cereals, legumes and fruit-bearing plants were gradually brought under human management, setting in motion the transition from mobile hunter-gatherer lifeways to farming societies. For decades, archaeologists have assumed that one of the earliest signs of this transformation was an increase in cereal grain size. A new study, however, suggests that some of the biggest grains found at the dawn of agriculture may not have been genetically altered at all. They may simply have grown in wetter conditions.

The findings, published in the Proceedings of the National Academy of Sciences, challenge a central assumption about how cereal domestication began. Researchers studying charred barley and emmer wheat grains from the Early Neolithic sites of el-Hemmeh and Sharara in the southern Levant found that the plants still possessed fully wild characteristics during the earliest phases of the Pre-Pottery Neolithic. Their ears had brittle rachises, the structures that naturally break apart when mature, allowing seeds to disperse in the wild. There was no evidence of the tough, non-shattering rachis that later became one of the defining features of domesticated cereals.

The absence of non-shattering forms is significant because a tough rachis makes harvesting far more efficient. In wild cereals, the rachis fractures as the plant ripens, scattering seeds before people can collect them. A mutation that keeps the grains attached would have offered major advantages to human harvesters and could then have spread through repeated cultivation and replanting. Researchers have therefore often treated the appearance of non-shattering cereals as a key marker of domestication. Grain size, by contrast, has frequently been interpreted as an earlier signal that people were already selecting plants through cultivation.

At el-Hemmeh and Sharara, however, grain size told a more complicated story. Barley and emmer wheat remained morphologically wild, yet their grains varied dramatically. Some were as small as typical wild cereals, while others fell within the size range commonly associated with domesticated plants. If large grains were the product of genetic selection caused by systematic tillage, the researchers expected to find other evidence of intensive cultivation. Instead, the ecological evidence pointed toward relatively low-disturbance environments.

The team examined the weed species preserved alongside the cereal remains. Weeds are valuable archaeological indicators because different plants thrive under different environmental conditions. Species associated with heavily tilled or frequently disturbed soils were not dominant in the assemblages from these early sites. This weakened the argument that repeated ploughing or intensive soil preparation had already created strong selection for larger seeds. The researchers began looking for another explanation for the striking variation in grain size.

Their answer came from stable carbon isotope analysis. Carbon exists in several naturally occurring forms, or isotopes, and plants incorporate these isotopes in ways that are influenced by their growing conditions. In cereals, the stable carbon isotopic composition of a grain can reflect the balance between carbon uptake and water loss during photosynthesis. When plants experience water stress, changes in gas exchange through their leaves alter the carbon isotope signal recorded in their tissues. By measuring this signal in ancient grains, scientists can reconstruct aspects of the moisture conditions under which the plants grew.

The results showed a strong relationship between grain size and water availability. Barley grains that reached domestic-sized dimensions had carbon isotope values indicating that they developed under wetter conditions. Smaller, wild-sized grains carried signatures consistent with considerably drier growth environments. The difference suggests that environmental moisture, rather than inherited genetic change, was responsible for much of the early increase in cereal grain size. In other words, the same wild plant population could produce grains of very different sizes depending on the conditions it experienced during development.

This phenomenon is known as developmental plasticity: the ability of a single genotype to produce different physical traits in response to the environment. It is widespread in plants and can affect characteristics such as height, leaf area, flowering time and seed production. In the Early Holocene southern Levant, developmental plasticity may have created the visual impression that cereals were already becoming domesticated. People collecting and replanting the largest grains might eventually have generated genetic selection, but the initial size increase itself appears to have been ecological rather than evolutionary.

“Environmental conditions provided a much better explanation for the observed variation in grain size than genetic selection under tillage,” said Dr Jade Whitlam of the University of Oxford, who led the study. The researchers propose that genetic selection for larger grains may have occurred later than previously thought, perhaps after selection for non-shattering rachises had already begun. This reverses the sequence often assumed in models of domestication and places greater emphasis on the complex interaction between climate, plant biology and human harvesting practices.

The study also reframes the origins of agriculture as a gradual process of niche construction rather than a sudden decision to domesticate plants. Early communities altered their relationship with wild vegetation through harvesting, protection, transport and repeated use of particular landscapes. These practices may have changed plant populations long before crops displayed unmistakable domestication traits. By combining archaeobotany, weed ecology and stable isotope evidence, the researchers argue that the first steps toward agriculture were not necessarily driven by deliberate genetic engineering of crops, but by prolonged human management operating within a variable environment. The result is a more nuanced picture of farming’s origins—one in which climate could temporarily make wild cereals look domesticated before their genomes caught up.

Subject of Research: The environmental and biological processes that influenced cereal grain size and plant domestication in the Early Holocene southern Levant.

Article Title: Developmental plasticity under human management shaped cereal evolution prior to domestication in the Early Holocene southern Levant

News Publication Date: 4-Aug-2026

Web References: https://www.eurekalert.org/multimedia/1146086

References: Proceedings of the National Academy of Sciences. DOI: 10.1073/pnas.2535274123

Image Credits: Jerome Poulalier, www.jerome-poulalier-photography.com

Keywords: Archaeology, archaeobotany, cereal domestication, agriculture, Neolithic, Early Holocene, southern Levant, barley, emmer wheat, stable carbon isotopes, developmental plasticity, plant evolution, climate, hunter-gatherers

  •  

Tree Shade Reveals Directional Clues

Cities may soon be able to identify their hottest walking routes with the same precision used to map traffic or public transport. HeiGIT, the Heidelberg Institute for Geoinformation Technology, has added a tree-shade indicator to its free Climate Action Navigator, a digital platform designed to help municipalities and civil society organizations understand how urban environments affect everyday life. The new tool provides a street-level view of where pedestrian paths are protected by tree canopies and where people are exposed to direct sunlight, offering planners a detailed basis for decisions about urban greening, heat adaptation and safer walking routes.

The need for such information is becoming increasingly urgent as cities experience more frequent and intense heat waves. A citywide estimate of tree cover can suggest that an urban area is relatively green while concealing major differences between neighborhoods. In one district, a large park or wooded hillside may raise the average, even though the streets used daily by residents remain almost entirely unshaded. The Climate Action Navigator is designed to reveal these local contrasts by measuring shade along pedestrian routes rather than relying only on broad land-cover statistics.

In Innsbruck, Austria, tree cover extends across approximately 30 percent of the city’s relevant areas, but the distribution is far from even. Much of the shaded pedestrian network lies outside the central urban area, while heavily used streets in the city center can remain exposed to full sun. This distinction matters because people experience heat at the scale of individual journeys: walking to school, commuting to work, visiting shops or reaching public transport. Two routes separated by only a few streets may therefore offer very different levels of thermal comfort and protection from solar radiation.

The indicator is also intended to connect physical infrastructure with human behavior and well-being. Shaded paths can make walking more attractive during hot weather, potentially influencing whether people choose to travel on foot, wait for public transport or avoid certain destinations altogether. Claudia Schmiedeberg of the GLEN Study said that understanding the social effects of climate change requires examining how local surroundings shape daily decisions over time. Combining the tree-shade data with longitudinal survey information could help researchers investigate whether residents in greener neighborhoods adapt differently to heat, and whether unequal access to shade contributes to wider social disparities.

Technically, the tool identifies pedestrian walkways that directly overlap with tree canopies at least two meters high. The height threshold is designed to distinguish trees capable of producing meaningful overhead shade from low shrubs, grass and ground vegetation. The analysis uses high-resolution global canopy datasets and applies the same processing method across different cities. This allows a small town, a regional center and a major capital to be compared using a consistent measure rather than relying on incompatible local mapping systems.

The calculation also models a high-noon scenario, when the sun is strongest and shadows are generally shortest. By estimating shade under these demanding conditions, the indicator focuses on a daily period when heat exposure may be especially severe. It measures the availability of shade at what the developers describe as the weakest point of the day, creating a conservative benchmark for planning. The result is not a complete simulation of human thermal comfort, which also depends on air temperature, humidity, wind, pavement materials and building geometry, but it provides a clear spatial signal of where tree canopy is present above pedestrian infrastructure.

Early comparisons show how sharply shade levels can differ between cities. In the historic city of Maribor, Slovenia, approximately 35 percent of the pedestrian network is covered by trees. In Tempe, Arizona, a university city located in a hot and generally arid region, the corresponding figure is just above 7 percent. Such numbers do not by themselves determine whether a city is comfortable or unsafe, but they provide a comparable starting point for identifying exposure. When combined with information about schools, care facilities, public transport stops or tourist destinations, the data can show which groups and routes may require priority attention.

Urban planners could use the indicator to decide where new trees would provide the greatest benefit, while also recognizing streets where existing canopy already supports walking during hot periods. Linking shade maps with school catchment areas, for example, could reveal whether children have protected routes to school or must travel through long stretches of direct sunlight. Tourism agencies and local authorities could also use the information to recommend cooler walking routes to major attractions. In this way, the platform is intended not only to document an environmental problem but also to support targeted interventions, from tree planting and maintenance to short-term route guidance.

Jim Walker of the Walk21 Foundation said the indicator offers comparable, street-by-street evidence that can help administrations prioritize infrastructure investment during the hottest months. Its developers argue that global canopy datasets make it possible to overcome the local data shortages that often prevent smaller municipalities from conducting detailed climate assessments. Dr. Kirsten von Elverfeldt, community engagement manager at HeiGIT, said the goal was to make granular diagnostic information freely available so that greening initiatives can be directed toward the places where they are most needed.

The Climate Action Navigator is open to the public, allowing users to explore how their municipality performs and compare different urban areas. The platform’s tree-shade indicator does not replace on-the-ground assessments, but it can help transform an abstract climate challenge into a visible pattern of shaded and exposed streets. As heat increasingly shapes how people move through cities, that ability to see the difference at walking level could make urban climate planning more precise, more equitable and more immediately actionable.

Subject of Research: Not applicable

Article Title: New Global Tool Maps Tree Shade Street by Street to Reveal Cities’ Heat Exposure

News Publication Date: August 11, 2026

Web References: Climate Action Navigator: https://heigit.org/ ; Tree shade indicator video: https://www.youtube.com/watch?v=vAQxEnAgM44 ; Innsbruck example: plugin/hiwalk?share-id=f50386c3-4ea6-45b8-946a-6fedfae38dc8 ; Maribor example: plugin/hiwalk?share-id=f675a5bd-f15f-429c-81f4-80cac6c7051a ; Tempe example: plugin/hiwalk?share-id=31880ebb-1c6d-40e1-89cf-ffac9bceb607

Image Credits: Climate Action Navigator

Keywords: urban heat, tree shade, climate adaptation, pedestrian routes, urban planning, tree canopy, heat exposure, Climate Action Navigator, HeiGIT, sustainable cities

  •  

Noninvasive nanoparticle barcoding demonstrated in nonhuman primates

Lipid nanoparticles (LNPs) have become one of the most important delivery technologies in modern medicine, helping transport messenger RNA into cells for vaccines, protein replacement therapies and experimental treatments. Yet a formulation that performs well in mice can behave very differently in humans. This species gap makes nonhuman primate studies an important step in drug development, but conventional methods for comparing multiple nanoparticles often require euthanasia and extensive tissue collection. A new study reports a way to measure the functional activity of several LNPs in the same animal using only a small blood sample.

Published in Nature Biotechnology, the work introduces a non-invasive nanoparticle barcoding platform called snapCodes. The method is designed to determine which LNP formulation successfully delivers its mRNA cargo and prompts cells to produce the encoded protein. Rather than relying on tissue harvesting, the researchers identify delivery events through DNA barcodes that can be recovered from serum and analyzed by sequencing. The approach could allow scientists to compare many candidate nanoparticles in a single nonhuman primate while reducing both animal use and the logistical burden of downstream analysis.

The central challenge addressed by the study is that nanoparticle delivery is not adequately described by measuring where an LNP travels. An LNP may reach an organ or circulate in the bloodstream without releasing its mRNA in a form that cells can translate. The new system instead records functional mRNA delivery. Each nanoparticle is associated with a distinctive DNA sequence, and the mRNA cargo is engineered to encode a fusion protein containing nanoluciferase and a SNAP-tag. Nanoluciferase is a compact enzyme that produces light in the presence of its substrate, while the SNAP-tag is a protein module capable of forming a covalent bond with specific chemical groups.

For the barcode to become a permanent molecular record of delivery, the researchers modified the DNA tags with benzylguanine. When a cell receives an mRNA molecule encoding the nanoluciferase–SNAP-tag fusion, the resulting protein can react with a benzylguanine-bearing snapCode. This creates a stable DNA–protein complex. The complexes are then exported from cells into the circulation, where they can be isolated from a small serum sample. Sequencing the recovered DNA reveals which barcoded LNPs produced the fusion protein and therefore achieved functional mRNA delivery.

The design turns transient protein expression into a measurable signal that can be collected without sacrificing the animal. This is particularly valuable in studies involving nonhuman primates, where tissue-based nanoparticle profiling can require euthanasia and can limit the number of formulations tested in each subject. A blood-based assay also makes it possible to monitor delivery over time, potentially showing how the activity of a formulation changes after dosing. The study used just 30 microliters of serum, a volume small enough to support repeated sampling and longitudinal measurements.

Before comparing nanoparticle performance, the researchers validated the molecular components of the system, including the activity of the snapCode chemistry and the ability of the fusion protein to participate in the intended covalent reaction. These steps were necessary to establish that the barcode signal reflected genuine expression of the delivered mRNA rather than nonspecific interactions. Once the platform had been characterized, the team used it to evaluate multiple chemically distinct LNPs in living animals.

The investigators intravenously administered six snapCoded LNP formulations to mice and nonhuman primates. Each formulation carried its own molecular identity, allowing all six candidates to be assessed in parallel. Serum collected after administration was analyzed for the DNA–fusion protein complexes, and sequencing was used to quantify the relative delivery activity associated with each barcode. By testing the same barcoded set across species, the researchers could directly examine whether patterns observed in mice were reproduced in nonhuman primates.

Such cross-species comparisons are crucial because LNP composition strongly influences biological behavior. Changes in ionizable lipids, helper lipids, cholesterol, polyethylene glycol-lipid components or particle structure can affect stability, organ distribution, cellular uptake and endosomal escape. These properties may differ substantially between rodents and primates because of differences in blood proteins, immune responses, tissue physiology and cellular trafficking. A method that measures expression from several formulations in the same animal may therefore reveal species-specific delivery patterns more efficiently than traditional one-formulation-per-animal experiments.

The snapCode strategy does not replace every form of nanoparticle analysis. It reports successful expression of a particular engineered mRNA and depends on the recovery and sequencing of the associated molecular complexes. It does not, by itself, provide a complete map of tissue distribution, long-term safety or therapeutic efficacy. Nevertheless, it adds a functional layer to LNP evaluation: scientists can ask not only where particles go, but which particles actually release mRNA that cells translate. In early development, that distinction can help prioritize candidates before more resource-intensive studies begin.

By combining multiplexed dosing with low-volume serum sampling, the researchers aim to make nonhuman primate testing more informative while using fewer animals. The platform could be adapted for screening delivery systems designed for different organs or therapeutic proteins, provided that the encoded reporter and barcode chemistry remain compatible with the intended experiment. As mRNA medicines expand beyond vaccines into gene editing, immunotherapy and protein replacement, tools that connect nanoparticle chemistry to real biological output may become increasingly important. Non-invasive barcoding offers a way to track those differences in living subjects and could help narrow the path from promising LNP design to clinically relevant drug candidate.

Subject of Research: A non-invasive method for comparing functional mRNA delivery by multiple lipid nanoparticles in mice and nonhuman primates using serum-based DNA barcodes.

Article Title: Non-invasive nanoparticle barcoding in nonhuman primates

Article References: Jang, B., Zenhausern, R., Lian, L. et al. Non-invasive nanoparticle barcoding in nonhuman primates. Nat Biotechnol (2026). https://doi.org/10.1038/s41587-026-03262-6

Image Credits: AI Generated

DOI: https://doi.org/10.1038/s41587-026-03262-6

Keywords: lipid nanoparticles, mRNA delivery, nanoparticle barcoding, snapCodes, SNAP-tag, nanoluciferase, nonhuman primates, serum sequencing, drug delivery, RNA therapeutics

  •  

U.S. Claims Data Reveal Need to Standardize First-Episode Psychosis Incidence Estimates

A new study is drawing attention to a hidden problem in mental-health research: scientists may be using the same words to describe first episode psychosis (FEP) while measuring entirely different things. In an analysis published in Schizophrenia, researchers Seiber, Sridhar, Hasenstab and colleagues examine how U.S. insurance claims data are used to estimate the incidence of FEP—the number of new cases appearing in a population over a defined period—and argue that greater standardization is urgently needed.

First episode psychosis refers to the point at which a person experiences psychotic symptoms for the first time in their life. These symptoms can include hallucinations, delusions, disorganized thinking or major changes in behavior and functioning. FEP is not a single diagnosis. It can occur in schizophrenia-spectrum disorders, bipolar disorder, severe depression and several medical or substance-related conditions. Because early treatment is linked to better long-term outcomes, knowing how often FEP occurs is essential for planning specialized clinics, staffing early-intervention programs and directing public-health resources.

The researchers focus on U.S. claims data, enormous digital records generated when patients receive medical care and providers submit bills to insurers. These databases can include diagnostic codes, procedure codes, prescription information, dates of service and details about emergency, inpatient and outpatient treatment. Unlike traditional epidemiological surveys, claims datasets can cover millions of people and make it possible to study patterns across large geographic areas. Their scale, however, does not automatically make their estimates precise.

The central challenge is that a billing code is not the same as a clinical assessment. A code for psychosis may indicate a confirmed diagnosis, a suspected condition, a historical problem or a provisional label assigned during an emergency evaluation. Claims data also rarely contain the complete clinical narrative needed to determine whether symptoms truly represent a person’s first psychotic episode. A patient may have received care in another health system, paid out of pocket, changed insurers or carried an earlier diagnosis that is invisible in the database being studied.

Even the definition of “incidence” can vary. Some researchers count a first-ever psychosis-related diagnosis, while others count a first hospitalization, a first emergency-department visit or the first appearance of a relevant code after a period without documented care. These approaches can produce different numbers from the same underlying population. A study requiring a long “clean period”—a span of time with no previous psychosis-related claims—may reduce the likelihood of counting established cases as new, but it can also exclude people whose earlier treatment occurred outside the available records.

Age, sex, insurance type and geography can further influence the apparent rate of FEP. Young adults may be more likely to encounter emergency services, while people in rural areas may face limited access to psychiatrists and specialized programs. Differences in insurance coverage can determine which services generate observable claims. If researchers compare estimates without accounting for these factors, they may mistake variations in detection or access for genuine differences in disease occurrence.

The study’s call for standardization points toward a more consistent technical framework. Researchers need to specify which diagnostic codes qualify as psychosis, whether substance-induced and medically caused episodes are included, how long a person must remain free of prior claims to be considered a new case, and which healthcare settings are examined. They also need to define the population denominator—the number of people considered at risk—and explain how individuals with incomplete enrollment or interrupted insurance coverage are handled.

Validation is another crucial step. Claims-based algorithms should be compared with detailed chart reviews, clinical registries or structured assessments to determine how accurately they identify genuine FEP. Two statistical measures are especially important: sensitivity, or the ability to capture true cases, and positive predictive value, or the proportion of algorithm-identified cases that are confirmed after review. An algorithm with high sensitivity may find more possible cases but also produce more false positives; one with high specificity may miss people who received vague or inconsistent coding.

Standardized methods could make FEP estimates more comparable across states, insurers and research teams. That would help scientists detect real trends rather than methodological noise and could reveal whether early psychosis services are reaching the populations most in need. More reliable estimates could also strengthen efforts to investigate racial, socioeconomic and regional disparities, provided that claims data are interpreted carefully and not treated as a complete substitute for clinical information.

The message from the research is not that U.S. claims databases are unusable. On the contrary, their breadth makes them one of the most powerful tools available for studying mental-health care at scale. But their value depends on transparent definitions, validated case-finding methods and clear reporting standards. As health systems increasingly rely on administrative data and automated analytics, agreeing on what counts as a new case of psychosis may be the difference between a map that reveals a public-health crisis and one that merely reflects the quirks of the billing system.

Subject of Research: Estimating first episode psychosis incidence rates using U.S. claims data

Article Title: Estimating first episode psychosis (FEP) incidence rates using U.S. claims data: a need for standardization

Article References: Seiber, E.E., Sridhar, S., Hasenstab, K.A. et al. “Estimating first episode psychosis (FEP) incidence rates using U.S. claims data: a need for standardization.” Schizophrenia (2026). https://doi.org/10.1038/s41537-026-00793-4

Image Credits: AI Generated

DOI: 10.1038/s41537-026-00793-4

Keywords: First episode psychosis, FEP, incidence rates, U.S. claims data, schizophrenia, mental health, epidemiology, healthcare data, standardization

  •  

ONE Microscopy Advances High-Resolution Imaging for Scientific Discovery

Expansion microscopy has spent the past decade changing the rules of super-resolution imaging. Instead of relying solely on increasingly sophisticated optics, the technique physically enlarges biological specimens so that molecules separated by nanometers become easier to distinguish with ordinary fluorescence microscopes. Now, researchers have introduced a method designed to push that concept toward one of the most difficult goals in microscopy: seeing the shapes of individual proteins directly.

The approach, described by Ahmed H. Shaib, Mahmoud M. Alawieh and Stefan O. Rizzoli in Nature Protocols, combines one-step nanoscale expansion microscopy with fluctuation-based super-resolution analysis. The resulting workflow, called ONE microscopy, is intended to make molecular-scale imaging more accessible to laboratories that do not have access to cryo-electron microscopes or specialized high-end optical systems.

Traditional light microscopy is limited by diffraction, a physical effect that causes light from two nearby objects to blur together when they are too close. Even modern super-resolution methods can require complex instruments, intense labeling strategies or extensive computational processing. Expansion microscopy takes a different route. Researchers anchor biological molecules within a swellable polymer network and then expand the material, increasing the physical distance between fluorescent labels.

The expansion step does not automatically reveal every molecular detail. A protein’s structure can still be represented by only a small number of fluorescent signals, and conventional images may contain noise, background fluorescence and motion-related fluctuations. ONE microscopy addresses these limitations by analyzing changes in fluorescence intensity over time. These fluctuations contain information about the presence, position and behavior of labeled molecules that may not be obvious in a single frame.

In practical terms, the method links chemical preparation, physical enlargement and computational analysis into a single workflow. Samples are embedded in a polymer gel, labeled to identify the proteins of interest and then expanded. After expansion, researchers acquire image sequences using conventional fluorescence equipment. Specialized software analyzes the temporal variation in the recorded signals, extracting spatial information beyond what a standard diffraction-limited image would provide.

This combination is significant because it shifts the focus from simply locating a protein to examining its overall shape. For many biological questions, knowing that a protein is present is not enough. Its size, orientation and structural organization can determine how it interacts with membranes, vesicles, organelles or neighboring proteins. Directly observing those features could help researchers investigate molecular machines in their native cellular environments rather than relying exclusively on purified samples or averaged structural models.

The protocol is designed to work across a broad range of biological materials, including purified proteins, cultured cells and tissues. That flexibility could make the technique useful for researchers studying protein organization at multiple scales. A purified protein might provide a controlled test of shape reconstruction, while cells and tissues could reveal how the same protein is arranged amid the crowded and complex environment of living biology.

A major part of the reported advance is the accompanying software package. Fluctuation-based imaging can be powerful, but its usefulness depends on reliable data processing, and computational analysis has often been a barrier for non-specialist users. The authors present the software as stable and user-friendly, with the goal of making the analysis more efficient, reproducible and practical for laboratories using standard fluorescence microscopes.

ONE microscopy does not replace cryo-electron microscopy, which remains capable of resolving structures at atomic or near-atomic scales under appropriate conditions. Nor does it eliminate the challenges associated with labeling, gel chemistry, image quality and sample preparation. Expansion can introduce distortions, and successful imaging depends on preserving the relationship between the fluorescent labels and the underlying structures. Nevertheless, the method offers a complementary strategy: rather than averaging thousands or millions of molecules, it aims to examine individual protein shapes through expanded, fluorescence-labeled specimens.

The researchers describe the workflow as a practical framework for protein imaging on conventional equipment. By combining physical separation of fluorophores with information extracted from fluorescence fluctuations, the method brings nanoscale structural analysis closer to routine biological imaging. Its broader impact may come not from replacing existing forms of super-resolution, but from making a previously specialized capability more reproducible and attainable for laboratories investigating how individual proteins operate inside cells and tissues.

Subject of Research: One-step nanoscale expansion microscopy for visualizing individual protein shapes using conventional fluorescence microscopes.

Article Title: ONE microscopy.

Article References: Shaib, A.H., Alawieh, M.M. & Rizzoli, S.O. ONE microscopy. Nature Protocols (2026). https://doi.org/10.1038/s41596-026-01399-x

Image Credits: AI Generated

DOI: https://doi.org/10.1038/s41596-026-01399-x

Keywords: expansion microscopy, ExM, nanoscale imaging, super-resolution microscopy, fluctuation-based analysis, protein structure, fluorescence microscopy, single-protein imaging, cryo-electron microscopy, biological imaging

  •  

Biomedical Imaging Foundation Models: Separating Hype from Reality

Foundation models are promising to become the “universal translators” of biomedical data—but a new perspective argues that medicine should resist treating them as all-knowing digital doctors. In a review published in Nature Biomedical Engineering, researchers describe how large, adaptable artificial intelligence systems are reshaping biomedical imaging while warning that impressive benchmark scores can conceal serious weaknesses in clinical environments. Their central message is direct: foundation models are most likely to improve healthcare by augmenting specialists, not replacing them.

Foundation models are designed to learn broad representations from enormous and diverse datasets before being adapted to specific tasks. In biomedical imaging, those data may include magnetic resonance imaging, computed tomography, X-rays, ultrasound, digital pathology slides and ophthalmic images. The same underlying model could theoretically identify tumors, segment organs, estimate disease risk, retrieve similar cases and generate clinical reports. The vision becomes even broader when imaging is combined with pathology, electronic health records and genomic information, creating a composite system intended to analyze a patient across multiple biological scales.

That ambition reflects a major change from traditional medical AI. Earlier systems were generally built for one narrowly defined task, such as detecting pneumonia on chest radiographs or outlining a brain lesion on MRI scans. Foundation models instead attempt to create a reusable backbone that can be transferred across diseases, hospitals and imaging technologies. Technically, they learn statistical patterns in high-dimensional data, often through self-supervised training in which the system predicts missing, transformed or associated information. Afterward, developers fine-tune or prompt the model for particular clinical applications.

But biomedical imaging is not a single, uniform world. Images differ according to scanner manufacturer, acquisition protocol, patient population, disease prevalence and local clinical practice. A model trained primarily on data from large academic hospitals may perform very differently in community clinics, rural settings or countries with limited equipment. This problem, known as domain shift, can occur even when images appear visually similar. Small changes in image quality, contrast, hardware or patient demographics may alter the statistical distribution learned by the model and undermine its predictions.

The authors introduce a framework called real-world evaluation and assessment of foundation models, or REAL-FM, to examine whether these systems are ready for practical use. Rather than focusing only on accuracy scores, REAL-FM considers several dimensions at once, including the quality and representativeness of training data, technical readiness, clinical value, integration into existing workflows and responsible artificial intelligence. The framework is intended to help clinicians interpret claims about new models and to push developers toward evaluations that resemble actual medical practice.

One of the sharpest distinctions in the perspective is between pattern recognition and causal reasoning. Foundation models can become extraordinarily skilled at recognizing visual associations—for example, linking a particular texture or anatomical feature with a diagnosis present in their training data. Yet association is not the same as understanding why a disease occurs, how it will progress or whether a treatment will benefit an individual patient. A model may identify a correlation that is valid in one hospital but reflects a hidden confounder, such as a scanner type, reporting convention or patient-selection pattern, rather than a biological signal.

This limitation becomes especially dangerous when models are moved beyond simplified benchmarks. Many benchmark datasets provide carefully curated images, clear labels and narrowly defined tasks. Clinical care is messier: scans can be incomplete, diagnoses can be uncertain, records may contain contradictory information and several conditions may coexist. The perspective highlights a lack of verified generalization across such conditions, along with a shortage of prospective, outcome-based validation. In a prospective study, an AI system would be evaluated while care is actually being delivered, with researchers measuring whether it improves diagnostic accuracy, treatment decisions, patient outcomes or workflow efficiency.

Data scarcity is another obstacle. The largest foundation models require vast quantities of data, but medical information is difficult to collect, standardize and share. Patient records are fragmented across institutions, imaging data may lack reliable annotations and rare diseases are inherently underrepresented. Privacy regulations and governance requirements further complicate the creation of centralized datasets. As a result, a model may appear broadly capable while remaining poorly tested in the populations and clinical circumstances where errors could have the greatest consequences.

The researchers argue that human oversight therefore remains indispensable. In practical terms, foundation models may be most useful as clinical assistants that prioritize images for review, highlight suspicious regions, summarize longitudinal records or offer a second opinion that specialists can interrogate. Safe deployment will require transparent reporting of uncertainty, monitoring for performance drift, mechanisms for correcting errors and clear accountability when recommendations influence care. The future envisioned by the authors is not a single monolithic medical oracle, but a coordinated ecosystem of specialized AI systems, each evaluated for a defined clinical role and connected to expert-led workflows.

The perspective arrives as the biomedical AI field races toward increasingly general-purpose systems. Its warning is not that foundation models lack value, but that technical scale alone cannot establish clinical reliability. Before these models can be trusted with consequential decisions, they must demonstrate robustness across domains, usefulness in real workflows, safety under unexpected conditions and measurable benefits for patients. The proposed REAL-FM framework offers a way to separate viral demonstrations from durable medical progress—by asking not only what a model can recognize, but where it works, why it works and whether it makes care better.

Subject of Research: Foundation models and their real-world evaluation in biomedical imaging and clinical medicine.

Article Title: Foundation models in biomedical imaging: turning hype into reality

Article References: Muneer, A., Zhang, K., Hamdi, I. et al. Foundation models in biomedical imaging: turning hype into reality. Nature Biomedical Engineering 10, 1557–1575 (2026). https://doi.org/10.1038/s41551-026-01762-z

Image Credits: AI Generated

DOI: 10.1038/s41551-026-01762-z

Keywords: foundation models, biomedical imaging, medical artificial intelligence, clinical AI, multimodal AI, domain shift, causal reasoning, clinical validation, responsible AI, REAL-FM

  •  

Mark Zuckerberg doesn’t understand how to live

Mark Zuckerberg wearing sunglasses

Recently, a man I was rock climbing with told me about how he'd used AI to make a motivational poster for himself, which he'd hung on his bedroom wall: a bear, walking a slackline over a canyon, holding a sign that said, "Do cool shit." I made what I hoped was a polite noise. What reaction was this man looking for? He probably hoped someone, maybe me, would say it was cool or inspiring. It seemed I was not the first person he'd told about this poster. "You know, it's funny," he said to me. "No one ever says anything about it."

I have been thinking about this now for several days. There's a sort of turducken of things that I find off-puttin …

Read the full story at The Verge.

  •  

Machine Learning Predicts Falls in Older Adults Using Dual-Task Gait Measures

Falls among older adults often begin with changes too subtle to be noticed during an ordinary walk. A person may still appear steady while moving through a familiar environment, yet struggle when asked to divide attention between walking and another task. A new study by researchers Dong, Hu, Guo and colleagues examines whether machine-learning techniques can identify this hidden vulnerability in community-dwelling older adults by analyzing how gait changes during dual-task walking. Published in BMC Geriatrics in 2026, the research focuses on a potentially powerful combination of digital movement measurement and artificial intelligence: spatiotemporal gait parameters recorded while people walk and perform a second mental or motor activity.

Walking is not a single, automatic action. It requires continuous coordination between the brain, muscles, sensory systems and balance mechanisms. When a person walks while counting backward, answering questions or carrying an object, the nervous system must distribute attention between locomotion and the competing task. This is known as dual-task walking. Older adults who have limited cognitive or physical reserve may respond by slowing down, shortening their steps, widening their base of support or becoming more irregular in their timing. These adaptations can provide clues about fall susceptibility that may remain invisible during conventional clinical walking tests.

The study’s central idea is that gait should be evaluated under realistic cognitive pressure rather than only in ideal, distraction-free conditions. Spatiotemporal gait parameters describe measurable features of movement across time and space, including walking speed, stride length, step time, cadence, stance duration and the variability between consecutive steps. In a dual-task setting, researchers can also examine the degree to which these variables change compared with normal walking. This difference, often called dual-task cost, can reveal how much a person’s mobility is affected when attention is divided. A larger cost may indicate reduced ability to manage competing demands while remaining stable.

Machine learning offers a way to analyze these patterns simultaneously. Traditional clinical assessment may focus on one or two measurements, such as walking speed or the number of previous falls. A machine-learning model can process many variables at once and search for combinations associated with elevated risk. Depending on the model design, the system may learn from labeled examples, in which participants’ gait data are linked to fall-related outcomes, and then estimate risk for new individuals. Algorithms can detect nonlinear relationships that are difficult to capture with conventional statistical methods, although their usefulness depends heavily on the quality, size and representativeness of the data used for training.

The community setting is especially important. Many studies of balance and falls are conducted in hospitals or specialist laboratories, where participants may be healthier, more closely supervised or less representative of the broader older population. Community-dwelling adults live independently and encounter the complex conditions that make falls more likely: distractions, uneven surfaces, hurried movement, household obstacles and the need to perform several tasks at once. By focusing on this group, the research addresses a practical question for preventive medicine: can accessible gait testing identify people who appear independent but may require additional support before a serious fall occurs?

A potential advantage of this approach is its ability to move fall-risk assessment toward objective, repeatable measurement. Gait sensors, pressure-sensitive walkways, wearable devices or camera-based systems can convert movement into numerical data. Those data may be more sensitive than a brief visual observation, particularly when they capture step-to-step variability and changes induced by a secondary task. In the future, similar measurements could potentially be collected in clinics, rehabilitation centers or even at home. However, a prediction tool would need to be tested across different ages, health conditions, walking environments and technology platforms before it could be trusted for widespread use.

The research also highlights the technical challenges behind apparently simple predictions. Falls are influenced by numerous factors, including muscle strength, vision, medication use, reaction time, fear of falling, neurological disease and environmental hazards. Gait features alone cannot explain every incident. A machine-learning model may also perform impressively on the data used to develop it but less reliably on people from another population, a problem known as limited generalizability or overfitting. For clinical adoption, researchers must therefore evaluate calibration, sensitivity and specificity, test the model on independent datasets and make its decisions understandable to health professionals and patients.

Although the citation identifies the study’s objective and methodology, it does not provide detailed numerical findings such as sample size, predictive accuracy or the specific algorithm used. Those results will determine how close this technology is to practical deployment. Even so, the study reflects a broader shift in geriatric care: fall prevention is increasingly being treated as a problem of measurable, dynamic performance rather than a simple checklist of past incidents. By combining dual-task gait analysis with machine learning, the researchers are investigating whether the body’s response to distraction can serve as an early warning signal—one that could eventually help clinicians intervene before a dangerous fall changes an older person’s independence.

Subject of Research: Fall-risk prediction in community-dwelling older adults using machine learning and dual-task spatiotemporal gait parameters.

Article Title: Machine learning-based fall risk prediction in community-dwelling older adults using dual-task spatiotemporal gait parameters.

Article References: Dong, G., Hu, H., Guo, Y. et al. “Machine learning-based fall risk prediction in community-dwelling older adults using dual-task spatiotemporal gait parameters.” BMC Geriatrics (2026). https://doi.org/10.1186/s12877-026-07998-3

Image Credits: AI Generated

DOI: 10.1186/s12877-026-07998-3

Keywords: machine learning, fall risk prediction, older adults, community-dwelling older adults, dual-task walking, gait analysis, spatiotemporal gait parameters, geriatric medicine, balance, mobility.

  •  

Brain-region microstructure and gene activity reveal Alzheimer’s neurodegeneration

Alzheimer’s disease may be leaving a more precise anatomical signature in the brain than scientists once realized. A new study published in Translational Psychiatry investigates regional changes in the fine structure of brain tissue immediately beneath the cerebral cortex, known as the juxtacortical region, and links those changes to patterns of gene expression associated with neurodegeneration. The work, led by J. Zhang, L. Sun, X. Yang and colleagues, offers a combined view of Alzheimer’s biology that connects what can be detected through brain imaging with the molecular programs active inside vulnerable neural tissue.

The juxtacortical zone is a narrow but biologically important interface. It lies directly beneath the cortex, the outer layer responsible for functions including memory, language, perception and decision-making. Although much Alzheimer’s research has focused on cortical thinning, large-scale tissue loss and abnormalities in deeper brain structures, the tissue bordering the cortex may reveal earlier or more regionally specific changes. Its organization includes densely packed axons, dendrites, neurons, glial cells and blood vessels, all of which can be affected as the disease progresses. Subtle disruption in this area could therefore provide clues before dramatic anatomical damage becomes visible.

The study’s central idea is that Alzheimer’s disease does not alter every brain region in the same way. Instead, neurodegeneration follows a complex geography shaped by cellular composition, connectivity, metabolism and genetic vulnerability. By examining regional juxtacortical microstructural changes, the researchers seek to move beyond a simple question of whether tissue has shrunk. Microstructure refers to the organization of brain components at scales smaller than conventional anatomical imaging can directly resolve. Variations in water diffusion, tissue organization and local architecture can serve as indirect markers of changes to axons, membranes, extracellular space and other microscopic features.

This regional perspective matters because the same imaging signal can arise from different biological processes. A change in tissue organization may reflect loss of neuronal connections, damage to myelinated fibers, altered glial activity, inflammation or shifts in the balance of cellular compartments. Imaging alone can reveal where abnormalities are concentrated, but it cannot always explain why they occur. The researchers therefore paired their investigation of juxtacortical structure with gene-expression information, creating a bridge between regional anatomy and molecular biology. That combination can help identify which biological pathways may underlie the imaging patterns seen in Alzheimer’s disease.

Gene expression describes the activity of genes within cells and tissues: which genetic instructions are being read, and at what levels. In the Alzheimer’s brain, these molecular signatures can point toward processes such as synaptic dysfunction, immune activation, impaired energy production, protein handling and cellular stress. Mapping gene-expression patterns onto regions showing microstructural alterations may reveal whether vulnerable areas share particular molecular characteristics. It may also help distinguish tissue changes related directly to neurodegeneration from those associated with aging or general brain atrophy. The result is a more layered portrait of disease, linking microscopic organization to the biological machinery that maintains it.

The findings described by the paper’s title suggest that these two forms of evidence—regional microstructure and gene activity—provide complementary insights into Alzheimer’s pathology. Rather than treating the brain as a uniform organ undergoing gradual damage, the research emphasizes a mosaic of vulnerability. Some areas may show distinctive structural disruption alongside gene-expression profiles associated with neuronal injury or altered support-cell function, while other regions may be relatively resilient. Such differences could help explain why symptoms vary between individuals and why memory, language, attention and other abilities can deteriorate along different trajectories.

The work could also influence how scientists think about biomarkers. A biomarker is a measurable biological feature that helps indicate disease presence, progression or response to treatment. Traditional markers of Alzheimer’s include abnormal amyloid and tau proteins, brain volume loss and changes in metabolism. Juxtacortical microstructural measures, especially when interpreted alongside molecular data, could eventually add regional detail to this toolkit. They might help researchers identify tissue at risk, track the spread of degeneration or evaluate whether an experimental therapy is protecting neural architecture even before clinical improvement becomes obvious.

However, the study should not be interpreted as proof that a single imaging signature can diagnose Alzheimer’s disease or predict an individual’s future with certainty. Microstructural measurements are indirect, and gene-expression data often come from specialized datasets that may not capture every cell type or every stage of disease. Differences in age, disease severity, medication, vascular health and individual brain organization can also influence results. The strength of the approach lies not in one isolated measurement, but in the convergence of regional imaging and molecular evidence. Together, these methods can generate testable hypotheses about how and where neurodegeneration unfolds.

The broader message is that Alzheimer’s research is moving toward increasingly integrated maps of the human brain. The study by Zhang, Sun, Yang and colleagues presents the juxtacortical region as a potentially informative frontier, where microscopic tissue organization and gene regulation intersect. If future research confirms these relationships in larger and more diverse groups, the approach could sharpen disease staging and improve the design of targeted therapies. For now, the findings add weight to a crucial principle in neuroscience: understanding Alzheimer’s requires knowing not only which brain regions are damaged, but also how their cellular architecture and molecular identity make them vulnerable.

Subject of Research: Regional juxtacortical microstructural changes and gene expression in Alzheimer’s disease

Article Title: Regional juxtacortical microstructural changes and gene expression provide insights into neurodegeneration in Alzheimer’s disease

Article References: Zhang, J., Sun, L., Yang, X. et al. “Regional juxtacortical microstructural changes and gene expression provide insights into neurodegeneration in Alzheimer’s disease.” Translational Psychiatry (2026). https://doi.org/10.1038/s41398-026-04292-z

Image Credits: AI Generated

DOI: https://doi.org/10.1038/s41398-026-04292-z

Keywords: Alzheimer’s disease, neurodegeneration, juxtacortical microstructure, gene expression, brain imaging, neuroscience, biomarkers, translational psychiatry

  •  
❌