❌

Reading view

The best place to look for alien megastructures might be moon dust

Our search for technosignatures – clear signs of advanced civilizations beyond Earth – takes many forms. Many are driven by the famous Drake equation, which attempts to estimate how many technological civilizations there are in the Milky Way. However, there’s a big fat question mark at the end of that equation in the form of […]

The post The best place to look for alien megastructures might be moon dust appeared first on Knowridge Science Report.

  •  

Hints for Massive Galaxy Evolution from Dusty Star-Forming Galaxies

NGC 972

How do massive galaxies form and evolve? A recent study traces the stellar and dust distributions across evolutionary phases of massive galaxies to better understand how massive dusty star-forming galaxies fit into the picture.

Dusty Massive Galaxies

Massive galaxies, like the Milky Way or even larger, undergo phases of active star formation and quiescent phases of inactivity, but exactly how these galaxies evolve through these stages is not yet fully understood. Dusty star-forming galaxies, which are undergoing a period of intense star formation and shrouded in dust, might be the missing evolutionary step between star-forming and quiescent phases of massive galaxy evolution. 

Currently, the leading explanation for massive galaxy formation and evolution is inside-out growth — star formation and quenching start in the inner regions of a galaxy and progress outward. However, it’s not clear whether dusty star-forming galaxies also follow the favored inside-out pathway, or if they instead proceed outside-in, first growing their disks and then assembling a central bulge.

JWST NIRCam images

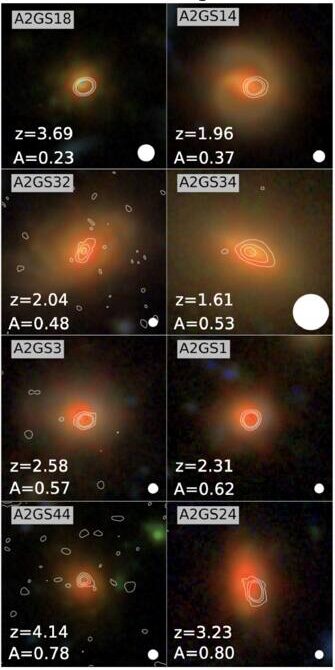
Example of JWST NIRCam images with ALMA contour lines overlaid for select dusty star-forming galaxies in the sample. [Modified from Bodansky et al 2026]

The spatial distribution (or morphology) of the stars and dust within dusty massive galaxies can help us trace their evolution. Thanks to high-resolution observations from JWST and the Atacama Large Millimeter/submillimeter Array (ALMA), researchers can now directly compare the morphologies of distant star-forming, quiescent, and dusty galaxies during the height of our universe’s star formation. Filling this gap will reveal how dusty star-forming galaxies may connect star-forming and quiescent galaxies in massive galaxy evolution.

Multiwavelength Morphological Comparisons

To directly compare the star and dust morphologies across massive galaxies, Sarah Bodansky (University of Massachusetts, Amherst) and collaborators selected a sample of 33 dusty star-forming galaxies from the GOODS-ALMA 2.0 survey that searched the sky for 1.1-mm dust emission as well as star-forming and quiescent comparison samples drawn from JWST observations. Combining the ALMA survey data with JWST imaging, the authors studied the rest-frame optical (stars) and rest-frame near-infrared (dust) morphologies of dusty, star-forming, and quiescent galaxies at redshifts around cosmic noon (a few billion years after the Big Bang).

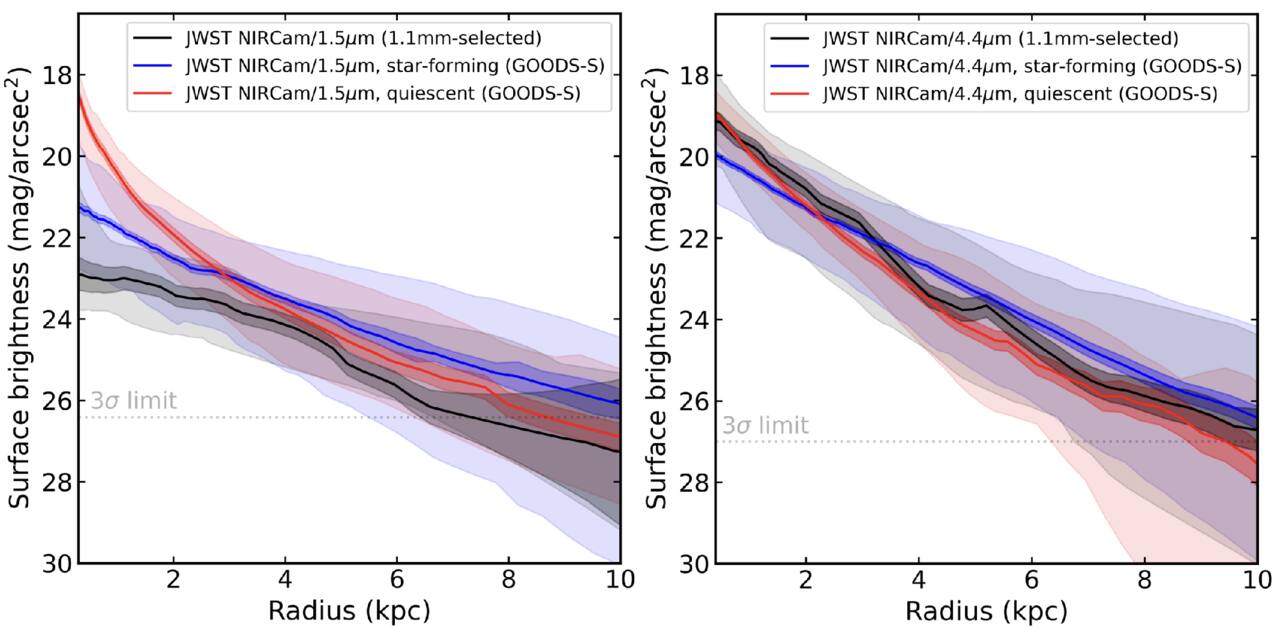
When comparing optical morphologies, the authors found that dusty star-forming galaxies and typical star-forming galaxies had similar distributions, but their near-infrared morphologies showed clear differences. Dusty galaxies tended to show more compact near-infrared emission, with dust tracing their stellar populations and more concentrated in the galaxies’ central regions. Though clearly different from star-forming galaxies, the authors noted striking similarities between the near-infrared morphologies of the dusty star-forming and quiescent galaxies, especially within their centers.

Surface brightness profiles

Average surface brightness profiles for the rest-optical (left) and rest-near-infrared (right) for the dusty (black), star-forming (blue), and quiescent (red) galaxies. In the near-infrared, the dusty star-forming galaxy profile appears very similar to the quiescent galaxy profile. [Bodansky et al 2026]

All of these properties suggest that dusty star-forming galaxies have built up stellar mass and dust in their cores, potentially forming a central bulge first and supporting an inside-out model of massive galaxy growth. This points to dusty star-forming galaxies as possible direct progenitors of early massive quiescent galaxies, hanging onto their last bit of star formation before becoming quiet as well. While this study morphologically distinguishes dusty galaxies from their star-forming and quiescent counterparts, future spectroscopic studies comparing the kinematics of these populations and investigations of molecular gas distributions are necessary to better pin down the evolutionary connection between star-forming, dusty, and quiescent massive galaxies.

Citation

“JWST+ALMA Reveal the Buildup of Stellar Mass in the Cores of Dusty Star-forming Galaxies at Cosmic Noon,” Sarah Bodansky et al 2026 ApJ 1001 235. doi:10.3847/1538-4357/ae4f64

The post Hints for Massive Galaxy Evolution from Dusty Star-Forming Galaxies appeared first on AAS Nova.

  •  

A Dust Curve That Breaks the Mold

Tarantula Nebula

Editor’s Note: Astrobites is a graduate-student-run organization that digests astrophysical literature for undergraduate students. As part of the partnership between the AAS and astrobites, we occasionally repost astrobites content here at AAS Nova. We hope you enjoy this post from astrobites; the original can be viewed at astrobites.org.

Title: The AURORA Survey: The Nebular Attenuation Curve of a Galaxy at z = 4.41 from Ultraviolet to Near-Infrared Wavelengths
Authors: Ryan L. Sanders et al.
First Author’s Institution: University of Kentucky
Status: Published in ApJ

Imagine a galaxy from 13 billion years ago, long before the Milky Way took its current form. Now picture trying to uncover the secrets of that ancient galaxy. How quickly did it create stars and evolve? Here’s the tricky part: its light has journeyed across an unimaginable distance to get here. On its journey, cosmic dust — tiny grains of carbon and silicates — has scattered and dimmed the light, making the task harder.

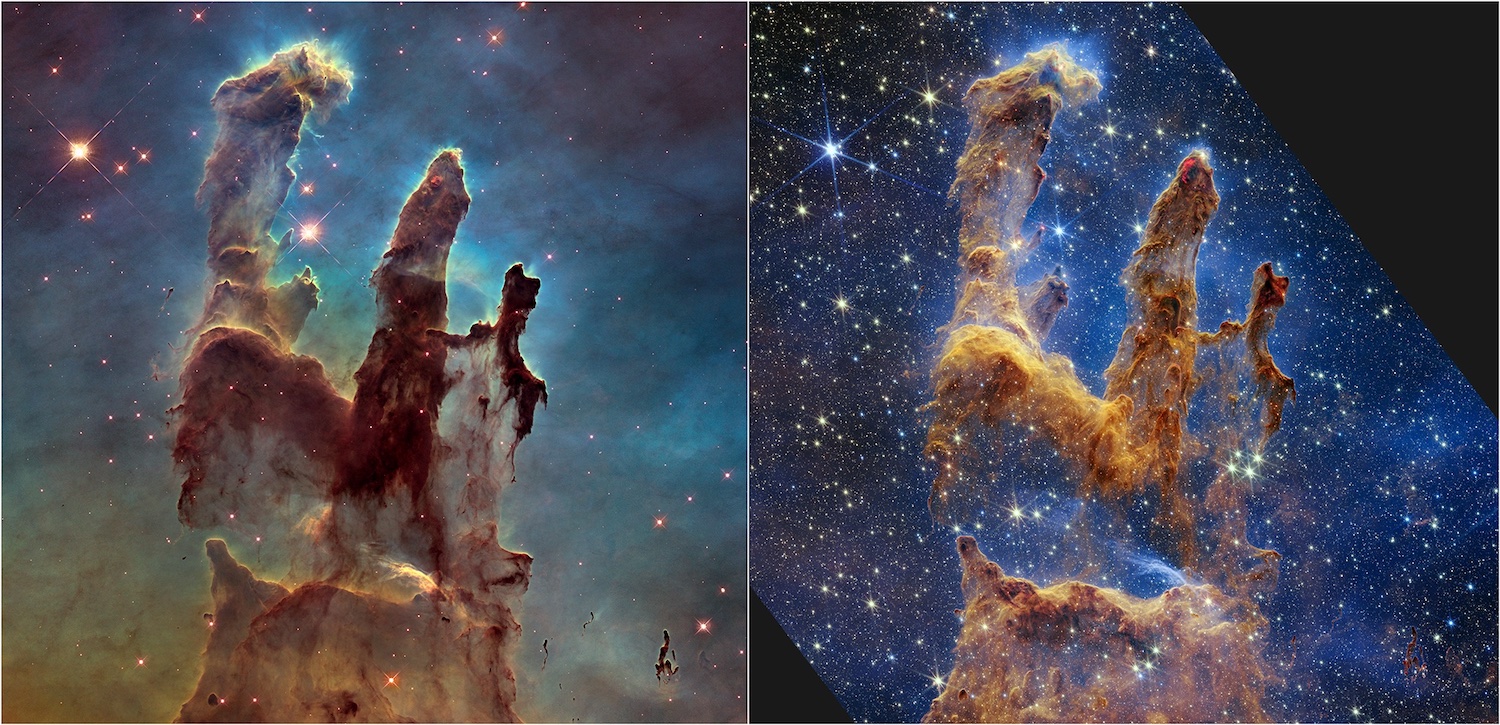
Dust doesn’t just block light — it changes it. Ultraviolet (UV) light gets scattered much more than light at longer wavelengths, which is why galaxies seem redder and dimmer than they truly are. This dual nature can be seen in the “Pillars of Creation,” in Figure 1. A new near-infrared image from NASA’s JWST, shown in the right panel below, helps us peer through more of the dust in this star-forming region. The thick, dusty brown pillars are no longer as opaque, and many more red stars that are still forming come into view.

Pillars of creation as seen by Hubble and JWST

Figure 1: On the left, NASA’s Hubble Space Telescope captures the iconic Pillars of Creation in stunning visible light (2014). On the right, JWST unveils a breathtaking infrared view, revealing even more details hidden within the cosmic dust. [NASA, ESA, CSA, STScI; Joseph DePasquale (STScI), Anton M. Koekemoer (STScI), Alyssa Pagan (STScI)]

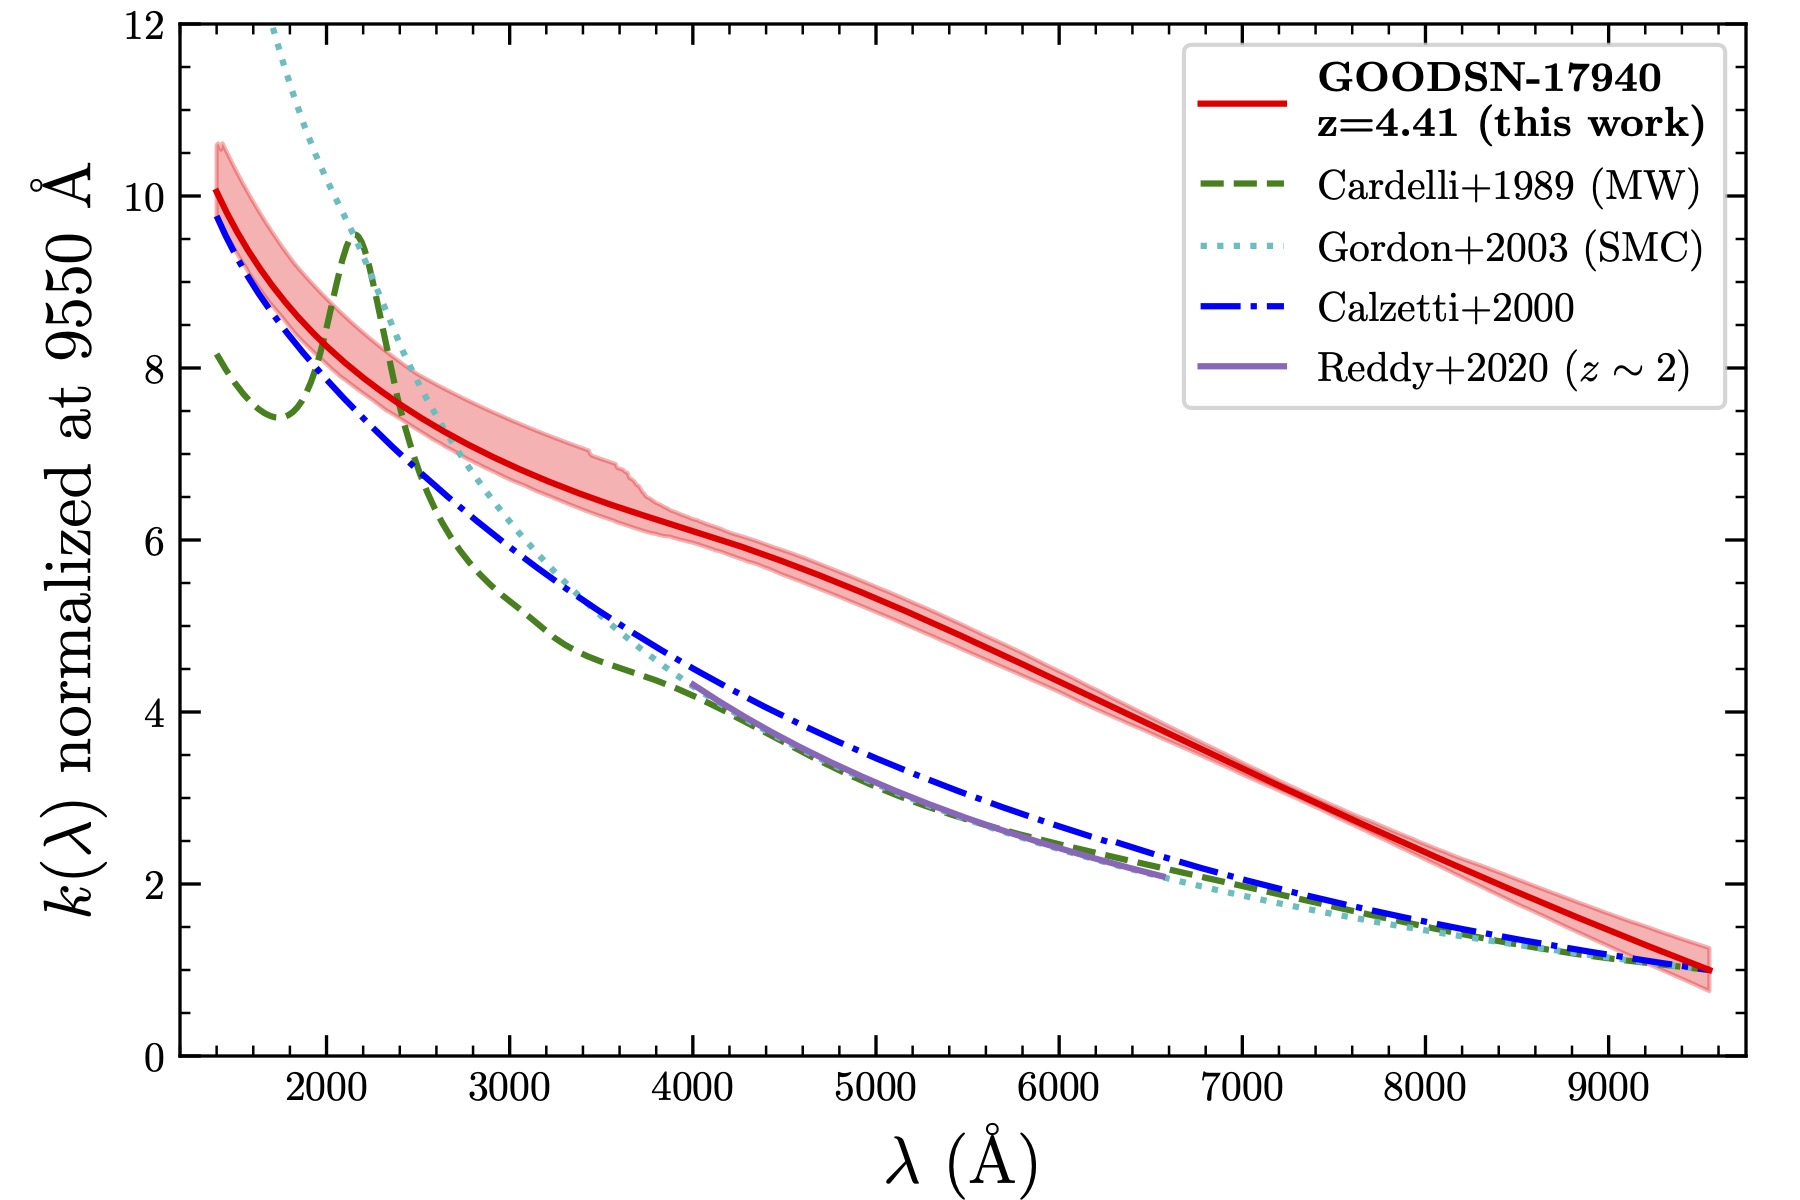
To quantify how dust affects light at different wavelengths, astronomers use dust curves — tools that reveal how much light is blocked or scattered, helping them correct for dust-induced distortions. For instance, the Milky Way’s curve stands out with a distinct “bump” around 2175 Å, which comes from tiny carbon-based particles in the dust. But the Small Magellanic Cloud (SMC) tells a different story. Its curve is steeper in the UV and doesn’t have that bump at all. These differences aren’t just random — they give us clues about the size, makeup, and distribution of dust grains in each galaxy. (See Figure 3 below for a visualization of these dust curves.)

But here’s the catch: most of the dust curves we have were designed for galaxies much closer to us, like the Milky Way or the SMC, so they may not apply in the exact same way to distant galaxies. Whether those same curves work for the much younger, chaotic galaxies of the early universe is an open question. The dust in nearby galaxies is well studied and relatively predictable, but does dust behave the same way in galaxies billions of years in the past?

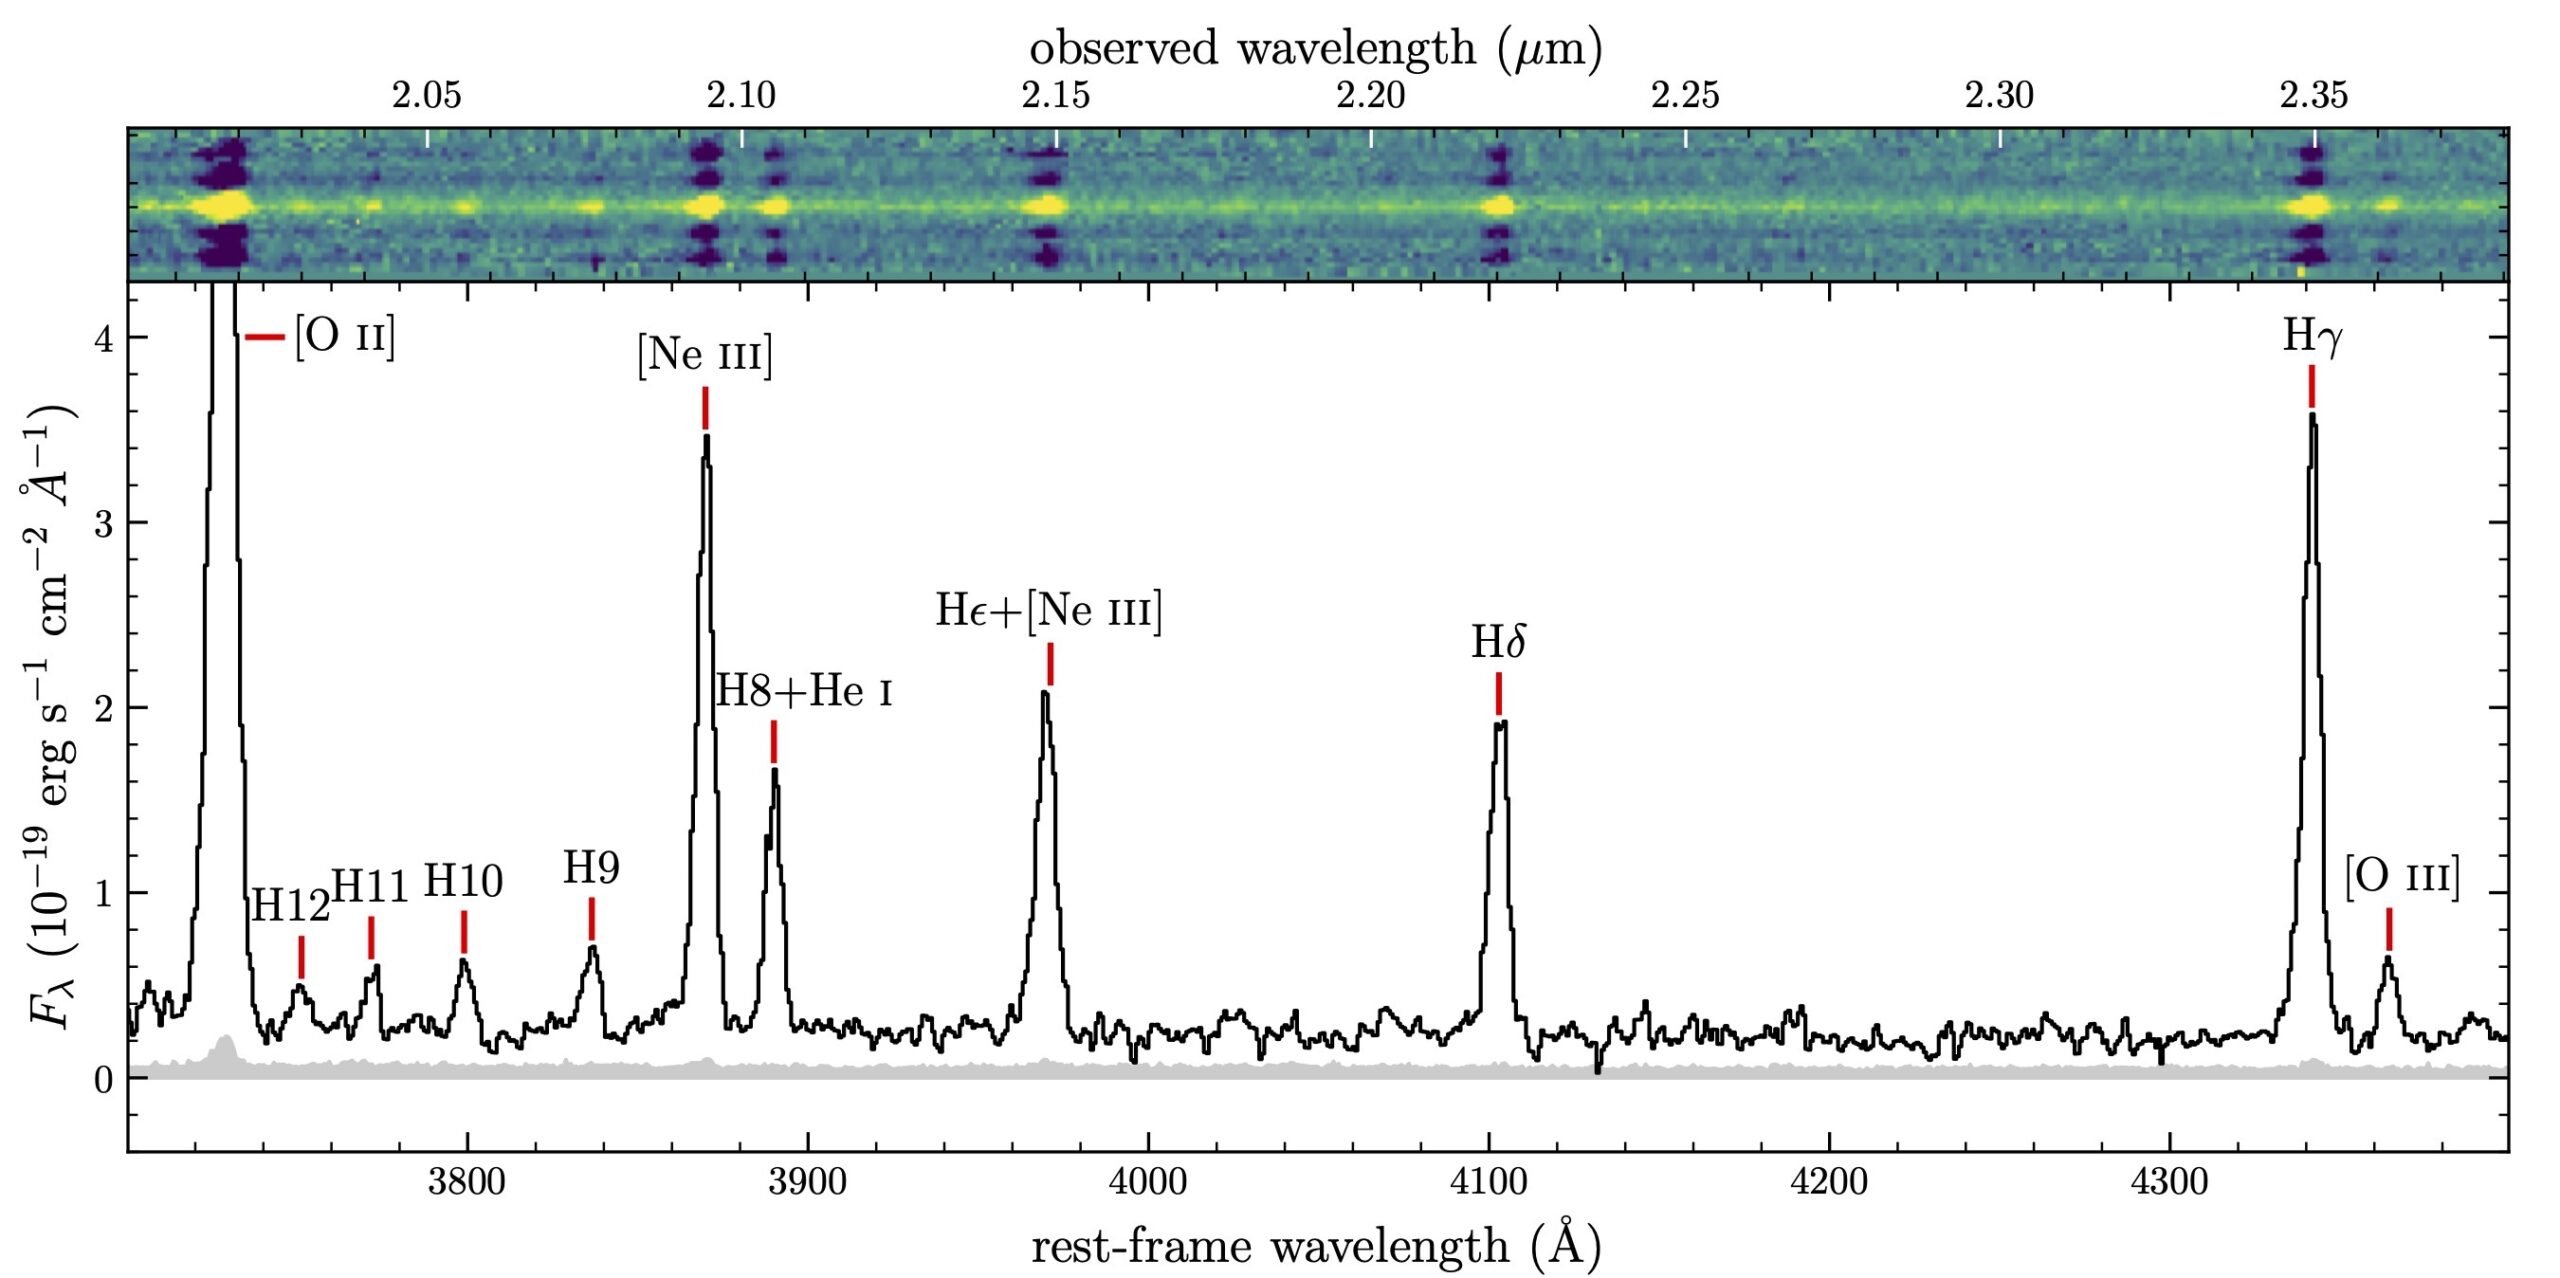
This question drove Ryan Sanders and collaborators to study GOODSN-17940, a starburst galaxy located at a redshift of z = 4.41, when the universe was just 1.36 billion years old. Observed as part of the Assembly of Ultradeep Rest-optical Observations Revealing Astrophysics (AURORA) survey using JWST, this galaxy provided an unprecedented opportunity to investigate how dust behaved in the distant past. Using JWST’s NIRSpec instrument, the team constructed a unique dust curve by studying 11 hydrogen emission lines from Hα to H12 (the twelfth line in the rest-frame optical Balmer series), shown in Figure 2. These lines act like lighthouses, their brightness giving away how much light is being absorbed by dust at each wavelength. By comparing the observed brightnesses of these lines, the researchers created a detailed dust curve tailored to GOODSN-17940.

Spectrum of GOODSN-17940

Figure 2: Spectrum of GOODSN-17940 from the AURORA survey, showing hydrogen Balmer lines. These features help estimate the galaxy’s dust and ionization conditions. The top panel presents the 2D spectrum, showing spatially resolved emission that traces the galaxy’s structure, while the bottom panel shows the corresponding 1D spectrum. [Adapted from Sanders et al. 2025]

GOODSN-17940’s dust curve is shown in Figure 3. The y-axis represents the factor by which light is blocked/scattered by dust compared to this amount at 9550 Å. For example, a value of 2 means that light at that wavelength is attenuated two times more than light at 9550 Å.
dust attenuation curve of a redshift 4.41 galaxy compared to nearby galaxies

Figure 3: The dust curve of GOODSN-17940 (solid red line) at z = 4.41, derived in this work, compared to established curves for the Milky Way (green dashed), Small Magellanic Cloud (SMC, dotted cyan), Calzetti et al. (blue dot-dashed), and Reddy et al. z ~ 2 galaxies (purple solid). This curve is steeper in the near-infrared and flatter in the UV, highlighting unique dust properties in this galaxy. [Sanders et al. 2025]

This dust curve is surprising. In the near-infrared, it is much steeper than the curves of the Milky Way or SMC. This suggests the galaxy’s dust grains might be smaller or distributed differently. But in the UV, the curve flattens out, showing less absorption than classical models predict. And unlike the Milky Way’s dust, there’s no 2175 Å bump at all. These findings hint at a galaxy with truly unique dust properties, shaped by its extreme youth and chaotic star-forming environment. But here’s the twist — GOODSN-17940 isn’t just any galaxy. Its star formation rate is 40 times higher than typical galaxies at its redshift. While rare at redshifts of z ∼ 2–4, galaxies like this are more common in the epoch of reionization, suggesting that what we’ve learned from GOODSN-17940 could apply to reionization-era galaxies — the ones that played a key role in shaping the early universe.

So, why does this even matter? If you used the Milky Way’s dust curve to adjust for the dust in a galaxy like GOODSN-17940, you’d be way off. In fact, you’d underestimate its star formation rate by up to 50%! This isn’t just a minor detail — it could explain why star formation rates derived from Hα don’t always match those derived from UV luminosity. Such details can completely change how we interpret a galaxy. It’s the difference between a galaxy steadily forming stars and one caught in a dramatic starburst phase. That’s why astronomers focus on creating dust curves tailored to individual galaxies. This study isn’t just about one galaxy — it’s about rethinking how we interpret dust, star formation, and galaxy evolution in the early universe. Before JWST, isolating individual emission lines from distant galaxies was challenging, but it has become much more efficient now. As more galaxies like GOODSN-17940 are studied, we might find that many early galaxies had dust curves breaking the mold, forcing us to refine how we measure star formation and understand cosmic history.

Original astrobite edited by Hilary Diane Andales and Delaney Dunne.

About the author, Niloofar Sharei:

I’m a third-year Astronomy PhD student at University of California, Riverside, where I study bursty star formation histories and how galaxies take shape. When I’m not busy exploring the universe, you can usually find me curled up with a good book, hiking somewhere peaceful, trying astrophotography, or getting lost in Bach’s music and art.

The post A Dust Curve That Breaks the Mold appeared first on AAS Nova.

  •  

Escaping the Dust Trap: Simulations of Dust Dynamics in Protoplanetary Disks

Through detailed simulations of gas and dust, a recent study revealed that the behavior of dust within protoplanetary disks is a bit more complex than previously assumed.

Dust Traps in Protoplanetary Disks

As a planet forms within a protoplanetary disk — dust and gas orbiting a new star — tidal interactions between the budding body and the dusty material surrounding it can create pressure bumps where dust builds up. These dust traps appear as rings in observations of protoplanetary disks.

Dust traps are thought to play a critical role in the disk’s evolution and the early stages of planet formation. Dust traps may prevent solid material from migrating inward, starving the inner disk and impeding planet growth interior to the trap. These reservoirs may also serve as a chemical barrier, keeping volatile materials like water from moving to the inner regions of a disk.

While a perfect dust trap completely isolates material from the rest of the disk, recent observations and 2D simulations have shown that dust traps may be a bit more permeable — leaking smaller sized grains, mixing material, and changing the disk’s appearance. However, these results only account for two dimensions of the complex three-dimensional environment in which dust traps reside. Thus, 3D hydrodynamical simulations are necessary to provide more realistic details of dust dynamics within planet-hosting protoplanetary disks. 

Dusty Simulations

Dust-gas density ratios for 3d models at 1500 orbits

Z-axis averaged dust–gas density ratios (top) and dust–gas surface density ratios for the 3D simulations after 1,500 orbits. For the simulations with higher diffusion and lower planet mass, there is clear leaking of dust beyond the dust trap ring (edges marked with dotted red lines). Click to enlarge. [Huang et al 2025]

In a recent study, Pinghui Huang (Chinese Academy of Sciences; University of Victoria) and collaborators performed multiple 2D and 3D numerical simulations of gas and dust within a protoplanetary disk with a forming planet. The simulations varied the mass of the planet and the level of turbulent diffusion — how well material and energy flow and mix within the gas. These variations allowed the authors to explore how dust traps behave within different types of systems. 

The simulations showed that the embedded planet will perturb the gas and dust, producing density shocks that create gaps and, subsequently, pressure bumps where dust traps coalesce. From their analysis, the authors found that dust traps become leakier at higher levels of diffusion and when the embedded planet is lower in mass. Essentially, if the gas flows and mixes more efficiently, the perturbations of the planet are erased more quickly, and if the planet is sufficiently small, its ability to disrupt the disk is much weaker. Dust remains coupled to the gas, flowing through these weak traps without becoming stuck. Additionally, the 3D simulations show higher amounts of leakage compared to the 2D simulations, which the authors attributed to the asymmetric and complex vertical geometry of the disk.

Trapping over time.

Flux-trapping ratio (left) and mass-trapping ratio (right) as a function of time for the 2D (top) and 3D (bottom) simulations. The higher-mass planet in Model A causes more flux and mass-trapping than the lower-mass planets and more turbulent systems. Additionally, the 3D simulations show significantly lower flux and mass-trapping than the 2D simulations. Click to enlarge. [Huang et al 2025]

Implications and Comparison to Observations

What then are the consequences of leaky dust traps? In planet formation theory, dust traps determine the mass at which a planet creates a sufficient pressure bump that isolates small pebbles and dust exterior to its orbit. For perfect dust traps, this isolation of material from the planet and inner disk creates a clear chemical distinction between the inner and outer disk. However, as shown by the 3D simulations, dust traps are imperfect, allowing small particles to filter through; the authors suggest this may mean that the growing planet slows but does not stop the migration of solid materials in a disk.

Recent observations of protoplanetary disks reveal the presence of larger volatiles within the inner disk. Specifically, the disk PDS 70 shows water emission in its inner disk despite having two confirmed giant planets orbiting in the outer disk. Without leaky dust traps, volatiles like water would be trapped in the pressure bumps created by these planets. However, as the authors have shown, the complex reality of dust dynamics within protoplanetary disks allows heavier elements to leak through, enriching the inner disk. Further observations and detailed 3D simulations will allow astronomers to understand the extent of leaky dust traps and reveal the realistic conditions driving early planet formation.

Citation

“Leaky Dust Traps in Planet-Embedded Protoplanetary Disks,” Pinghui Huang et al 2025 ApJ 988 94. doi:10.3847/1538-4357/addd1f

The post Escaping the Dust Trap: Simulations of Dust Dynamics in Protoplanetary Disks appeared first on AAS Nova.

  •  

Saharan Dust Cloud Over Europe: How Desert Thunderstorms Launch Millions of Tons of Dust Into the Atmosphere

Earth Oddities • Strange Weather Phenomena • Global Dust Transport • Go back to Strange Sounds A massive Saharan dust plume has drifted across parts of Europe, hazing alpine views and coloring sunsets across the continent. But the most surprising part of the story is how the dust gets into the sky in the first […]

The post Saharan Dust Cloud Over Europe: How Desert Thunderstorms Launch Millions of Tons of Dust Into the Atmosphere appeared first on Strange Sounds.

  •  
❌