 Login

The Information Overload Problem and the Rise of Aggregated Data
The challenge of information overload Researching a product online used to mean reading a handful of opinions. Now

California could be due for a major earthquake in the near future, according to concerning new models based on data comprising 1,000 years of quake activity on the West Coast.
According to recent findings, tectonic stress has quietly been building in California to levels not seen since the last major earthquake in the region, which bore a magnitude of 7.9 and struck the West Coast nearly 170 years ago.
That event, known as the Fort Tejon earthquake, affected the greater Los Angeles area, and since the time of those historic rumblings, researchers have grown increasingly concerned about a period of seismic silence that could point to the likelihood of an event of similar magnitude at some point in the future.
The potentially concerning new forecast was detailed in a recent study by an international team of researchers led by Dr. Liliane Burkhard of the Division of Space Research and Planetary Sciences (WP) at the Physics Institute of the University of Bern, which focused on historic earthquake data as a means of gauging current stress loading at Cajon Pass.
The study, published in the Journal of Geophysical Research: Solid Earth, indicates tectonic stress levels that are now believed to exceed the highest seen during the years the team surveyed.
The researchers aimed to investigate stress that has slowly built along the San Andreas and San Jacinto faults and incorporated what they likened to an “earthquake gate” at Cajon Pass, which, in their models, functioned like a point of control that governed the size of earthquakes and whether they could spread to both systems.
For their research, they used a four-dimensional earthquake cycle model that allowed them to replicate certain processes both in spatial dimensions and across time.
Using a millennium of reconstructed earthquake data from the region based on geological information such as radiocarbon dates, unusual events recorded in dendrochronological data (i.e., information obtained from tree rings), and historical information sources, the team gave this to the model they devised.
Dr. Burkhard said the team’s simulation offered them a unique opportunity to better understand the ways stresses in the fault system build up over long periods of several centuries.
“By running the earthquake history of Southern California as a simulation, we can estimate the extent to which the fault system is already under stress today,” Dr. Burkhard said. The results of those simulations weren’t particularly promising either: according to Burkhard, current stress levels in the region are the highest they have been in 1,000 years, based on the data.
The team also identified significant new information regarding the function of the so-called “earthquake gate” at Cajon Pass.
“The earthquake gate concept captures something important about how fault junctions work,” Burkhard said in a recent statement. “Cajon Pass doesn’t simply block or channel earthquakes: It responds to stress conditions, and those conditions change over centuries.”
Not only this, but Burkhard and her team also determined that a key element to these quakes involves not only the level of stress that accumulates at a single fault, but perhaps more significantly, the way stress between two systems can align. This is because, as the stress across a pair of faults rises together over longer periods, this appears to be most conducive to a large joint rupture comparable to the 1857 Fort Tejon earthquake.
Conversely, if stress levels are not in concert as they evolve, the team determined that this causes quakes that probably will not propagate beyond the junction.
In short, a more severe earthquake event today would entail a joint rupture that crosses the Cajon Pass, as opposed to one constrained either to the San Andreas or the San Jacinto Fault alone. Should such an event occur, it would likely impact one of the largest population centers, as well as a crucial infrastructure system that supplies energy and transportation to surrounding areas.
For Burkhard, “The question of when and how the next major earthquake will occur in this region is one of the most pressing problems in applied geoscience.” Based on the team’s findings, they say that their new modeling hopes to provide a much more complete picture of the science behind the factors that could lead to a major quake—conditions that could apply equally to other parts of the world as they do to California.
Burkhard adds that her team’s study is not intended merely as a prediction for when the next major earthquake could potentially occur, but also as a means of preparing for future quakes and mitigating their effects.
“What we can say is that the system is critically stressed and that physics-based models like ours give a clearer picture of the range of scenarios we should be prepared for,” Burkhard says. “This information is important for hazard assessment, infrastructure planning, and emergency preparedness.”
The team’s study, “Cajon Pass and the Southern San Andreas Fault System: Earthquake Cycle Stress Accumulation and Present‐Day Loading,” appeared in the Journal of Geophysical Research: Solid Earth.
Micah Hanks is the Editor-in-Chief and Co-Founder of The Debrief. A longtime reporter on science, defense, and technology with a focus on space and astronomy, he can be reached at micah@thedebrief.org. Follow him on X @MicahHanks, and at micahhanks.com.
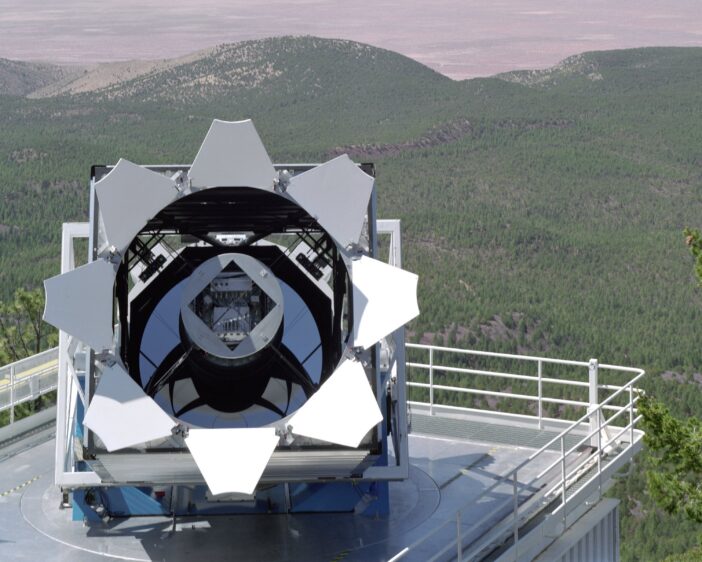
The Sloan Digital Sky Survey (SDSS) fundamentally changed the way modern astronomy research is done. This “grand and bold thing” is not frozen in a museum exhibit, however: instead, the SDSS telescopes and team have continued to iterate. The collaboration recently described the fifth generation of this groundbreaking survey in The Astronomical Journal.
Astronomy is now without question a “big data” science. While a lucky few researchers still occasionally travel to distant mountaintops to sojourn with the stars, most astronomers who can describe their work as “observational” rarely ever leave their laptops. Petabytes of historical data, including images, spectra, enormous simulation archives, and more, are available the instant one’s fingers touch a keyboard. As a result, the speed of discovery has increased exponentially, and the barriers to cutting-edge research have dramatically shrunk.
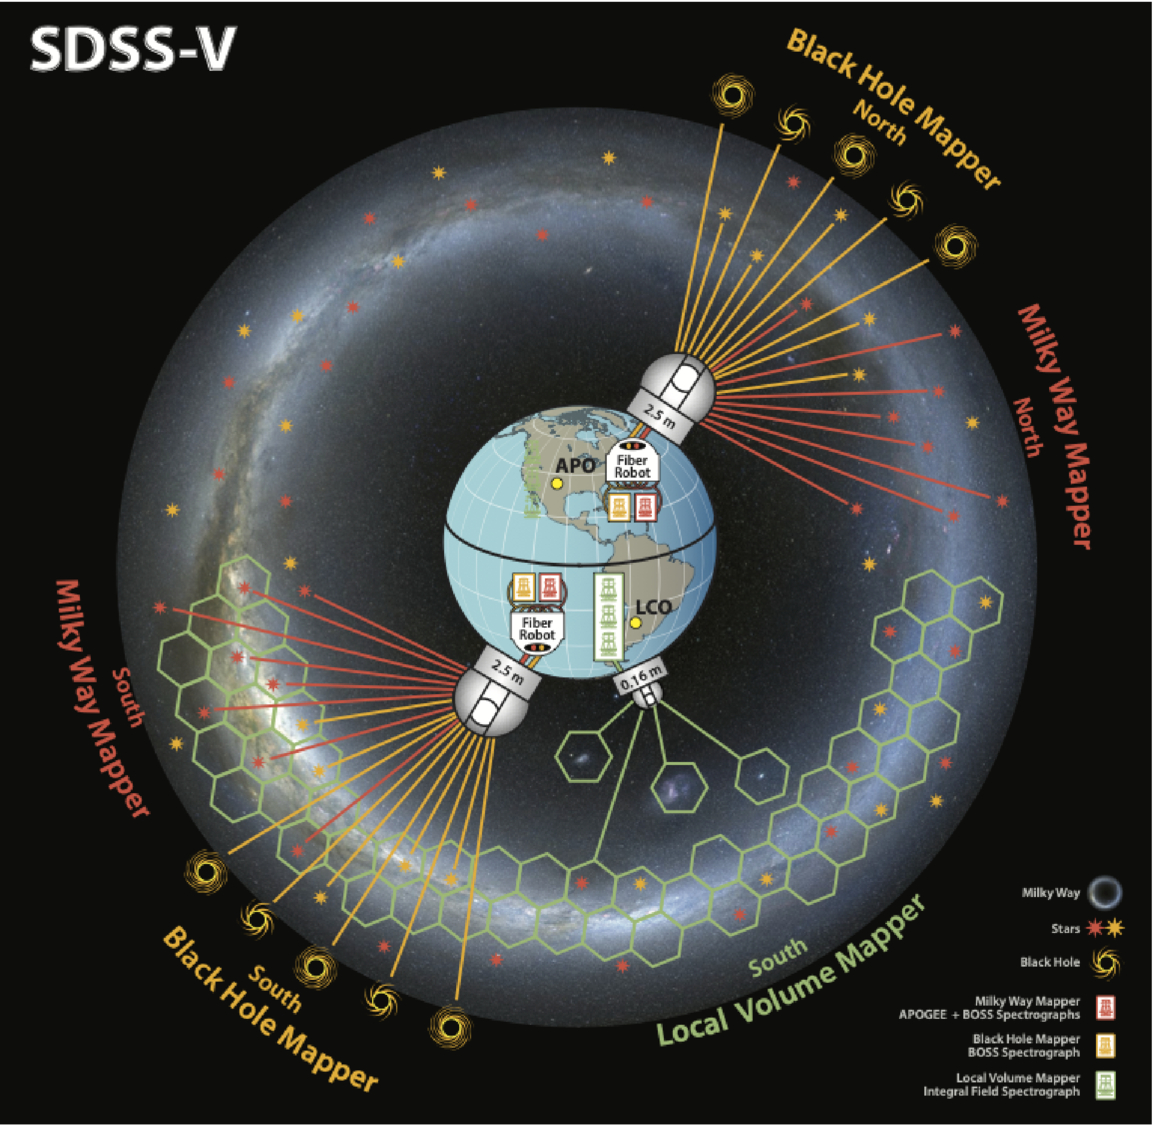
A schematic of the SDSS-V survey facilities and targets. Click to enlarge. [Kollmeier et al. 2026]
While SDSS’s twin 2.5-meter telescopes (one in New Mexico and one in Chile, allowing the survey to observe the entire sky) are dwarfed by Rubin’s 8-meter mirror, there is still thrilling science to be done with these moderate-sized observatories. This is especially true after a series of upgrades to the spectrographs and thanks to a deep expertise in not only survey-style science, but also in project management and survey planning. In 2021, in the middle of COVID-19 delays and distancing requirements, the team began upgrades to their existing facilities and construction of a brand new telescope to kick off the latest survey, SDSS-V.
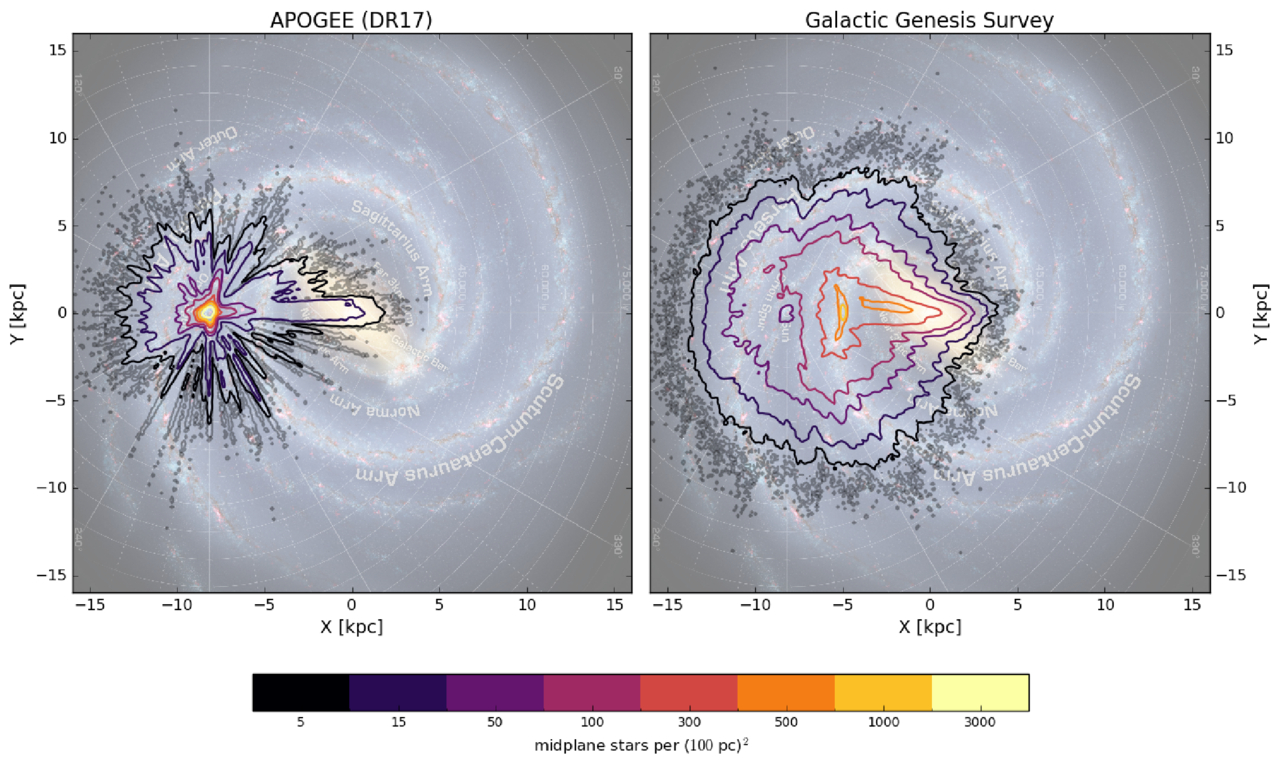
The density of target stars for the SDSS-V survey compared to a previous spectroscopic survey. Click to enlarge. [Kollmeier et al. 2026]
By the end of the survey, SDSS-V will have collected optical and near-infrared spectra for roughly 6 million objects spread across the whole sky, as well as time-series spectra from about a million of these sources. This dataset, which is unprecedented in both its spatial and temporal coverage, will allow researchers to probe questions ranging from how quasars evolve over time to how commonly young stars have brown-dwarf companions. Long since SDSS initiated the era of industrial survey astronomy, this latest publication shows how the survey continues to lead the way.
“Sloan Digital Sky Survey. V. Pioneering Panoptic Spectroscopy,” Juna A. Kollmeier et al 2026 AJ 171 52. doi:10.3847/1538-3881/ae0576
The post A New View of the Spectroscopic Universe appeared first on AAS Nova.

Spacecraft scattered throughout the solar system keep tabs on the solar wind, but the measurements are dotted with data gaps. How can scientists prevent these gaps from biasing their studies of the solar wind?
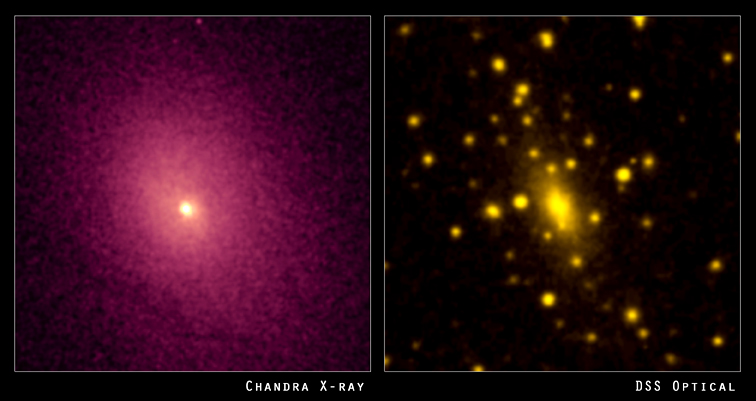
Left: the distribution of hot gas between the galaxies in the cluster Abell 2029. Right: the visible light from the galaxies in the cluster. [X-ray: NASA/CXC/UCI/A.Lewis et al. Optical: Pal.Obs. DSS]
Luckily, there are many spacecraft that sample the solar wind from various locations within our solar system. Unluckily, many of these spacecraft do not continuously monitor the solar wind. For example, when a spacecraft orbiting a planet dips into the planet’s atmosphere, this detour creates an hours-long gap in solar wind monitoring.
How do these data gaps affect studies of the solar wind? In a recent research article, Daniel Wrench and Tulasi Parashar (Victoria University of Wellington) approached this question in terms of how gaps affect the structure function: a mathematical description of how the solar wind fluctuates over different length or time scales.
Wrench and Parashar introduced random artificial gaps into data from the Parker Solar Probe, which monitors the solar wind continuously, and compared the structure functions calculated from the continuous and interrupted data sets. They used the difference between the true structure function — calculated from the continuous data set — and the structure functions from the artificially gapped data sets to develop a correction factor.
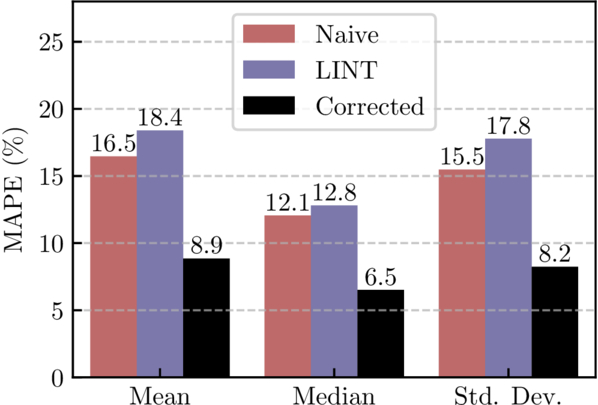
Performance of the correction factor method (black) compared to the uncorrected, gapped data (red) or gaps filled using linear interpolation (blue). MAPE is the mean absolute percentage error. [Wrench & Parashar 2025]
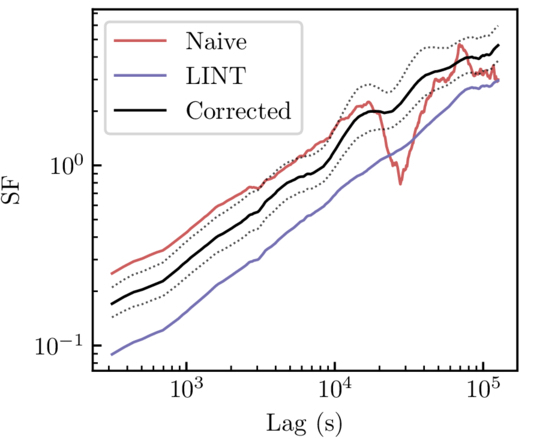
Structure function calculated from uncorrected Voyager 1 data (red), linearly interpolated data (blue), and corrected data (black). Both the linear interpolation method and the correction factor method remove the artifact around a lag of 3×10⁴ seconds, but the correction factor method does not suppress the signal like the linear interpolation method does. [Adapted from Wrench & Parashar 2025]
Finally, the authors applied their validated method to data from Voyager 1. Data from the two Voyager spacecraft are extremely scientifically valuable — no other spacecraft have ventured as far from the Sun and can measure the solar wind at such large distances. The data are also extremely sparse; one segment used in this work was missing 85% of the data. This means that an effective method of correcting these data has potentially huge scientific significance.
Wrench and Parashar applied their correction factor to the Voyager 1 data, showing that this method handily removes artifacts while avoiding the underestimation introduced by linear interpolation. While the authors saved the interpretation of the newly corrected Voyager 1 data for future research, this study makes it clear that even large data gaps needn’t hinder studies of the solar wind.
“Debiasing Structure Function Estimates from Sparse Time Series of the Solar Wind: A Data-Driven Approach,” Daniel Wrench and Tulasi N. Parashar 2025 ApJ 987 28. doi:10.3847/1538-4357/addc6a
The post Minding the Gaps in Solar Wind Data appeared first on AAS Nova.

Motivated by a desire to support community members financially during the coronavirus pandemic, researchers employed 30 local citizen scientists in the Hubble Image Similarity Project. This project quantified the similarities between astronomical images, providing a way to test the results of image-search algorithms.

The Eagle Nebula, pictured here in an image from Kitt Peak National Observatory, is a star-forming region in the Milky Way. [T.A.Rector (NRAO/AUI/NSF and NOIRLab/NSF/AURA) and B.A.Wolpa (NOIRLab/NSF/AURA); CC BY 4.0]
You might start your search with an astronomical image database, using filters for object type or instrument to sift through thousands and thousands of options. But even filtering out everything but star-forming regions might yield vastly different results, given the widely varying shapes, colors, and sizes of these regions.
Or maybe you’ll feed your image into a neural network that has been trained to spot similar images. The results may seem promising, but how can you tell whether the algorithm has found the images that are the most similar? Would another algorithm do better?
Astronomical image collections rarely contain information about similarities between images in their metadata, and while neural networks appear to excel at gathering similar images, the results of these models are generally unverified. The Hubble Image Similarity Project, led by Richard White (Space Telescope Science Institute) and Josh Peek (Space Telescope Science Institute and Johns Hopkins University), addressed these issues with a team of citizen scientists who generated similarity information for astronomical images, providing a quantitative means to test the results of neural networks.
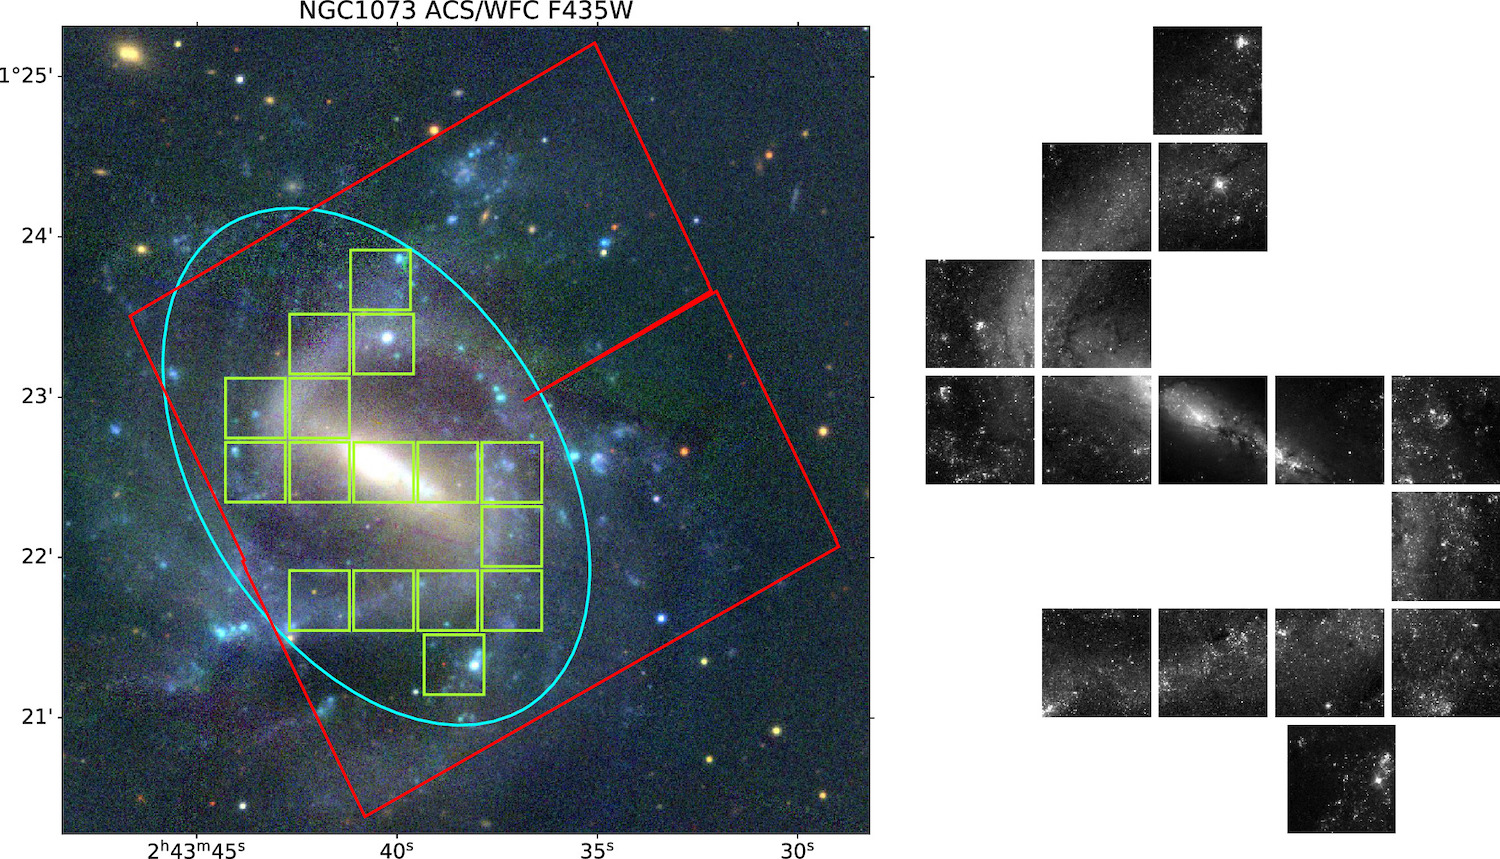
An example of individual test images (green squares) extracted from a Hubble Legacy Archive image (red square). Low-contrast areas have been excluded, leaving the galaxy’s spiral arms for analysis. Click to enlarge. [White & Peek 2025]
White and Peek recruited 30 members of the community within walking distance of the Space Telescope Science Institute to identify similar astronomical images, and the reviewers were paid for their work. In the three phases of the project, reviewers considered test images one at a time and 1) selected all similar images from a set of 15 comparison images, 2) selected the most similar image from a narrowed-down set of 6 comparison images, and finally 3) selected the most similar image from a set of 3 comparison images.
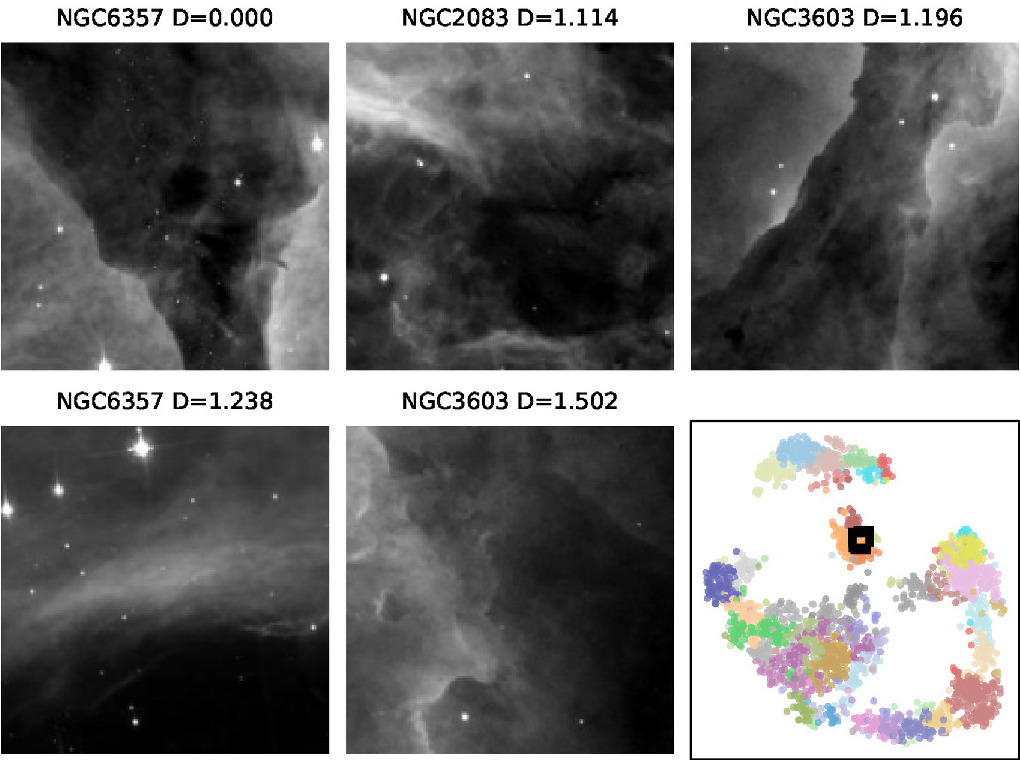
Examples of similar images according to the image similarity matrix. In the lower-right corner is a visualization of the similarity data. The semicircle of data points in the bottom half of this visualization represents galaxies, while star clusters occupy the small arc near the top and nebulae sit in the island in the center of the plot. Click to enlarge. [Adapted from White & Peek 2025]
Similar images resemble one another in terms of structure, texture, and other factors that White and Peek say are “difficult even to describe in words” — for example, the diffuse glow of a galaxy interrupted by a bright star with diffraction spikes, or a nebula speckled with stars and dense dusty clumps. The similarity data from this study are available online and can be used to test the performance of image-search algorithms. In future work, the authors plan to carry out a similar project using images of the Martian landscape.
“The Hubble Image Similarity Project,” Richard L. White and J. E. G. Peek 2025 AJ 169 306. doi:10.3847/1538-3881/adcb43
The post Citizen Science Born in the Pandemic: The Hubble Image Similarity Project appeared first on AAS Nova.
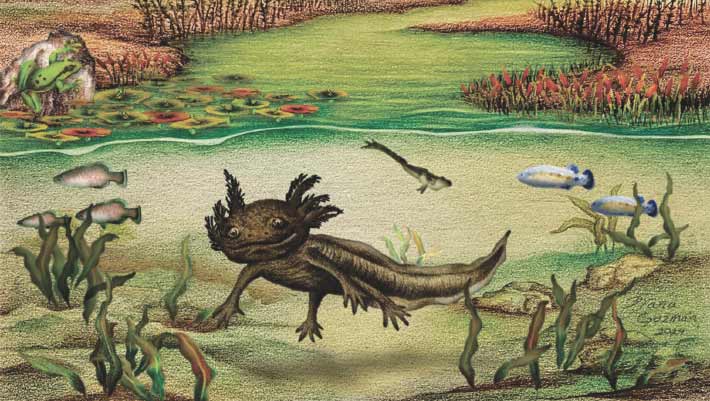
Paleontologists have identified a new species of the axolotl genus Ambystoma from several fossilized specimens found deep in the rocky outcrops of the Mexican state of Hidalgo.
The post New Species of Fossil Axolotl Unearthed in Mexico appeared first on Sci.News: Breaking Science News.
