❌

Reading view

Enhancing the Sharpest Images

The Submillimeter Array at the summit of Maunakea in Hawaiʻi.

The Event Horizon Telescope (EHT), the facility that delivered humanity’s first-ever picture of a black hole, can produce some of the sharpest images in all of astronomy. But turning the EHT’s raw data into images is a complex process involving messy statistics and powerful algorithms. Recent work presents a potential upgrade to that process: for the first time in long-baseline interferometry, it may be possible to model everything everywhere all at once.

The Hardest Eye Test

The EHT has some of the sharpest eyes in all of astronomy. With its effective resolution of just 20 microarcseconds, in principle you could use it to read a newspaper in New York while sitting at a cafe in Paris. But this planet-spanning instrument (it relies on data from radio telescopes on four continents) doesn’t snap pictures like an ordinary camera. Instead, each pair of telescopes measures something called an “interferometric visibility,” which is related to a single Fourier component of the actual underlying image.
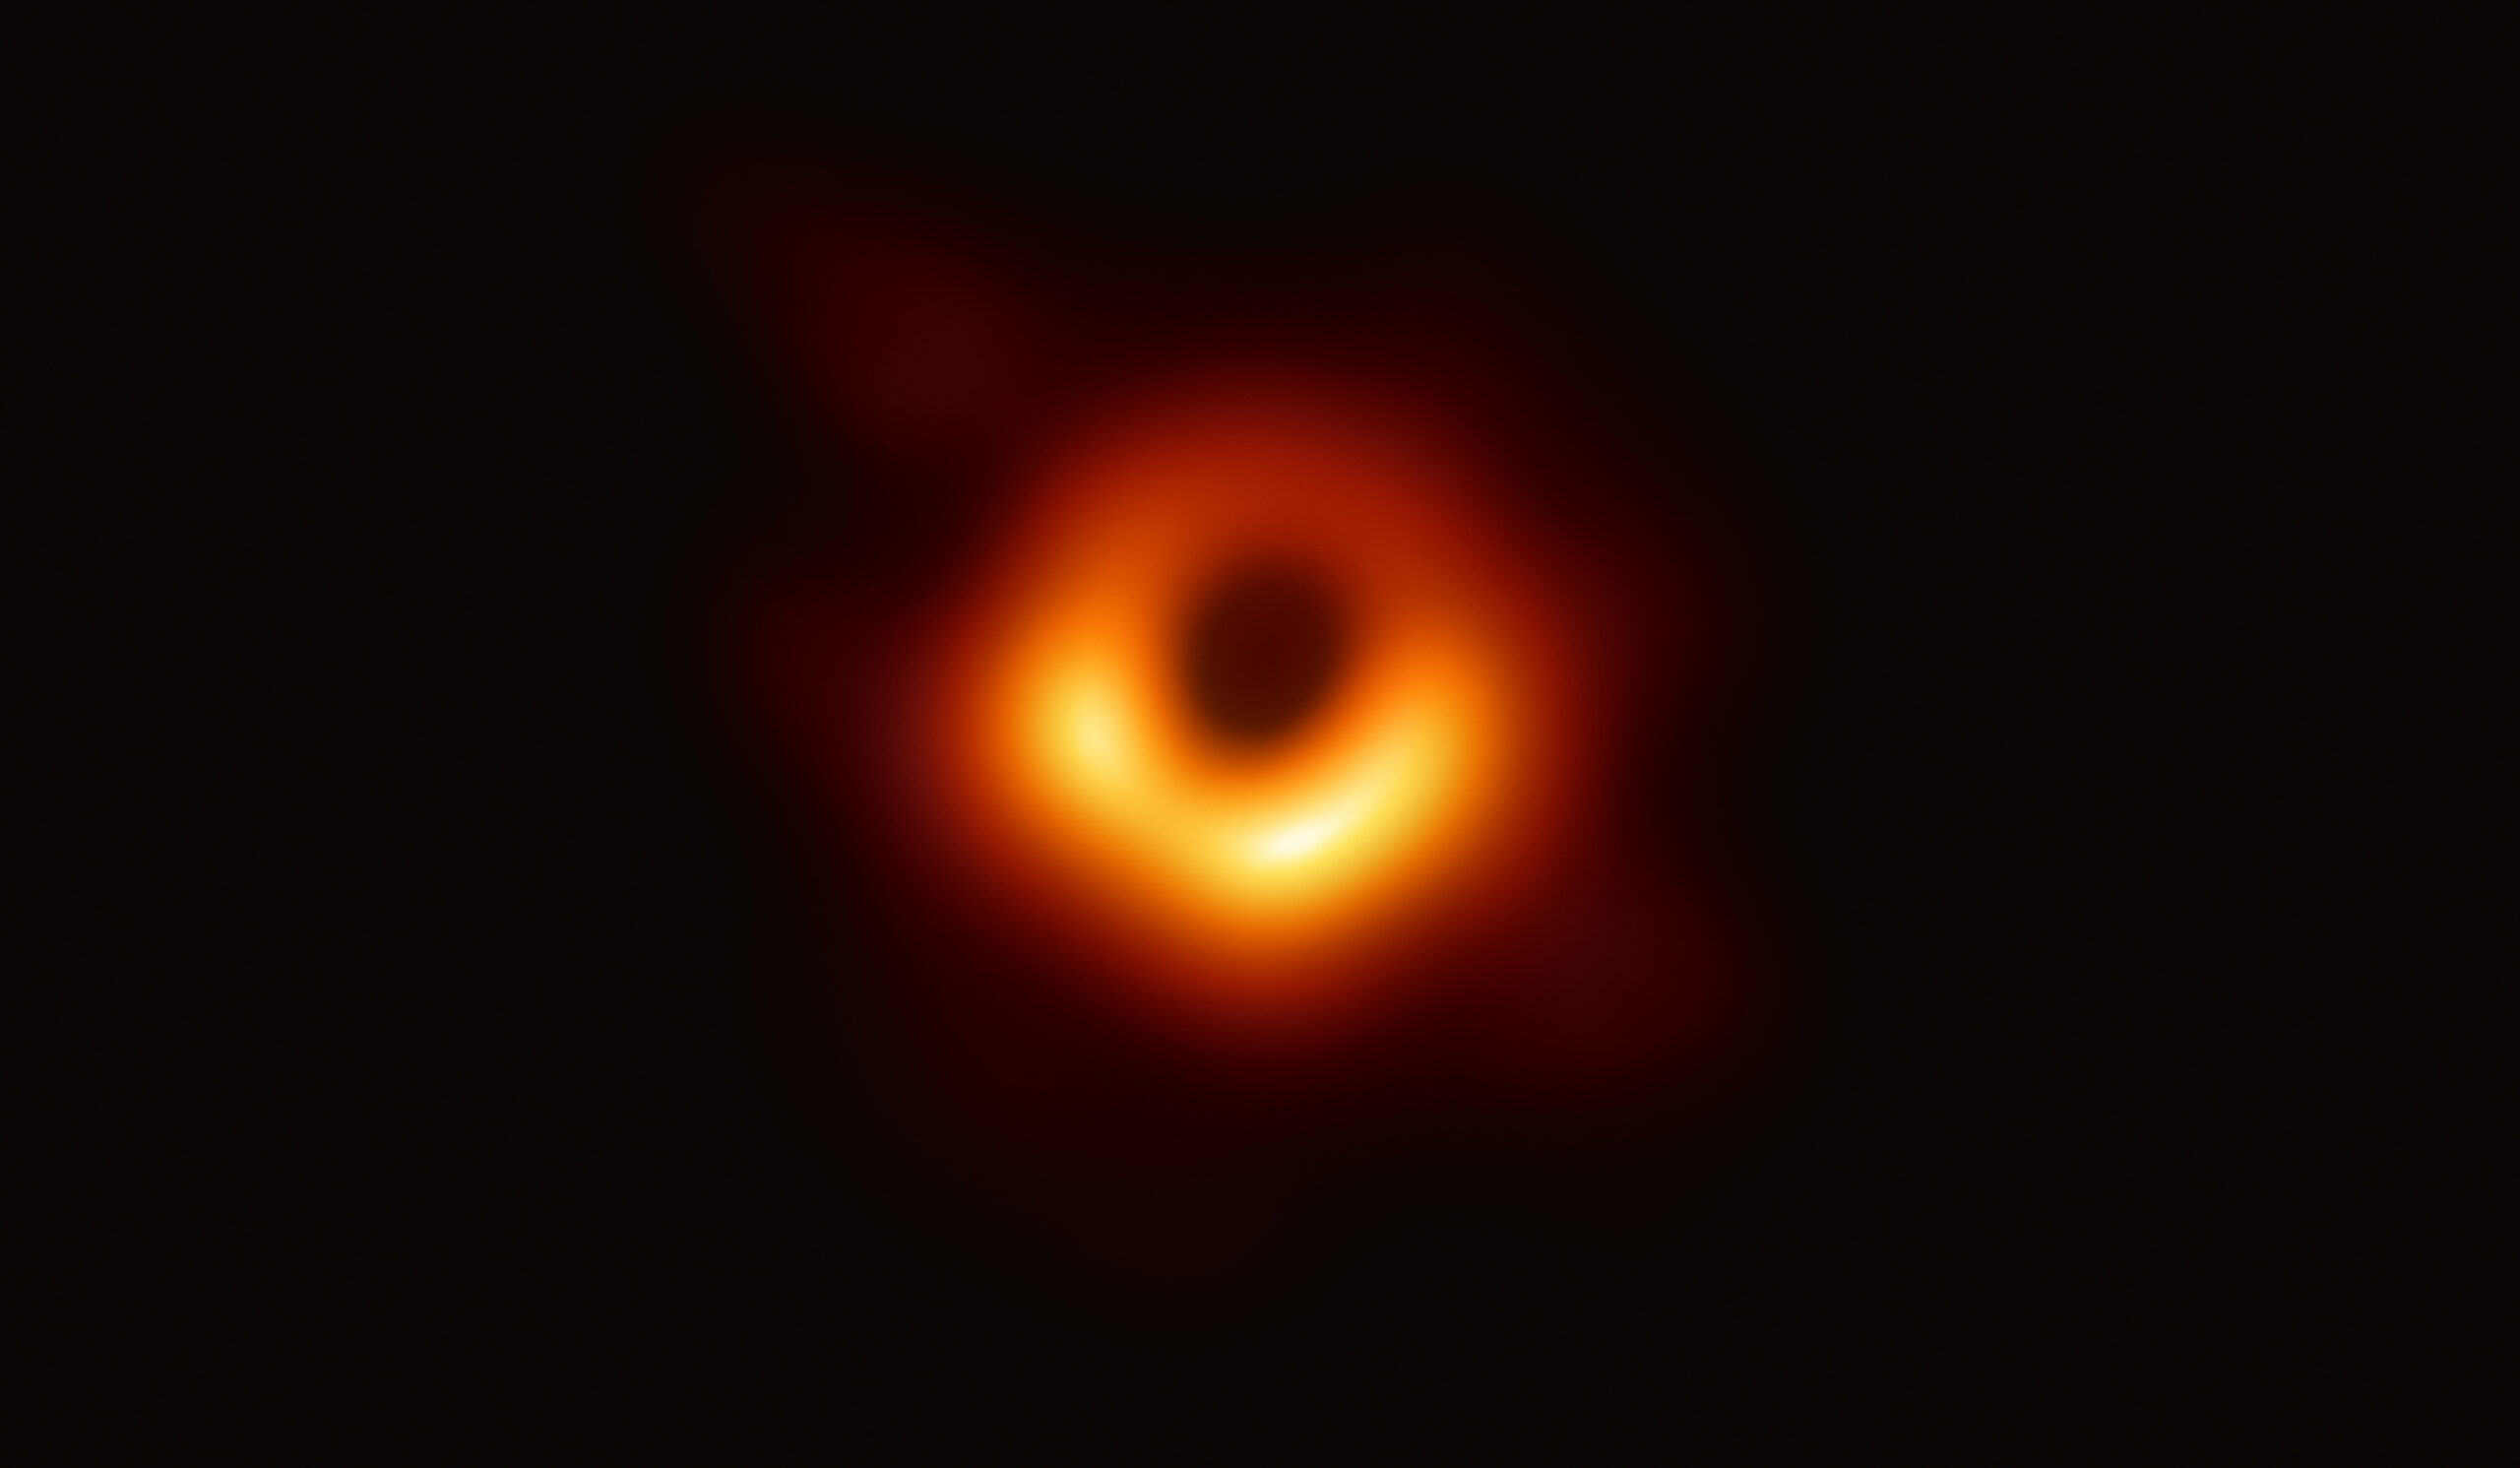
A photograph of an orange ring surrounding a dark center.

The first image of a black hole, constructed from Event Horizon Telescope data taken in 2017. [EHT Collaboration; CC BY 4.0]

Combining these components into an image is a process fraught with assumptions and modeling choices. Since the EHT doesn’t have an infinite number of telescopes, each measurement can be mapped to infinitely many images. This forces researchers to choose how to “regularize” this space of images to select one best picture. Making things harder, they also must contend with all the typical issues of real-world data collection. Each telescope has slight calibration errors, and every data point is affected by weather and temperature-dependent processes.

Typically researchers break the problem down into several stages: first calibrate the data, then regularize and construct the best-fitting image, then analyze that image to constrain the actual physics you care about like the width of the ring surrounding a black hole. This is how the original EHT publications went about their groundbreaking work on the now-iconic glowing ring around the supermassive black hole in the galaxy Messier 87 (M87*).

A New Approach

Recent work led by Paul Tiede (Black Hole Initiative at Harvard University) suggests an alternative process. Instead of separating the stages of analysis as described above, the team demonstrated that one could fit everything simultaneously in a framework they call hierarchical interferometric Bayesian imaging, or HIBI.
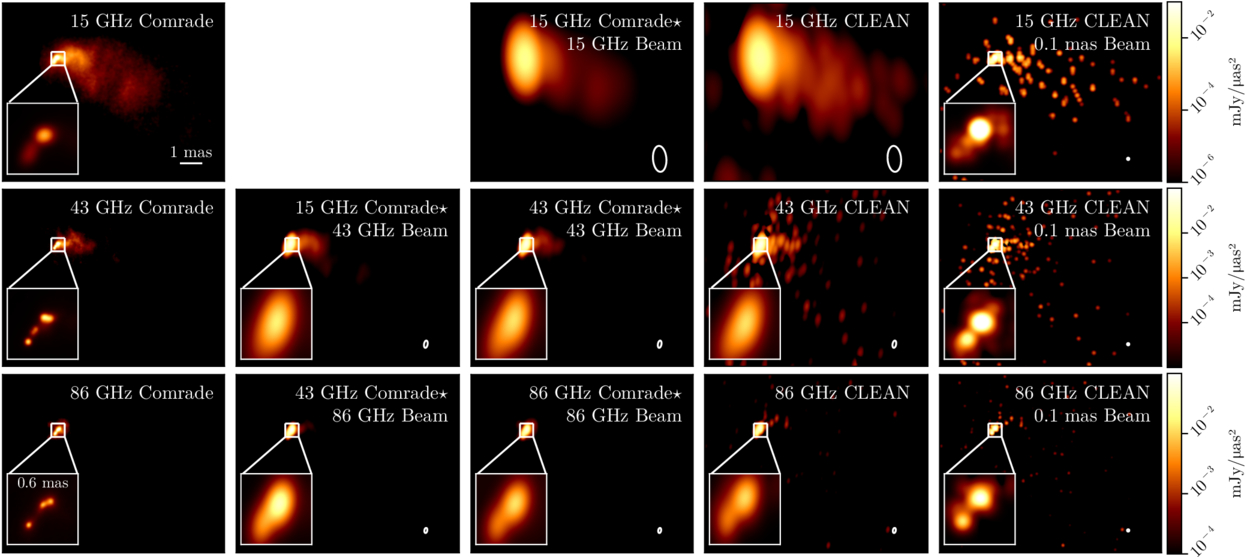
A multi-panel plot of images of an orange blob with a tail. All images are very similar.

A comparison of the new HIBI technique (referred to as “Comrade” here) and a traditional algorithm called CLEAN. Click to enlarge. [Tiede et al. 2026]

By fitting all parameters that go into an image together, the method doesn’t select one “best” image. Instead, by allowing the pixel-by-pixel intensities, calibration parameters, and underlying physics to inform one another during inference, HIBI explores the full range of images consistent with the data. This prevents the degeneracies that plague the traditional approach, where image and calibration estimates can trade off against each other in misleading ways. The team validated HIBI on synthetic data mimicking the EHT’s 2017 setup, showing that it reliably recovered a range of source shapes with well-calibrated uncertainty estimates.

Even more exciting, the team demonstrated that it’s possible to skip the image construction step altogether and go straight to the science. By fitting parameters describing the physics underlying a scene, the team was able to constrain the width of the ring around M87* without any reference to a picture. They predict that this technique could be crucial for extracting information when future instruments like the Next Generation Event Horizon Telescope observe more distant black holes that are only marginally resolved. Though we’ll likely have to wait years for these next-generation telescopes, work like this ensures that astronomers will be able to squeeze as much science from them as possible once these new facilities are ready.

Citation

“Hierarchical Interferometric Bayesian Imaging,” Paul Tiede et al 2026 ApJ 997 262. doi:10.3847/1538-4357/ae2749

The post Enhancing the Sharpest Images appeared first on AAS Nova.
  •  

Selections from 2025: A New Way to Combine Ground-Based Images

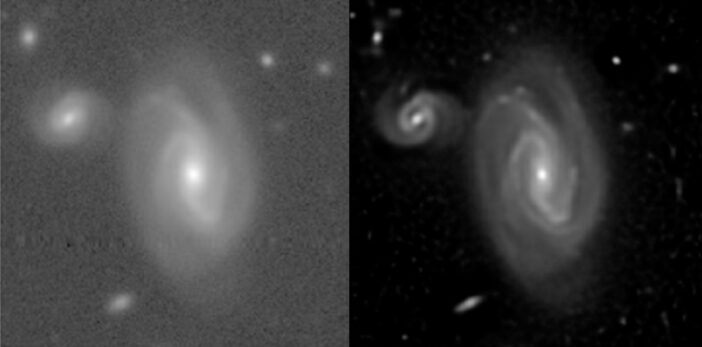
side-by-side images of galaxies

Editor’s Note: For the remainder of 2025, we’ll be looking at a few selections that we haven’t yet discussed on AAS Nova from among the most-downloaded articles published in AAS journals this year. The usual posting schedule will resume January 2nd.

ImageMM: Joint Multi-Frame Image Restoration and Super-Resolution

Published September 2025

Main takeaway:

A team led by Yashil Sukurdeep (Johns Hopkins University) developed a new method for processing and combining ground-based astronomical images. The authors’ algorithm, called ImageMM because it leverages a method called majorization–minimization, yielded greater detail in bright sources and distinguished more faint sources from the background than existing methods.

Why it’s interesting:

As ground-based telescopes grow larger and their cameras grow more sensitive, they must still contend with one unfortunate fact: they are trapped beneath Earth’s atmosphere, which blurs fine details in astronomical images. To extract as much information as possible from beneath Earth’s blurry, ever-shifting atmosphere, researchers have developed numerous strategies for cleaning, combining, and sharpening astronomical images. From simple averaging of multiple exposures to complex statistical techniques, each of these methods has unique strengths and weaknesses. ImageMM succeeds in quieting background noise and sharpening images of both extended and point-like sources while avoiding many of the pitfalls of statistical methods.

How they tested the new method:

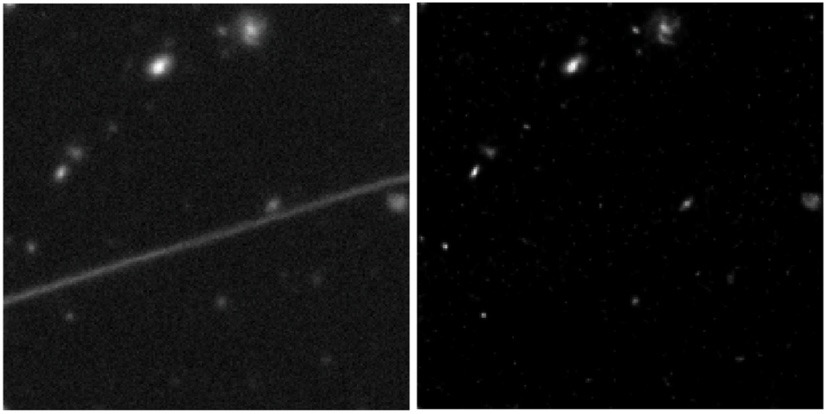
satellite-trail removal by ImageMM

An example of satellite-trail removal by ImageMM. Click to enlarge. [Adapted from Sukurdeep et al. 2025]

Sukurdeep and collaborators tested ImageMM on data from the Hyper Suprime-Cam on the 8.2-meter Subaru Telescope as well as on simulated images. These tests demonstrated not only that ImageMM can enhance the scientific value of noisy datasets, it can also handle interlopers like satellite trails and cosmic rays — and it processes data nearly in real time as it comes down the pipeline. This ability to rapidly and faithfully process high-resolution astronomical images will be critical for upcoming surveys, like the Vera C. Rubin Observatory’s 10-year Legacy Survey of Space and Time, which will generate immense amounts of data ready for processing.

Citation

Yashil Sukurdeep et al 2025 AJ 170 233. doi:10.3847/1538-3881/adfb72

The post Selections from 2025: A New Way to Combine Ground-Based Images appeared first on AAS Nova.
  •  

A Strange Brown Dwarf Gets Stranger

A glowing orange sphere set against a background image of the Milky Way's disk of stars.

Isolated brown dwarfs are some of the rarest and hardest to study objects in our stellar neighborhood. Recently, astronomers revealed that one of the most famous isolated brown dwarfs, W1935, is not actually one brown dwarf but two.

Challenging but Fascinating

Astronomers know of only 50 free-floating brown dwarfs within the nearest 200 light-years or so, and even the ones we know about are poorly understood. Since brown dwarfs are frigid compared to their stellar cousins, they consequently shine much less brightly and at longer wavelengths of light. Even taking a picture of these ~500K objects requires long stares with specialized telescopes, and these facilities already have their schedules full supporting a wide range of other areas of research from distant galaxies to exploding supernovae.

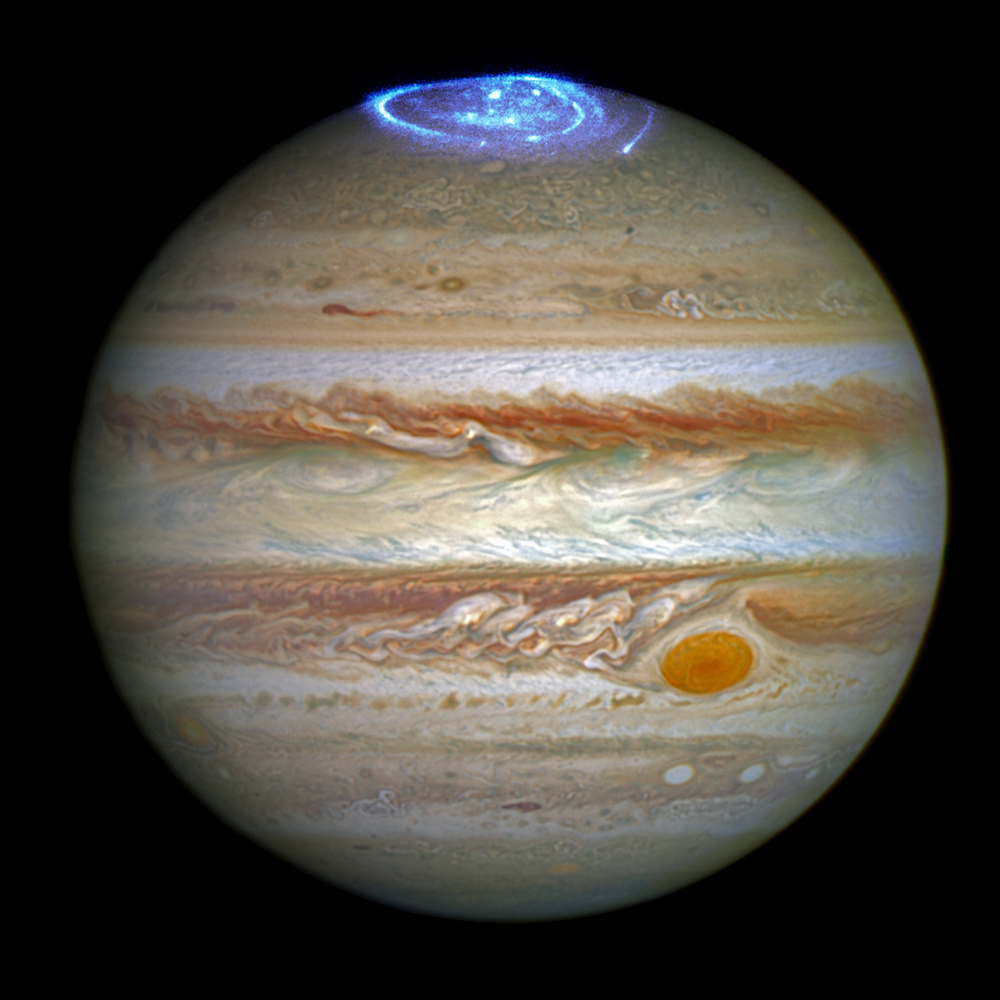
A color photograph of Jupiter showing its red bands, great red spot, and a bright spiraling blue aurora near the north pole.

An image of Jupiter and its prominent aurora taken with the Hubble Space Telescope. [NASA, ESA, and J. Nichols (University of Leicester); Acknowledgment: A. Simon (NASA/GSFC) and the OPAL team]

So, when an in-demand telescope like JWST spends time on brown dwarf science, each byte of data it sends back is both precious and likely to contain a new discovery. This has already happened several times: back in 2023, research published in the AAS journals (and summarized on AAS Nova) described JWST’s discovery of the first-ever Y+Y binary system, and in 2024, astronomers at the 243rd meeting of the AAS presented the first detection of methane emission on a brown dwarf — a sign of auroral activity.

Recently, JWST continued its pattern of discovery: the telescope took another look at the brown dwarf W1935, where methane emission was detected for the first time, and again found something surprising.

A New Binary

When JWST first took a look at this brown dwarf, it used its Near Infrared Spectrograph (NIRSpec) to record a spectrum of the object. These data revealed a large spike near 3 microns that perfectly lined up with methane emission from an aurora, similar to what we observe on Jupiter in the solar system. This was a thrilling find, since it hinted at an exciting possibility: Jupiter’s aurora is powered by its nearby moon Io, so the researchers cautiously wondered if W1935’s aurora could be evidence of a companion satellite as well.

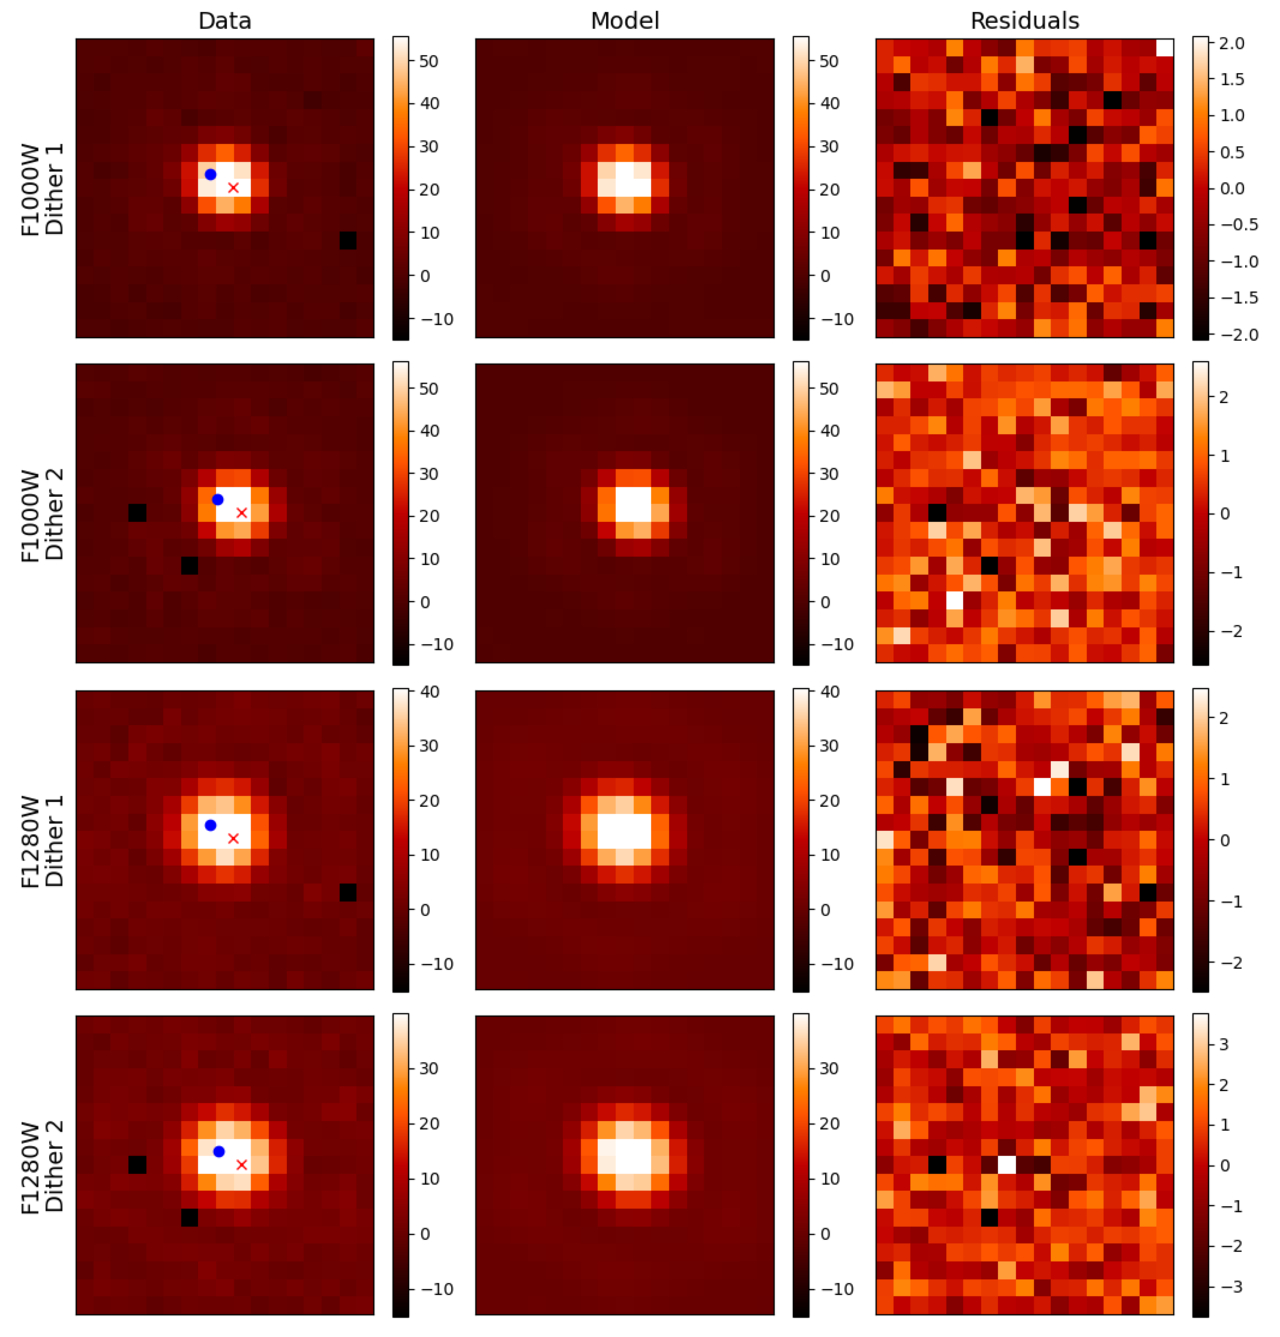
A multi-panel figure with noisy (real) images in the left column, smooth models in the middle column, and pixelated residuals in the rightmost column. The models are in good agreement with the data.

Images of W1935 taken with MIRI (left column), the author’s model for those images (center column), and the residuals (right column). The model includes two nearby point sources that are so close together they appear as one slightly elongated source. Click to enlarge. [De Furio et al. 2025]

Soon after these observations, JWST once again turned to W1935, but this time used its Mid-Infrared Instrument (MIRI) to take images of the object at long wavelengths. A team of researchers led by Matthew de Furio, University of Texas at Austin, recently analyzed these images and noticed something interesting: W1935 isn’t just one brown dwarf, but rather two roughly equal-mass brown dwarfs packed close together on 16–28 year orbits.

Doubly Interesting

This makes W1935 just the second-ever known Y+Y dwarf binary and cements its status as one of the most interesting brown dwarf systems discovered to date. So far, it’s not clear which object is responsible for the auroral signal since the objects are so close together that their images blur together without careful modeling and image processing.

De Furio’s team pointed out that JWST has yet another instrument that could prove useful here: its Integral Field Unit spectrometer within NIRSpec. Should JWST revisit this fascinating system, it could study the aurora’s variability over time, pin it to one specific object within the binary, and hopefully shed some light on whether any moons play a role in the methane emission. Given all we have learned each time JWST has turned to these strange worlds, we can only hope that it will do so again soon.

Citation

“Discovery of the Second Y+Y Dwarf Binary System: CWISEP J193518.59-154620.3,” Matthew De Furio et al 2025 ApJL 990 L63. doi:10.3847/2041-8213/adfee1

The post A Strange Brown Dwarf Gets Stranger appeared first on AAS Nova.
  •  

Betelgeuse’s Companion Star May Have Been Seen at Last

Betelgeuse and its companion star

Astronomers may have directly imaged a companion star to the famous red supergiant Betelgeuse at last. Though the tentative detection only loosely constrains the star’s physical properties, it appears to be a 1.6-solar-mass pre-main-sequence star. The discoverers suggest the name Siwarha, Arabic for “Her Bracelet,” given that the star circles Betelgeuse, “Hand of the Giant.”

Betelgeuse in the Spotlight

constellation Orion

A photograph of the constellation Orion. Betelgeuse is the bright yellow star located left of center. [E. Slawik/NOIRLab/NSF/AURA/M. Zamani; CC BY 4.0]

Situated at the shoulder of the constellation Orion, the red supergiant Betelgeuse is one of the most recognizable stars in the night sky. It’s also the subject of countless scientific studies and amateur observations that stretch back for centuries.

Betelgeuse is a variable star. On top of its well-constrained 400-day pulsation period, the star has exhibited two behaviors that have drawn interest in recent years: a deep, prolonged dimming episode in 2019–2022 that is thought to be due to an immense ejection of mass from the star’s surface, and a 6-year variation in the star’s photometry, astrometry, and radial velocity.

Multiple studies have attributed the 6-year variability to one or more companion stars. In general, these studies predict that the companion star circles Betelgeuse on a tight, 6-year, nearly edge-on orbit. As reported in a new article published in the Astrophysical Journal Letters, observations have likely proved these predictions correct.

Speckle Detection

Steve Howell (NASA Ames Research Center) and collaborators searched for Betelgeuse’s predicted companion star using the 8.1-meter Gemini North telescope. The team used the ‘Alopeke instrument in speckle imaging mode, which involves taking thousands of milliseconds-long snapshots to avoid smearing due to atmospheric fluctuations.

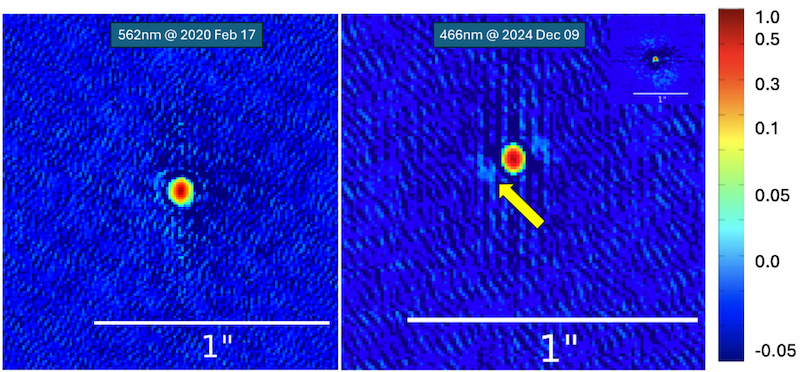
Betelgeuse and its companion star in observations

Observations of Betelgeuse from 2020 (left) and 2024 (right). An arrow points to the companion. Note that the image processing introduces a 180º ambiguity in the location of the companion, which is resolved by analyzing phase information. [Howell et al. 2025]

The team imaged Betelgeuse in 2020 and 2024. The 2020 observations coincided with when the companion star was predicted to lie behind Betelgeuse from our vantage point, and no companion appears in these images. The 2024 observations were taken just a few days after the companion’s predicted greatest angular separation from the star — and show evidence for a star just beside Betelgeuse.

More to Learn

Howell and coauthors performed additional analyses to rule out interference from hot pixels, cosmic rays, or atmospheric diffraction. They also considered that the star could lie in the background or foreground, but they found both possibilities unlikely. After further calculations, the team estimated that the companion is six magnitudes fainter than Betelgeuse and separated by just 52 milliarcseconds at an angle of 115º. These quantities agree well with predictions for the companion’s position.

location of Betelgeuse in 2020 and 2024

The on-sky proper motion of Betelgeuse from 2020 to 20204. The companion is shown as the small black circle. This shows that if the companion star were actually a background star, it would have been plainly visible in the 2020 observations. [Howell et al. 2025]

Given the tentative detection — at the level of 1.5σ — it’s difficult to pin down the properties of the companion star. The team placed the star’s mass between 1.4 and 2.0 solar masses, with the likeliest value being 1.6 solar masses. If the companion has the same age as Betelgeuse, this star would be on the cusp of joining the main sequence. However, it may never reach that stage of life; Betelgeuse’s demise in a core-collapse supernova is imminent, in the astronomical sense, and the companion may spiral in to merge with Betelgeuse even before then. (It currently orbits at just 4 au — closer than the distance between the Sun and Jupiter.)

The team closed with a call to the community to turn their instruments toward Betelgeuse on 26 November 2027, when the companion will once again be at its greatest angular separation. Our exploration of this long-sought-after star has just begun!

Citation

“Probable Direct Imaging Discovery of the Stellar Companion to Betelgeuse,” Steve B. Howell et al 2025 ApJL 988 L47. doi:10.3847/2041-8213/adeaaf

The post Betelgeuse’s Companion Star May Have Been Seen at Last appeared first on AAS Nova.
  •  

Citizen Science Born in the Pandemic: The Hubble Image Similarity Project

images from the Hubble Image Similarity Project

Motivated by a desire to support community members financially during the coronavirus pandemic, researchers employed 30 local citizen scientists in the Hubble Image Similarity Project. This project quantified the similarities between astronomical images, providing a way to test the results of image-search algorithms.

Seeking Similarities

Eagle Nebula

The Eagle Nebula, pictured here in an image from Kitt Peak National Observatory, is a star-forming region in the Milky Way. [T.A.Rector (NRAO/AUI/NSF and NOIRLab/NSF/AURA) and B.A.Wolpa (NOIRLab/NSF/AURA); CC BY 4.0]

Say you have an image of a star-forming region, featuring eye-catching gas clouds, dense and dusty knots, and newborn stars. How would you go about finding other images that resemble yours?

You might start your search with an astronomical image database, using filters for object type or instrument to sift through thousands and thousands of options. But even filtering out everything but star-forming regions might yield vastly different results, given the widely varying shapes, colors, and sizes of these regions.

Or maybe you’ll feed your image into a neural network that has been trained to spot similar images. The results may seem promising, but how can you tell whether the algorithm has found the images that are the most similar? Would another algorithm do better?

The Hubble Image Similarity Project

Astronomical image collections rarely contain information about similarities between images in their metadata, and while neural networks appear to excel at gathering similar images, the results of these models are generally unverified. The Hubble Image Similarity Project, led by Richard White (Space Telescope Science Institute) and Josh Peek (Space Telescope Science Institute and Johns Hopkins University), addressed these issues with a team of citizen scientists who generated similarity information for astronomical images, providing a quantitative means to test the results of neural networks.

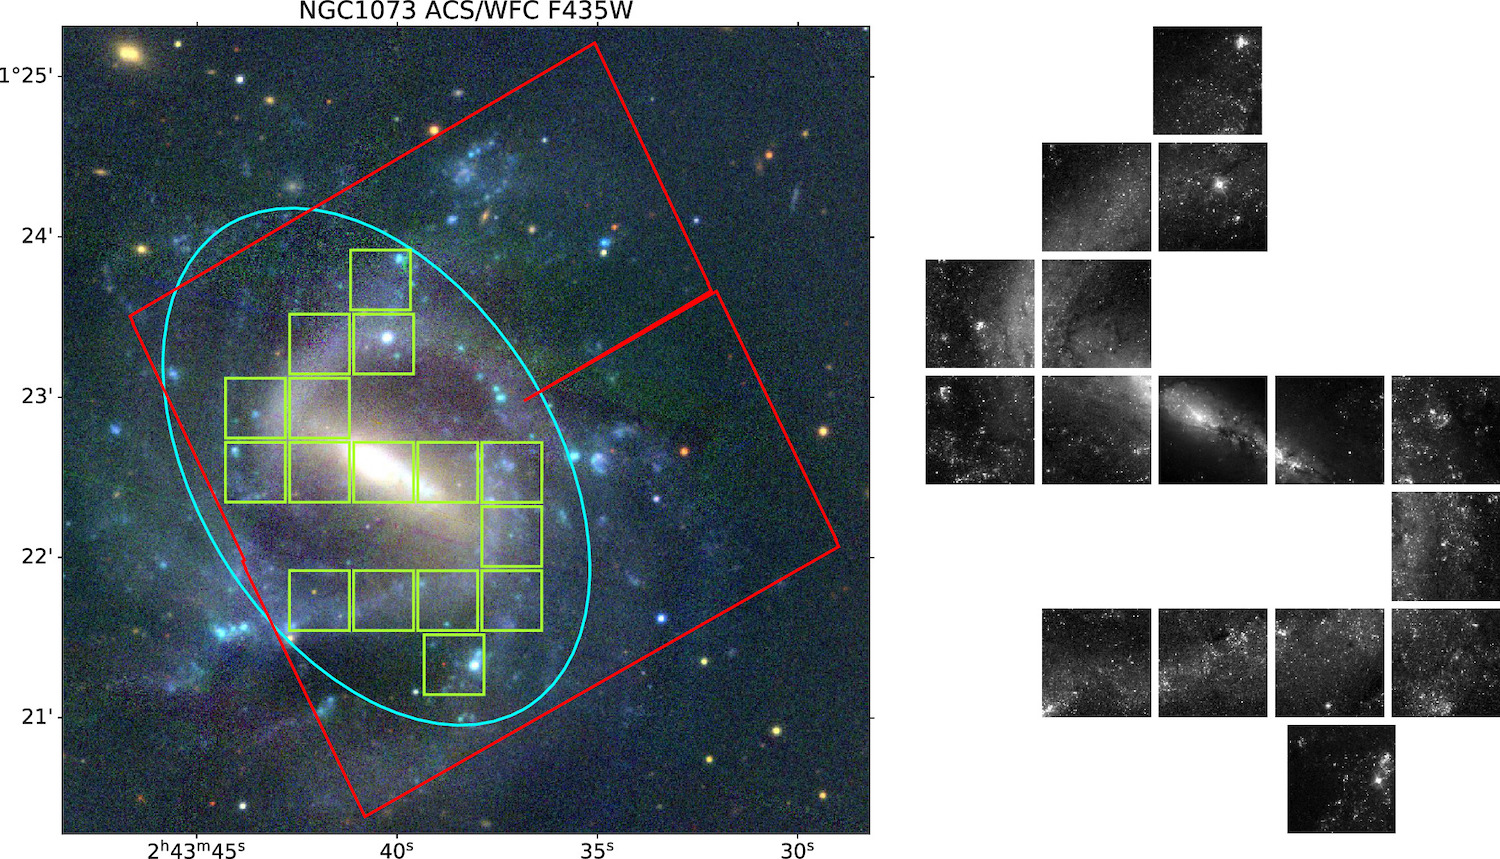
example of how the Hubble Image Similarity Project selects image cutouts for study

An example of individual test images (green squares) extracted from a Hubble Legacy Archive image (red square). Low-contrast areas have been excluded, leaving the galaxy’s spiral arms for analysis. Click to enlarge. [White & Peek 2025]

White and Peek began by amassing a sample of images from the Hubble Legacy Archive. This sample included many different object types, such as galaxies, planetary nebulae, star-forming regions, and star clusters. After trimming and binning the images, converting them to 8-bit grayscale, filtering out low-contrast images, and eliminating satellite trails, image artifacts, and repeated observations of the same patch of sky, 2,098 images of 666 objects remained.

Citizen Scientists, Assemble

White and Peek recruited 30 members of the community within walking distance of the Space Telescope Science Institute to identify similar astronomical images, and the reviewers were paid for their work. In the three phases of the project, reviewers considered test images one at a time and 1) selected all similar images from a set of 15 comparison images, 2) selected the most similar image from a narrowed-down set of 6 comparison images, and finally 3) selected the most similar image from a set of 3 comparison images.

similar images from the Hubble Image Similarity Project and a visualization of the data

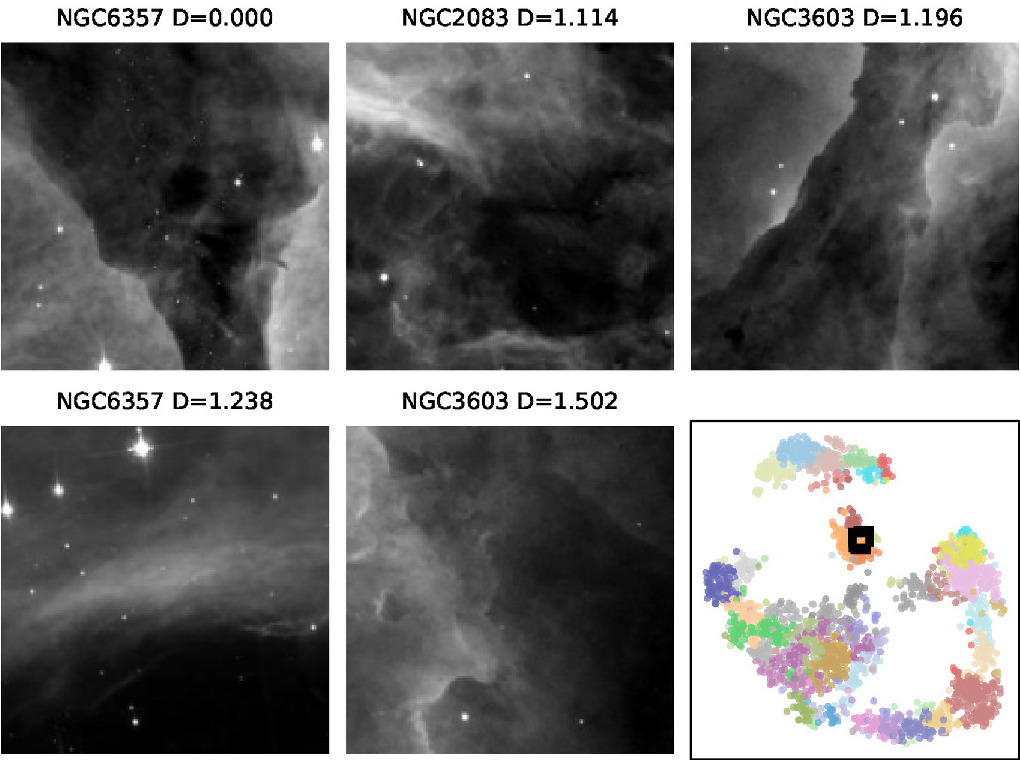
Examples of similar images according to the image similarity matrix. In the lower-right corner is a visualization of the similarity data. The semicircle of data points in the bottom half of this visualization represents galaxies, while star clusters occupy the small arc near the top and nebulae sit in the island in the center of the plot. Click to enlarge. [Adapted from White & Peek 2025]

The citizen science team ultimately compared 5.4 million pairs of images, and White and Peek used these comparisons to produce an image similarity matrix. The matrix describes the metaphorical “distance” between the images, with the most similar images being the smallest distance apart.

Similar images resemble one another in terms of structure, texture, and other factors that White and Peek say are “difficult even to describe in words” — for example, the diffuse glow of a galaxy interrupted by a bright star with diffraction spikes, or a nebula speckled with stars and dense dusty clumps. The similarity data from this study are available online and can be used to test the performance of image-search algorithms. In future work, the authors plan to carry out a similar project using images of the Martian landscape.

Citation

“The Hubble Image Similarity Project,” Richard L. White and J. E. G. Peek 2025 AJ 169 306. doi:10.3847/1538-3881/adcb43

The post Citizen Science Born in the Pandemic: The Hubble Image Similarity Project appeared first on AAS Nova.

  •  
❌