 Login

German Court Rules Google Liable for False Claims in AI Overviews
When Google’s AI Overviews labeled two Munich publishers as scam operations, the companies did what anyone falsely accused

While AI is proliferating across the workplace, it is introducing a new productivity paradox: While the technology makes work feel faster, it actually pushes more burden onto employees to provide context, perform quality checks, then rinse and repeat across numerous disparate tools.
This, according to a new survey of 6,000 full-time digital workers by Glean’s Work AI Institute, results in two emerging behaviors: “botsitting,” all the unrecognized work that goes into making AI actually usable; and “botshitting,” shipping AI-generated work that is unverified, not that well understood, or perhaps not even trustworthy. The survey report was co-authored by experts from Work AI Institute, Emory University, Stanford University, UC Berkeley, UC Santa Barbara, UNC Charlotte, University College London, and University of Notre Dame.
“It’s definitely in many ways a vicious cycle that feeds itself,” said Rebecca Hinds, head of Glean’s research center the Work AI Institute, a research collaborative of AI experts. Enterprises need to begin understanding and addressing the “massive, massive human labor that’s at the core of this.”
There’s no doubt that AI is quickly becoming a central teammate in the workplace. Glean’s Work AI Institute found that 87% of digital workers are using AI: It is already automating more than a quarter of their work and saving about 11 hours a week.
Still, only 13% say the use of AI has significantly improved their company’s performance, and their time savings are being eaten up by the same technology that is producing them. Employees lose about one-third of their work week (6.4 hours) botsitting: feeding AI context, supervising outputs, debugging errors, cleaning up AI-generated work, and switching between AI tools.
“We’re seeing high, high rates of multiple tool usage, and often those tools aren’t connected,” said Hinds.
In terms of context-feeding, large language models (LLMs) are trained on the vast corpus of the internet, but not always on enterprise-specific data. Thus, employees often have to provide additional information around their company’s products, customers, services, or other details.
“They’re often feeling frustrated when the tools don’t understand enough about day to day work to be useful,” said Hinds. Also, because employees are using multiple tools, they often have to repeat the same prompt over and over.
“It’s exhausting for workers to not only do this, but to have the work be unrecognized, often unrewarded and unacknowledged within the organization,” she said.
Similarly, workers are having to catch outputs that might look polished and finished on the surface, but could be wrong, incomplete, or missing important context. Debugging is the biggest driver of exhaustion, because it is often conducted by people who didn’t necessarily contribute to the initial output, Hinds noted, so they first have to dig up background information.
However, “not all botsitting is bad,” Hinds emphasized. “Certainly, we want workers to have some level of ownership and oversight.”
But when it is unnecessary, it can lead to botshitting, where users ship AI-generated work they haven’t verified because they’re overwhelmed or time-constrained. Sixty-nine percent of users admit to doing so, and 41% say they sometimes deliver work they could not explain if asked. Another 28% blame AI for mistakes they themselves caused.
“Botshitting is offloading your critical human thinking, judgment, and understanding,” Hinds explained. “You’re offloading that work that absolutely needs to remain with the human.”
Workers using multiple AI agents are significantly more likely to do this, she added, because agents are so scalable, and can spiral out of control if they don’t have the right controls or permissions built around them, causing overwhelmed users to give up on their verification efforts.
“You don’t often see the negative impacts until 3, 4, 5, steps down the line,” said Hinds. “Then it requires all of this cleanup work, detective work, to understand where did the agent go wrong.”
Interestingly, more than half of the workers surveyed said they get more day-to-day help from AI than they get from their managers, and consider it easier to collaborate with than humans.
Still, they seem to be facing a Goldilocks problem when it comes to sharing their use of AI. Among self-identified high AI achievers, 54% are using unapproved tools or using approved tools in noncompliant ways, and 36% are hiding how much AI helps them.
As Hinds explained, depending on the context and the level of psychological safety an organization has provided, it can be “differentially beneficial or harmful” to show you’re using AI, and, on the flip side, to conceal that you’re using it too much, because that might make you less valuable, or perceived as less valuable, she said.
It’s a complicated balance, because, she noted, “there’s massive pressure in so many organizations to demonstrate AI fluency, to demonstrate you’re a power user.”
In fact, the report said, “The companies pulling ahead are doing something different. They aren’t spending a greater share of their AI time using AI. They’re spending a greater share on the work around it: setting context, defining what ‘good’ looks like, building judgment, and deciding what should never have been handed to a model in the first place.”
The most transformative organizations are addressing AI challenges proactively: Providing training and support, treating AI as an opportunity to redesign work, and formally rewarding AI skills. In addition, it noted, the hardest skill to build is knowing when not to use AI.
It is “not just clicks of the tool, not just tokens used, but real skills, real learning,” said Hinds. In addition to investing in workers, these organizations are clearly stating AI strategy and clarifying the “why” behind it. Governance should also be “living and breathing,” with companies continuously re-evaluating policies.
And it needs to happen at every level, top execs included, said Hinds: “It’s being able to see the executives use the technology, sharing both the success stories and the failures.”
Successful companies are also actively using metrics anchored in existing key performance indicators (KPIs). They are measuring quality, efficiency, and employee engagement in different ways, and putting data in the hands of employees so they can assess their own adoption and success.
“It’s less about surveillance and more about feedback in terms of how we work collectively,” said Hinds.
What’s “fascinating but perhaps not surprising,” she said, is that workers are increasingly using AI itself as a teacher, and prefer it over other learning channels. This speaks to the importance of low-code, no-code tools, with low learning curves and organizational context, that are embedded directly into workflows.
“It is starkly different from what we’ve seen with previous technologies,” she said.
This article originally appeared on CIO.com.


The Event Horizon Telescope (EHT), the facility that delivered humanity’s first-ever picture of a black hole, can produce some of the sharpest images in all of astronomy. But turning the EHT’s raw data into images is a complex process involving messy statistics and powerful algorithms. Recent work presents a potential upgrade to that process: for the first time in long-baseline interferometry, it may be possible to model everything everywhere all at once.
The EHT has some of the sharpest eyes in all of astronomy. With its effective resolution of just 20 microarcseconds, in principle you could use it to read a newspaper in New York while sitting at a cafe in Paris. But this planet-spanning instrument (it relies on data from radio telescopes on four continents) doesn’t snap pictures like an ordinary camera. Instead, each pair of telescopes measures something called an “interferometric visibility,” which is related to a single Fourier component of the actual underlying image.

The first image of a black hole, constructed from Event Horizon Telescope data taken in 2017. [EHT Collaboration; CC BY 4.0]
Typically researchers break the problem down into several stages: first calibrate the data, then regularize and construct the best-fitting image, then analyze that image to constrain the actual physics you care about like the width of the ring surrounding a black hole. This is how the original EHT publications went about their groundbreaking work on the now-iconic glowing ring around the supermassive black hole in the galaxy Messier 87 (M87*).
Recent work led by Paul Tiede (Black Hole Initiative at Harvard University) suggests an alternative process. Instead of separating the stages of analysis as described above, the team demonstrated that one could fit everything simultaneously in a framework they call hierarchical interferometric Bayesian imaging, or HIBI.
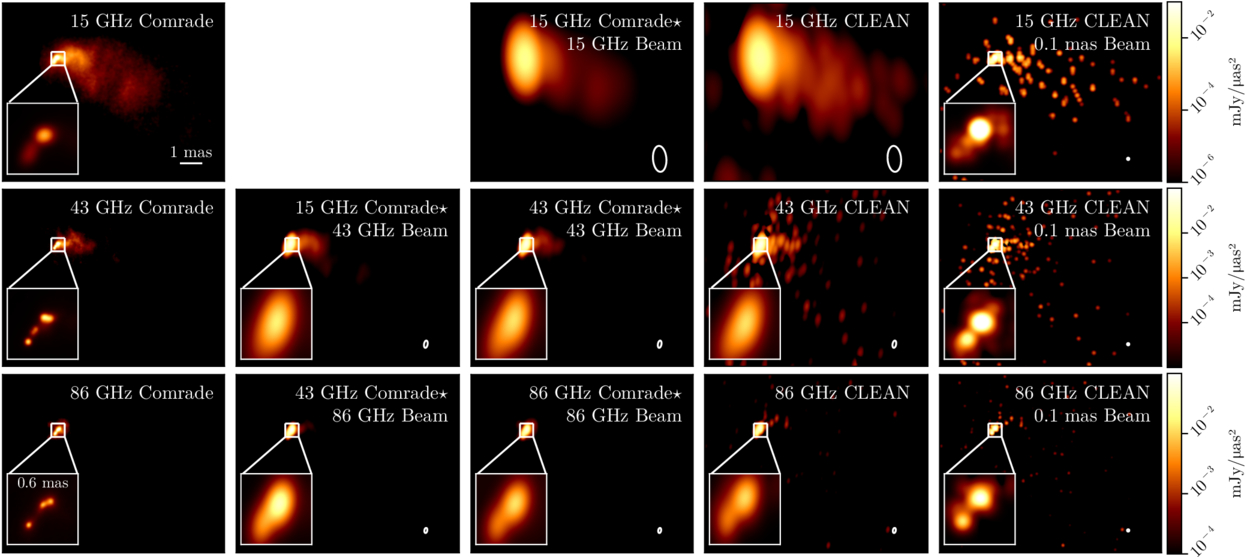
A comparison of the new HIBI technique (referred to as “Comrade” here) and a traditional algorithm called CLEAN. Click to enlarge. [Tiede et al. 2026]
Even more exciting, the team demonstrated that it’s possible to skip the image construction step altogether and go straight to the science. By fitting parameters describing the physics underlying a scene, the team was able to constrain the width of the ring around M87* without any reference to a picture. They predict that this technique could be crucial for extracting information when future instruments like the Next Generation Event Horizon Telescope observe more distant black holes that are only marginally resolved. Though we’ll likely have to wait years for these next-generation telescopes, work like this ensures that astronomers will be able to squeeze as much science from them as possible once these new facilities are ready.
“Hierarchical Interferometric Bayesian Imaging,” Paul Tiede et al 2026 ApJ 997 262. doi:10.3847/1538-4357/ae2749
The post Enhancing the Sharpest Images appeared first on AAS Nova.
Editor’s Note: For the remainder of 2025, we’ll be looking at a few selections that we haven’t yet discussed on AAS Nova from among the most-downloaded articles published in AAS journals this year. The usual posting schedule will resume January 2nd.
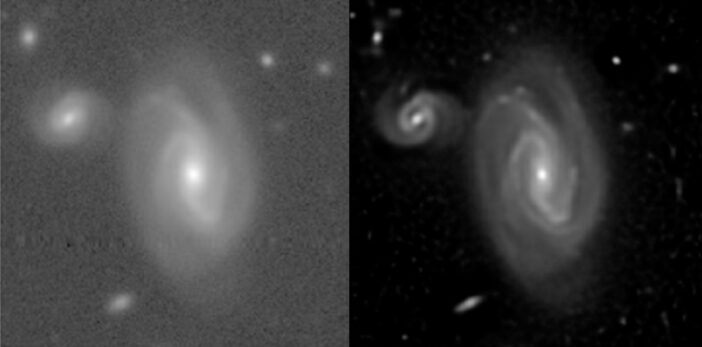
A team led by Yashil Sukurdeep (Johns Hopkins University) developed a new method for processing and combining ground-based astronomical images. The authors’ algorithm, called ImageMM because it leverages a method called majorization–minimization, yielded greater detail in bright sources and distinguished more faint sources from the background than existing methods.
As ground-based telescopes grow larger and their cameras grow more sensitive, they must still contend with one unfortunate fact: they are trapped beneath Earth’s atmosphere, which blurs fine details in astronomical images. To extract as much information as possible from beneath Earth’s blurry, ever-shifting atmosphere, researchers have developed numerous strategies for cleaning, combining, and sharpening astronomical images. From simple averaging of multiple exposures to complex statistical techniques, each of these methods has unique strengths and weaknesses. ImageMM succeeds in quieting background noise and sharpening images of both extended and point-like sources while avoiding many of the pitfalls of statistical methods.
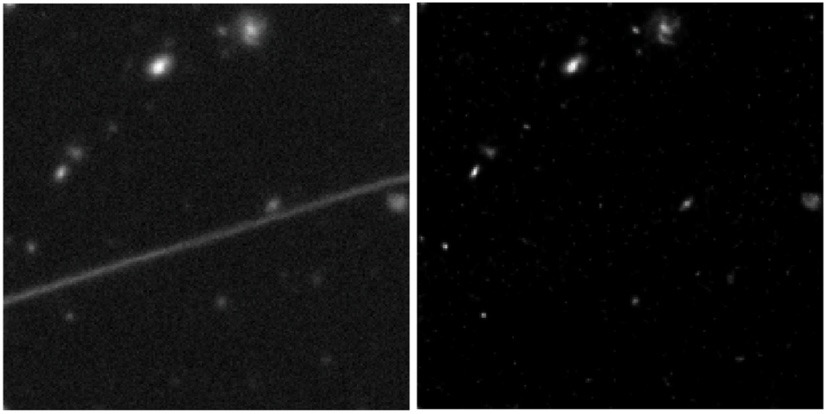
An example of satellite-trail removal by ImageMM. Click to enlarge. [Adapted from Sukurdeep et al. 2025]
Yashil Sukurdeep et al 2025 AJ 170 233. doi:10.3847/1538-3881/adfb72
The post Selections from 2025: A New Way to Combine Ground-Based Images appeared first on AAS Nova.

Isolated brown dwarfs are some of the rarest and hardest to study objects in our stellar neighborhood. Recently, astronomers revealed that one of the most famous isolated brown dwarfs, W1935, is not actually one brown dwarf but two.
Astronomers know of only 50 free-floating brown dwarfs within the nearest 200 light-years or so, and even the ones we know about are poorly understood. Since brown dwarfs are frigid compared to their stellar cousins, they consequently shine much less brightly and at longer wavelengths of light. Even taking a picture of these ~500K objects requires long stares with specialized telescopes, and these facilities already have their schedules full supporting a wide range of other areas of research from distant galaxies to exploding supernovae.
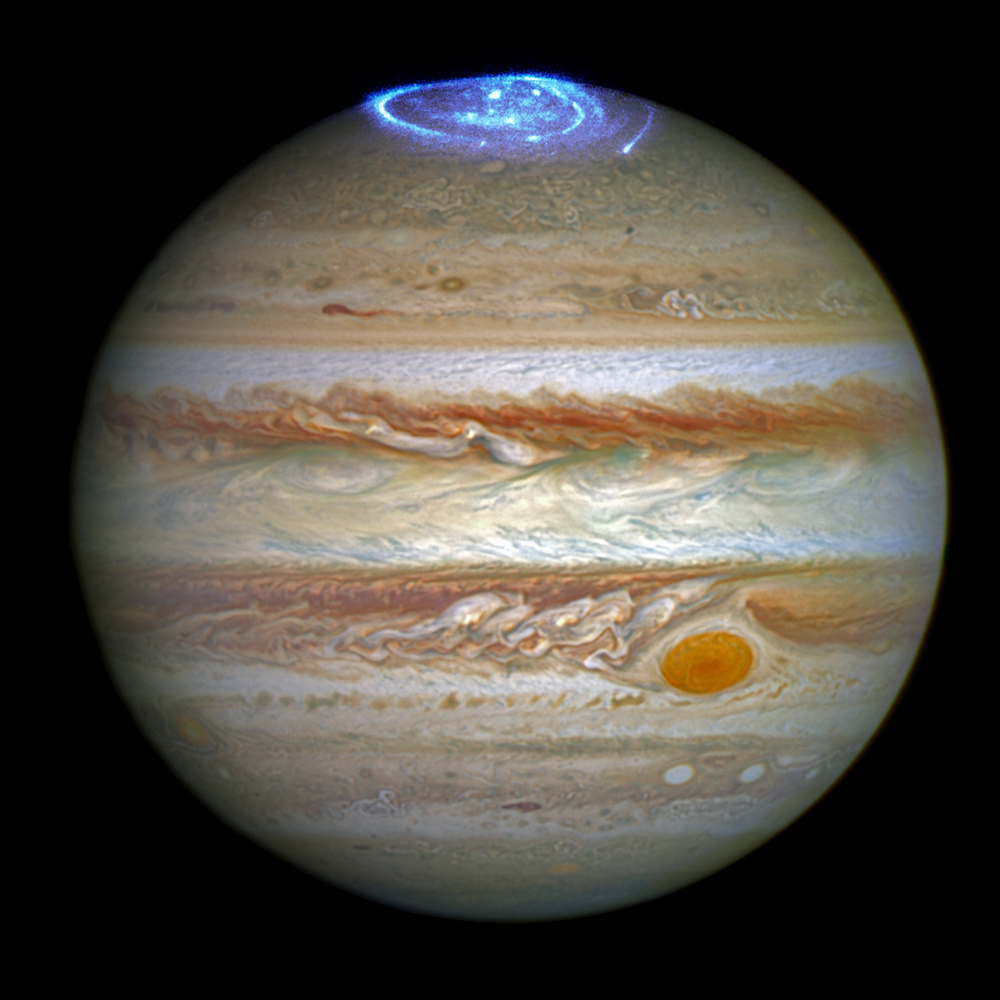
An image of Jupiter and its prominent aurora taken with the Hubble Space Telescope. [NASA, ESA, and J. Nichols (University of Leicester); Acknowledgment: A. Simon (NASA/GSFC) and the OPAL team]
Recently, JWST continued its pattern of discovery: the telescope took another look at the brown dwarf W1935, where methane emission was detected for the first time, and again found something surprising.
When JWST first took a look at this brown dwarf, it used its Near Infrared Spectrograph (NIRSpec) to record a spectrum of the object. These data revealed a large spike near 3 microns that perfectly lined up with methane emission from an aurora, similar to what we observe on Jupiter in the solar system. This was a thrilling find, since it hinted at an exciting possibility: Jupiter’s aurora is powered by its nearby moon Io, so the researchers cautiously wondered if W1935’s aurora could be evidence of a companion satellite as well.
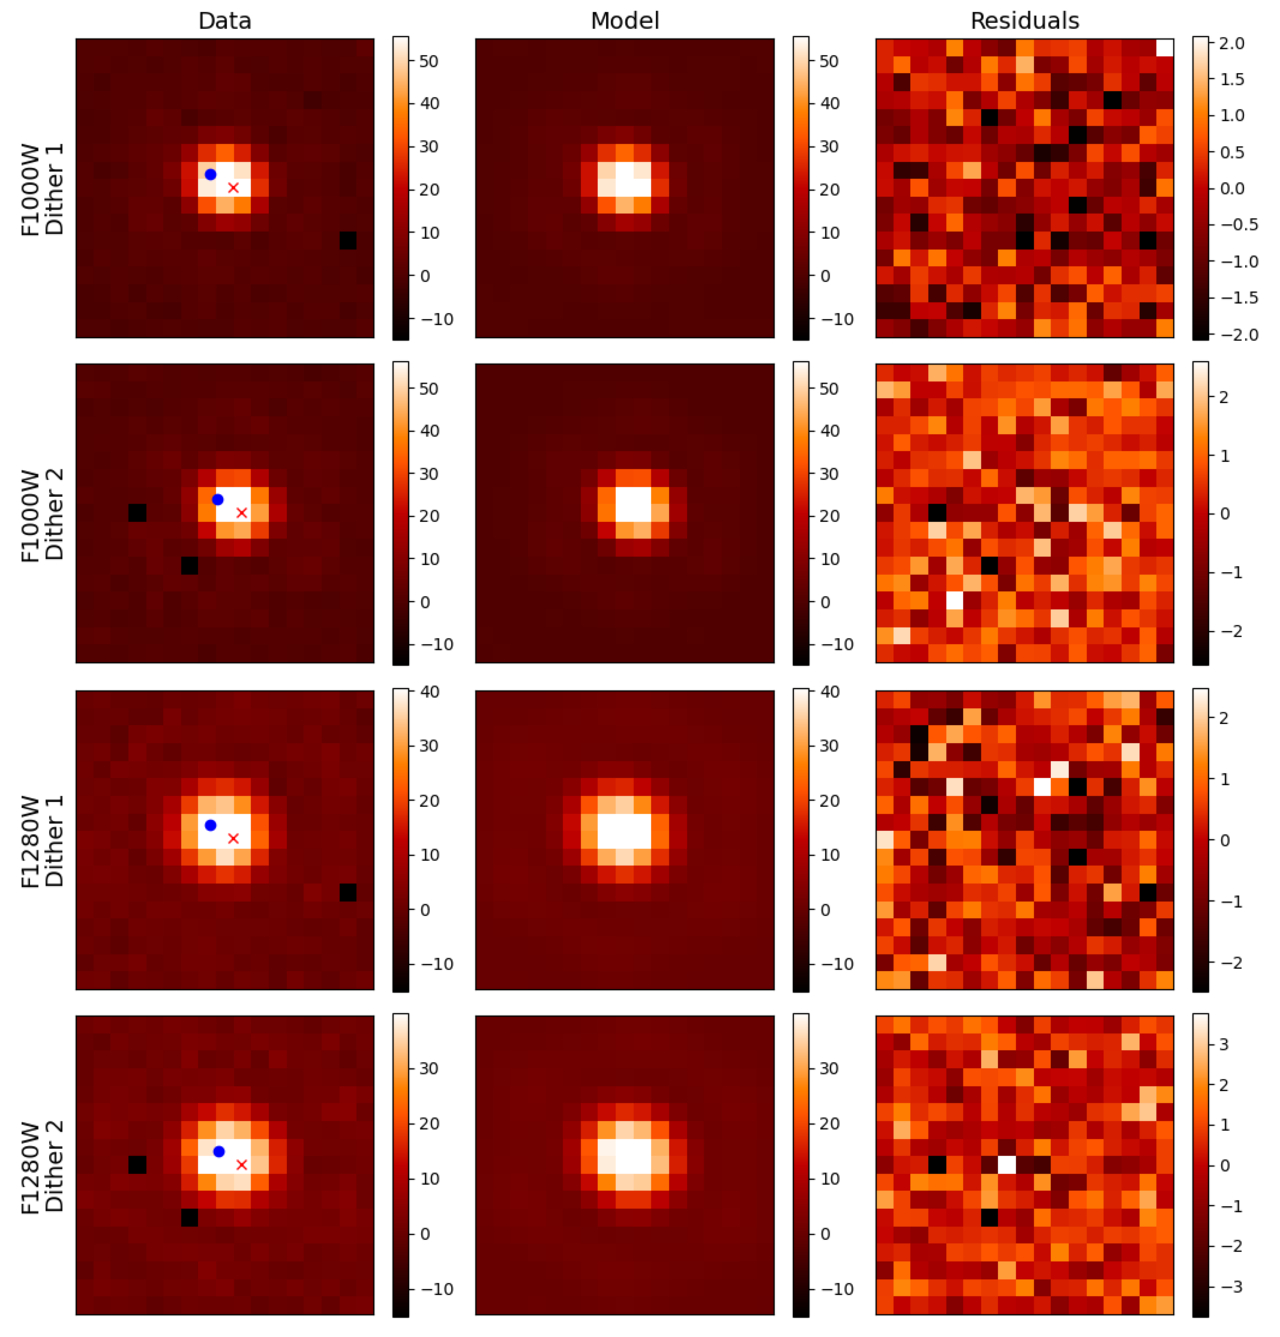
Images of W1935 taken with MIRI (left column), the author’s model for those images (center column), and the residuals (right column). The model includes two nearby point sources that are so close together they appear as one slightly elongated source. Click to enlarge. [De Furio et al. 2025]
This makes W1935 just the second-ever known Y+Y dwarf binary and cements its status as one of the most interesting brown dwarf systems discovered to date. So far, it’s not clear which object is responsible for the auroral signal since the objects are so close together that their images blur together without careful modeling and image processing.
De Furio’s team pointed out that JWST has yet another instrument that could prove useful here: its Integral Field Unit spectrometer within NIRSpec. Should JWST revisit this fascinating system, it could study the aurora’s variability over time, pin it to one specific object within the binary, and hopefully shed some light on whether any moons play a role in the methane emission. Given all we have learned each time JWST has turned to these strange worlds, we can only hope that it will do so again soon.
“Discovery of the Second Y+Y Dwarf Binary System: CWISEP J193518.59-154620.3,” Matthew De Furio et al 2025 ApJL 990 L63. doi:10.3847/2041-8213/adfee1
The post A Strange Brown Dwarf Gets Stranger appeared first on AAS Nova.

Astronomers may have directly imaged a companion star to the famous red supergiant Betelgeuse at last. Though the tentative detection only loosely constrains the star’s physical properties, it appears to be a 1.6-solar-mass pre-main-sequence star. The discoverers suggest the name Siwarha, Arabic for “Her Bracelet,” given that the star circles Betelgeuse, “Hand of the Giant.”

A photograph of the constellation Orion. Betelgeuse is the bright yellow star located left of center. [E. Slawik/NOIRLab/NSF/AURA/M. Zamani; CC BY 4.0]
Betelgeuse is a variable star. On top of its well-constrained 400-day pulsation period, the star has exhibited two behaviors that have drawn interest in recent years: a deep, prolonged dimming episode in 2019–2022 that is thought to be due to an immense ejection of mass from the star’s surface, and a 6-year variation in the star’s photometry, astrometry, and radial velocity.
Multiple studies have attributed the 6-year variability to one or more companion stars. In general, these studies predict that the companion star circles Betelgeuse on a tight, 6-year, nearly edge-on orbit. As reported in a new article published in the Astrophysical Journal Letters, observations have likely proved these predictions correct.
Steve Howell (NASA Ames Research Center) and collaborators searched for Betelgeuse’s predicted companion star using the 8.1-meter Gemini North telescope. The team used the ‘Alopeke instrument in speckle imaging mode, which involves taking thousands of milliseconds-long snapshots to avoid smearing due to atmospheric fluctuations.
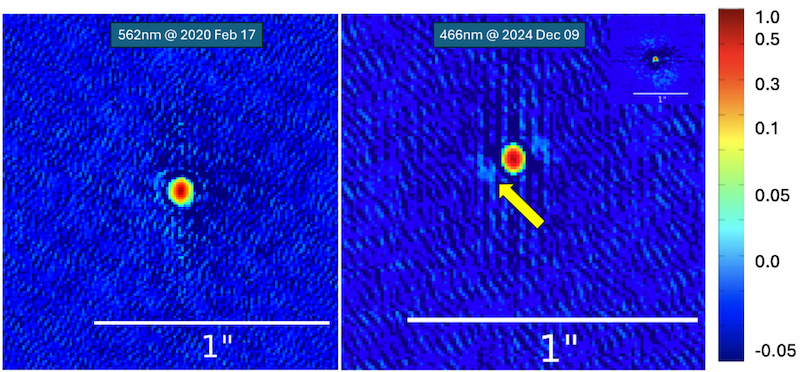
Observations of Betelgeuse from 2020 (left) and 2024 (right). An arrow points to the companion. Note that the image processing introduces a 180º ambiguity in the location of the companion, which is resolved by analyzing phase information. [Howell et al. 2025]
Howell and coauthors performed additional analyses to rule out interference from hot pixels, cosmic rays, or atmospheric diffraction. They also considered that the star could lie in the background or foreground, but they found both possibilities unlikely. After further calculations, the team estimated that the companion is six magnitudes fainter than Betelgeuse and separated by just 52 milliarcseconds at an angle of 115º. These quantities agree well with predictions for the companion’s position.

The on-sky proper motion of Betelgeuse from 2020 to 20204. The companion is shown as the small black circle. This shows that if the companion star were actually a background star, it would have been plainly visible in the 2020 observations. [Howell et al. 2025]
The team closed with a call to the community to turn their instruments toward Betelgeuse on 26 November 2027, when the companion will once again be at its greatest angular separation. Our exploration of this long-sought-after star has just begun!
“Probable Direct Imaging Discovery of the Stellar Companion to Betelgeuse,” Steve B. Howell et al 2025 ApJL 988 L47. doi:10.3847/2041-8213/adeaaf
The post Betelgeuse’s Companion Star May Have Been Seen at Last appeared first on AAS Nova.

Motivated by a desire to support community members financially during the coronavirus pandemic, researchers employed 30 local citizen scientists in the Hubble Image Similarity Project. This project quantified the similarities between astronomical images, providing a way to test the results of image-search algorithms.

The Eagle Nebula, pictured here in an image from Kitt Peak National Observatory, is a star-forming region in the Milky Way. [T.A.Rector (NRAO/AUI/NSF and NOIRLab/NSF/AURA) and B.A.Wolpa (NOIRLab/NSF/AURA); CC BY 4.0]
You might start your search with an astronomical image database, using filters for object type or instrument to sift through thousands and thousands of options. But even filtering out everything but star-forming regions might yield vastly different results, given the widely varying shapes, colors, and sizes of these regions.
Or maybe you’ll feed your image into a neural network that has been trained to spot similar images. The results may seem promising, but how can you tell whether the algorithm has found the images that are the most similar? Would another algorithm do better?
Astronomical image collections rarely contain information about similarities between images in their metadata, and while neural networks appear to excel at gathering similar images, the results of these models are generally unverified. The Hubble Image Similarity Project, led by Richard White (Space Telescope Science Institute) and Josh Peek (Space Telescope Science Institute and Johns Hopkins University), addressed these issues with a team of citizen scientists who generated similarity information for astronomical images, providing a quantitative means to test the results of neural networks.
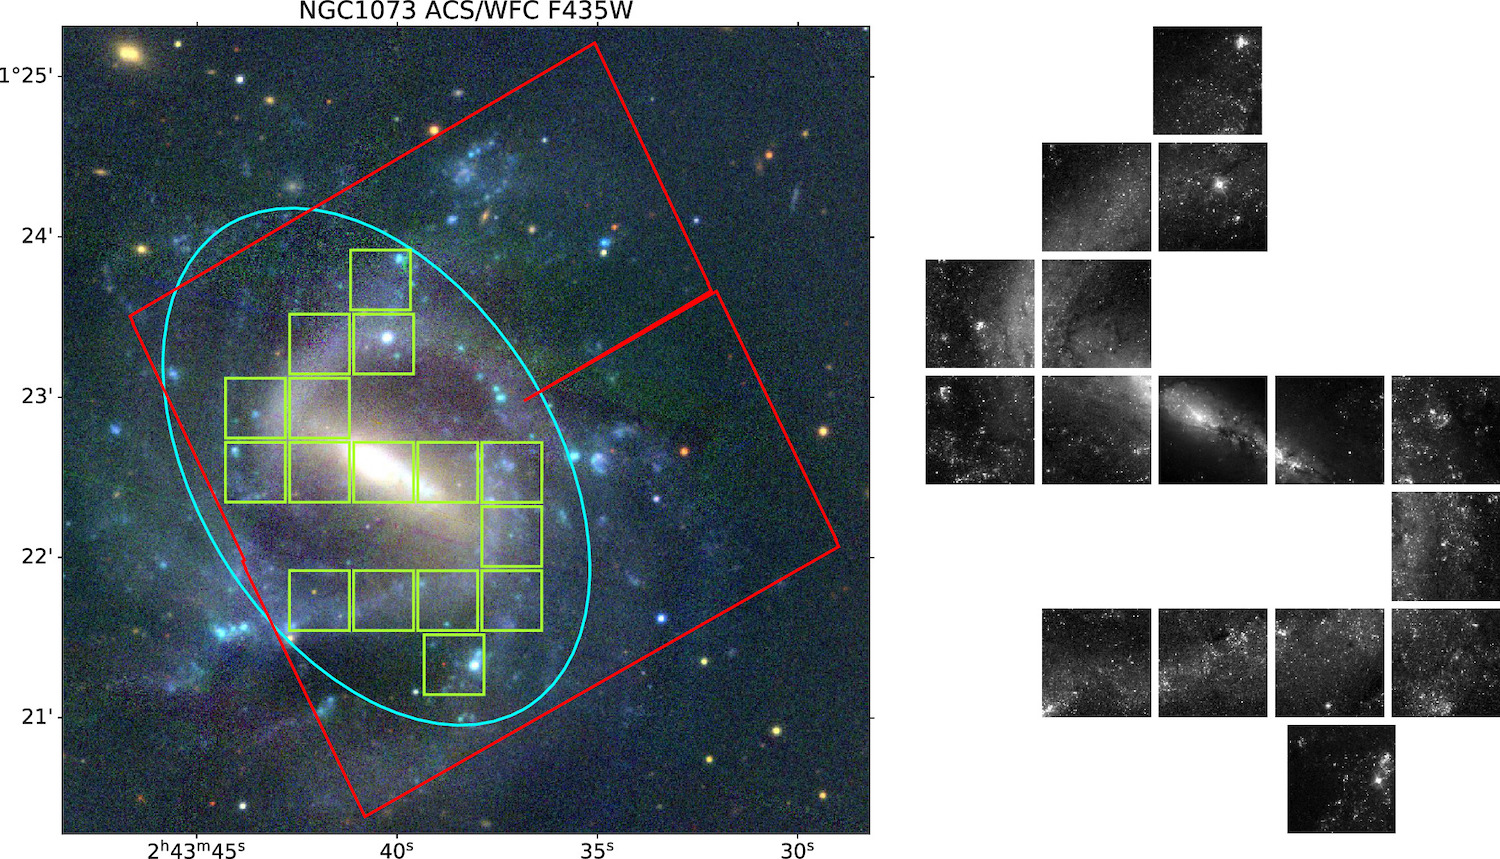
An example of individual test images (green squares) extracted from a Hubble Legacy Archive image (red square). Low-contrast areas have been excluded, leaving the galaxy’s spiral arms for analysis. Click to enlarge. [White & Peek 2025]
White and Peek recruited 30 members of the community within walking distance of the Space Telescope Science Institute to identify similar astronomical images, and the reviewers were paid for their work. In the three phases of the project, reviewers considered test images one at a time and 1) selected all similar images from a set of 15 comparison images, 2) selected the most similar image from a narrowed-down set of 6 comparison images, and finally 3) selected the most similar image from a set of 3 comparison images.
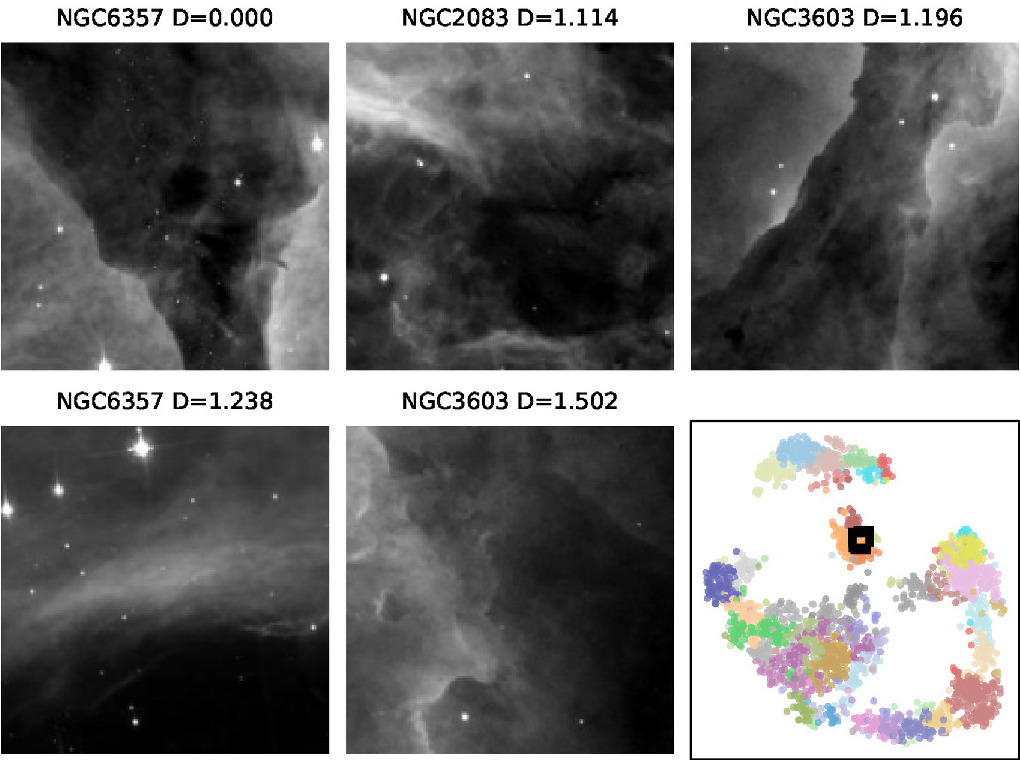
Examples of similar images according to the image similarity matrix. In the lower-right corner is a visualization of the similarity data. The semicircle of data points in the bottom half of this visualization represents galaxies, while star clusters occupy the small arc near the top and nebulae sit in the island in the center of the plot. Click to enlarge. [Adapted from White & Peek 2025]
Similar images resemble one another in terms of structure, texture, and other factors that White and Peek say are “difficult even to describe in words” — for example, the diffuse glow of a galaxy interrupted by a bright star with diffraction spikes, or a nebula speckled with stars and dense dusty clumps. The similarity data from this study are available online and can be used to test the performance of image-search algorithms. In future work, the authors plan to carry out a similar project using images of the Martian landscape.
“The Hubble Image Similarity Project,” Richard L. White and J. E. G. Peek 2025 AJ 169 306. doi:10.3847/1538-3881/adcb43
The post Citizen Science Born in the Pandemic: The Hubble Image Similarity Project appeared first on AAS Nova.
While we make batteries based on many different chemistries, nothing has approached the massive scale at which we can produce lithium batteries. That scale makes the economics of lithium-ion batteries hard to compete with. Even if we develop a superior battery technology, it's unclear whether we can get manufacturing costs down quickly enough to compete with the efficiency of the lithium supply chain and manufacturing.
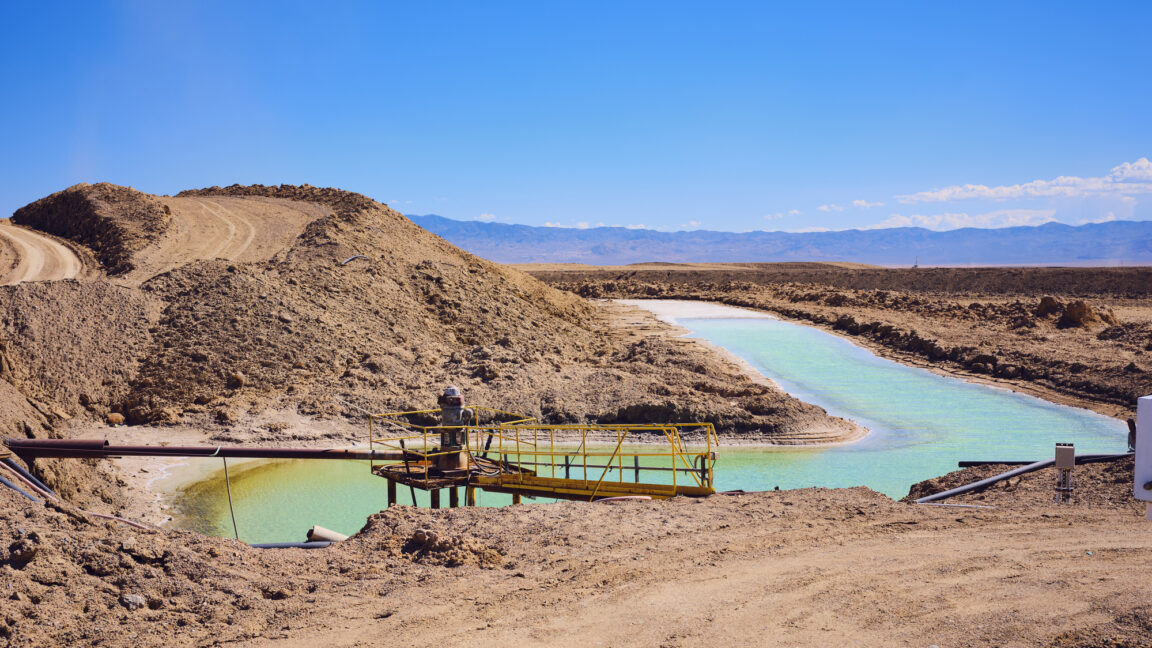
The one thing that could change the dynamics is a supply crunch. While lithium is extremely widespread, lithium that can be extracted economically is a different matter. It's cheapest to extract it from brines, and lithium-rich brines are largely limited to South America. We do obtain some lithium from other sources, but it's considerably more expensive.
In today's issue of Science, however, a research team has identified an energy-efficient means of extracting lithium from rocks. The process they've designed uses far less energy than existing ones, regenerates all its starting chemicals, and produces byproducts that could also be sold.
© Cavan Images
