❌

Reading view

Decades of NASA Satellite Data Reveals the Elusive, Enigmatic ‘Urban Pulse” of Six Major Cities


A multi-institutional team of researchers led by University of Connecticut Professor Zhe Zhu has developed a method for measuring the dynamic, real-time activity of urban environments from space, which they are calling an “Urban Pulse.”

The research team behind the novel urban activity metric said that monitoring a city’s Urban Pulse could help mitigate uncontrolled urban sprawl or decay and enable environmentalists and urban planners to intervene before disasters become unavoidable.

Measuring an Urban Pulse Could Reveal Neighborhoods ‘Not Doing Well”

Although environmentalists and urban planners have a wide range of tools to measure the activities within a city, Zhu notes that scientists have spent decades merely capturing the “outcome of urbanization,” such as a finished road or a newly completed home. However, the researcher and lead author of a study detailing the Urban Pulse methodology added that, even with all the current tools, “you don’t really see the dynamics within an urban area.”

According to a statement detailing the new approach, a city’s pulse is determined by all construction activity within it. Along with new construction, the metric includes repairs, infrastructure improvements, or expansion into previously undeveloped green spaces. When used correctly, the researchers said that it can help determine “if and where their city is not doing well.”

“This would allow (authorities) to be proactive rather than conducting a metaphorical autopsy after the decay of an area is evident,” the team explained.

Bridging the Gap Between Abstract Urban Theories and Measurable, Real-World Data

To test their approach, the team evaluated the Urban Pulse of six cities: Seattle, Shenzhen, Lagos, Mumbai, Dubai, and Mexico City. This involved a deep examination of what the team termed “decades of dense time-series data” collected by NASA’s Harmonized Landsat and Sentinel-2 (HLS)  satellites for physical transformations in an urban environment, such as new construction, measurable infrastructure improvements, and demolition.

Instead of analyzing each city’s changes manually, the team evaluated the above changes on what they called “the neighborhood level” using a deep-learning and time-series-analysis approach called CAPES, developed by former UConn postdoctoral researcher Ji Won Suh. The team said that, by observing these “high-frequency rhythms of development” from a broad ‘outer space’ perspective, their approach “bridges the gap between abstract urban theories and measurable, real-world data.”

Urban Pulse
This figure visualizes Dubai’s rapid expansion as a glowing “urban pulse.” Mapping monthly construction data from the city’s top 65 most active locations, the ridge plot reveals how distinct neighborhoods grow through spiky, cyclical, and asynchronous bursts. Rather than a steady wave, urbanization unfolds as dynamic, localized heartbeats, exposing the complex rhythms driving a modern metropolis. Image Credit: Zhe Zhu/GERS Lab.

After examining CAPES’ results, the team found several key markers within the Urban Pulse. For example, the view from space revealed that growth within cities is not smooth and steady. Instead, Zhu and colleagues said that development happens in “abrupt, intense, and episodic bursts of construction.”

CAPES also revealed that the rhythms of an urban environment are cyclical. For example, while a city may show relatively steady growth on a broader level, individual neighborhoods go through “dramatic boom-and-rest cycles” of expansion and dormancy that don’t appear to follow predictable annual seasons.

The third pattern revealed by measuring the six cities’ Urban Pulse from space was that cities are “asynchronous,” meaning a single city does not ‘beat’ in unison. The team noted that neighborhoods “pulse at completely different times.” When it functions properly, this “uncoordinated rhythm” helps prevent the city’s infrastructure and labor markets from “overheating.”

Unlike previous methods for tracking a city’s evolution, the team noted that their Urban Pulse approach can help researchers “visualize a city’s reaction to global shocks.” For example, the team said that their analysis captured “the exact moment the COVID-19 pandemic triggered a widespread, synchronized ‘cardiac arrest’ in urban development worldwide.”

However, their new tool also revealed what the researchers termed “profound inequalities” in how individual cities recovered from the dramatic halt to urban growth. For example, the team said that the Urban Pulse of Shenzhen revealed synchronized ‘dips’ in activity, followed almost immediately by “rapid, policy-driven rebounds.” However, the same Orban Pulse analysis showed that the reactions in Mumbai and Mexico City were much more “muted.”

“It’s like in human beings,” Zhu explained. “When you get a disease, it’s not going to show up exactly the same in different people.”

A ‘Very Impactful Tool’ for Navigating Cities

Although the Urban Pulse metric offers a tantalizing tool for academics, the team noted real-world benefits for global policymakers, urban planners, and environmentalists, adding that “it serves as an early warning system.”

“By monitoring the rhythm, rate, and amplitude of neighborhood pulses, governments can identify early signs of urban decay or unsustainable sprawl and intervene before crises become entrenched,” they explained.

The team also suggested that making Urban Pulse data publicly available could “revolutionize how everyday people interact with their cities.” For example, an urban family considering a move to a new city or a new part of their current city could track a target neighborhood’s pulse to spot early warning signs of decay or early indicators of positive-trending growth. The same data could help business owners plan new locations or expanded service routes, depending on the business profile and the local Urban Pulse trends.

“This is going to be a very impactful tool influencing not only top-down policy decisions from governments but also bottom-up decisions from everyday people navigating their cities,” Zhu explained.

In a recent study, “The Urban Pulse: Diagnosing the urbanization process as spiky, cyclical, and asynchronous” was published in the Proceedings of the National Academy of Sciences.

Christopher Plain is a Science Fiction and Fantasy novelist and Head Science Writer at The Debrief. Follow and connect with him on X, learn about his books at plainfiction.com, or email him directly at christopher@thedebrief.org.

  •  

Artificial eyes could bring human-like sight to self-driving cars and robots

Although self-driving cars and sophisticated robots use advanced cameras, computer algorithms and artificial intelligence to perceive their surroundings, these artificial eyes struggle to remain reliable in mixed lighting conditions. A team of researchers, co-led by an engineer from Penn State, has proposed a solution that mimics the mechanics of the human eye to adapt from bright to dark light in seconds.

  •  

“SpiderCam, SpiderCam, Does Whatever a Spider Can?” 3D Camera Inspired by Jumping Spider is First to Operate Below One Watt


Northwestern University engineers have unveiled an extremely energy-efficient 3D camera, called SpiderCam, inspired by how jumping spiders judge depth before making a calculated leap.

The research team behind the novel device said their technology could help engineers build wearable technologies, assistive devices, robots, drones, and other futuristic technologies that benefit from quickly and efficiently gauging their surroundings.

How Jumping Spiders Inspired Energy-Efficient SpiderCam

According to a statement announcing SpiderCam, 3D cameras typically estimate image depth in two ways. The first approach involves captured images from multiple viewpoints and comparing them, and the second involves projecting a light source, often an infrared (IR) laser, and then measuring the reflection.

Although both methods can produce realistic three-dimensional images, they can require significant computing power, additional operational energy, and often expensive hardware such as lasers.

Fortunately, millions of years of evolution have resulted in a creature that possesses a hyper-efficient way of estimating depth: the jumping spider.

“Jumping spiders jump to catch prey, to avoid predators and to get around, and that requires excellent vision,” said Northwestern’s Emma Alexander, the study’s corresponding author and an expert in bio-inspired computer vision. However, the researcher notes that their brains are extremely small, requiring the ability to calculate distances in an energy- and computationally efficient way.

According to Alexander, jumping spider eyes have multiple layers of retinas in each eye, rather than just one as in human eyes. When measuring distance, each retina focuses on an image at a slightly different distance, resulting in some images being blurrier than others.

“They see multiple levels of focus at all times,” Alexander explained. “So, they are always collecting pairs of images.”

After collecting these images in real time, the fly’s poppyseed-sized brain compares their sharpness, yielding a surprisingly accurate depth estimate, as evidenced by the creature’s ability to jump with precision.

Prototype Captures Images at Two Distances and Compares Their Blurriness

Inspired by nature’s hyper-efficient, extremely accurate depth estimation method, Alexander’s team decided to build a 3D camera using the same basic approach.

“We wanted to understand whether we could borrow some of the same principles to create an extremely energy-efficient depth sensor that could be used in resource-constrained situations where users don’t have unlimited access to power,” Alexander explained.

SpiderCam camera jumping spiders
Called SpiderCam, the new device senses depth the same way that jumping spiders judge distances before making a high-precision hop. The camera produces real-time 3D maps while consuming less than a watt of power. That’s less energy than used by a standard nightlight. Image Credit: Emma Alexander/Northwestern University.

Instead of capturing images at multiple distances, as the jumping spider’s eye does, the Northwestern team’s initial design captures two images of the same scene at different focal lengths. Next, the system uses a custom algorithm to analyze the sharpness of the edges and textures captured in each image. The team said this analysis acts as a “translator between blur and distance” in the fly’s brain, resulting in “depth measurements in real time.”

To best approximate the naturally evolved energy efficiency of a jumping spider’s eye, Alexander’s team built the algorithm directly into a customizable computer chip specifically optimized for energy efficiency called a field-programmable gate array (FPGA).

The final prototype integrating the team’s dual-lens system generates depth maps at 32.5 frames per second. Critically, it generates this level of accurate 3D maps while consuming 624 milliwatts of power. For comparison, the team notes that 624 milliwatts is “less energy than used by a standard nightlight.”

Future Versions Could be Even More Energy Efficient

Although the team said that the current version of the SpiderCam is the “first passive FPGA-based 3D camera system to operate below one watt,” they hope to improve its optics and expand its field of view. Once they have a commercial-grade version, the team hopes to integrate SpiderCam into wearable devices and small robots.

Beyond proposed applications, the Northwestern team said that they “envision” a future, ultra-energy-efficient version  of the chip capable of “bringing 3D vision to applications where conventional depth sensors are impractical.”

“I’m very interested in settings where you’re very resource constrained and can’t just plug a camera into a wall,” Alexander explained. “For example, it could be deployed in field settings with limited power.”

“Separately, I also think it’s particularly exciting for applications like augmented reality where you’re interfacing with the physical world and need to know the locations of objects around you,” the researcher added.

The study’s co-first authors, Marcos Ferreira and Tianao Li, presented this work at the Computer Vision Foundation’s Conference on Computer Vision and Pattern Recognition (CVPR) in Denver. Complimentary registration is available for members of the media.

Christopher Plain is a Science Fiction and Fantasy novelist and Head Science Writer at The Debrief. Follow and connect with him on X, learn about his books at plainfiction.com, or email him directly at christopher@thedebrief.org.

  •  

Lithium mining impacts local waters

Electric vehicles and other clean energy devices rely on batteries that use a metal called lithium. The expanded use of lithium has made lithium mining a rapidly growing industry. Lithium is most often found in volcanic rocks called pegmatites. Researchers have studied how much carbon and water pegmatite mining uses, but they don’t know how it affects local water quality. 

Pegmatite mining releases not only lithium but also other metals commonly found in pegmatite, such as rubidium and cesium. These trace metals are under-researched in terms of their environmental effects and possible human toxicity, though the EPA has linked high levels of lithium to adverse health effects in kidney function, neurological development, and thyroid function. As such, there’s currently no established safe level for lithium in drinking water, but the U.S. Geological Survey suggests a preliminary safety level of 10 micrograms per liter (μg/L). 

Researchers at Duke University recently tested how much pegmatite mining increased lithium levels in local waters, and how long those effects lingered after mining processes ended. To do so, they measured metal concentrations in waters downstream from 2 lithium mines and adjacent processing plants. They hypothesized that mining activities would increase interactions between rocks and the surrounding surface water and groundwater, impacting their lithium concentrations.

The researchers collected 99 water samples from surface streams and 93 samples from groundwater wells surrounding the Kings Mountain and Hallman Beam lithium mines, in a zone of about 40 kilometers (25 miles) along the border of South Carolina and North Carolina. The researchers took 51 surface water samples upstream of the mines to evaluate natural metal levels, and compared these with 48 downstream samples showing the mining-impacted metal levels. 

The researchers measured lithium and other trace elements, like rubidium, cesium, arsenic, and strontium, in the waters using an instrument called an inductively coupled plasma mass spectrometer. They found that lithium concentrations in the surface waters increased from a background of 0.2 to 79 μg/L to concentrations of 785 to 1,249 μg/L within 10 kilometers (6.2 miles) of the mines and processing facilities. The groundwater lithium levels were as high as 4,500 to 47,000 μg/L in the wells at the mines, but were not affected at downstream wells where lithium levels ranged from 0.5 to 890 μg/L. 

They suggested that lithium in the groundwater downstream from the mines came from natural interactions of the pegmatite rocks with the water, rather than from the mines themselves. This natural process was confirmed when the researchers noticed that lithium levels in the groundwater rose after rainfall, which caused more water-rock interaction.

The researchers also measured ions like calcium, sulfate, and chloride in the waters using a tool that can analyze compound molecules, called an ion chromatograph. They found that calcium and sulfate concentrations increased in surface waters within 10 kilometers (6.2 miles) downstream of the processing facilities. These downstream waters had 50 to 120 milligrams per liter (mg/L) of calcium and 100 to 300 mg/L of sulfate, compared to 5 to 20 mg/L of calcium and 3 to 10 mg/L of sulfate in the background surface waters. These ions are also byproducts of pegmatite processing, produced from a waste product made up of calcium sulfate, called gypsum. 

The team explained that active mining has been discontinued at this site for approximately 3 decades, meaning that the lithium concentrations they measured reflect the long-term release of lithium from inactive mines and mining waste. Drawing from historical data, they estimated that while the mines were active, they likely released 10 to 30 times the amount of trace metals they measured at the same location today. 

The researchers concluded that hard-rock processing impacts downstream metal and ion concentrations more than the mining itself. As lithium mining operations expand, the researchers suggested that future researchers examine lithium toxicity as well as the potential effects of its co-occurring metals, like rubidium and cesium. They also emphasized the need to find solutions for removing the trace metals and dissolved gypsum from water systems, or preventing them from leaking into the water systems to begin with.

The post Lithium mining impacts local waters appeared first on Sciworthy.

  •  

Scientists Are Building Electronics That Stretch Like Human Skin and Learn Like a Brain

Stretchable Neuromorphic DeviceResearchers are replacing rigid silicon-based AI hardware with stretchable, neuromorphic electronics that mimic how the brain processes information, opening new possibilities for long-term human-machine integration. Modern artificial intelligence can outperform humans in tasks ranging from image recognition to medical data analysis, but there is one environment where today’s hardware still struggles: the human body. The [...]
  •  

Scientists Demonstrate What Pianists Have Argued for Over 100 Years


For more than a century, musicians have maintained that the way a pianist touches a key influences the sound that emerges. Many scientists, however, have argued that after the hammer strikes the string, the instrument itself determines the outcome, making the pianist’s touch irrelevant.

Now, a recent study published in the Proceedings of the National Academy of Sciences provides some of the strongest evidence yet in support of the musicians’ perspective.

A research team led by Dr. Shinichi Furuya of the NeuroPiano Institute and Sony Computer Science Laboratories developed a custom sensor system called HackKey. This system can record the movement of all 88 piano keys at 1,000 frames per second, with a spatial precision of 0.01 millimeters. The team invited 20 internationally recognized pianists to play notes while intentionally aiming for contrasting timbres, such as bright versus dark and light versus heavy. Listeners were able to distinguish among the different timbres, even individuals with no experience playing the piano.

The Movements Behind the Sound

The researchers identified a series of micro-movements beneath each keystroke. These movements are so subtle that they are almost impossible to see, but precise enough for listeners to perceive differences in sound.

Small changes in how quickly a key accelerates, slight overlaps between notes, and variations in the speed of initial contact with the key all influenced how listeners described the resulting sound. When each of these factors was adjusted individually, the perceived timbre changed. Adjusting a single movement feature was enough to reliably change how listeners perceived timbre. The results show that touch has a direct effect on sound, independent of factors such as volume or tempo.

The study describes these micro-movements as a motor skill developed through years of advanced training. The researchers call the emerging science of mapping movement to musical experience “dynaformics.”

A Debate as Old as the Modern Piano

The debate over whether touch can alter piano timbre dates back to at least the early 1900s, when music educators began discussing what distinguishes one performer’s sound from another. The piano’s mechanical action appeared to support the skeptics, since the hammer, once released, moves independently before striking the string and is not directly contacted by the pianist’s finger.

As a result of this mechanical process, many acousticians concluded that any reported differences in tone were psychological, influenced by context, volume, or timing rather than by touch. Musicians maintained their position but did not have the scientific tools to prove it.

To settle this debate, Furuya’s team developed a custom biometric contact-sensing system called HackKey, capable of recording the movement of all 88 piano keys at 1,000 frames per second with sub-millimeter precision. The system captured in-depth piano movement data that previous technology could not. For the first time, researchers could observe the specific actions of elite pianists and relate those movements to listeners’ descriptions of sound.

What It Means Beyond the Concert Hall

Piano teachers have often used general phrases like “play warmer” or “use a softer touch” because the specific movements that create certain sound qualities were not well understood. This study now offers a guide to those movements.

Future training tools may allow students to see precisely what their fingers are doing when a note is played successfully or not. Instead of relying on a teacher’s metaphor, students could compare their own keystrokes to a standard and work to improve their technique. The researchers suggest that this approach could make expressive technique easier to teach and visualize, especially for students who find it difficult to translate verbal instructions into physical actions.

The research may also apply to rehabilitation, robotics, and human-computer interaction. Discovering that small differences in movement can shape auditory perception offers new insight into how the brain links movement and sensory experience. Some researchers are exploring whether systems based on expressive musical movement could help patients recover dexterity and coordination after injury.

Most scientific research on music has focused on elements that are easier to measure, like pitch, loudness, and rhythm. Timbre, or the quality or “color” of a sound that makes one instrument or voice different from another, has been harder to measure. This study offers a new way to understand the mechanics behind this concept. The findings suggest that some of the most expressive parts of music come from movements too small to see, developed through years of practice.

Austin Burgess is a writer and researcher with a background in sales, marketing, and data analytics. He holds an MBA, a Bachelor of Science in Business Administration, and a data analytics certification. His work focuses on breaking scientific developments, with an emphasis on emerging biology, cognitive neuroscience, and archaeological discoveries.

  •  

This Giant Tropical Fruit Could Hold a Surprising Secret to Saving Teeth

Decayed Tooth Root Canal Treatment Lower MolarA newly developed biomaterial derived from natural and pharmaceutical components is showing promise as a potential treatment for periodontitis. What if a fruit best known for its massive size could help repair the damage caused by one of the world’s most common causes of tooth loss? Researchers in Brazil have developed an experimental biomaterial that [...]
  •  

Scientists Crack Major Ammonia Problem With a Platinum Catalyst Breakthrough

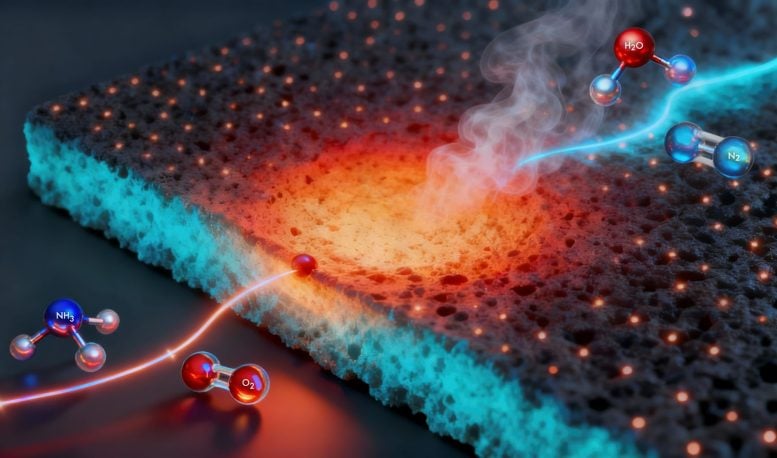
Platinum Catalyst Lights AmmoniaA newly engineered catalyst overcomes key obstacles that have long limited ammonia as a clean fuel for heavy industry. A newly developed single-atom platinum catalyst can ignite ammonia at about 200°C (392°F) and sustain stable combustion at 1,100°C (2,012°F) while producing very little NOx. The breakthrough could provide carbon-free, high-grade heat for industries such as [...]
  •  

NASA’s X-59 Sonic Boom Killer Is Ready for Its Biggest Test Yet

NASA X-59 Quiet SuperSonic Technology AircraftNASA’s strange-looking X-59 jet is about to reach the milestone it was built for: flying faster than the speed of sound. NASA’s X-59 experimental aircraft is preparing for one of the most important phases of its flight testing program. The next series of flights will include the aircraft’s first journey beyond the speed of sound, [...]
  •  

China’s Rise in Drug Development Looms Over U.S.

Clinical trials in China are getting attention at an international oncology gathering in Chicago. China’s surging biotechnology industry is fueling alarm that U.S. dominance in the field is waning.
  •  

Upcycling polystyrene with sunlight and sulfur

Over 20 million tons of polystyrene plastic are produced annually, yet only a small fraction is recycled worldwide. Current recycling methods consume large amounts of energy and often rely on harsh and toxic chemicals to break the strong molecular chains that make up polystyrene. One possible solution is the use of sulfur, which is an inexpensive byproduct formed when refining crude oil. Its unique chemical structure allows it to break up strong chemical chains in long plastic molecules. Despite its abundance, sulfur has very limited applications, and converting it into more usable forms tends to require a lot of heat, rendering it unused for long periods of time. 

Researchers at the Dalian Institute of Chemical Physics hypothesized that sulfur could help break down polystyrene waste to form more valuable chemicals. To power this reaction, they converted sunlight into heat energy through a process called photothermal conversion. They used this heat to transform polystyrene and sulfur into valuable chemicals like 2,4-diphenylthiophene, or chemical D, and 1,3,5-triphenylbenzene, or chemical T, which are used to make semiconductors and chemical sensors. 

To test this, the team mixed ground polystyrene and sulfur at a molar ratio of 1:0.5 in a glass test tube. They sealed the tube with a balloon and secured it onto an iron stand. Then, they focused sunlight onto the bottom of the tube using a curved mirror. As the mixture heated up, the yellow-white solids gradually melted and transformed into a reddish-black liquid after 2 minutes. After heating, the researchers removed the mirror and allowed the system to cool before collecting the gaseous products from the balloon and dissolving the remaining solids for further purification and analysis. 

The researchers then adjusted the reaction conditions to understand what factors influenced their results. They tested the reaction without sulfur, varied the sulfur ratios from 0.2 to 0.8, and replaced elemental sulfur with other sulfur-containing compounds. They also explored adding known photothermal agents, specifically metal oxide additives, to the mixture. 

To compare the difference between sunlight and artificial light, the researchers repeated the experiment indoors using a 100 Watt LED bulb and monitored temperature changes with a thermal camera. They also ran a control experiment using only polystyrene to check how sulfur affected the yield under LED light. They also tested exposure times from 1 to 6 minutes in 1-minute increments to determine how long it took to achieve the highest yields under LED. The researchers used these tests to identify which conditions were necessary for the reaction to occur and how different factors influenced its outcome.

They found that without sulfur or with alternative sulfur-containing compounds, the reaction did not produce chemical D or T under sunlight. In contrast, reactions that included sulfur successfully produced these target products, with the highest yields of 34% for D and 16% for T at a sulfur ratio of 0.5. When they added metal oxides, the chemical yields decreased to 22% and 12%, respectively, suggesting that these additives interfered with the desired reactions. In addition, when the researchers switched from sunlight to LED, the reaction yields dropped to 26% for D and 13% for T. 

Next, they examined how reaction time influenced product formation. They found that yields increased gradually before reaching the maximum at 4 minutes and leveling off. They also noted that mixtures containing sulfur heated up from room temperature to 320°C (608°F), while the control setup only showed a slight temperature increase. The researchers interpreted these results as confirmation of sulfur’s dual role as a reactant and a light-to-heat converter that enables the conversion of polystyrene to useful chemicals.

Taking it a step further, the researchers tested their method on real-world polystyrene wastes, including food packaging, cup lids, and foamed plastics. They successfully produced chemicals D and T from these materials, demonstrating that their process works beyond laboratory samples.

The team concluded that their study presents a simple, fast, and solvent-free approach to converting 2 abundant waste materials into valuable chemicals using sunlight. By combining polystyrene waste and excess sulfur, the researchers offer a new pathway for sustainable polymer upcycling that uses clean energy and is broadly applicable to everyday plastics.

The post Upcycling polystyrene with sunlight and sulfur appeared first on Sciworthy.

  •  
❌