❌

Reading view

Can Arid Planets Keep Their Cool?

side-by-side images of Venus's surface today and an imagining of what its surface might have looked like in the past

Editor’s Note: Astrobites is a graduate-student-run organization that digests astrophysical literature for undergraduate students. As part of the partnership between the AAS and astrobites, we occasionally repost astrobites content here at AAS Nova. We hope you enjoy this post from astrobites; the original can be viewed at astrobites.org.

Title: Carbon Cycle Imbalances on Arid Terrestrial Planets with Implications for Venus
Authors: Haskelle T. White-Gianella and Joshua Krissansen-Totton
Authors’ Institution: University of Washington
Status: Published in PSJ

The Carbon-Cycle Thermostat

When discussing the habitability of planets, we usually focus on the habitable zone, the region around a star where a planet can host a temperature suitable for supporting liquid water on its surface. Yet, being in the right place doesn’t necessarily guarantee that a planet will be habitable.

A planet also needs the right atmospheric composition to sustain the necessary temperatures for hosting liquid water. A key mechanism found on Earth for maintaining this composition is the geologic carbon cycle, which acts as a built-in climate control system. This cycle begins with volcanic eruptions releasing carbon dioxide (CO2), which then dissolves in rainwater and forms a weak acid that weathers rocks on continents. The weathering products wash into oceans, where they form carbonate rocks, locking carbon away. Eventually, plate tectonics recycles some of that carbon back to volcanoes. The weathering process works faster when the planet is warmer, thus regulating the amount of CO2 and stabilizing the climate over long periods of time (but it should be noted that it can take up to a few hundred thousand years to rebalance this slow carbon cycle through the weathering process).

An important caveat is that the weathering process requires sufficient liquid water on the planet’s surface, so what happens in the case for planets with shallower oceans? Low-mass M dwarfs, the most common type of star found in the galaxy, are expected to host less-massive disks and therefore lower water inventories for forming planets. If more “dry” planets are indeed a more likely outcome of planet formation, we’d want to know how their arid conditions influence their long-term evolution and habitability.

Creating Carbon-Tracking Models

The authors built a model that tracks how water and CO2 move between a planet’s interior, oceans, and atmosphere over 4.5 billion years. The model notably includes the following:

  • A sophisticated weathering model that accounts for how runoff can limit rock weathering, improving upon previous models that only included a temperature dependence on weathering
  • Wind-driven evaporation limits that influence the amount of water evaporation in addition to sunlight-driven evaporation
  • Multiple deep water cycle parameterizations that explore how water moves between the interior and the surface

The model tests for four initial surface water inventories (0.1%, 1%, 10%, and 100% of Earth’s oceans) and then simulates how the surface water, atmosphere, and climate evolve over time.

A Critical Water Threshold

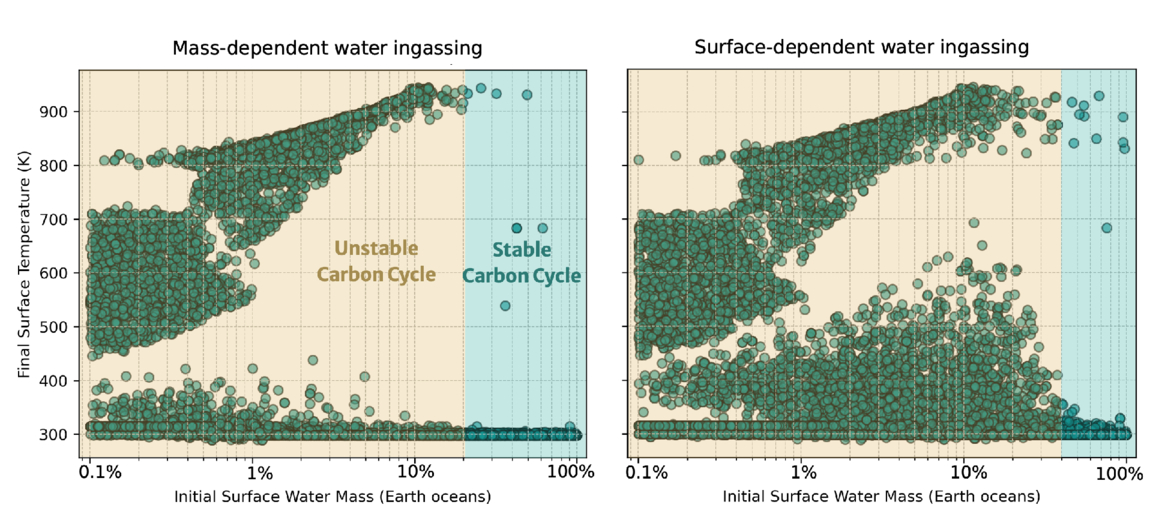
The models reveal that planets require at least 20–50% of Earth’s ocean mass to maintain a balanced carbon cycle. Below this threshold, the carbon cycle becomes unbalanced, leading to devastating consequences for habitability (Figure 1).
two plots of final surface temperature as a function of initial surface water mass

Figure 1: Final surface temperature after simulating 4.5 billion years of evolution as a function of initial water inventory for Earth-like planets. Each dot represents a model run with different assumptions (total carbon inventory, temperature dependence of weathering, soil age, etc.). The yellow region shows where most simulations result in uninhabitable surface temperatures from an unbalanced carbon cycle, and the cyan region shows where most simulations result in habitable surface temperatures and a balanced carbon cycle. The left and right plots show the results for two different parameterizations of the deep water cycle implemented in the model. [White-Gianella & Krissansen-Totton 2026]

For the more arid planets, models reveal a concerning runaway process. Limited surface water reduces precipitation and slows rock weathering. Weathering cannot keep up with volcanic CO2 release, causing CO2 buildup and warming of the atmosphere. The cycle repeats, driving runaway warming until all water evaporates.

Important Implications (Within and Outside Our Solar System)

Looking within the solar system, the results offer an explanation for how a potentially habitable Venus could have transitioned into its current inhospitable state. If Venus had formed with an initial water inventory below this critical threshold of 20–50% of Earth’s ocean mass, then its carbon cycle would have become unbalanced, creating the CO2 inferno seen on Venus today.

In future exoplanet studies, telescopes like the Habitable Worlds Observatory might detect ocean glint (specular reflection from liquid water) or measure land fraction from light curves. Finding a planet in the habitable zone but with limited ocean coverage would likely be bad news, as the planet could be quietly losing its grip on habitability. Astronomers may want to be more careful when looking at seemingly promising planets within their habitable zones.

Original astrobite edited by Natalie Price.

About the author, Jared Bull:

I am a 2nd-year PhD student at Johns Hopkins University. I study brown-dwarf variability and am interested in using time-series observations to uncover dynamic processes within their atmospheres. In my free time I like to read, cook, and do astrophotography.

The post Can Arid Planets Keep Their Cool? appeared first on AAS Nova.

  •  

Putting the Landing Site Before the Lander

An oblique-angle photograph of a deep crater half in shadow.

NASA is once again sending scientific missions to the Moon. But under the new commercial framework for getting there, researchers need to invent a new method for how to pick where to land.

A New Process for Picking Sites

NASA’s Commercial Lunar Payload Services program is a bold innovation in organizing robotic missions to the Moon. Under this model, rather than keeping the mission process entirely in-house, the agency selects the scientific mission they want to support then simply buys a ride to the lunar surface from a commercial vendor. But, how do you pick a landing site before you know exactly how you’re getting there?

A photograph from orbit of two volcanic mounds on the moon.

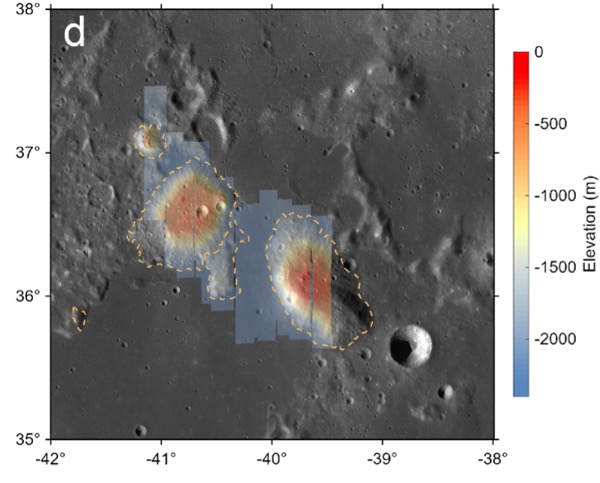
The Gruithuisen domes region, the broad area the Lunar-VISE team searched for potential landing sites. Click to enlarge. [Adapted from Williams et al. 2026]

The Lunar Vulkan Imaging and Spectroscopy Explorer (Lunar-VISE) mission, set to launch in mid-2028, was one of the first programs to go through this new landing site selection process. After being officially selected in 2022, the team had just nine months to nail down exactly where their mission should touch down. A recent article led by Jean-Pierre Williams (University of California, Los Angeles) detailed exactly how the team accomplished this task and presented some lessons they learned along the way.

No Parking Lots on the Moon

Picking a landing site is no small task: for context, selecting the landing sites for each of the most recent Mars rovers took five years and multiple community workshops. The Lunar-VISE team therefore took a streamlined and logic-driven approach. They started by explicitly laying out their science objectives: Lunar-VISE’s purpose is to investigate some strangely silicate-rich volcanic formations called the Gruithuisen domes, so they had to land either on or near those. They also had to have access to boulders that were excavated from deep within the domes during a crater formation event, so they had to pick a spot with boulders relatively nearby.

In addition to objectives, they also laid out a slew of constraints. Although they needed boulders nearby, they couldn’t have too many boulders, or any particularly large boulders, since those could pose hazards for landing. There also couldn’t be any steep slopes in the field. Most of the area had to maintain a line of sight with a supporting orbiter for communications, so they couldn’t set down near any ridges. Also, they had to consider how the terrain would cast shadows as the lunar day progressed, since they didn’t want their mission cut short by freezing temperatures and a lack of solar power. As the team quipped, “many interesting, high-science value locations on the Moon may not be in proverbial ‘parking lots.'”

A low-angle photo of a crater and plain on the moon, with arrows and annotations to the landing ellipse, boulders, and the edge of the dome.

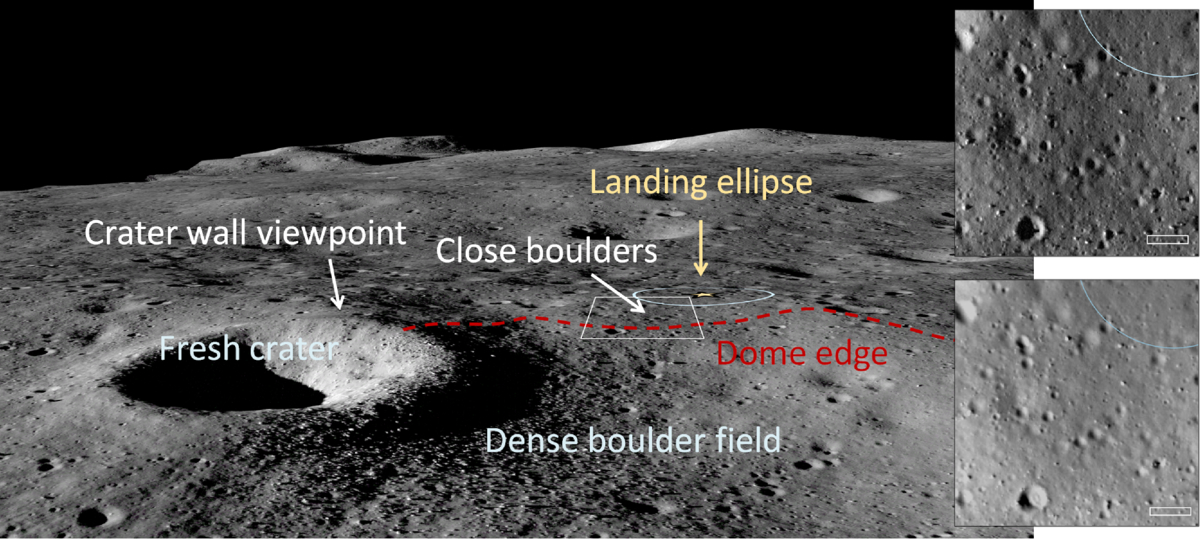
An image from the Lunar Reconnaissance Orbiter overlaid onto a terrain model of the final landing site. Click to enlarge. [Williams et al. 2026]

By combing through archival data and working with the team that operates the Lunar Reconnaissance Orbiter Camera, a key asset for making detailed maps of the Moon, the researchers found the perfect spot: alongside a 190-meter-diameter crater named Mareta. This feature is named after Mareta West, one of the first female planetary geologists at the United States Geological Survey and the scientist who selected the landing site for Apollo 11’s historic touchdown.

In addition to presenting their landing site, the researchers offered a handful of lessons to others who may someday be in the fortunate and thrilling position of needing to pick a landing spot on the Moon. For one, they urged teams to coordinate with the Lunar Reconnaissance Orbiter specialists as early as possible, since processing the imaging data for lander-quality maps is a specialized and intensive task. For another, they recommended that all of the software tools used be made publicly available so that future missions don’t need to duplicate their work.

As this article laid out, the Commercial Lunar Payload Services program and Lunar-VISE take us one step closer to making missions to the Moon routine — but we’re still figuring out exactly how to do that.

Citation

“Lunar-VISE Landing Site Selection and Characterization at Mons Gruithuisen Gamma,” Jean-Pierre Williams et al 2026 Planet. Sci. J. 7 161. doi:10.3847/PSJ/ae7d2c

The post Putting the Landing Site Before the Lander appeared first on AAS Nova.

  •  

Details on Dinkinesh and Its Surprise Satellite from the Lucy Mission

Dinkinesh and Selam

The Lucy spacecraft, en route to its primary mission targets, zipped past the main-belt asteroid Dinkinesh and revealed its tiny satellite, Selam. New research examines the surfaces and histories of these small rocky worlds.

A Stop Along the Way

In 2021, the Lucy spacecraft embarked on a 12-year mission to study several Jupiter trojan asteroids, which share Jupiter’s orbit. The spacecraft won’t have its first encounter with a Jupiter trojan until 2027, but it hasn’t been idle during its long journey. In November 2023, Lucy performed a dress rehearsal of its trojan-encounter maneuvers during a flyby of a 738-meter-wide main-belt asteroid called (152830) Dinkinesh.

Dinkinesh and Selam

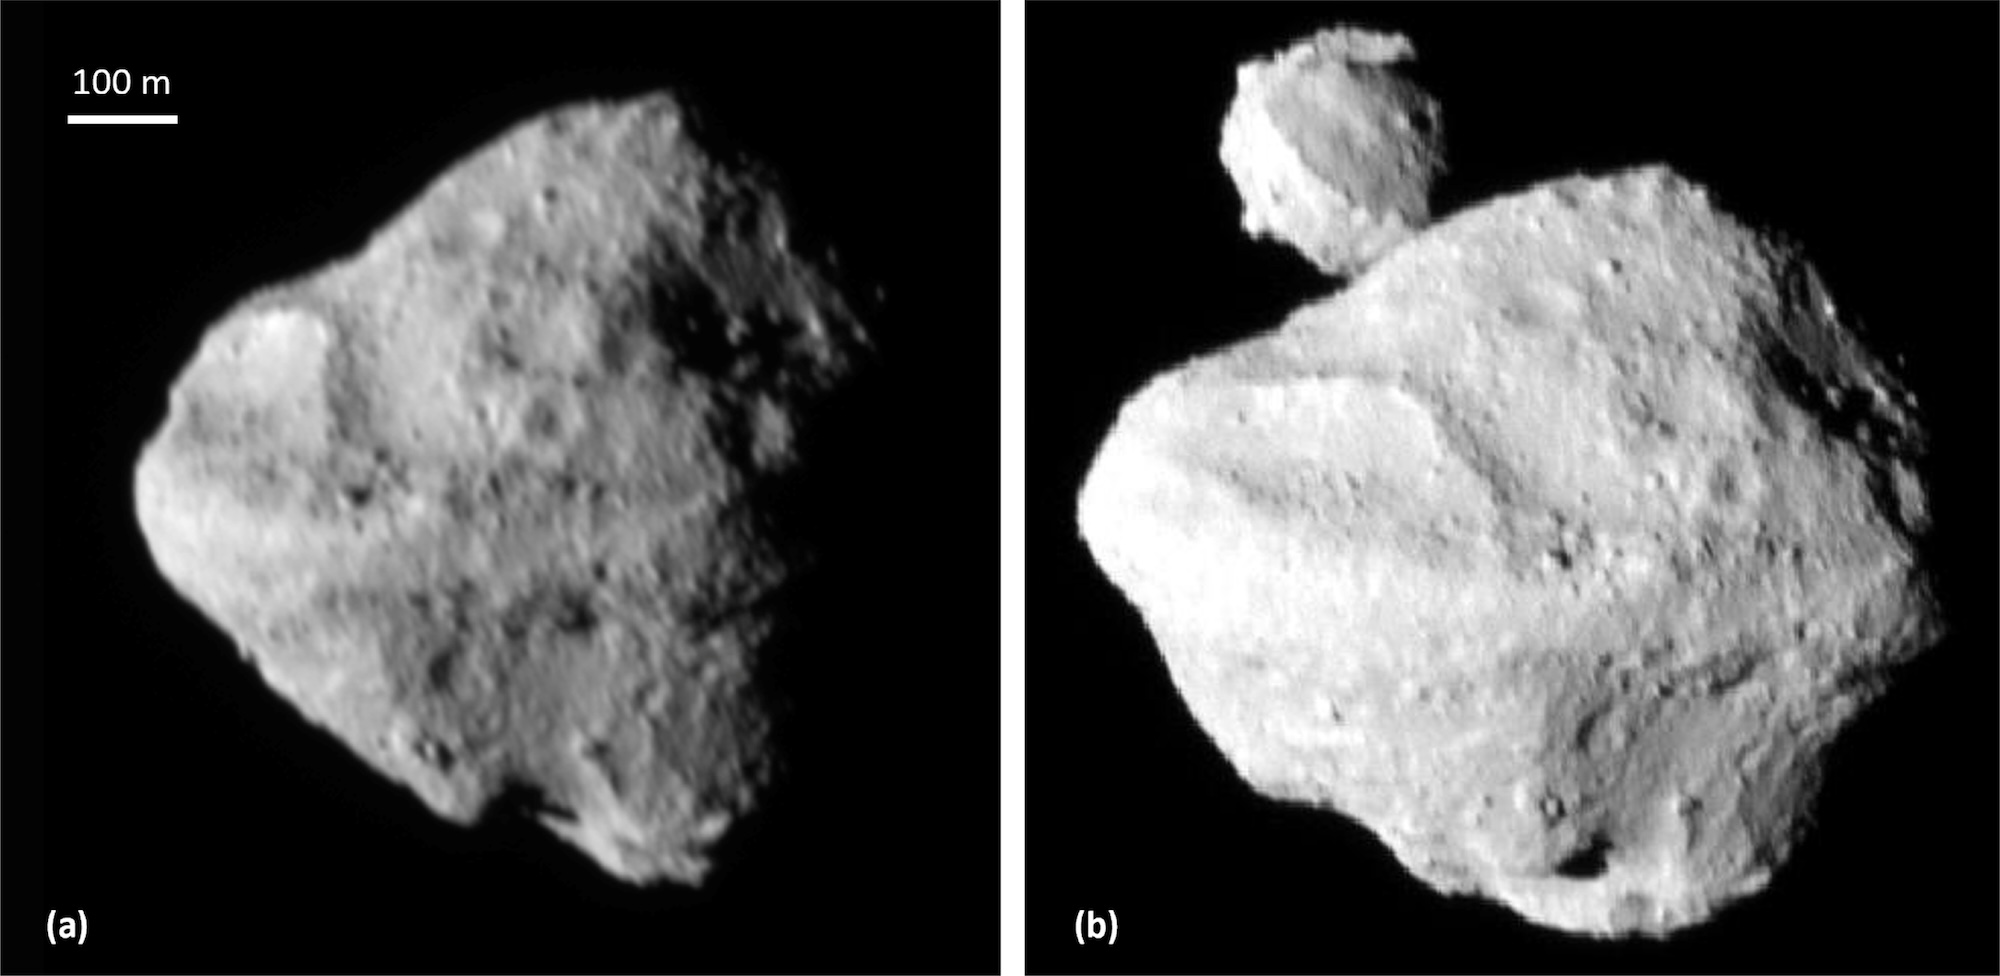
Two images of Dinkinesh from the Lucy mission. The second image features its satellite, Selam. [Bierhaus et al. 2025]

During this flyby, Lucy flew within 430 km (267 mi) of the asteroid and made a surprise discovery: Dinkinesh has a tiny companion, which has been named Selam. (The name Dinkinesh comes from the Amharic name for the Lucy fossil discovered in 1974; Selam is similarly named after a hominid fossil that is sometimes called “Lucy’s baby.”) Remarkably, Selam is the first known asteroid satellite that is a contact binary, made up of two separate bodies that have gently merged into one.

Craters and Boulders

In a recent research article, Edward Bierhaus (Lockheed Martin Space) and collaborators analyzed Lucy flyby images to study the surfaces of Dinkinesh and Selam. The team analyzed global features like troughs and ridges and measured visible craters and boulders.

craters on Dinkinesh and Selam

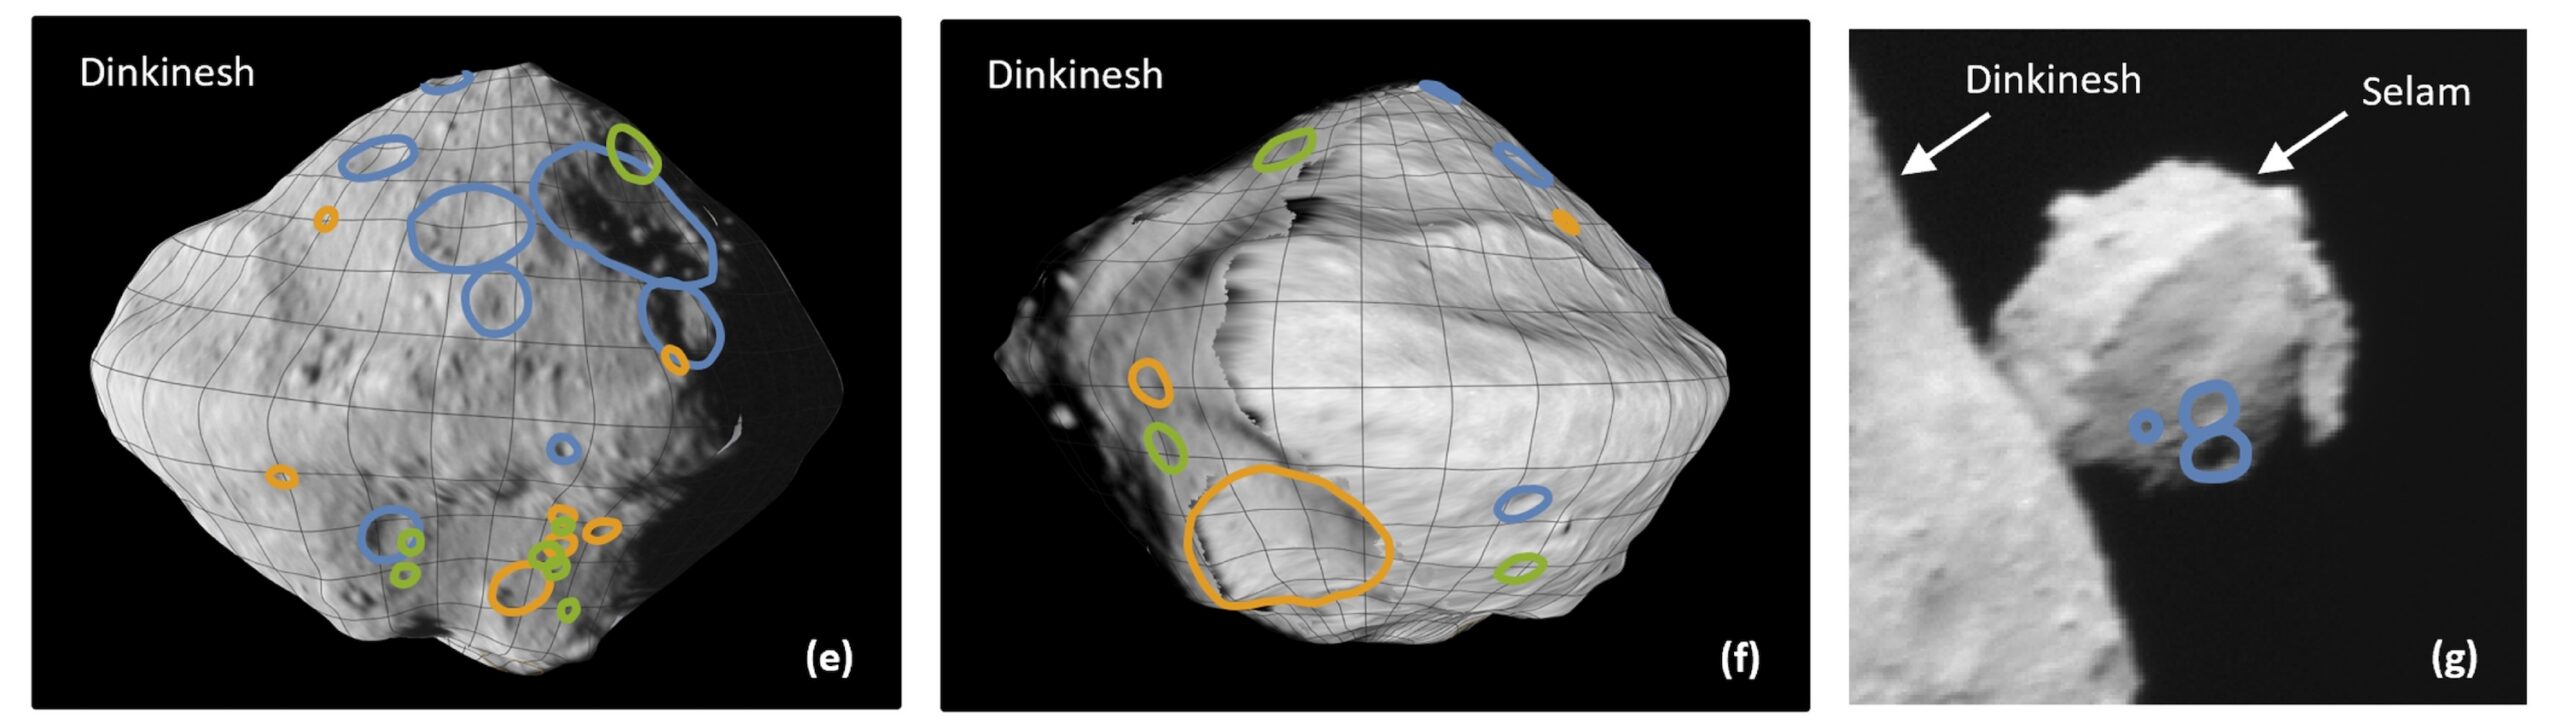
Locations of craters on Dinkinesh and Selam. The blue lines indicate the most confidently identified craters; orange and green lines mark craters identified less confidently. Click to enlarge. [Bierhaus et al. 2025]

While the small numbers of craters detected — 29 for Dinkinesh and 3 for Selam — makes further analysis difficult, the team determined that Dinkinesh’s crater size–frequency distribution is shallower than expected, though similar to that of small near-Earth asteroids (e.g., Ryugu). The seemingly shallow distribution may be an effect of the phase angle and resolution of the observations, or it could be a sign of impact armoring or other surface processes.

The size–frequency distribution of Dinkinesh’s boulders, on the other hand, is somewhat steeper. This discovery may mean that S-type (stony) asteroids like Dinkinesh have different boulder size distributions than C-type (carbonaceous) asteroids.

Possible Histories

An analysis of the collisional timescales in the main asteroid belt suggests that Dinkinesh is a fragment of a larger asteroid that was split apart at least once, though it’s not yet possible to say which parent body it might have come from. After splitting off from its parent asteroid, Dinkinesh appears to have been subjected to the Yarkovsky–O’Keefe–Radzievskii–Paddack (YORP) effect. This effect arises when sunlight falls on a small asymmetric asteroid, creating a torque that can alter its spin rate. In extreme cases, the YORP effect can crank up an asteroid’s spin rate so much that it sheds some of its surface material or flies apart altogether.

Sumak Fossa and Fab Dorsum on Dinkinesh

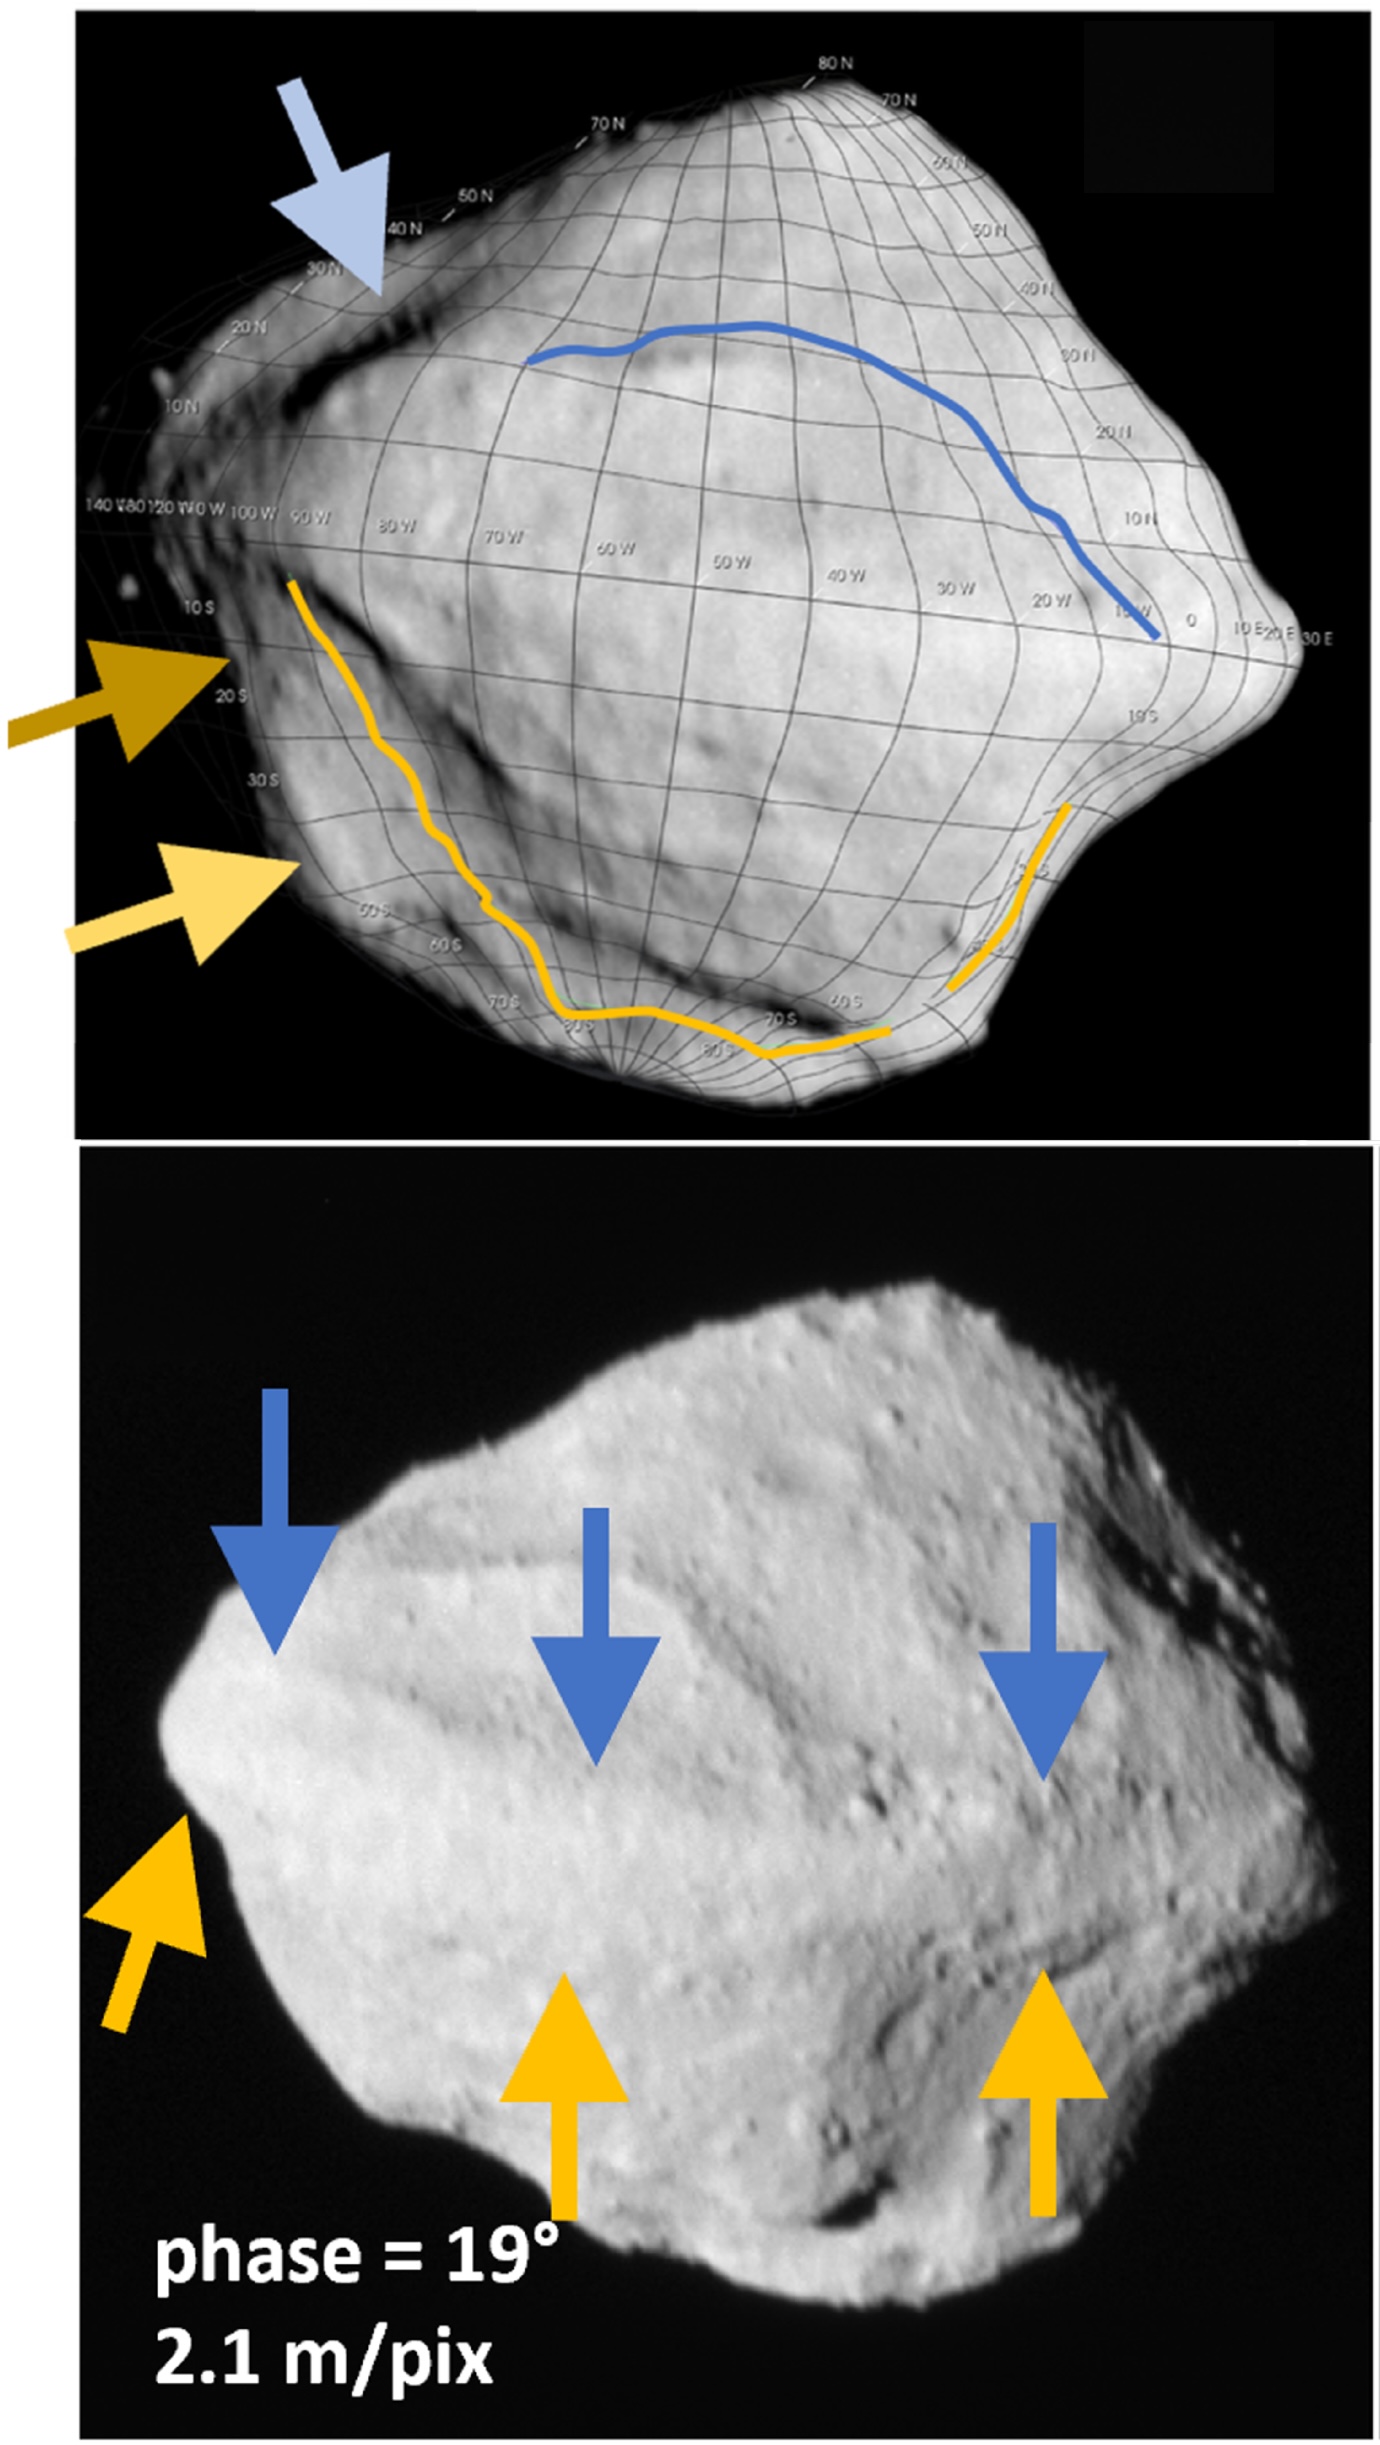
Locations of Sumak Fossa (top) and Fab Dorsum (bottom) indicated with arrows. [Adapted from Bierhaus et al. 2025]

Dinkinesh seems to show clear signs of YORP-driven structural failure. Sumak Fossa (a large trough) and Fab Dorsum (a ridge running along the asteroid’s equator) may have formed through this process. If Sumak Fossa was excavated by a YORP-induced mass-shedding event, both Fab Dorsum and Selam could have formed out of the cast-off material.

With Lucy en route to its primary objective, there’s still much for us to learn from this mission about the small bodies of our solar system. In the meantime, be sure to check out the full article linked below, as there are far more details about Dinkinesh and Selam than could be included in this short summary!

Citation

“The Geology of a Small Main-Belt S-Class Binary Asteroid System: Dinkinesh and Its Contact Binary Satellite Selam as Observed by the Lucy Mission,” E. B. Bierhaus et al 2025 Planet. Sci. J. 6 299. doi:10.3847/PSJ/ae1968

The post Details on Dinkinesh and Its Surprise Satellite from the Lucy Mission appeared first on AAS Nova.

  •  

Pulling Back the Curtain on DART Ejecta

In September 2022, the Double Asteroid Redirection Test (DART) mission served as the first attempt at redirecting a near-Earth asteroid — an experiment testing humanity’s ability to fend off any threatening Earth-bound asteroids. A recent study presents the first 3D reconstruction of the impact ejecta, suggesting that the blown-out material is more complex than previous models considered.

DART-ing into Dimorphos 

The DART spacecraft intentionally smashed into Dimorphos, the small and unassuming moon of the larger asteroid Didymos. This space-based crash test aimed to determine if kinetic impactors like DART could successfully change an asteroid’s course through the solar system. Dimorphos’s orbit was indeed shortened by roughly 30 minutes, confirming that ramming an asteroid with a spacecraft could be a viable method of planetary defense. However, determining exactly how much an asteroid’s path will be altered is not necessarily straightforward. When a spacecraft collides with an asteroid, the impactor imparts momentum to the target, and any material excavated from the impact site can also alter the asteroid’s course.

DART’s impact launched a significant spray of rubble, or what researchers call an ejecta curtain. The ejecta curtain is typically modeled as a cone, using a simple geometry to determine its contribution to momentum transfer. However, when looking closely at imaging taken soon after the collision, the real physical structure of the ejecta appears to be more complex. Untangling the true 3D distribution of the ejecta is necessary to understand how momentum was actually distributed among escaping ejecta, better estimate the total mass ejected from Dimorphos, and improve modeling of the Didymos system’s orbit after impact.

DART ejecta

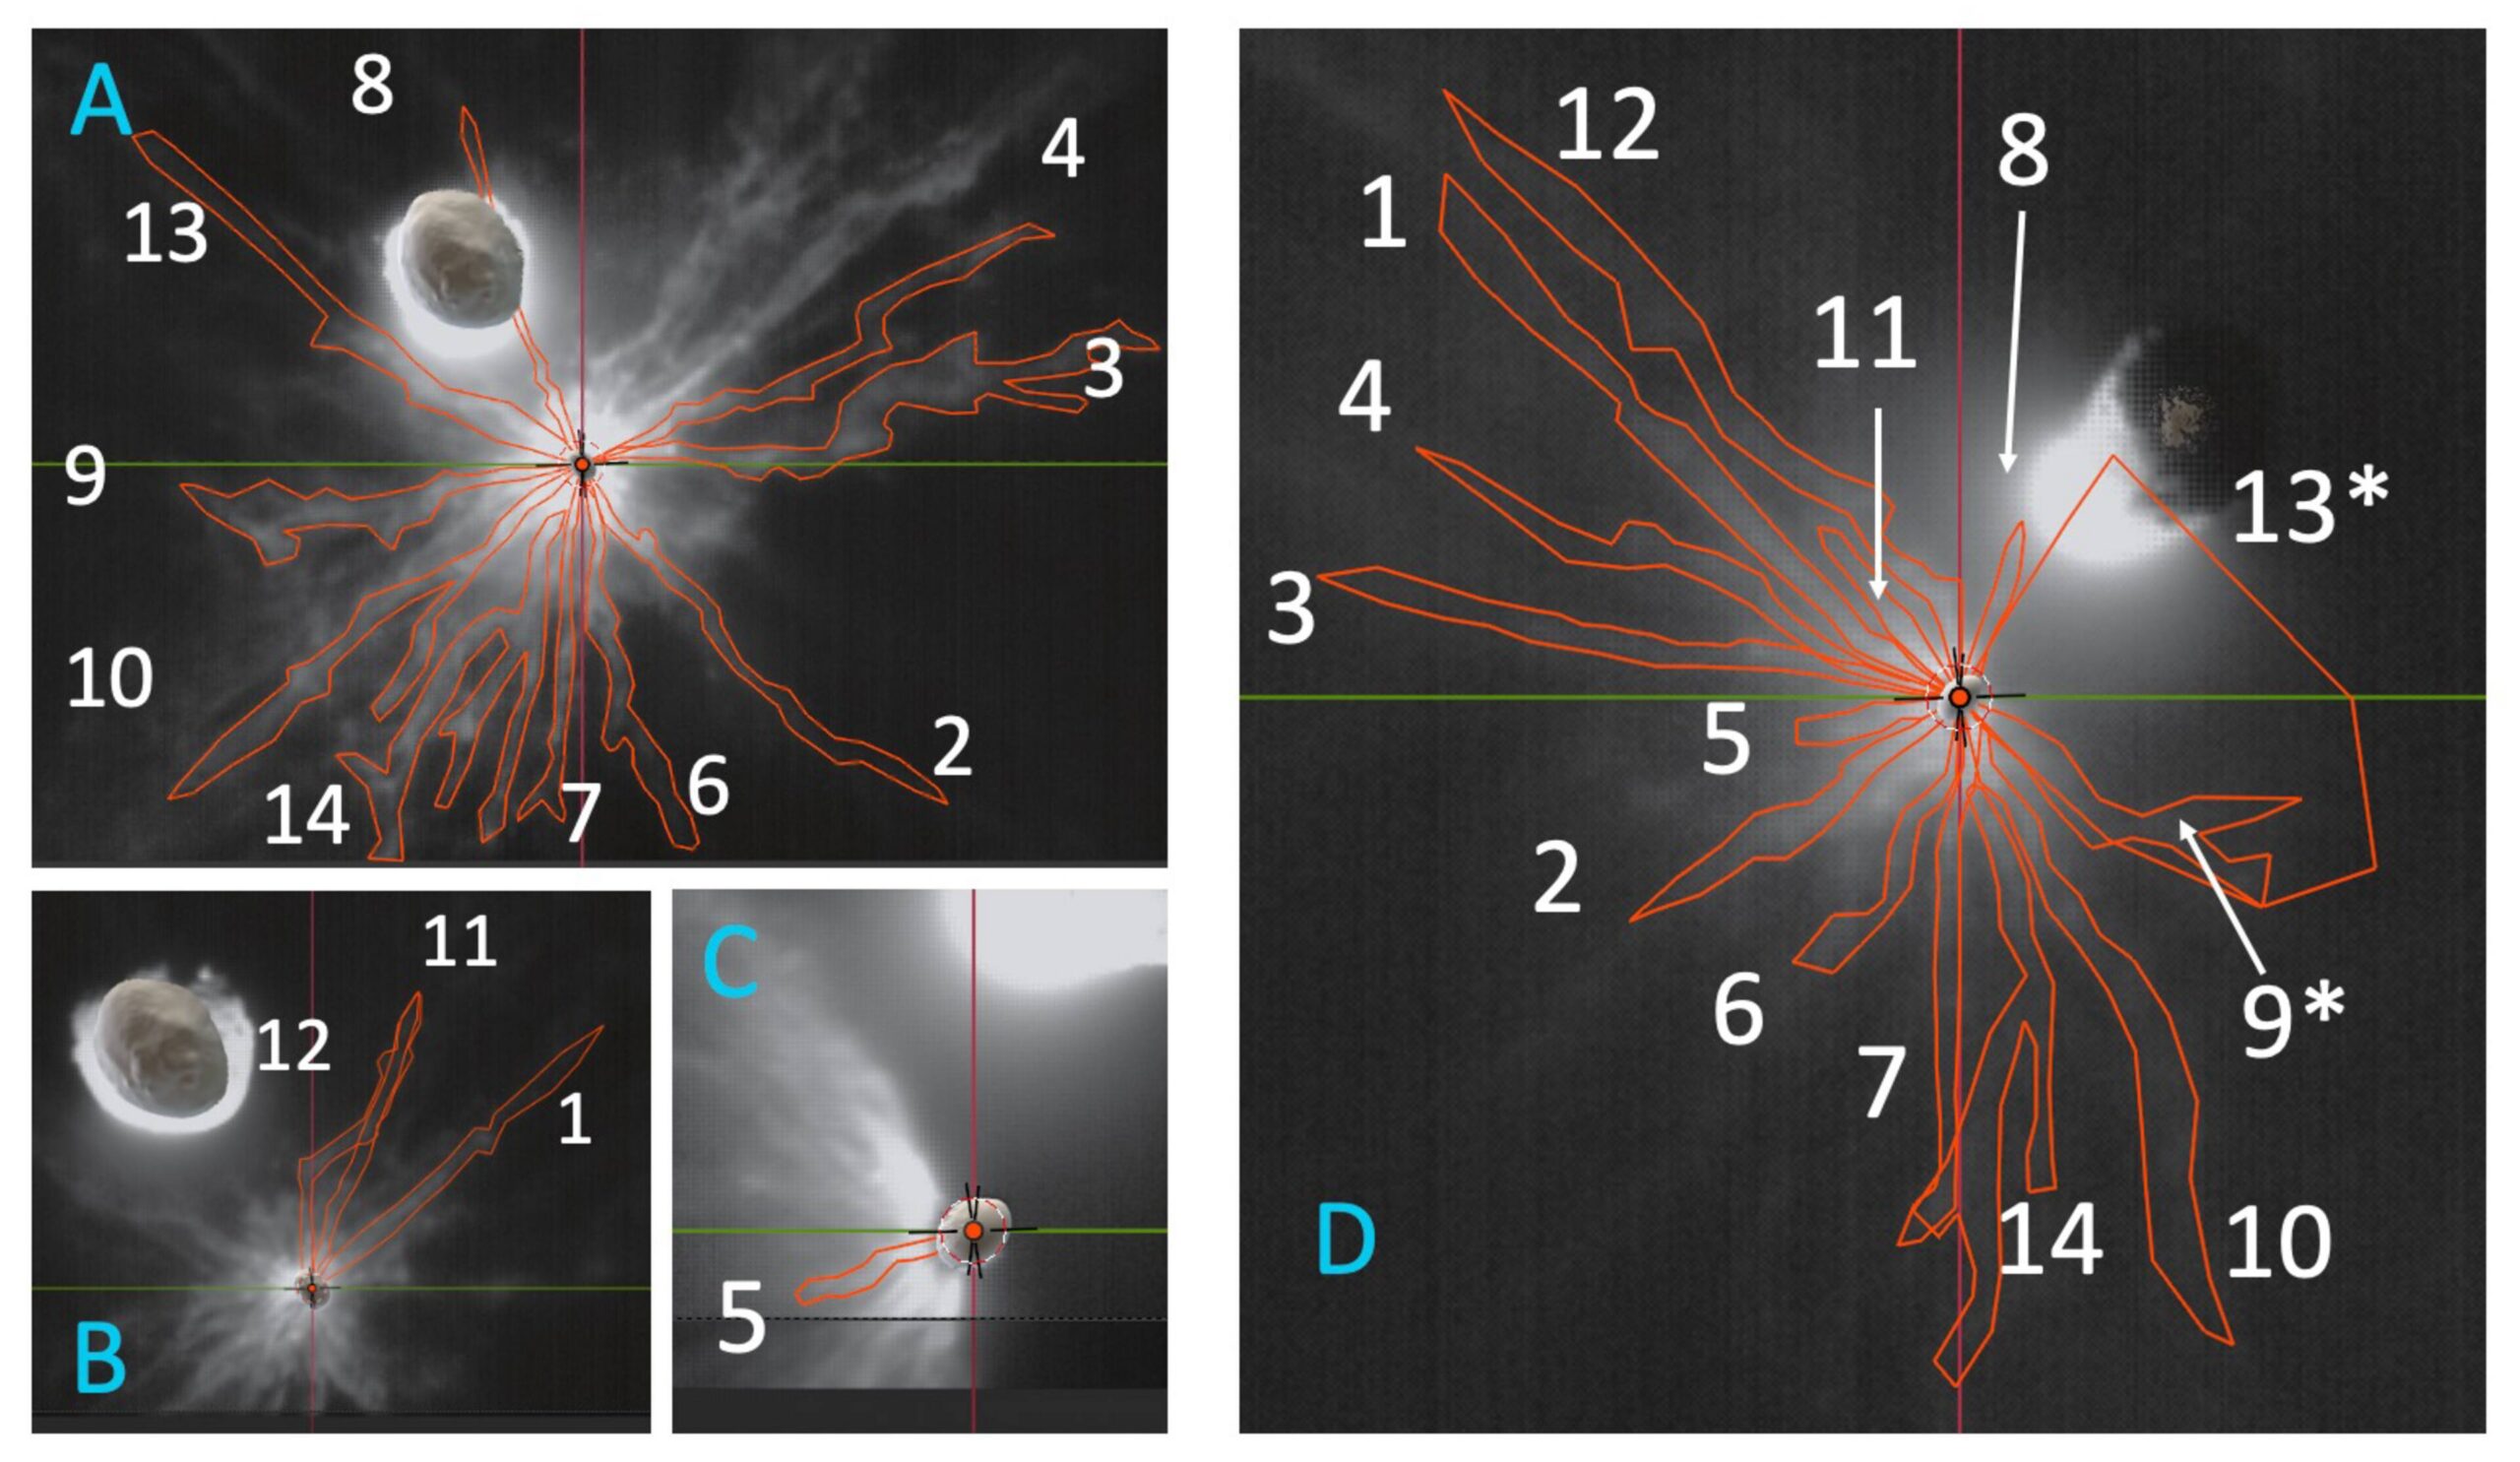
LICIACube images of the DART ejecta curtain with the 14 distinct features identified in this study outlined in red. Click to enlarge. [Deshapriya et al 2026]

Determining Debris Distribution

Seeking to better characterize the ejecta curtain, a team led by J. D. P. Deshapriya from Italy’s National Institute for Astrophysics used data from the Light Italian CubeSat for Imaging of Asteroids (LICIACube) that flew behind the DART spacecraft to capture images of the system shortly after the impact. After careful image handling to bring out diffuse and faint material, the researchers identified 14 distinct ejecta features across the flyby imaging. LICIACube viewed the aftermath both side on and face on, providing valuable 3D information about the distribution and motion of the ejecta. 

DART ejecta animation

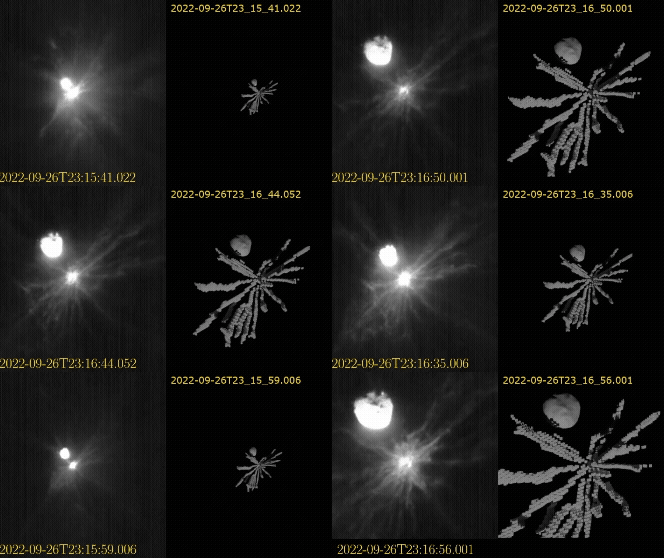
Animation of the DART ejecta as the LICIACube spacecraft approached the impact. The left shows the images taken by the spacecraft, and the right shows the 3D model produced for the ejecta. Click to play animation. [Deshapriya et al 2026]

Using 3D modeling software, the researchers traced each of the 14 distinct features across the images and reconstructed a 3D representation of the ejecta morphology. While earlier models assumed symmetric cone-like geometries, this 3D modeling revealed clear asymmetric and non-uniform structures within the ejecta curtain. These variations point to underlying heterogeneities in the impact site on Dimorphos — surface and subsurface composition naturally link to the resulting ejecta distribution according to previous laboratory experiments. The spatial and directional features uncovered in this study highlight the limitations of models that attempt to characterize ejecta curtains with symmetric and uniform distributions. Refining these model parameters will better match observations and better predict momentum transfer in future missions. 

Planetary Defense

What does this mean for planetary defense? While simplified symmetric cone models provide helpful approximations for kinetic impactor missions, they do not fully capture the true complexity of the impact. This study shows that local variations in an asteroid’s surface and interior properties can directly influence the resulting ejecta distribution and motion. The true momentum imparted to the target asteroid depends heavily on the specific ejecta material, and these details inform how effective planetary defense missions can be in redirecting asteroids. Incorporating realistic, observation-driven ejecta distributions into modeling frameworks is essential to achieve reliable predictions for future planetary defense missions.

Citation

“3D Reconstruction of DART Ejecta at Dimorphos Reveals an Anisotropic, Filamentary Structure,” J. D. P Deshapriya et al 2026 Planet. Sci. J. 7 4. doi:10.3847/PSJ/ae2c64

The post Pulling Back the Curtain on DART Ejecta appeared first on AAS Nova.

  •  

Are Water Worlds Just Made of Soot?

illustration of K2-18b

Editor’s Note: Astrobites is a graduate-student-run organization that digests astrophysical literature for undergraduate students. As part of the partnership between the AAS and astrobites, we occasionally repost astrobites content here at AAS Nova. We hope you enjoy this post from astrobites; the original can be viewed at astrobites.org.

Title: Soot Planets Instead of Water Worlds
Authors: Jie Li et al.
First Author’s Institution: University of Michigan
Status: Published in ApJL

They Might Be Planets with a Lot of Water…

Since the discovery of PSR B1257+12 c and d in 1992 and  51 Pegasi b in 1995, we have found evidence for thousands of planets in other star systems. One of the most striking things (aside from how common planets seem to be) is how many of them are so unlike anything we had imagined we would find. Our growing list of exoplanets includes a truly remarkable variety of types, from cold rocky planets smaller than Earth to scorching hot giants bigger than Jupiter.

However, one category of planets is particularly interesting: the sub-Neptunes. These planets, smaller than Neptune but larger than Earth, are characterized by their low densities, which suggests they could be dominated by water or volatile-rich atmospheres. What makes sub-Neptunes so intriguing is that we don’t have a clear counterpart for them in our own solar system. As such, we don’t really know a lot about them other than there seem to be a lot of them out there.

Although these planets are sometimes theorised to be rocky worlds with large hydrogen–helium envelopes, they have alternatively been considered as water worlds, i.e., worlds with giant planet-wide oceans thousands of kilometres deep. The thinking goes that since water ice appears to be abundant beyond the snow line, water worlds would be a natural consequence of planet formation. And if these planets exist, some might host a temperate liquid ocean with the conditions for life.

…or They May Just Be CHON(ky)

However, today’s article suggests that these supposed water worlds may not be as wet as we think they are. They may instead be rich in what are called refractory carbonaceous materials. This term describes solids rich in carbon, hydrogen, oxygen, and nitrogen, or CHON. It is a bit of a mouthful and is often just referred to as “soot,” but it is important to remember that it is different from the black stuff you would find in ye old chimney. Soot, in this case, is a major component of comets. We know that this type of material is present around planet formation, as protoplanetary dust contains not just silicates (rock) and water ice but also a significant amount of CHON, and comets are leftovers from this dust.

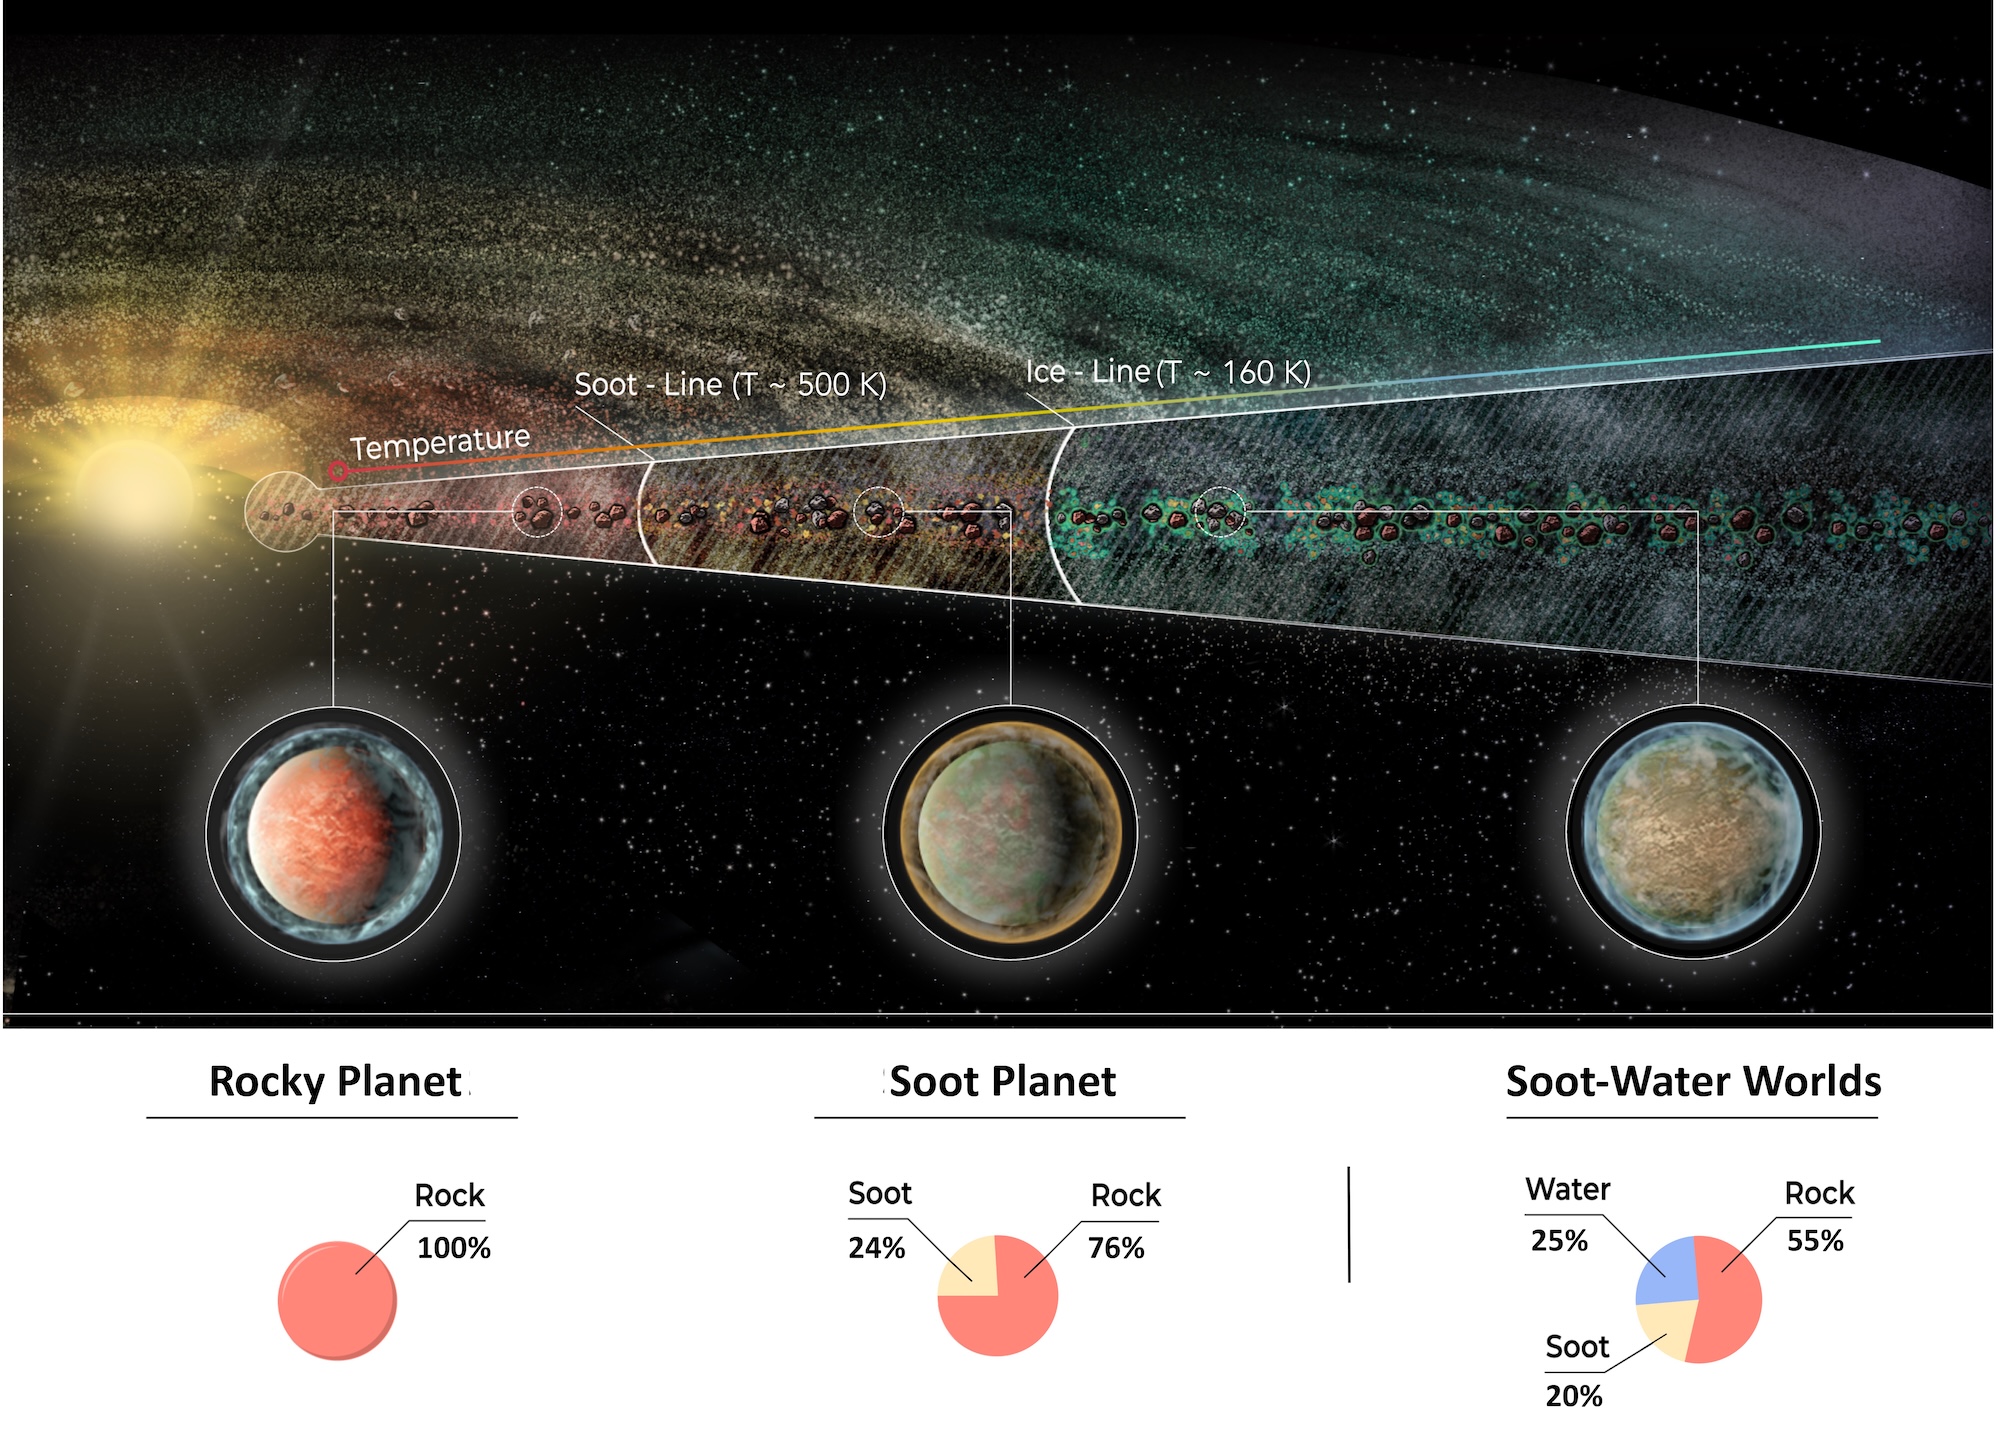
Soot is stable and remains in the solid state to much greater temperatures (∼500K) than water ice (∼160K), so the authors argue that there should be regions in the protoplanetary disk where planets accrete both rock and soot but little water. They define a “soot line” akin to the snow line and look at three archetypical planets that may form, shown in Figure 1.

illustration of rocky planets, soot planets, and soot-water planets based on their formation location

Figure 1: Illustration of a protoplanetary disk and three chemically distinct planet types that may form as the distance from the host star increases. Close in, the temperature in the disk is too high for volatiles to exist in the solid state, but farther out, the temperature drops to allow for water to freeze into ice beyond the water ice line, also known as the snow line. Between the two regions lies another where it’s cool enough for carbonaceous materials or “soot” to avoid destruction via thermally driven reactions. Depending on where planets form, they may contain a varying amount of astrophysical soot. [Li et al. 2026]

Inside the soot line, planets would be rock-rich worlds with low carbon or water content (e.g., terrestrial planets) because it is just too hot for any soot to stay together. Beyond the soot line but before the snow line, you would find carbon-rich rocky worlds (soot planets). They have low water content, as it is still too hot for water ice to exist, but these planets are rich in CHON. Beyond the snow line, a combination of rock/carbon/water worlds becomes possible, here labelled as soot-water worlds. The authors note that even though the last one has a significant fraction of water, it is distinct from traditional “water worlds” because it includes a significant component of hydrocarbon-rich material. Again, it is also important to remember that a soot world wouldn’t mean a black powder ball hanging in space, but rather a world that is composed of a lot of CHON, like Saturn’s moon Titan.

What Do the Models Say?

The authors got down to modelling planet compositions based on both observations of protoplanetary disks and the distribution of solid materials found in comets.

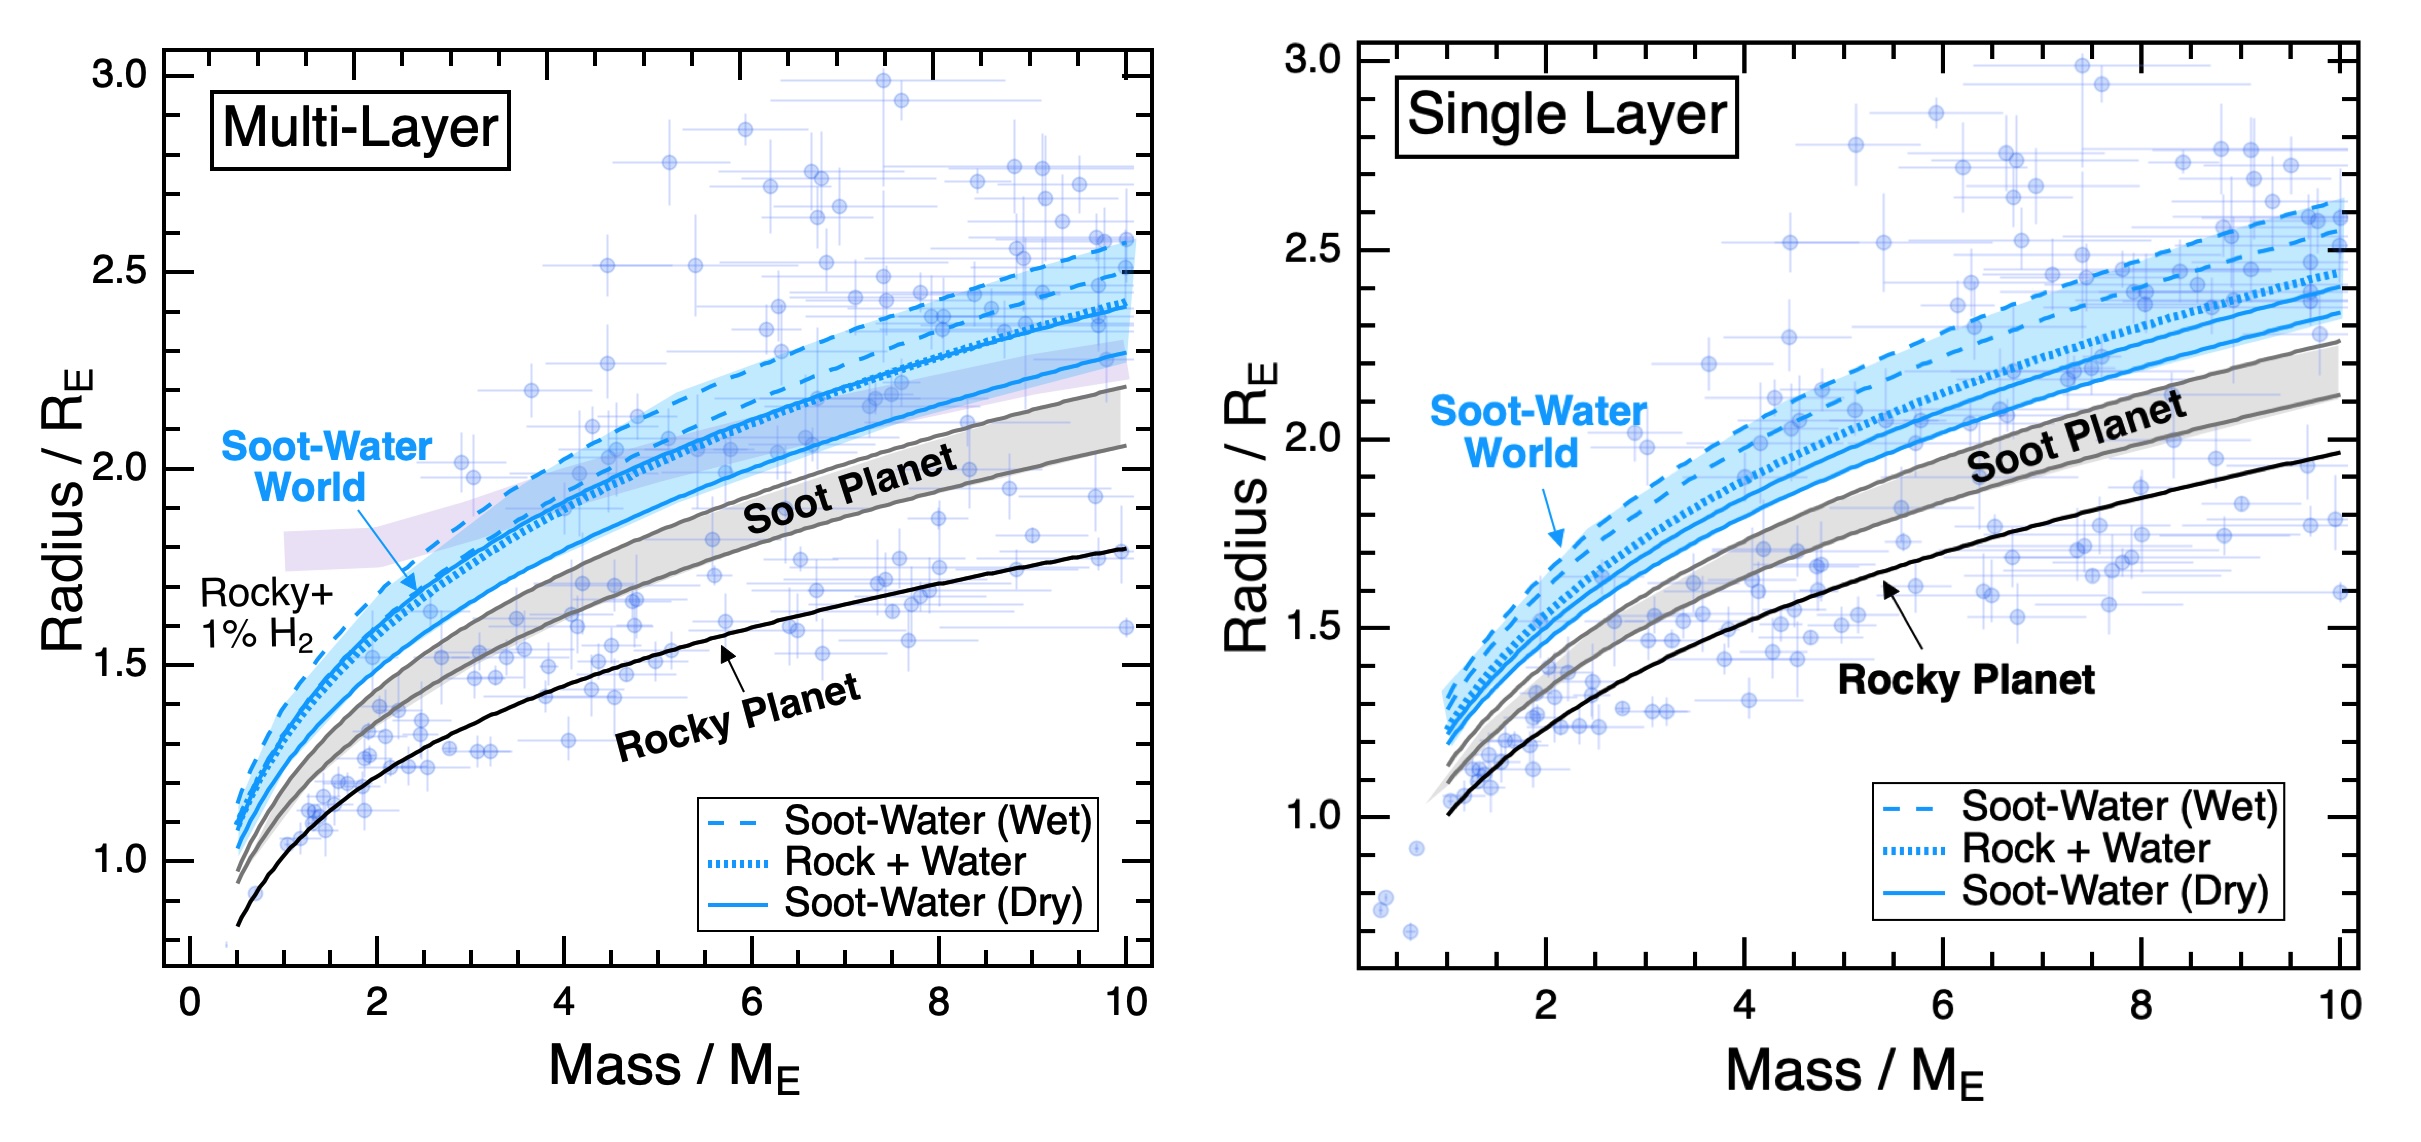
They considered two model planets. One is fully stratified, i.e., with a metallic core enclosed in a silicate mantle overlain by a hydrocarbon-rich layer and then a water-ice surface layer. The other, a single-layer mixed planet, is a hypothesised scenario where iron, silicate, soot, and water are fully mixed throughout the planet as a result of exotic chemistry from the high temperature inside the sub-Neptune planet. They expect any potential real planets to lie somewhere between the two extremes. The mass–radius relations for these models can be seen in Figure 2, where they are also compared to a number of known exoplanets, of which several fall within the models’ parameter spaces.

Mass–radius relations for model Earth-like rocky planets

Figure 2: Mass–radius relations for model Earth-like rocky planets (black curves), soot planets (gray bands), and soot-water worlds (blue bands). On the left are multi-layer planets, while on the right are single-layer planets. Overlaid are a number of exoplanets along with their respective uncertainties. Also shown as dashed lines are models for Earth-like planets with 50% rock and 50% water. These fall squarely within the same region as soot-water worlds, making the two indistinguishable from each other. [Li et al. 2026

A particularly interesting result that the authors note is that the predicted mass–radius relationship for the water worlds, which incorporates soot, is similar to that predicted previously for a 50% water planet with no carbon. That is, if you base your interpretation on the mass–radius relationship alone, it is impossible to distinguish between a world made of rock and water and a water-rich planet that incorporates a significant amount of soot.

We Might Have a Telescope That Can Help

How might we break through this impasse? Well, because significant fractions of methane and other simple hydrocarbons are expected to be released from the interior, the soot-rich planets may feature methane-rich atmospheres. These may naturally lead to the formation of hydrocarbon hazes, akin to the tholins in Titan’s atmosphere.

Looking at the atmospheres of exoplanets is one of the main mission goals of JWST. Many of the spectra from sub-Neptunes have so far been featureless, which may indicate the presence of clouds or photochemical haze. The telescope also has the ability to detect carbon-bearing species in the atmospheres of other sub-Neptunes, like with the discovery of CO2 and CH4 in the atmospheres of K2-18b and TOI-270d. Although these planets currently orbit interior to the soot lines of their respective stars, they may have originally formed farther out and later migrated inward during their evolution. Of particular interest is TOI-270d. Aside from also showing signs of water, it has a carbon-to-oxygen ratio that is moderately high for the planet, hinting that it could be a world with a considerable amount of soot.

The presence of soot may have significant implications when it comes to habitability. The planet’s core may be rich in diamond, which would impede the movement of volatiles in the mantle. This would make it challenging for the planet to generate a magnetic field and thus leaving any potential life vulnerable to cosmic radiation. However, they could also be abundant in methane and other volatile organic compounds, substances thought to be crucial for the development of prebiotic chemistry. Regardless, it is interesting that there might be something out there that is not so unlike something we know from our own solar system, a hazy supersized Titan. While the frigid moon is unlikely to show signs of life, a temperate soot-water world might be one place to look in the future.

Original astrobite edited by Sowkhya Shanbhog.

About the author, Kasper Zoellner:

I have a Master of Science in astronomy and I am currently working towards a PhD in physics and educational science. My greatest passion is the search for exoplanets and how stellar variability may influence the possibility of life. I am also interested in science outreach, education and discussing what sci-fi novel to read next!

The post Are Water Worlds Just Made of Soot? appeared first on AAS Nova.

  •  

A Close Look at an Ancient Moon

A photograph of a heavily cratered moon on a black background.

By piecing together observations from dozens of radio telescopes in Chile, planetary scientists recently completed the first-ever map of Callisto’s emission at millimeter wavelengths.

Old and Cold

In striking contrast to Io’s frenzied volcanism and Europa’s cracking ice shell, Jupiter’s moon Callisto is much quieter and colder than its Galilean siblings. Though a liquid water ocean hypothetically sloshes beneath its frigid surface, it’d be hard to infer that just by looking at the moon. Callisto’s terrain is ancient, static, and bears the scars of the millennia of exposure to space. There are no volcanoes, plate tectonics, or any other features to disturb what researchers call “evolved ruins” of the numerous craters. These have names like Valhalla, Asgard, and Lofn, since Callisto’s geologic features are named after settings and characters in Norse mythology to further reinforce their freezing existence.

This never-reset canvas makes Callisto an ideal laboratory for studying the long-term effects of asteroid impacts, dust accumulation from nearby natural satellites, and other processes that modify a planetary surface over time. One way to infer the composition and structure of the first few meters of material is to observe the way the temperature changes over the course of a day. For example, ice and rock respond differently to temperature changes; similarly, small-grains of either material warm up and cool down at different speeds than their larger-grain counterparts.

An image of a purple-orange blob against a black background.

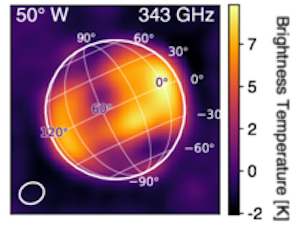
The residuals from one of ALMA’s observations of Callisto. [Adapted from Camarca et al. 2025]

In theory, planetary scientists can measure the temperature of a moon by noting how bright each patch of its surface appears in millimeter-wavelength observations. However, this is easier said than done, as only a handful of telescopes are capable of seeing Callisto as anything more than a fuzzy blob at those wavelengths. Back in 2016–2017, planetary scientists used the Atacama Large Millimeter/submillimeter Array (ALMA), a radio interferometer in Chile, to attempt the challenging feat of making a map of Callisto’s surface.

Mapping from Afar

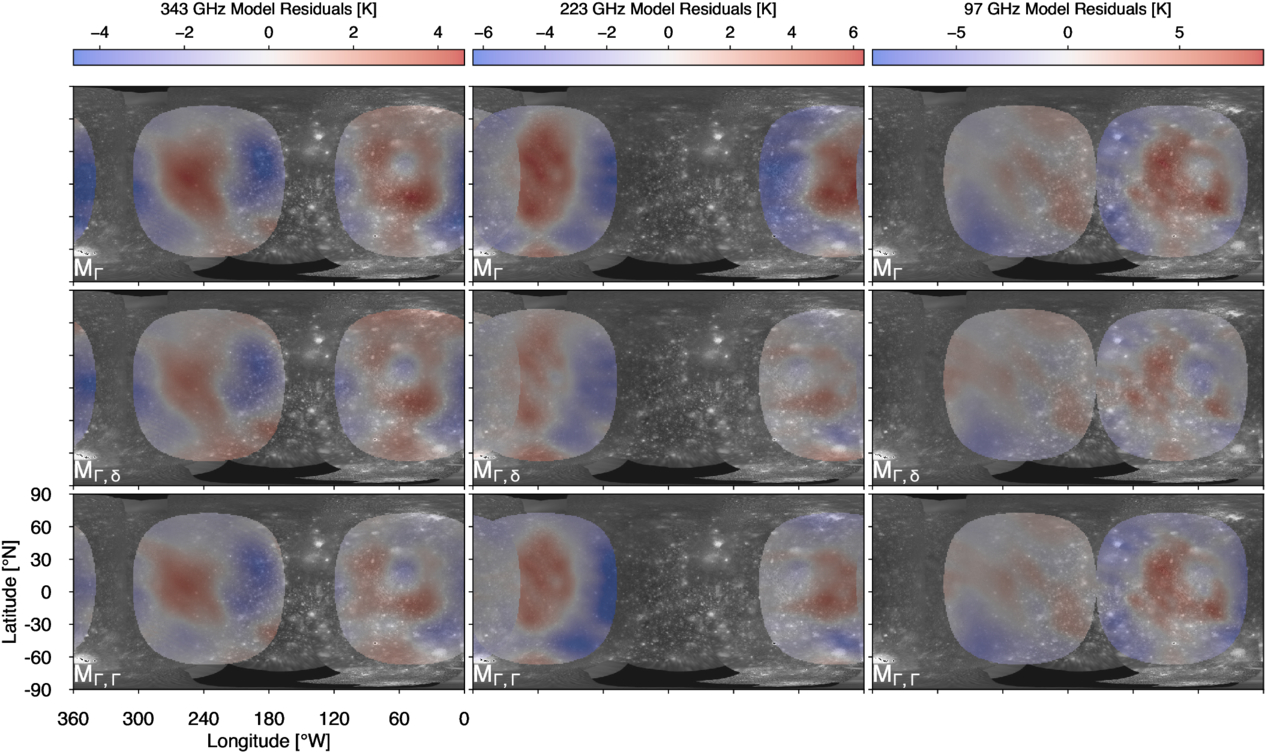
A team led by Maria Camarca, California Institute of Technology, just finished churning through all of the data and assembling their map of Callisto’s temperature residuals. Though the final spatial resolution was at best a few hundred kilometers, meaning a comparable map of Earth would blur all of New England together, this represents the most detailed thermal map of Callisto yet. The map was detailed enough to easily spot the largest craters, and several impact craters including Valhalla stood out as being 3–5K colder than all of the surrounding terrain. The team spotted another anomalously cold region that coincides with the location of maximum carbon dioxide gas density recently seen with JWST.

A multi-panel figure of a black and white surface beneath transparent red and blue blobs.

A map of Callisto’s thermal emission (red/blue) overlaid atop visible images of the surface collected by spacecraft. Click to enlarge. [Camarca et al. 2025]

The team also found that their data could not be explained by a simple model for Callisto’s surface that assumed one dominant material and structure. Instead, their images were better explained by more complex simulations that use two different thermal inertias. Though they are not sure yet why this may be, it is clear that Callisto, often overlooked compared to its flashier siblings, is a complex world worthy of further study. Luckily, the upcoming Jupiter Icy Moons Explorer mission and ALMA’s Wideband Sensitivity Upgrade will bring new knowledge of Callisto’s ancient surface.

Citation

“A Multifrequency Global View of Callisto’s Thermal Properties from ALMA,” Maria Camarca et al 2025 Planet. Sci. J. 6 183. doi:10.3847/PSJ/ade7ee

The post A Close Look at an Ancient Moon appeared first on AAS Nova.
  •  

Sun Glitter and Sunglint on Titan’s Hydrocarbon Seas

Titan sunglint

Earthlike yet alien, Titan is the only solar system body other than Earth known to host persistent liquid on its surface. The glint of sunlight on this surface liquid provides a means to study the complex interplay between Titan’s seas, shorelines, and atmosphere.

When the Sun Hits the Sea as Seen by Cassini, That’s a Mare

specular reflection on Titan

The first image of specular reflection of sunlight off Titan’s hydrocarbon seas, taken on 8 July 2009 by Cassini. [NASA/JPL/University of Arizona/DLR]

In 2009, the Saturn-orbiting Cassini spacecraft spotted the glare of sunlight reflecting off a sea of liquid on the surface of Titan, Saturn’s largest moon. This observation of specular (i.e., “mirror-like”) reflection, or sunglint, confirmed the presence of liquid on Titan’s surface — what researchers now know to be oily lakes and seas of liquid hydrocarbons like methane and ethane.

A recent research article from Michael Heslar and Jason Barnes (University of Idaho) yields new insight into the behavior of Titan’s seas and coastal regions in Punga Mare. Punga Mare, located nearly at the north pole, is the smallest of Titan’s named seas and holds the distinction of being the first place where extraterrestrial waves were definitively identified.

Summering at Punga Mare

In the Cassini observation selected for this study, it’s summertime in the northern hemisphere, with balmy temperatures hovering just above 90K (−298℉/−183℃). Cassini viewed Punga Mare from an altitude of roughly 6,000 kilometers and at an oblique angle of 126 degrees. From this angle, Titan’s landmasses appear dark and the sea appears bright.

diagram of the geometry of specular reflection and sun glitter

The geometry of specular reflection (sunglint) and sun glitter. The incidence and emission angles, i and e, are equal. Click to enlarge. [Heslar et al. 2020]

Several anomalously bright features, collectively called specular features, appear in and near Punga Mare. These features are examples of sunglint and sun glitter. Sunglint occurs when sunlight reflects off a smooth surface as light reflects off a mirror, with the angle of the incoming sunlight equal to the observer’s viewing angle. Sun glitter is a related phenomenon that occurs outside the sunglint zone, where localized changes in the angle of the surface — from waves, for example — reflect sunlight toward the observer.

Coasts, Islands, and Inlets

Punga Mare sunglint and sun glitter

Cassini Visual and Infrared Mapping Spectrometer observation of Punga Mare at wavelengths of 5.0 (red), 2.8 (green), and 2.0 (blue) μm. Click to enlarge. [Adapted from Heslar & Barnes 2025]

Heslar and Barnes identified specular features along the coastline, bordering a chain of islands, out at sea, and in coastal inlets.

The bright areas along the coast appear to overlap both the sea surface and the land surface. While it’s not yet clear exactly what causes this brilliant coastal outline, Heslar and Barnes speculated that it may be evidence for waves along the coastline; rough seas may also be the cause of the sun glitter illuminating the Hawaiki island chain and out at sea.

The specular features associated with inlets may mark where rivers flow into or out of Punga Mare. Rather than wave activity, these bright areas might mark where nitrogen has bubbled up to the surface.

Altogether, this study demonstrated the variety and depth of information that can be gleaned from a single sunglint observation — and the authors closed by noting how effective an orbiter would be for studying ocean behavior on Titan. NASA’s upcoming Dragonfly mission may also be able to capture sunglint as the spacecraft leapfrogs across Titan’s surface.

Citation

“Sea Surface and Hydrological Activity Observed in Titan’s Punga Mare,” Michael F. Heslar and Jason W. Barnes 2025 Planet. Sci. J. 6 74. doi:10.3847/PSJ/adbc9e

The post Sun Glitter and Sunglint on Titan’s Hydrocarbon Seas appeared first on AAS Nova.
  •  
❌