 Login

AI helps turn citizen photos into water-level data
For the past 15 years, Christopher Lowry, PhD, has led CrowdHydrology, a University at Buffalo citizen-science project that


Many observations of solar flares suffer from saturation and blooming, causing crucial information to be lost. Researchers recently validated a technique for retrieving information from saturated flare images, unlocking a treasure trove of powerful solar flares for examination.
Since 2010, the Atmospheric Imaging Assembly (AIA) on the Solar Dynamics Observatory (SDO) has been capturing nearly continuous extreme-ultraviolet images of the Sun’s disk, revealing our star’s dramatic high-energy behavior. Though SDO/AIA’s observations have transformed our understanding of the Sun’s activity, they have limitations: powerful solar flares can saturate the detector, spilling charge into nearby pixels.
This saturation and overflow compromises our ability to study the most energetic solar flares — but the “lost” information may actually be recoverable. When light from an intense flare enters SDO’s instruments, not all of it pools in the saturated region of the detector: some of the light is diffracted by the optics, and by mathematically inverting this pattern of diffracted light, researchers can attempt to extract the encoded information about the saturated region. Researchers have used this technique for more than a decade, but options for validating the results were limited until now.
Launched almost 10 years to the day after SDO, the Solar Orbiter spacecraft provides an excellent opportunity to test inversion techniques for recovering information from saturated solar images. Solar Orbiter’s Extreme Ultraviolet Imager snaps brief photos of the Sun at a rapid cadence, and its images remain unsaturated even when faced with energetic solar flares.
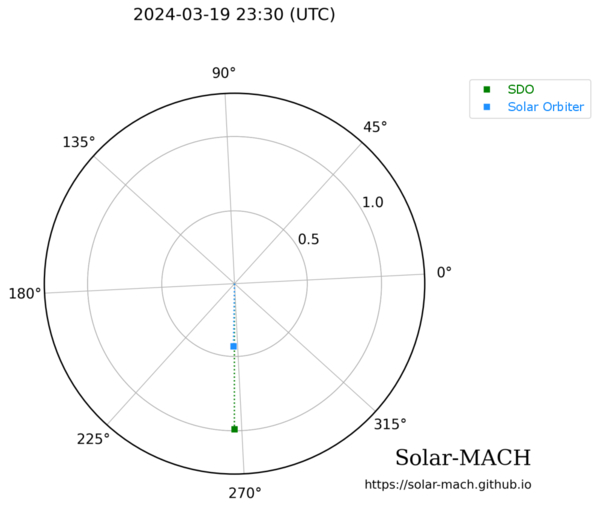
Positions of SDO (green) and Solar Orbiter (blue) during a solar flare on 19 March 2024. Click to enlarge. [Guastavino et al. 2026]
Guastavino’s team aligned and reprojected the data, accounting for the slightly different viewing angles of the two spacecraft, then applied an algorithm called Adaptive SE-DESAT to reconstruct the flux within the saturated portion of the SDO image. The team compared the desaturated SDO images to the unsaturated Solar Orbiter images over the course of the flare, finding the same flare morphology and similar time evolution between the two data sets.
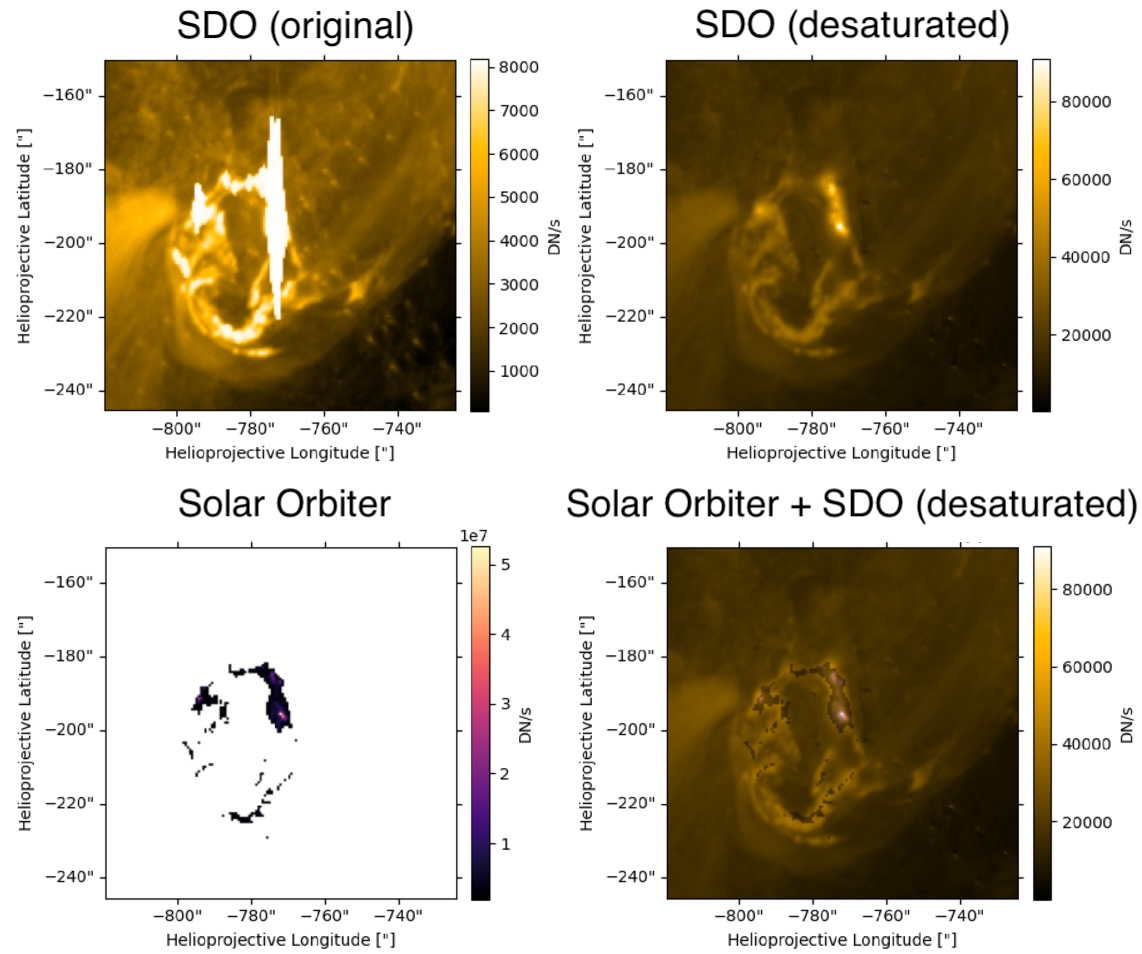
Example of unprocessed SDO data (top left), desaturated SDO data (top right), Solar Orbiter data (bottom left), and a combination of the two data sources (bottom right). Note that the Solar Orbiter observations have been clipped so that only the highest flare intensities were recorded. Click to enlarge. [Adapted from Guastavino et al. 2026]
Overall, these results demonstrate the effectiveness of the inversion technique, though Guastavino and coauthors noted that improvements could be made during the impulsive phase of the flare, when the emission is increasing. The team identified several reasons why the results may not match during this phase, including rapid evolution of the flare during individual exposures.
Despite these areas that require further attention, the validation of this technique unlocks 16 years of solar flare observations from SDO. This especially enhances our sample of powerful solar flares, increasing the available records of the most energetic solar flares by orders of magnitude.
“Validation of an Extreme-Ultraviolet Desaturation Technique for the Atmospheric Imaging Assembly on Board the Solar Dynamics Observatory Using Observations from the Extreme Ultraviolet Imager on Board Solar Orbiter,” Sabrina Guastavino et al 2026 ApJL 1005 L50. doi:10.3847/2041-8213/ae7d2e
The post When the Spacecraft Align: Rescuing Saturated Images of Solar Flares appeared first on AAS Nova.
In the rapidly evolving realm of artificial intelligence and deep learning, conventional electronic computing architectures are increasingly strained by the demands of large-scale data processing and intricate computational tasks. Optical computing has risen as a compelling alternative, leveraging the inherent physical phenomena of light—such as interference and diffraction—to execute computations fundamentally differently from traditional electronics. By harnessing these optical effects, optical computing systems (OCS) promise unparalleled advantages: notably superior processing speeds, heightened energy efficiency, and a natural aptitude for massive parallelism. These attributes make optical computing especially attractive for intensive applications like image processing, machine learning, and big data analytics, holding transformative potential across these domains.
Yet, despite these promising characteristics, contemporary optical computing platforms grapple with a significant bottleneck rooted in their hardware-centric development workflows. Conventionally, researchers must directly engage with physical OCS hardware to develop, tune, and validate computational tasks. This process entails sequential access to a limited number of costly and often heavily utilized devices. Users must physically occupy the system to load parameters, fine-tune configurations, and iteratively calibrate the hardware—an intrinsically tedious and time-consuming cycle. Each new user or task demands resetting the system state, leading to protracted queues, repetitive adjustments, and redundant calibrations. The resulting workflows impose long hours of equipment occupation and elevated trial-and-error expenses, stifling the possibility for concurrent task development and drastically curtailing research throughput and system agility.
To surmount these entrenched challenges, cutting-edge research has introduced the concept of the Digital Twin Optical Computing System (DT-OCS). This innovative approach establishes a high-fidelity digital replica—a “digital twin”—of the physical OCS that accurately models its input-output behavior under varying configuration parameters. Crucially, the digital twin allows researchers to perform extensive offline simulations, training, and optimization without the constraints of physical hardware availability. Analogous to a digital simulator software that mirrors a complex “real machine,” DT-OCS enables extensive task development and parameter tuning within a virtual environment, dramatically decoupling software development from hardware dependency. Consequently, optimized parameters validated digitally can be seamlessly transferred back to the physical system for deployment, bypassing numerous iterative hardware trials.
The implications of DT-OCS extend well beyond mere time savings. By effectively creating a “digital development toolkit” for optical computing, this framework revolutionizes the research ecosystem—transforming optical computing platforms from isolated, hardware-bound experiments to versatile, shareable research infrastructures. Researchers can now conduct task training, performance benchmarking, and method comparisons entirely within a unified digital realm, fostering collaborative innovation. Distinguished from legacy OCS paradigms, DT-OCS supports parallel task development workflows, allowing multiple computational problems to be advanced simultaneously without hardware conflicts. This capability markedly enhances flexibility, reduces development bottlenecks, and accelerates the maturation and practical adoption of optical computing technologies.
Envisioning the trajectory of optical computing, the integration of digital twin models with physical hardware appears indispensable. Contemporary transportation systems, for instance, benefit from the synergy between tangible road networks and dynamic digital mapping platforms. Similarly, next-generation optical computing platforms should embody dual representations: a robust physical computing infrastructure supplemented by perpetually updated digital twins. This paradigm champions accessibility, reproducibility, and scalability—cornerstones for fostering broad-scale collaboration. It paves the way for unified validation standards and equitable performance comparisons, catalyzing optical computing’s evolution into a general-purpose, widely deployable resource rather than a niche experimental setup.
The DT-OCS framework’s hallmark is its strategic decoupling of task development from hardware constraints. In traditional optical computing, task training and parameter fine-tuning necessitate iterative hardware engagements involving adjustments, diagnostics, and recalibrations. This approach encumbers the process with inefficiencies and precludes simultaneous multi-task development. DT-OCS obviates these impediments by faithfully modeling the physical system’s responses across parameter spectra, enabling exhaustive offline optimization. This digital-first workflow increases research agility, minimizes hardware occupancy, and substantially compresses the development timeline. Consequently, DT-OCS amplifies the throughput and adaptability of optical computing research endeavors.
The real-world efficacy of the DT-OCS framework has been experimentally validated using a cutting-edge high-speed optical computing system incorporating silicon photonic feature-computing chips. These empirical studies demonstrated DT-OCS applications in diverse computational domains, including image classification and sequential decision-making. Notably, configurations optimized within the digital twin translated flawlessly to the physical hardware, with observed task performance closely mirroring digital forecasts. This underscores not only the high fidelity of the DT-OCS model but also its robust transferability across practical scenarios. Moreover, by enabling parallel task development within the digital domain, DT-OCS expedites the overall research workflow, markedly elevating efficiency.
An illustrative application of the DT-OCS system involved offline training and deployment for the Fashion-MNIST image classification task—a benchmark dataset widely used in machine learning. This practical demonstration affirms DT-OCS’s capacity to bridge digital model development with real-world optical computing implementations. Beyond efficiency gains, DT-OCS signifies a conceptual shift toward disentangling computational task design from the idiosyncrasies of physical system constraints. Historically, optical computing research has been hamstrung by its dependence on specific hardware platforms and accessibility limitations, hindering reproducibility and cross-task comparisons. The introduction of an open-source digital twin framework surmounts these barriers by democratizing access and standardizing evaluation protocols.
By openly releasing the DT-OCS framework alongside associated task datasets, the research fosters a community-driven ecosystem where software-based task design, training, and validation can proceed independently of physical system constraints. This openness engenders scalability, reproducibility, and collaborative potential that traditional optical computing architectures cannot easily achieve. Researchers worldwide gain the freedom to explore broader task horizons, perform comprehensive benchmarking, and validate innovative approaches within a consistent computational substrate. Such a paradigm shift propels optical computing from isolated experimental configurations into accessible and extensible platforms, expediting technological advancements and practical deployments.
This pioneering work advocates a transformative application paradigm for optical computing platforms: the symbiotic coexistence of physical hardware and computationally equivalent open-source digital twin models. Only by embracing such dual-system architectures can the field transcend limitations imposed by experimental variability and hardware scarcity. The resultant platforms will be shareable, replicable, and adaptable to a diverse array of research challenges. As optical computing moves towards becoming a mainstream computational resource, the principles embodied by DT-OCS may well establish the foundational infrastructure that underpins scalable, collaborative innovation in photonic information processing.
Subject of Research: Not applicable
Article Title: Digital twin optical computing system
News Publication Date: 21-Apr-2026
Web References:
References:
DOI: 10.29026/oea.2026.250254
Image Credits: Dr. Tingzhao Fu from the National University of Defense Technology, China, and Dr. Hongwei Chen from Tsinghua University, China
Artificial intelligence, Computer science, Photonics, Engineering, Machine learning, Computer modeling, Computer processing, Semiconductors, Optics, Applied optics

The Event Horizon Telescope (EHT), the facility that delivered humanity’s first-ever picture of a black hole, can produce some of the sharpest images in all of astronomy. But turning the EHT’s raw data into images is a complex process involving messy statistics and powerful algorithms. Recent work presents a potential upgrade to that process: for the first time in long-baseline interferometry, it may be possible to model everything everywhere all at once.
The EHT has some of the sharpest eyes in all of astronomy. With its effective resolution of just 20 microarcseconds, in principle you could use it to read a newspaper in New York while sitting at a cafe in Paris. But this planet-spanning instrument (it relies on data from radio telescopes on four continents) doesn’t snap pictures like an ordinary camera. Instead, each pair of telescopes measures something called an “interferometric visibility,” which is related to a single Fourier component of the actual underlying image.

The first image of a black hole, constructed from Event Horizon Telescope data taken in 2017. [EHT Collaboration; CC BY 4.0]
Typically researchers break the problem down into several stages: first calibrate the data, then regularize and construct the best-fitting image, then analyze that image to constrain the actual physics you care about like the width of the ring surrounding a black hole. This is how the original EHT publications went about their groundbreaking work on the now-iconic glowing ring around the supermassive black hole in the galaxy Messier 87 (M87*).
Recent work led by Paul Tiede (Black Hole Initiative at Harvard University) suggests an alternative process. Instead of separating the stages of analysis as described above, the team demonstrated that one could fit everything simultaneously in a framework they call hierarchical interferometric Bayesian imaging, or HIBI.
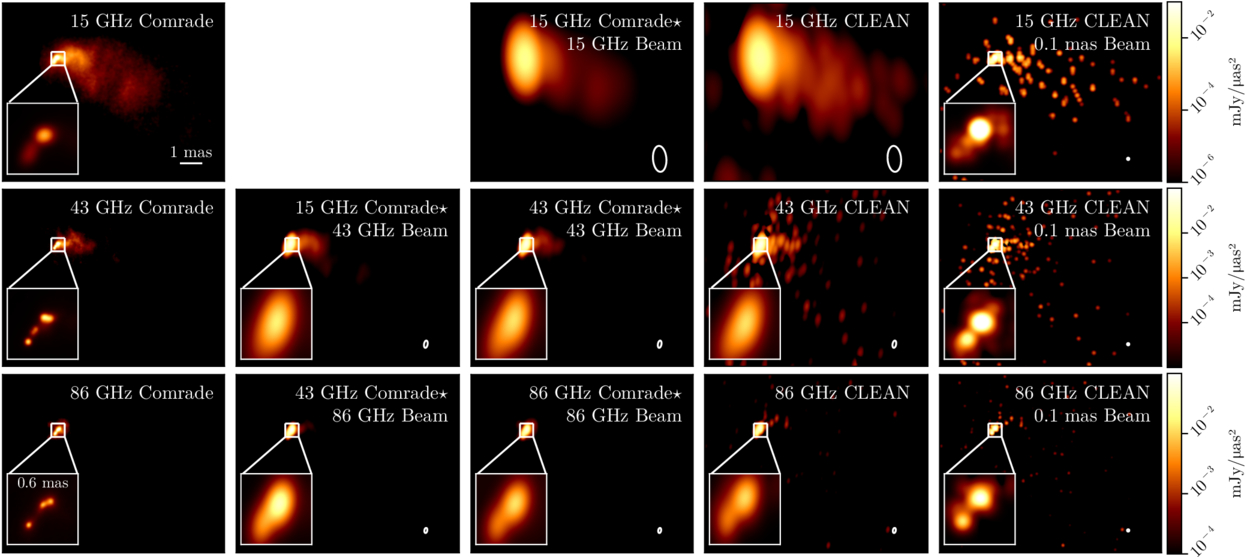
A comparison of the new HIBI technique (referred to as “Comrade” here) and a traditional algorithm called CLEAN. Click to enlarge. [Tiede et al. 2026]
Even more exciting, the team demonstrated that it’s possible to skip the image construction step altogether and go straight to the science. By fitting parameters describing the physics underlying a scene, the team was able to constrain the width of the ring around M87* without any reference to a picture. They predict that this technique could be crucial for extracting information when future instruments like the Next Generation Event Horizon Telescope observe more distant black holes that are only marginally resolved. Though we’ll likely have to wait years for these next-generation telescopes, work like this ensures that astronomers will be able to squeeze as much science from them as possible once these new facilities are ready.
“Hierarchical Interferometric Bayesian Imaging,” Paul Tiede et al 2026 ApJ 997 262. doi:10.3847/1538-4357/ae2749
The post Enhancing the Sharpest Images appeared first on AAS Nova.
Editor’s Note: For the remainder of 2025, we’ll be looking at a few selections that we haven’t yet discussed on AAS Nova from among the most-downloaded articles published in AAS journals this year. The usual posting schedule will resume January 2nd.
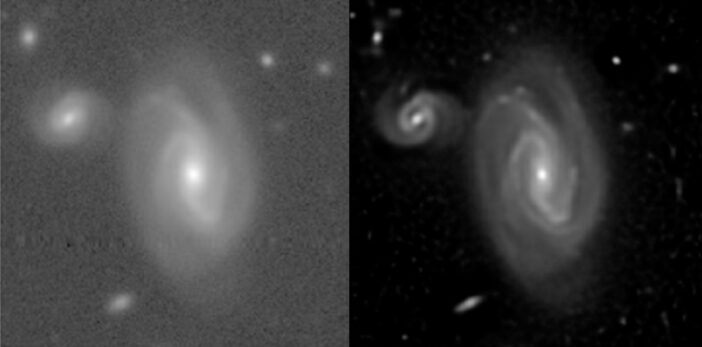
A team led by Yashil Sukurdeep (Johns Hopkins University) developed a new method for processing and combining ground-based astronomical images. The authors’ algorithm, called ImageMM because it leverages a method called majorization–minimization, yielded greater detail in bright sources and distinguished more faint sources from the background than existing methods.
As ground-based telescopes grow larger and their cameras grow more sensitive, they must still contend with one unfortunate fact: they are trapped beneath Earth’s atmosphere, which blurs fine details in astronomical images. To extract as much information as possible from beneath Earth’s blurry, ever-shifting atmosphere, researchers have developed numerous strategies for cleaning, combining, and sharpening astronomical images. From simple averaging of multiple exposures to complex statistical techniques, each of these methods has unique strengths and weaknesses. ImageMM succeeds in quieting background noise and sharpening images of both extended and point-like sources while avoiding many of the pitfalls of statistical methods.
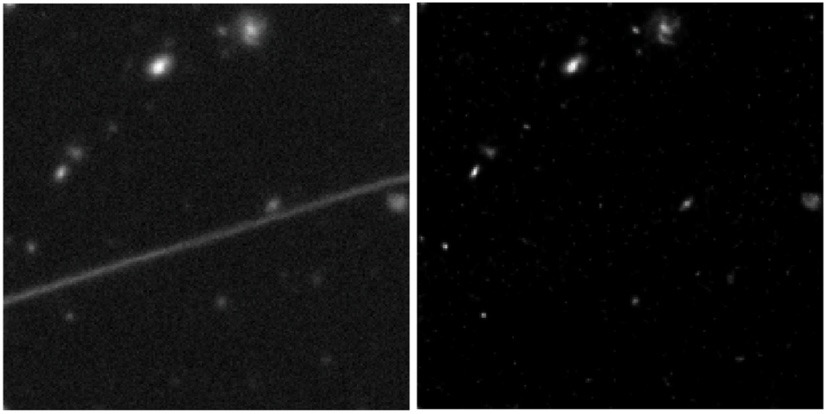
An example of satellite-trail removal by ImageMM. Click to enlarge. [Adapted from Sukurdeep et al. 2025]
Yashil Sukurdeep et al 2025 AJ 170 233. doi:10.3847/1538-3881/adfb72
The post Selections from 2025: A New Way to Combine Ground-Based Images appeared first on AAS Nova.

Isolated brown dwarfs are some of the rarest and hardest to study objects in our stellar neighborhood. Recently, astronomers revealed that one of the most famous isolated brown dwarfs, W1935, is not actually one brown dwarf but two.
Astronomers know of only 50 free-floating brown dwarfs within the nearest 200 light-years or so, and even the ones we know about are poorly understood. Since brown dwarfs are frigid compared to their stellar cousins, they consequently shine much less brightly and at longer wavelengths of light. Even taking a picture of these ~500K objects requires long stares with specialized telescopes, and these facilities already have their schedules full supporting a wide range of other areas of research from distant galaxies to exploding supernovae.
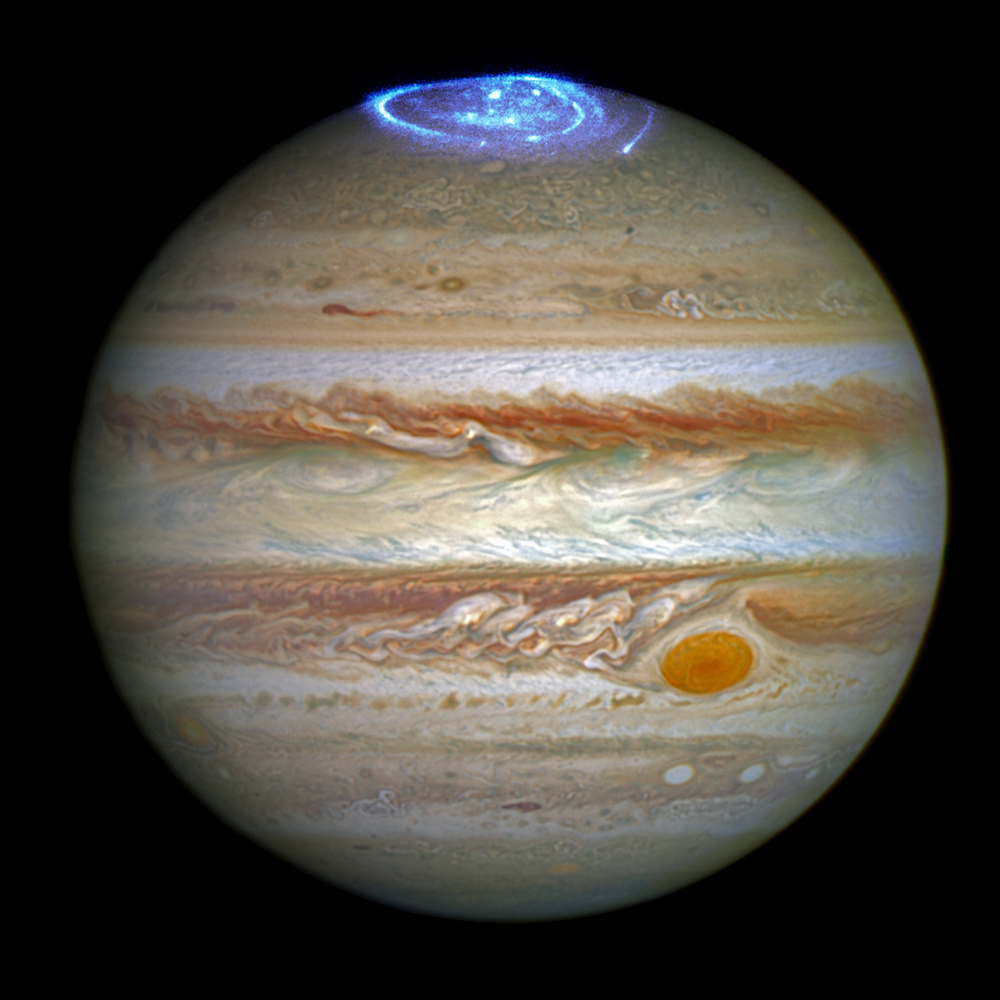
An image of Jupiter and its prominent aurora taken with the Hubble Space Telescope. [NASA, ESA, and J. Nichols (University of Leicester); Acknowledgment: A. Simon (NASA/GSFC) and the OPAL team]
Recently, JWST continued its pattern of discovery: the telescope took another look at the brown dwarf W1935, where methane emission was detected for the first time, and again found something surprising.
When JWST first took a look at this brown dwarf, it used its Near Infrared Spectrograph (NIRSpec) to record a spectrum of the object. These data revealed a large spike near 3 microns that perfectly lined up with methane emission from an aurora, similar to what we observe on Jupiter in the solar system. This was a thrilling find, since it hinted at an exciting possibility: Jupiter’s aurora is powered by its nearby moon Io, so the researchers cautiously wondered if W1935’s aurora could be evidence of a companion satellite as well.
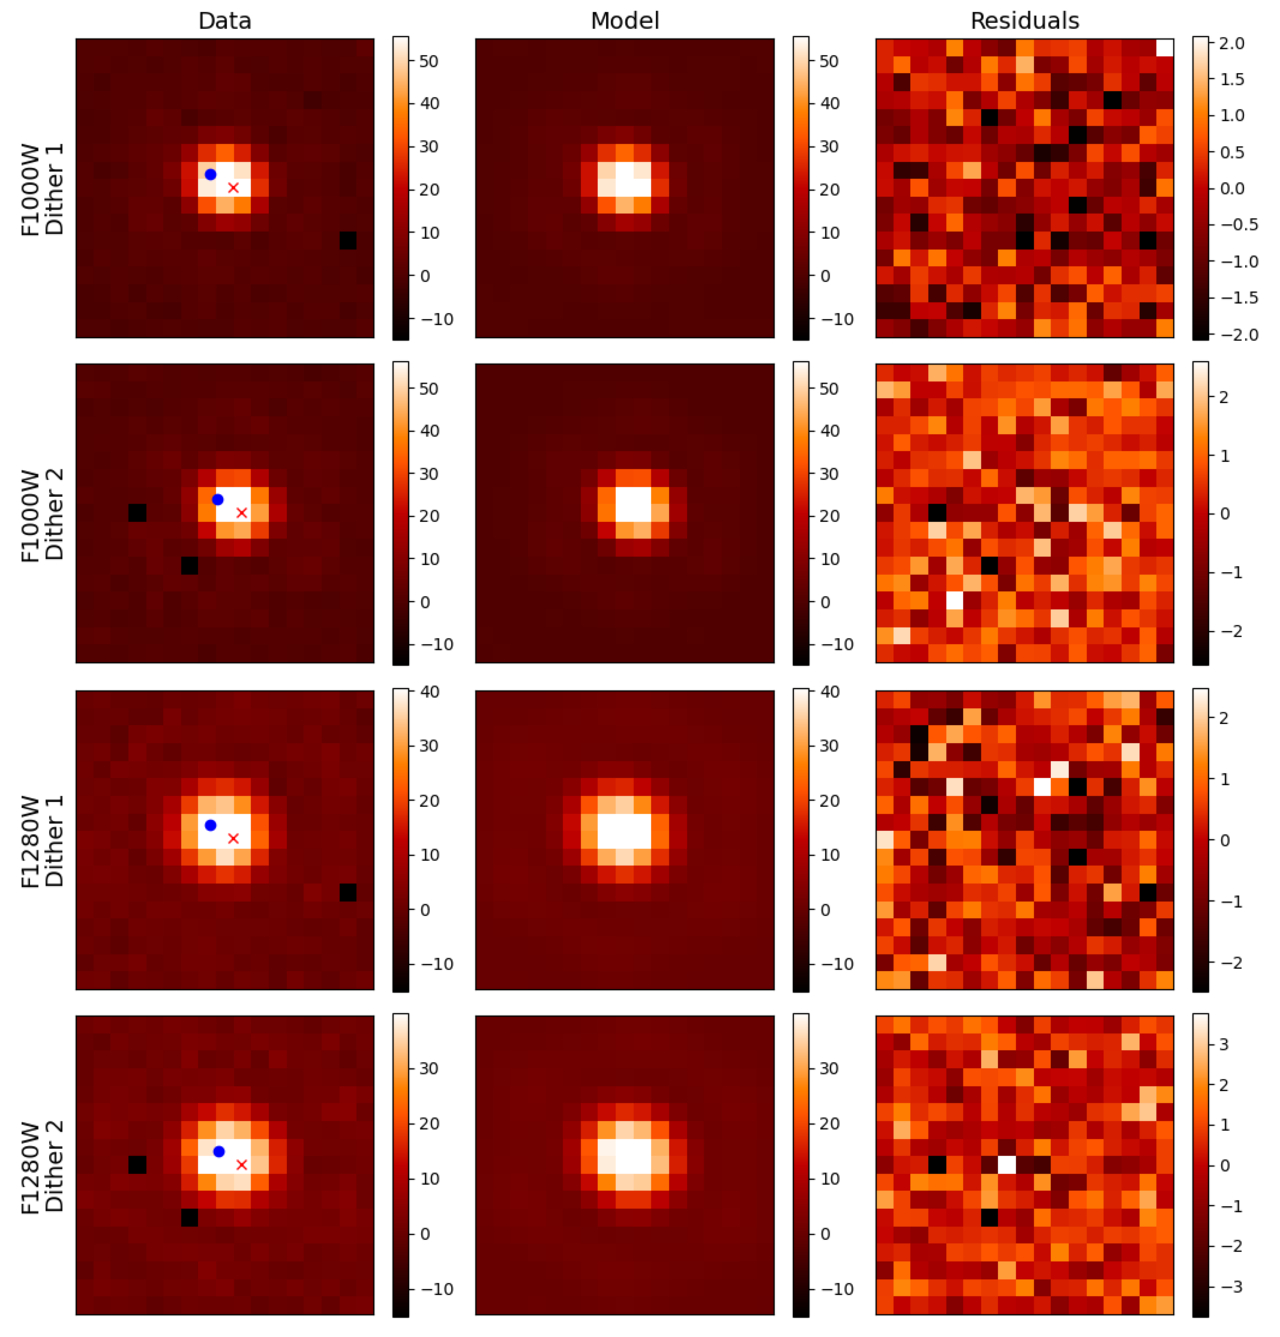
Images of W1935 taken with MIRI (left column), the author’s model for those images (center column), and the residuals (right column). The model includes two nearby point sources that are so close together they appear as one slightly elongated source. Click to enlarge. [De Furio et al. 2025]
This makes W1935 just the second-ever known Y+Y dwarf binary and cements its status as one of the most interesting brown dwarf systems discovered to date. So far, it’s not clear which object is responsible for the auroral signal since the objects are so close together that their images blur together without careful modeling and image processing.
De Furio’s team pointed out that JWST has yet another instrument that could prove useful here: its Integral Field Unit spectrometer within NIRSpec. Should JWST revisit this fascinating system, it could study the aurora’s variability over time, pin it to one specific object within the binary, and hopefully shed some light on whether any moons play a role in the methane emission. Given all we have learned each time JWST has turned to these strange worlds, we can only hope that it will do so again soon.
“Discovery of the Second Y+Y Dwarf Binary System: CWISEP J193518.59-154620.3,” Matthew De Furio et al 2025 ApJL 990 L63. doi:10.3847/2041-8213/adfee1
The post A Strange Brown Dwarf Gets Stranger appeared first on AAS Nova.

Astronomers may have directly imaged a companion star to the famous red supergiant Betelgeuse at last. Though the tentative detection only loosely constrains the star’s physical properties, it appears to be a 1.6-solar-mass pre-main-sequence star. The discoverers suggest the name Siwarha, Arabic for “Her Bracelet,” given that the star circles Betelgeuse, “Hand of the Giant.”

A photograph of the constellation Orion. Betelgeuse is the bright yellow star located left of center. [E. Slawik/NOIRLab/NSF/AURA/M. Zamani; CC BY 4.0]
Betelgeuse is a variable star. On top of its well-constrained 400-day pulsation period, the star has exhibited two behaviors that have drawn interest in recent years: a deep, prolonged dimming episode in 2019–2022 that is thought to be due to an immense ejection of mass from the star’s surface, and a 6-year variation in the star’s photometry, astrometry, and radial velocity.
Multiple studies have attributed the 6-year variability to one or more companion stars. In general, these studies predict that the companion star circles Betelgeuse on a tight, 6-year, nearly edge-on orbit. As reported in a new article published in the Astrophysical Journal Letters, observations have likely proved these predictions correct.
Steve Howell (NASA Ames Research Center) and collaborators searched for Betelgeuse’s predicted companion star using the 8.1-meter Gemini North telescope. The team used the ‘Alopeke instrument in speckle imaging mode, which involves taking thousands of milliseconds-long snapshots to avoid smearing due to atmospheric fluctuations.
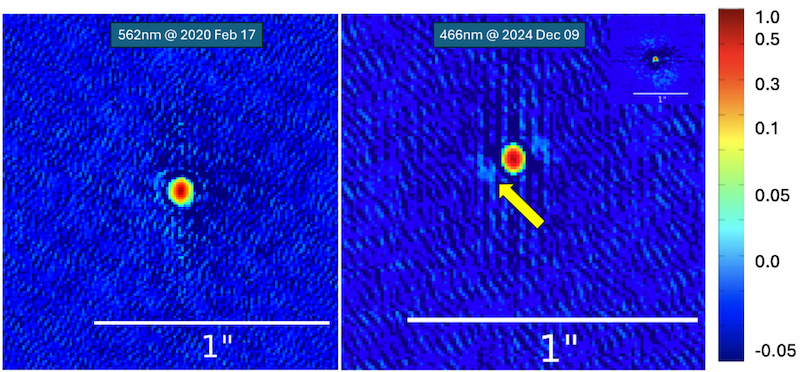
Observations of Betelgeuse from 2020 (left) and 2024 (right). An arrow points to the companion. Note that the image processing introduces a 180º ambiguity in the location of the companion, which is resolved by analyzing phase information. [Howell et al. 2025]
Howell and coauthors performed additional analyses to rule out interference from hot pixels, cosmic rays, or atmospheric diffraction. They also considered that the star could lie in the background or foreground, but they found both possibilities unlikely. After further calculations, the team estimated that the companion is six magnitudes fainter than Betelgeuse and separated by just 52 milliarcseconds at an angle of 115º. These quantities agree well with predictions for the companion’s position.

The on-sky proper motion of Betelgeuse from 2020 to 20204. The companion is shown as the small black circle. This shows that if the companion star were actually a background star, it would have been plainly visible in the 2020 observations. [Howell et al. 2025]
The team closed with a call to the community to turn their instruments toward Betelgeuse on 26 November 2027, when the companion will once again be at its greatest angular separation. Our exploration of this long-sought-after star has just begun!
“Probable Direct Imaging Discovery of the Stellar Companion to Betelgeuse,” Steve B. Howell et al 2025 ApJL 988 L47. doi:10.3847/2041-8213/adeaaf
The post Betelgeuse’s Companion Star May Have Been Seen at Last appeared first on AAS Nova.

Motivated by a desire to support community members financially during the coronavirus pandemic, researchers employed 30 local citizen scientists in the Hubble Image Similarity Project. This project quantified the similarities between astronomical images, providing a way to test the results of image-search algorithms.

The Eagle Nebula, pictured here in an image from Kitt Peak National Observatory, is a star-forming region in the Milky Way. [T.A.Rector (NRAO/AUI/NSF and NOIRLab/NSF/AURA) and B.A.Wolpa (NOIRLab/NSF/AURA); CC BY 4.0]
You might start your search with an astronomical image database, using filters for object type or instrument to sift through thousands and thousands of options. But even filtering out everything but star-forming regions might yield vastly different results, given the widely varying shapes, colors, and sizes of these regions.
Or maybe you’ll feed your image into a neural network that has been trained to spot similar images. The results may seem promising, but how can you tell whether the algorithm has found the images that are the most similar? Would another algorithm do better?
Astronomical image collections rarely contain information about similarities between images in their metadata, and while neural networks appear to excel at gathering similar images, the results of these models are generally unverified. The Hubble Image Similarity Project, led by Richard White (Space Telescope Science Institute) and Josh Peek (Space Telescope Science Institute and Johns Hopkins University), addressed these issues with a team of citizen scientists who generated similarity information for astronomical images, providing a quantitative means to test the results of neural networks.
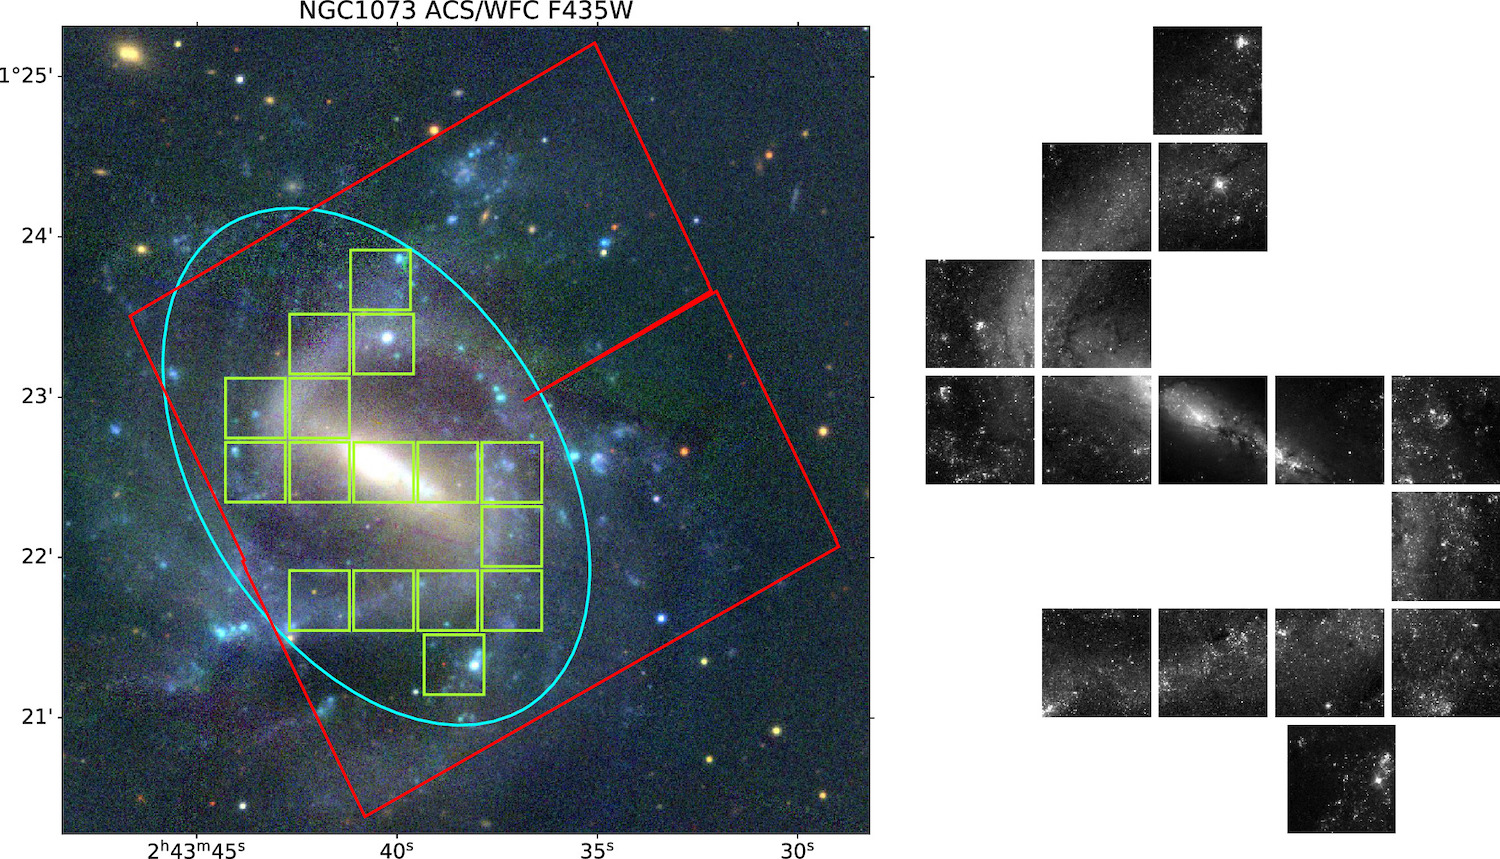
An example of individual test images (green squares) extracted from a Hubble Legacy Archive image (red square). Low-contrast areas have been excluded, leaving the galaxy’s spiral arms for analysis. Click to enlarge. [White & Peek 2025]
White and Peek recruited 30 members of the community within walking distance of the Space Telescope Science Institute to identify similar astronomical images, and the reviewers were paid for their work. In the three phases of the project, reviewers considered test images one at a time and 1) selected all similar images from a set of 15 comparison images, 2) selected the most similar image from a narrowed-down set of 6 comparison images, and finally 3) selected the most similar image from a set of 3 comparison images.
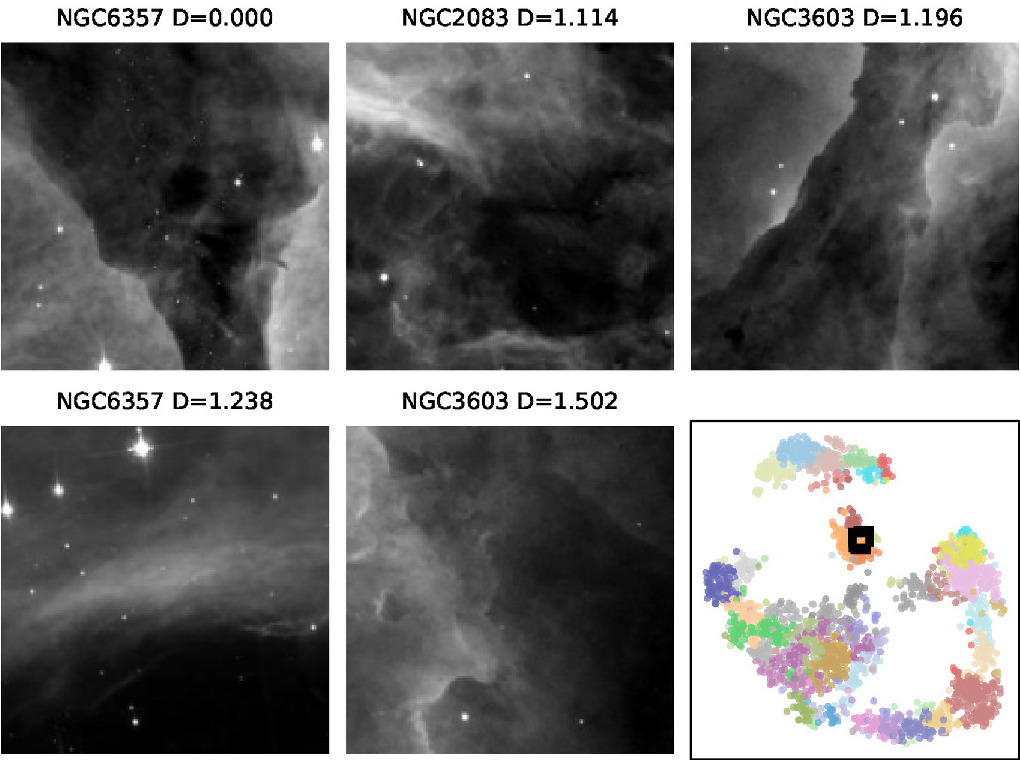
Examples of similar images according to the image similarity matrix. In the lower-right corner is a visualization of the similarity data. The semicircle of data points in the bottom half of this visualization represents galaxies, while star clusters occupy the small arc near the top and nebulae sit in the island in the center of the plot. Click to enlarge. [Adapted from White & Peek 2025]
Similar images resemble one another in terms of structure, texture, and other factors that White and Peek say are “difficult even to describe in words” — for example, the diffuse glow of a galaxy interrupted by a bright star with diffraction spikes, or a nebula speckled with stars and dense dusty clumps. The similarity data from this study are available online and can be used to test the performance of image-search algorithms. In future work, the authors plan to carry out a similar project using images of the Martian landscape.
“The Hubble Image Similarity Project,” Richard L. White and J. E. G. Peek 2025 AJ 169 306. doi:10.3847/1538-3881/adcb43
The post Citizen Science Born in the Pandemic: The Hubble Image Similarity Project appeared first on AAS Nova.
