❌

Reading view

Do Galaxies Really Glow in Sync — or Are We Just Tilting Our Heads?
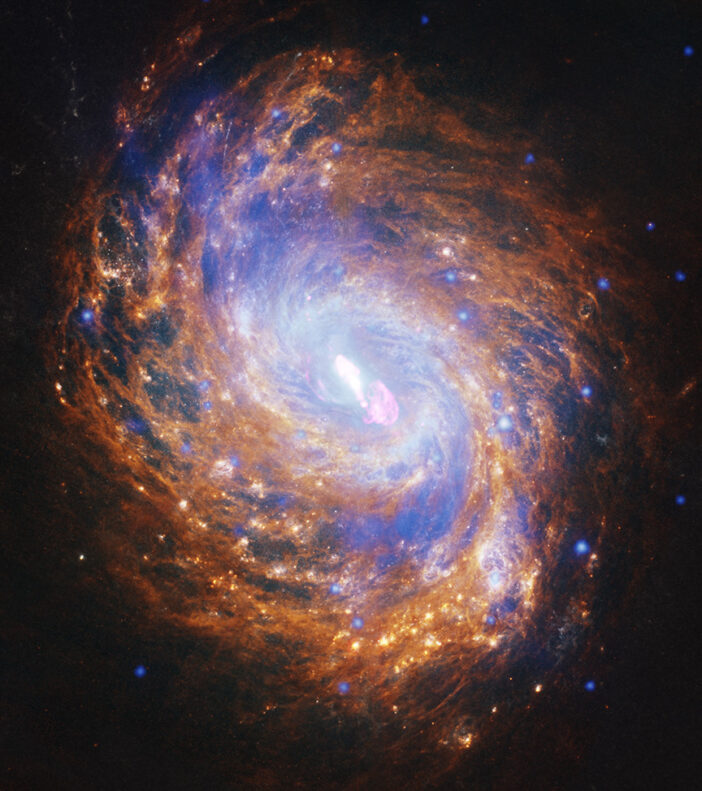
NGC 1068

Editor’s Note: Astrobites is a graduate-student-run organization that digests astrophysical literature for undergraduate students. As part of the partnership between the AAS and astrobites, we occasionally repost astrobites content here at AAS Nova. We hope you enjoy this post from astrobites; the original can be viewed at astrobites.org.

Title: Geometry, Not Calorimetry, Drives the Radio–Infrared–γ Ray Correlation
Authors: T. A. Porter, I. V. Moskalenko, and G. Jóhannesson
First Author’s Institution: Stanford University
Status: Published in ApJ

Galaxies emit light not only in the visible band, but also across other wavelengths via different physical mechanisms. Finding correlations between emissions at different wavelengths is a powerful tool for astrophysicists to explore the underlying mechanisms of galaxy formation. One of the most famous examples is the infrared–radio continuum correlation, which holds across several orders of magnitude in luminosity.

The typical explanation for this correlation is that both infrared light and radio synchrotron emission share the same energetic origin: star formation. Young stars emit ultraviolet radiation, which is absorbed by interstellar dust and re-radiated in the infrared. When these stars end their lives in core-collapse supernovae, the resulting shock waves accelerate cosmic-ray electrons, which then interact with the magnetic field to produce synchrotron emission.

For this correlation to hold, cosmic-ray electrons must radiate away all their energy within the galaxy, unable to escape and carry away some of their energy. Otherwise, the amount of radio emission would depend on how quickly cosmic rays escape and would no longer correlate with the infrared emission. This assumption is called the “electron calorimeter” model, which assumes that electrons lose all their energy due to radiation without escaping the galaxy. However, observations show that the infrared–radio correlation persists even in low-density galaxies where cosmic rays can easily escape, suggesting that the calorimeter model may not be the full story. To reconcile this, previous studies proposed “conspiracy-like” scenarios in which cosmic-ray injection, transport, magnetic-field amplification, and gas density are all coupled in a finely self-regulating way to maintain the correlation across diverse galactic environments — a somewhat awkward explanation that requires multiple unrelated physical processes to conveniently work together.

With the increased sensitivity of the Fermi Large Area Telescope, high-energy gamma-ray (or γ-ray) detections add new information to this picture. A galaxy’s γ-ray emission is produced by two different sources: cosmic-ray protons interacting with the interstellar medium gas, and cosmic-ray electrons inverse-Compton scattering off of nearby starlight or photons from the cosmic microwave background. Since both processes involve cosmic rays, the total γ-ray emission should also reflect the amount of star formation and therefore correlate with infrared and radio emission.

Because all three wavelengths trace different pieces of the same cosmic-ray population, studying them together reveals how the galaxy’s total cosmic-ray energy budget is distributed across its multi-wavelength emission.

The infrared–radio correlation has been established not only at the scale of entire galaxies, but also locally, down to patches roughly 100 parsecs across. Think of it like the relationship between a city’s electricity consumption and its population: we have long known they track each other city-wide, but it turns out the same relationship holds block by block. The infrared–radio correlation works the same way: zoom into any 100-pc region within a galaxy, and the correlation is still there. Unfortunately, the resolution of γ-ray observations is still stuck at around the kiloparsec scale. It is therefore unclear whether the local infrared–radio correlation reflects a genuine local physical coupling, one that would extend to γ-rays if we had sufficient resolution, or whether it is simply a spatial average of the emission, smoothed out by insufficient resolution. The answer determines whether radio and γ-ray emission can be used as reliable tracers of star formation, or whether they are just smeared out by cosmic-ray propagation over kiloparsec scales.

In this study, the authors numerically model galactic cosmic-ray transport, building a suite of physically motivated three-dimensional models of the Milky Way. They consider two variants for each of the four key inputs: 1) the cosmic-ray source distribution, 2) the interstellar gas, 3) the amount of starlight within the galaxy (the interstellar radiation field), and 4) the galactic magnetic field. Crucially, every model is normalized to reproduce the locally observed cosmic-ray data to within 5%, so that any differences in the predicted emission come purely from the large-scale geometry of each input, rather than from variations in the total cosmic-ray budget.

After evolving cosmic-ray transport for these realistic models, the authors then compute synthetic observations at radio, infrared, and γ-ray bands from various viewing inclinations to investigate how the underlying galactic model and the viewing angle affect the correlations between these emissions.

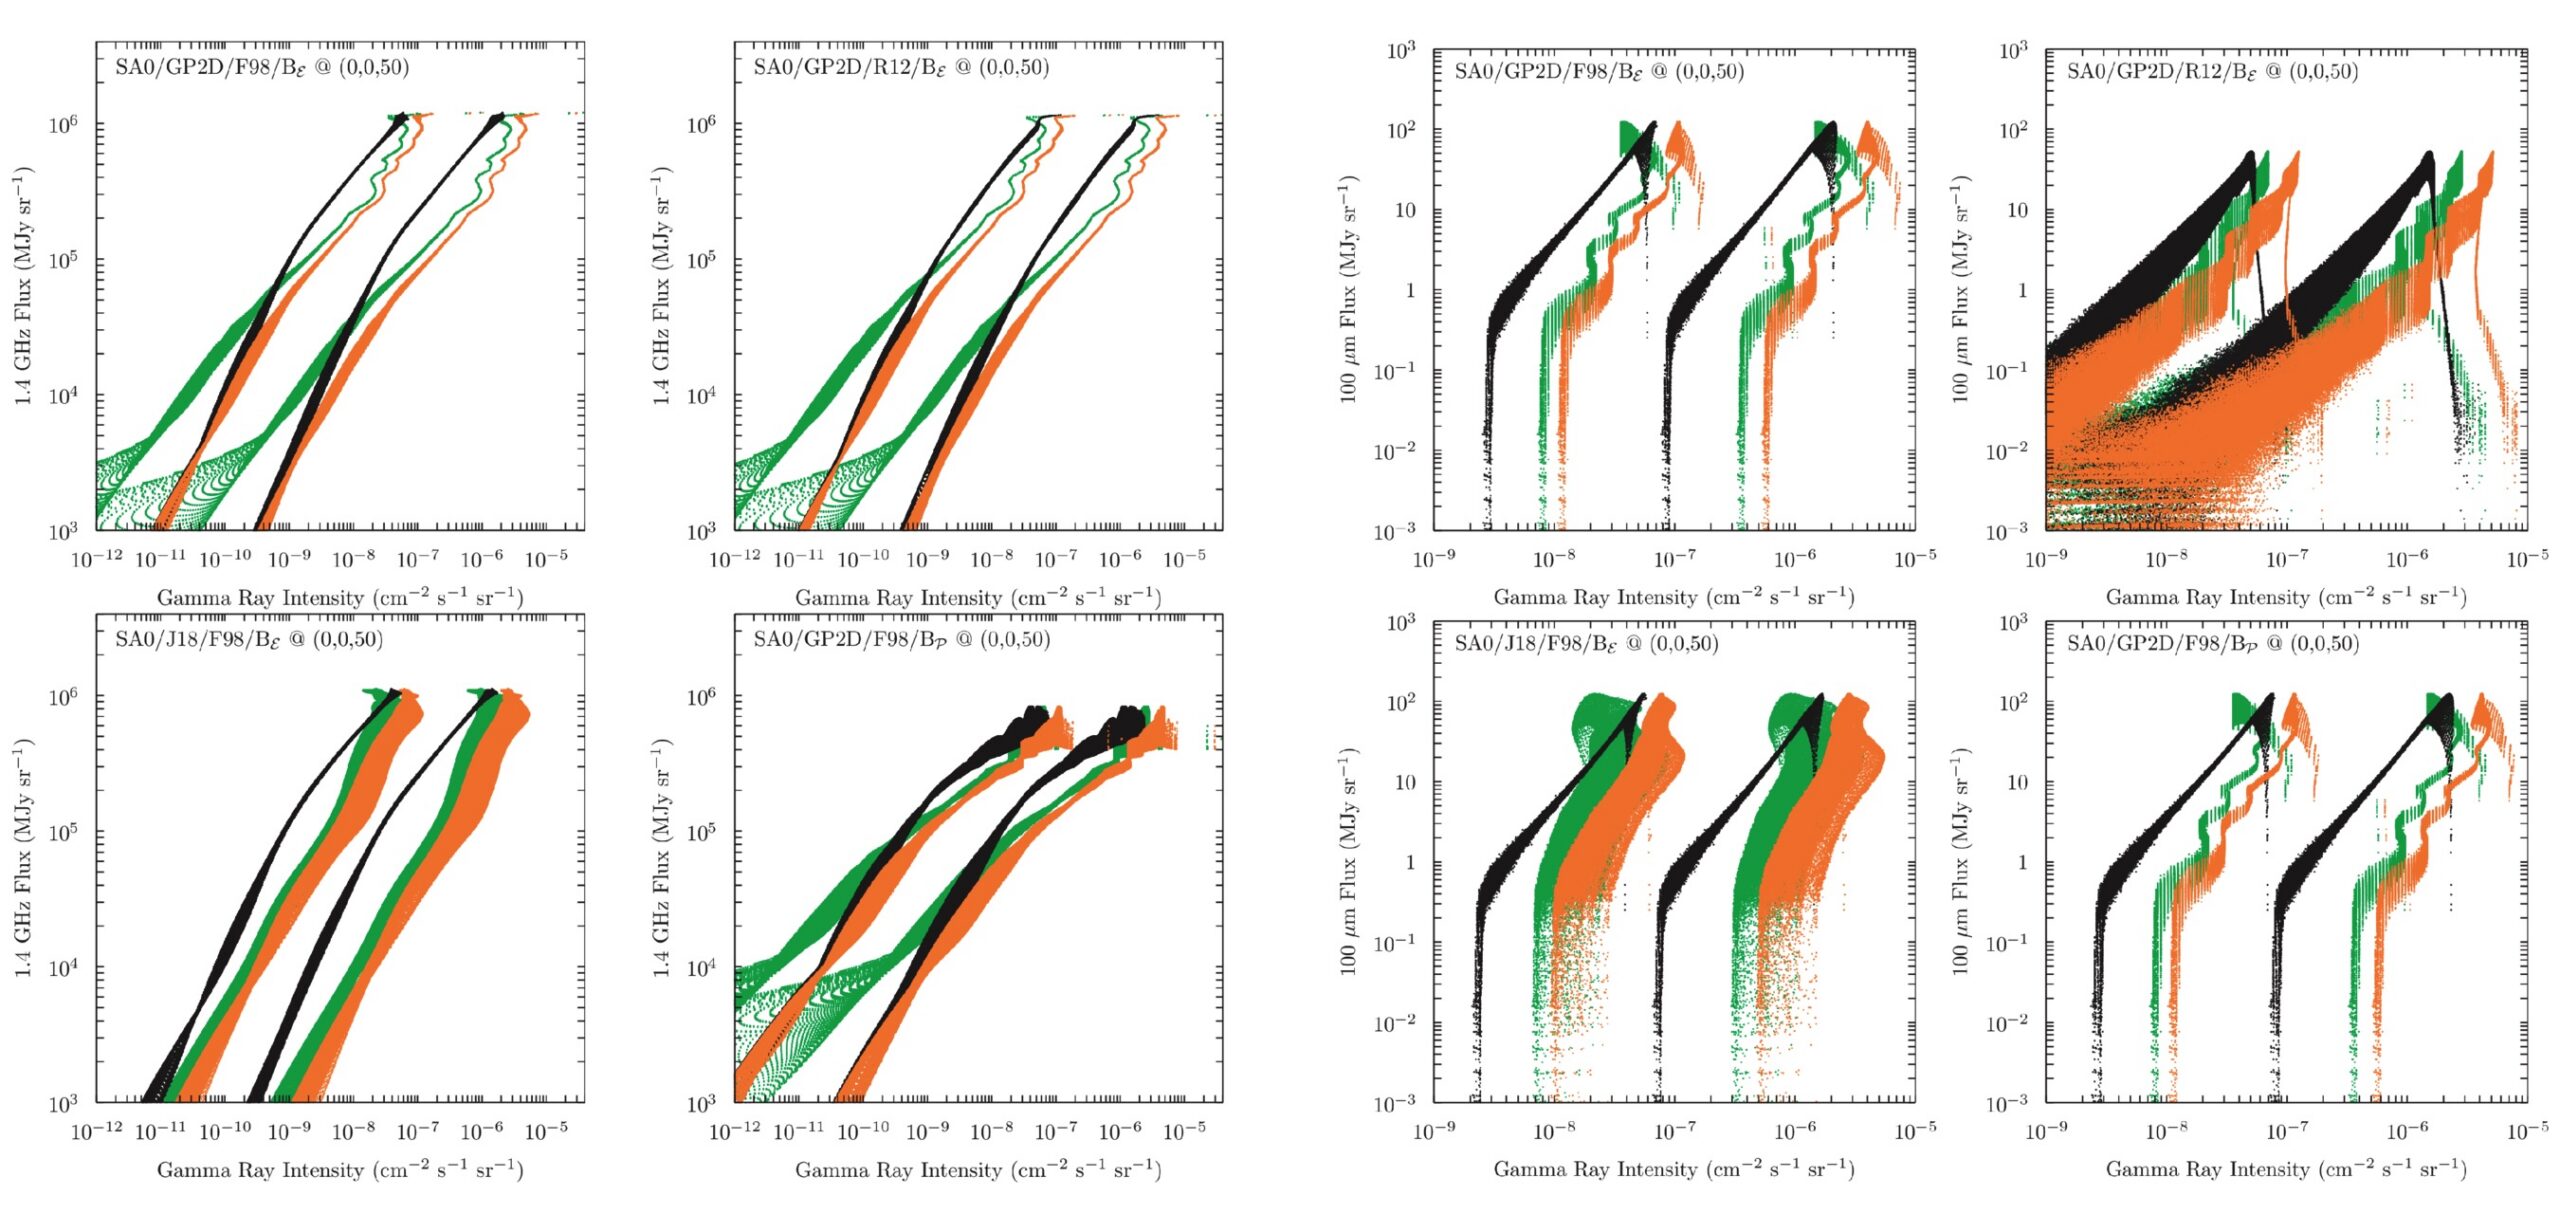
Surprisingly, inclination plays the most important role — more so than the cosmic-ray source distribution, the radiation field, or the magnetic field. Figure 1 shows the correlation plots between the radio and γ-ray emission (left two columns) and between infrared and γ-ray emission (right two columns) when viewing the galaxy face-on (i.e., viewing the galaxy from directly above the disk). Different colors represent γ-ray emission components from different physical mechanisms, with orange showing the total γ-ray emission. For both sets of correlation plots, starting from the upper-left panel, each panel modifies one physical input and recomputes the emission. Although there is some variation, one can see that the γ-ray emission correlates with both the radio and the infrared emission over several orders of magnitude, regardless of the underlying input model.
plots of radio and infrared flux versus gamma-ray intensity

Figure 1: Radio (left two columns) and infrared (right two columns) vs. γ-ray correlation plots for a galaxy viewed face-on from 50 kpc. Each panel modifies one input — the cosmic-ray source distribution, gas, radiation field within the galaxy, or magnetic field — relative to a baseline model. Colors indicate γ-ray production mechanisms (green: proton–gas; black: inverse-Compton; orange: total). Across all variations, both the radio–γ-ray and infrared–γ-ray correlations remain quasi-linear over several orders of magnitude, showing that the correlations are robust to the choice of underlying galactic model. [Adapted from Porter et al. 2026]
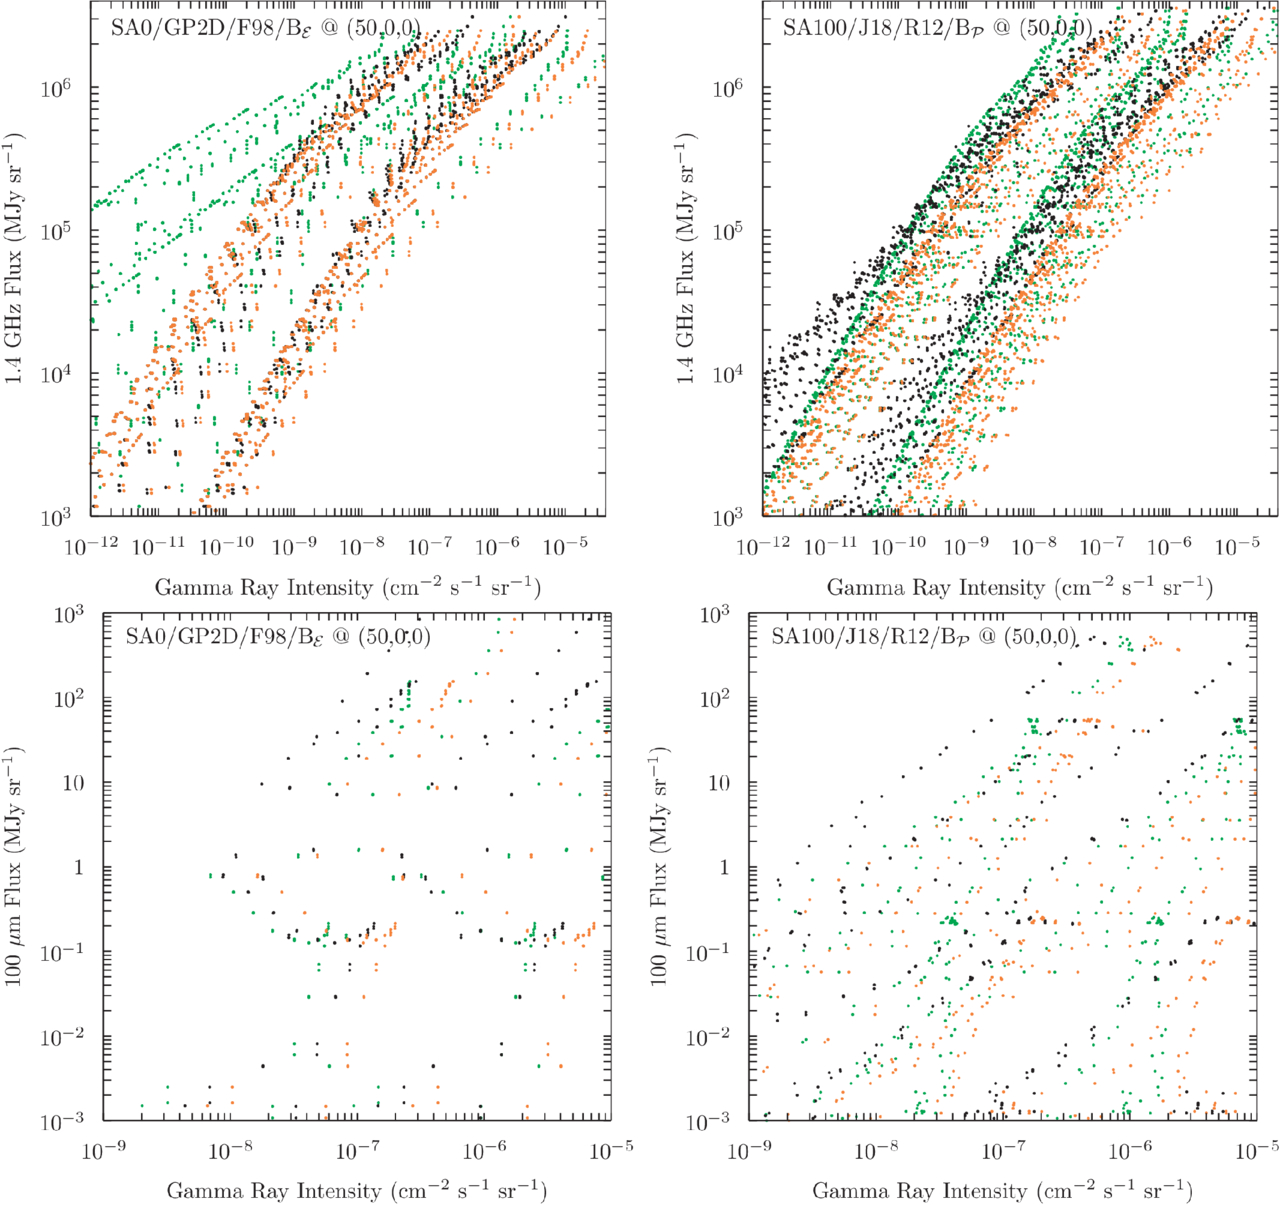
In contrast, Figure 2 shows the correlation plot between radio and γ-ray emission (upper panels) and between infrared and γ-ray emission (lower panels) when viewing the galaxy edge-on (viewing the disk from the side). The radio–γ-ray correlation is preserved, while the infrared–γ-ray correlation is no longer observed. This is because, at this inclination, geometric projection separates the emission components. Infrared-emitting dust and γ-ray emission from cosmic ray–interstellar medium interactions are confined to the disk, while synchrotron radio emission and γ-ray emission from inverse-Compton scattering extend to larger distances above and below the disk. As a result, in an edge-on view, a sight line passing through the disk sees strong infrared emission, while a sight line that misses the disk sees zero infrared but still some γ-ray emission, breaking the infrared–γ-ray correlation. On the other hand, because radio emission is more extended than infrared emission, sight lines that miss the disk can still see both radio and γ-ray emission together, preserving the radio–γ-ray correlation.
relationships between infrared, radio, and gamma-ray flux for two types of galaxy models

Figure 2: Correlation plots for two galaxy models viewed edge-on from 50 kpc — simple axisymmetric (left) and complex with spiral arms (right). Top: radio vs. γ-ray; bottom: infrared vs. γ-ray. Colors indicate γ-ray production mechanisms (green: proton–gas; black: inverse-Compton; orange: total). The infrared–γ-ray correlation breaks down, while the radio–γ-ray correlation is broadened but partially preserved. [Porter et al. 2026]
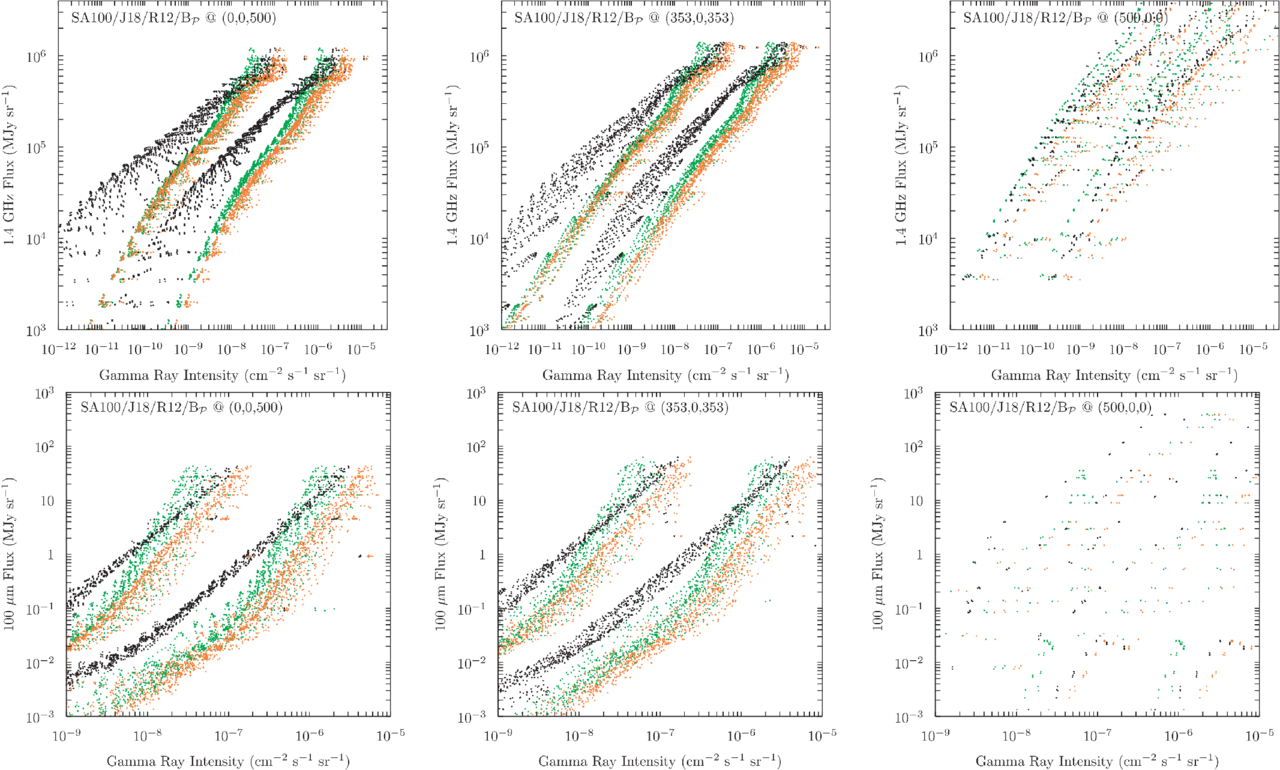
However, there is one situation where the edge-on correlation comes back: when the observer is far enough away that the image becomes too blurry to resolve the galaxy’s internal structure. Figure 3 shows the same galaxy model viewed from 500 kpc, roughly the distance to Messier 31, our nearest large neighbor. At this distance, a single pixel in the image covers about 1 kpc, large enough for everything along the line of sight. The messy, broken-up pattern seen in the closer 50 kpc edge-on view (lower-right panel of Fig. 2) disappears, and a tight, nearly linear correlation comes back. This explains why nearly all distant, unresolved galaxies show tight radio–infrared–γ-ray correlations: the tightness is simply what you get when you blur everything together, not evidence that cosmic rays are actually losing all their energy locally inside those galaxies.
relationships between infrared, radio, and gamma-ray flux for simulated galaxies viewed from 500 kiloparsecs

Figure 3: Correlation plots from a complex galaxy model viewed from 500 kpc, at three different inclinations (face-on, 45°, edge-on). Top row: radio vs. γ-ray; bottom row: infrared vs. γ-ray. Colors indicate different γ-ray production mechanisms (green: proton–gas; black: inverse-Compton; orange: total). At this distance, the blurring effect of large pixels restores a tight correlation even in the edge-on view. [Porter et al. 2026]

Now we have a consistent picture of the radio–infrared–γ-ray correlation: the authors conclude that this correlation is not a direct signature of cosmic-ray calorimetry, but a geometric projection effect. In face-on systems, a single sight line integrates emission from both the disk and off-disk regions, naturally producing a linear correlation, even when cosmic rays do not lose all their energy locally to radiation (i.e., local calorimetry is absent). In edge-on systems, the correlation breaks down because geometric stratification separates the different emission components. The practical implication is significant: for unresolved galaxies, the tightness of the global correlation alone cannot be used as evidence for cosmic-ray calorimetry, and the physically meaningful information about cosmic-ray transport and escape efficiency is encoded in the scatter around the mean trend, not in the correlation itself.

Original astrobite edited by Kelsie Taylor.

About the author, Sandy Chiu:

I’m a PhD candidate at the University of Michigan, Ann Arbor. I’m interested in numerical simulations of cosmic rays feedback in galaxies and their comparison with observation.

The post Do Galaxies Really Glow in Sync — or Are We Just Tilting Our Heads? appeared first on AAS Nova.

  •  

Monthly Roundup: Updates on Three Notable Transients

AT 2024wpp

Across the universe and across the electromagnetic spectrum, flares, bursts, and waves are making their mark on the sky. Today, we’re giving an update on three exceptional transients that have been discussed previously on AAS Nova: AT 2024wpp, GRB 250702B, and GW231123.

The Most Luminous Known Fast Blue Optical Transient, AT 2024wpp

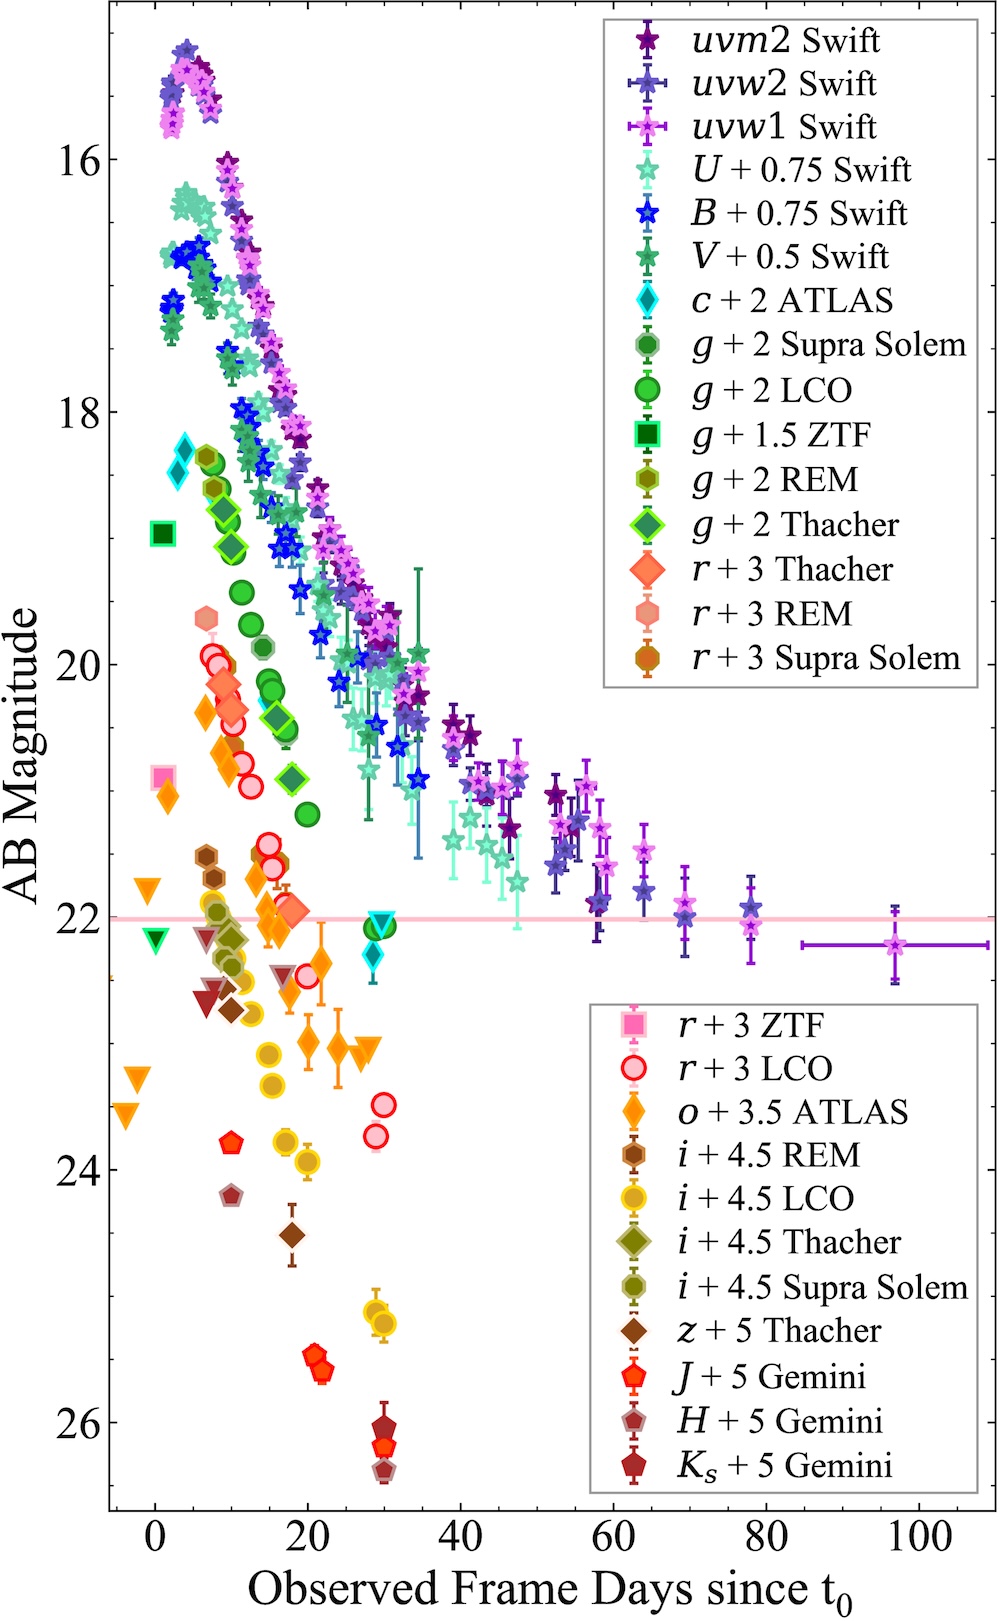
Discovered in September 2024, AT 2024wpp burst onto the scene as the most luminous example of a fast blue optical transient (FBOT) — a growing class of events that are more luminous, more rapidly evolving, and bluer than supernovae. In October 2025, astronomers published their findings on AT 2024wpp’s X-ray and radio evolution. Just last month, a research team led by Natalie LeBaron (University of California, Berkeley) described the results of a complementary investigation of the transient’s ultraviolet, optical, and near-infrared behavior.

AT 2024wpp light curves

The ultraviolet through infrared light curve of AT 2024wpp. Results from different filters are offset vertically for clarity. [LeBaron et al. 2026]

LeBaron and collaborators collected ultraviolet through infrared photometry as well as optical and infrared spectroscopy to characterize the event. These efforts led to the first-ever collection of ultraviolet data during the rising period of an FBOT. Overall, the data reveal an almost featureless spectrum from the optical through the near-infrared and a persistent, weeks-long thermal continuum, both of which seem to be common for FBOTs.

The observations point to a luminous central energy source that continuously injects energy into its surroundings, powers multiple outflows, and ionizes the ejected material. These features can be explained by the rapid accretion of material by a neutron star or a black hole, in which the accreted material forms a disk and is ejected in both a fast-moving polar outflow and a slower-moving equatorial outflow.

Though the exact nature of the central object powering AT 2024wpp’s intense radiation isn’t known — the extreme luminosity of this event points to a stellar-mass black hole as the central object, but a neutron star cannot be ruled out — the overall picture of this event matches what has been found for previous FBOTs. Upcoming instruments and surveys will discover more FBOTs and spot them earlier in their evolution, transforming our understanding of these rare transients.

An Ultra-Long X-Ray and Gamma-Ray Transient, GRB 250702B

GRB 250702B is an exceptional gamma-ray burst: an intense flash of gamma rays lasting anywhere from a few milliseconds to several hours. GRB 250702B is unprecedented among events in this class because it features several bursts arising over the course of roughly 7 hours, plus X-ray precursor emission going back 24 hours before discovery. We’ve previously covered JWST follow-up observations of GRB 250702B, and today we’re taking a look at its high-energy evolution.

Swift and Chandra observations of GRB 250702B

Swift (black circles) and Chandra (blue circles) observations of GRB 250702B. Click to enlarge. [Adapted from O’Connor et al. 2025]

Brendan O’Connor (Carnegie Mellon University) and collaborators collected observations of GRB 250702B from the Neil Gehrels Swift Observatory, the Nuclear Spectroscopic Telescope Array (NuSTAR), and the Chandra X-ray Observatory, stretching from just half a day after the transient was discovered to 65 days later. The team aimed to determine whether GRB 250702B fit the profile of an ultra-long gamma-ray burst accompanying a star’s collapse into a black hole or a relativistic tidal disruption event, in which a star is ripped apart by a massive black hole.

O’Connor’s team found that GRB 250702B didn’t fit neatly into either category. While many of the event’s properties closely resembled those of ultra-long gamma-ray bursts, the hours-long gamma-ray emission and the precursor X-ray emission were outliers. Certain features are more easily reconciled with the tidal disruption of a main-sequence star by an intermediate-mass black hole, but others are similarly hard to account for. Finding the smoking gun for a tidal disruption event — an abrupt shutoff to the X-ray emission — will require long-term X-ray monitoring.

Because GRB 250702B has features that align with both ultra-long gamma-ray bursts and tidal disruption events, O’Connor and coauthors proposed scenarios that combine aspects of both possibilities: either a stellar-mass black hole tidally disrupting a star or the merger of a helium star with a stellar-mass black hole.

The Most Massive Gravitational Wave Source, GW231123

When compact objects like neutron stars and black holes merge, their collisions produce ripples in spacetime that are accessible to detectors on Earth. One of the most exciting events so far from the fourth gravitational wave transient catalog is GW231123, which appears to be caused by the merger of two black holes, each at least 100 times the mass of the Sun. The LIGO, Virgo, and KAGRA (LVK) collaborations reported a total mass of 238 solar masses for the event, which would make it the most massive binary black hole merger yet observed.

In a recent article, Ilya Mandel (Monash University and OzGrav) urged caution when interpreting seemingly extreme events like GW231123. Mandel’s argument is a statistical one, highlighting how certain aspects of the Bayesian techniques used to estimate GW231123’s mass could have skewed that estimate toward an artificially high value.

posterior probability distributions for maximum mass of GW231123 and all gravitational wave events seen by LVK

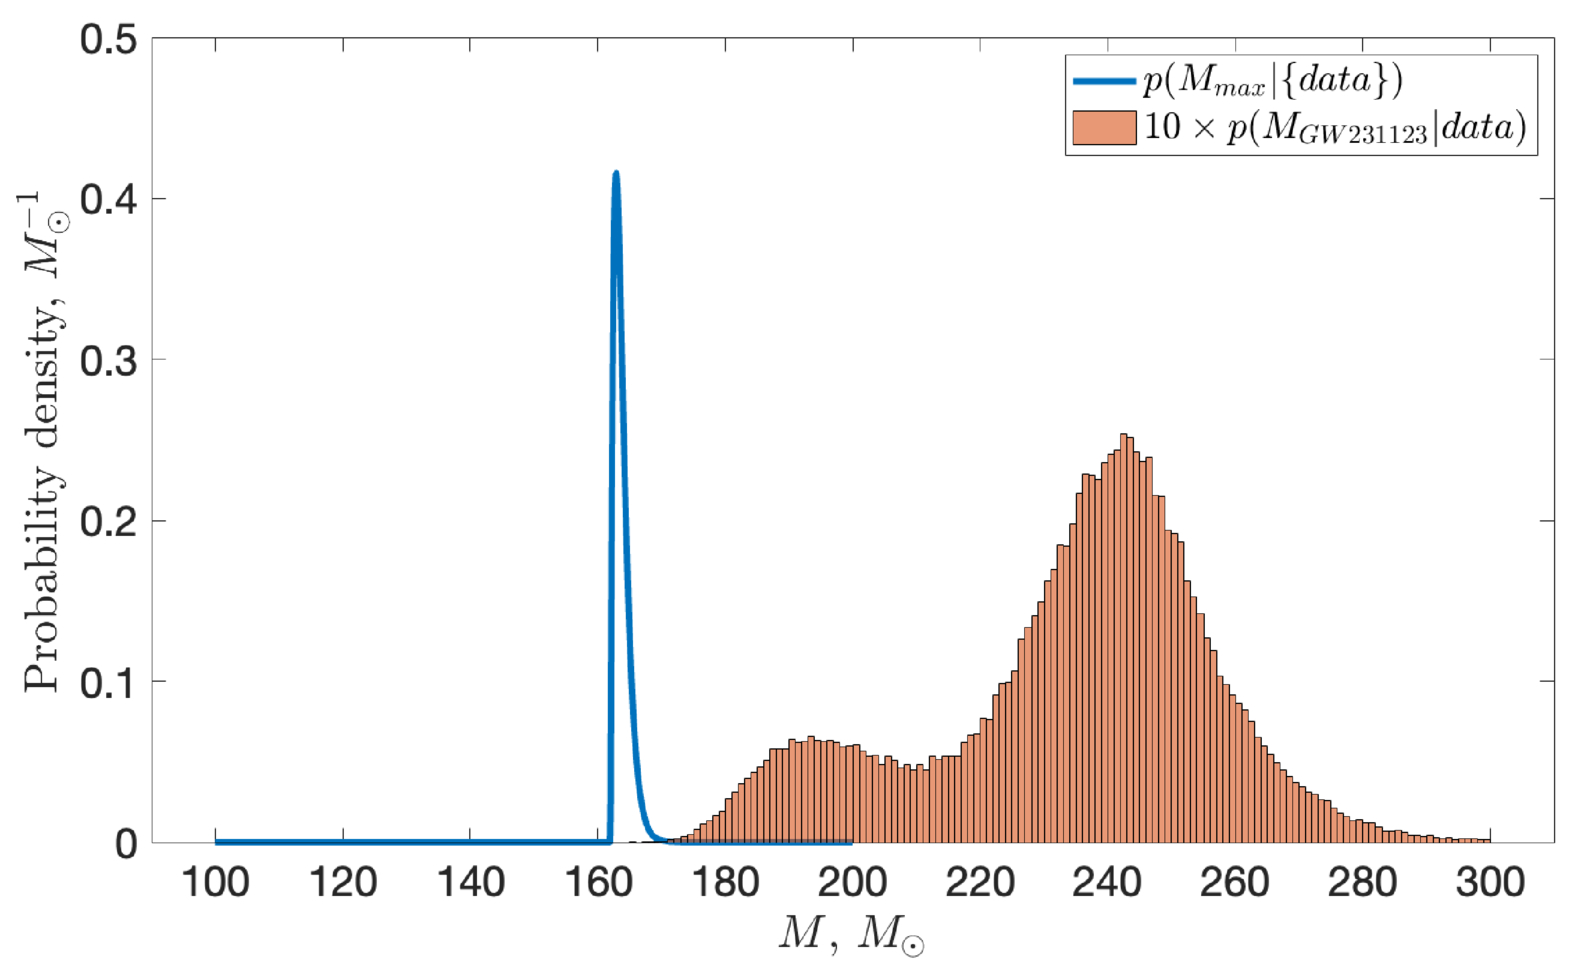
The posterior probability distribution on the maximum mass as derived from the total LVK catalog (blue), compared to the posterior for GW231123 (orange; multiplied by 10 for visibility). Click to enlarge. [Mandel 2026]

In general, Mandel points out, events that appear extreme are simply more likely to be statistical fluctuations. As an example, consider a large group of people having their heights measured, but with very large measurement uncertainties. The highest reported height in this situation is likely to be associated with a reasonably tall person whose height had a large upward measurement error, not necessarily someone who is exceptionally tall. Similarly, the reported most massive gravitational wave source is likely not quite as massive as claimed.

Mandel also demonstrated how considering the population of black hole mergers detected by LVK as a whole can provide a different perspective on GW231123’s likely mass. By analyzing this entire sample together, Mandel showed that the maximum mass for the population of merging black holes appears to be considerably lower than the mass estimated for GW231123, again raising the possibility that the true mass of the event is lower than the current estimate.

Ultimately, Mandel pointed out that at present it’s impossible to distinguish between three possibilities: that GW231123 is a true outlier among the population of merging black holes, representing a member of a new, unexplored population; that it’s a member of the same population as other black hole mergers seen by LVK but inhabits an extreme high-mass tail; or its high mass estimate is a statistical artifact.

Citation

“The Most Luminous Known Fast Blue Optical Transient AT 2024wpp: Unprecedented Evolution and Properties in the Ultraviolet to the Near-Infrared,” Natalie LeBaron et al 2026 ApJL 997 L10. doi:10.3847/2041-8213/ae2910

“Comprehensive X-Ray Observations of the Exceptional Ultralong X-Ray and Gamma-Ray Transient GRB 250702B with Swift, NuSTAR, and Chandra: Insights from the X-Ray Afterglow Properties,” Brendan O’Connor et al 2025 ApJL 994 L17. doi:10.3847/2041-8213/ae1741

“What Is the Most Massive Gravitational-Wave Source?” Ilya Mandel 2026 ApJL 996 L4. doi:10.3847/2041-8213/ae278d

The post Monthly Roundup: Updates on Three Notable Transients appeared first on AAS Nova.

  •  

Do Black Hole Flares Generate Neutrinos?

illustration of a tidal disruption event

Where do the mysterious cosmic messengers called neutrinos come from? Researchers search for a connection between neutrinos and accretion flares from black holes.

Seeking Connections

A photograph of the IceCube Neutrino Observatory

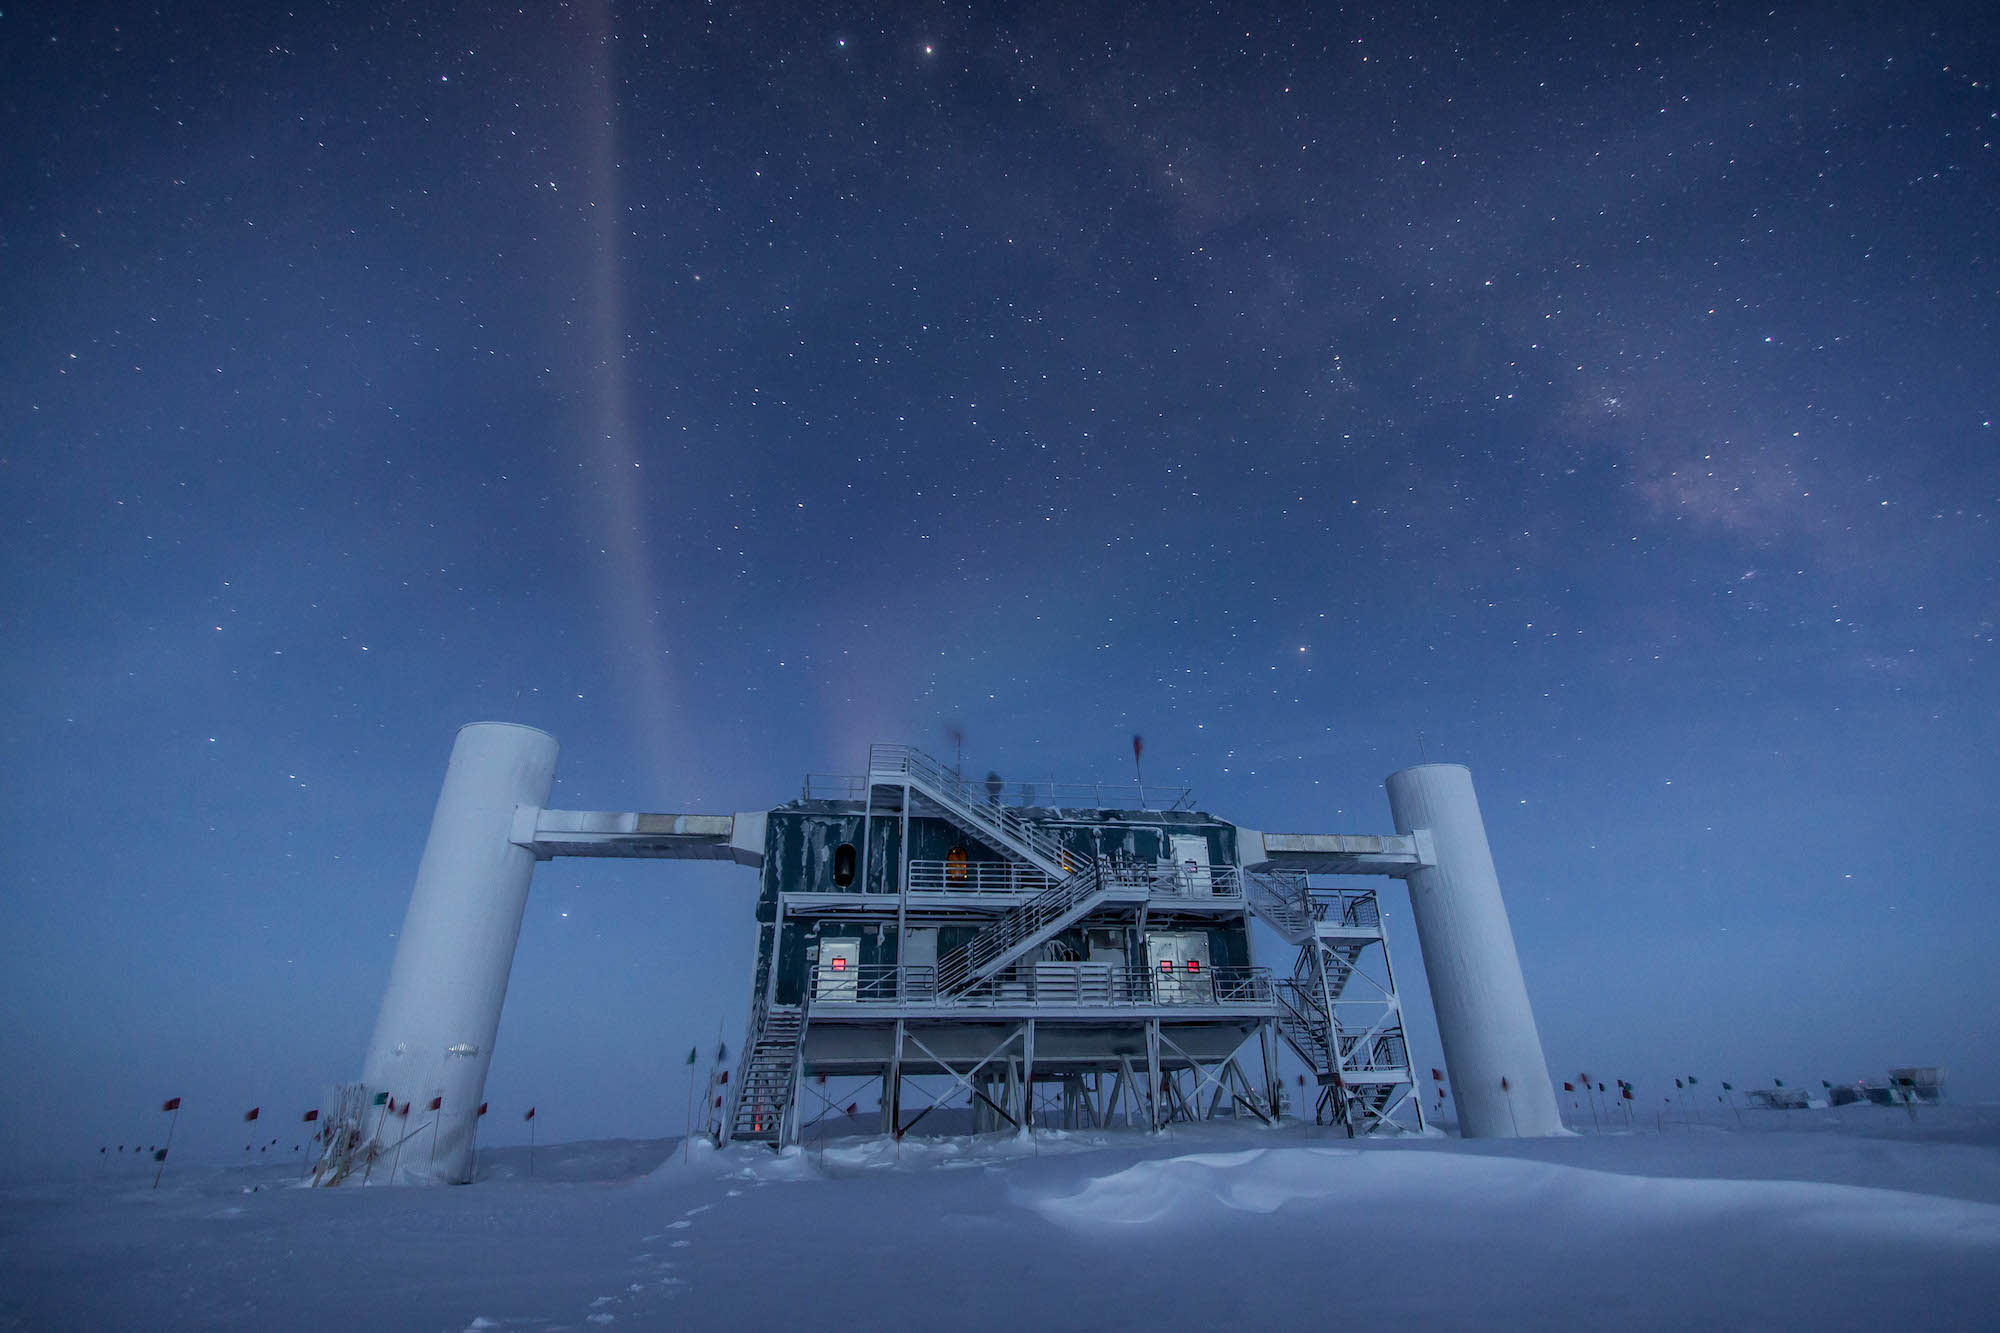
The IceCube Laboratory at the Amundsen-Scott South Pole Station in Antarctica. [Felipe Pedreros, IceCube/NSF]

Neutrinos — neutral, nearly massless elementary particles — are generated by natural particle accelerators across the universe. Facilities like the IceCube Neutrino Observatory, which employs detectors buried a mile deep in Antarctic ice, spot neutrinos from distant astrophysical sources, but matching these neutrinos to their sources is no easy task.

Thus far, researchers have discovered a compelling connection between neutrinos and distant active galactic nuclei, which are powered by the accretion of gas onto supermassive black holes. The active galactic nucleus phase of a black hole tends to be long lived, with activity lasting hundreds of thousands of years or more, making these nuclei lasting sources of neutrinos.

Sampling Flares

Recently, researchers have found tentative evidence for coincident neutrinos from short-lived accretion events like tidal disruption events, in which a star is torn apart and accreted by a black hole. These studies have uncovered a potential connection between neutrinos and tidal disruption events with mid-infrared echoes, signaling the presence of obscuring dust.

map of sampled black hole flares and neutrinos

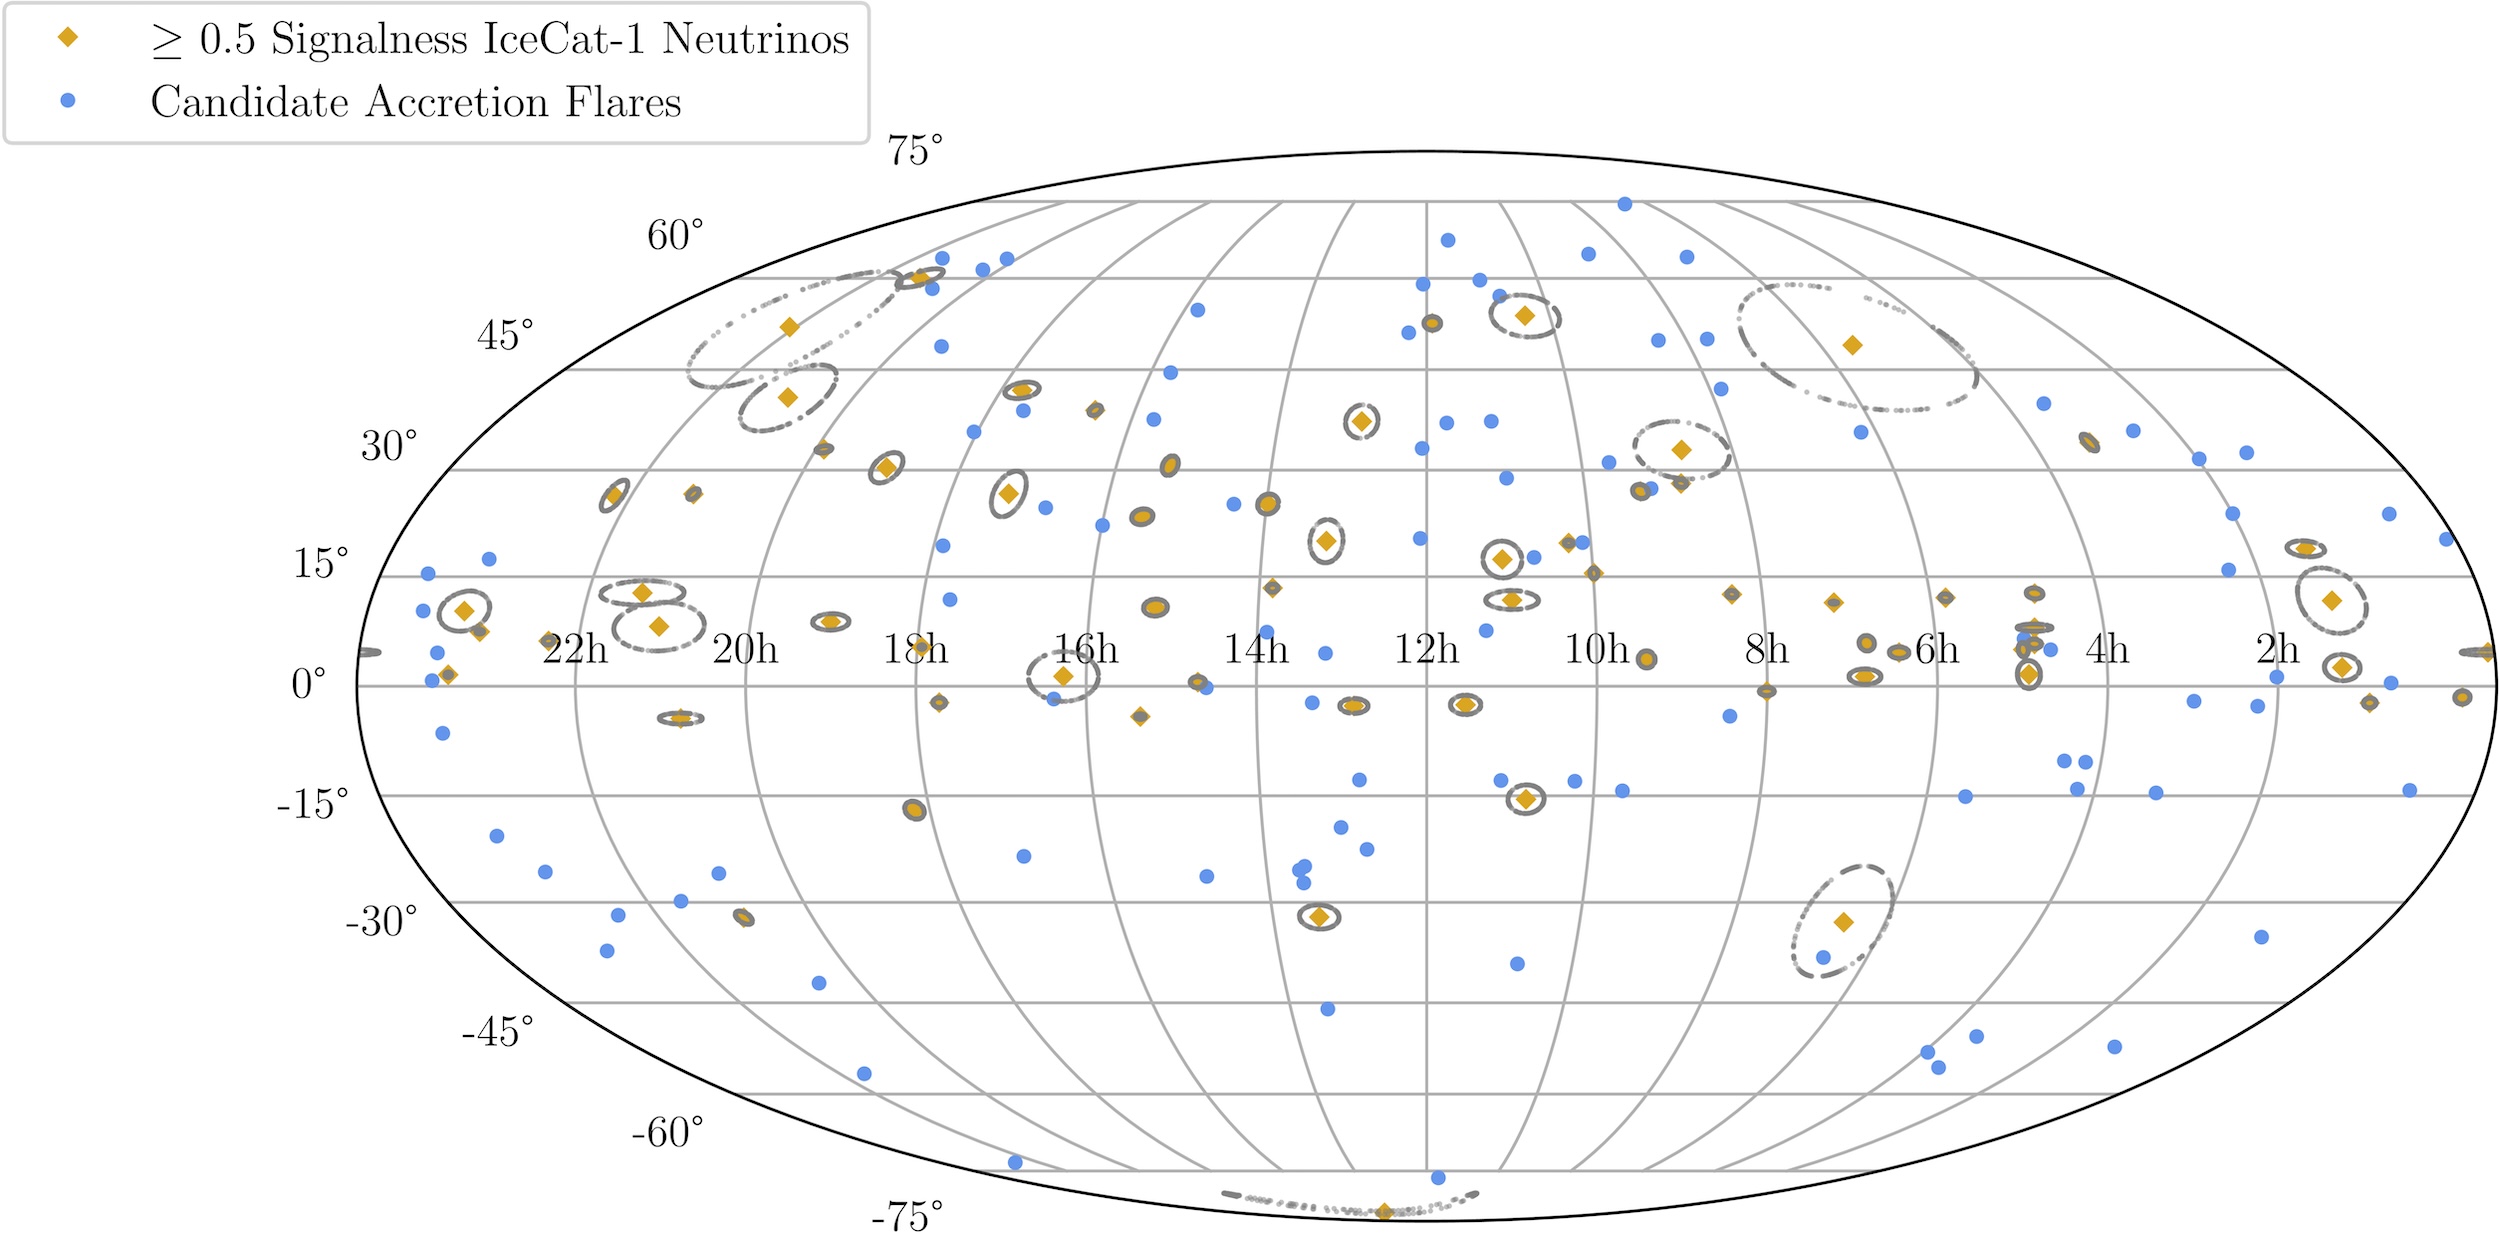
A map of the locations of the neutrinos (yellow diamonds) and black hole flares (blue circles) on the sky. Click to enlarge. [Wang et al. 2026]

To investigate whether there is any connection between neutrinos and short-lived accretion events, Megan Wang (Massachusetts Institute of Technology) and collaborators first compiled a sample of 99 black hole flares observed by NEOWISE. These flares were selected for their strong mid-infrared emission, location in the nuclei of galaxies, and a fast rise and slow decline. The team applied additional selection criteria to remove other bright transients, such as supernovae, and retain only tidal disruption events and active galactic nucleus accretion flares.

For the neutrino side of the equation, Wang’s team turned to IceCube’s most recent catalog of neutrino events from astrophysical sources. In total, they compiled a sample of 68 events for which the odds of the source being astrophysical was greater than 50%, and for which the directional uncertainty was below 50.

No Coincidences

For a flare and a neutrino to be considered spatially and temporally coincident, the neutrino must arrive within one year of the flare, and the flare must fall within the 90% certainty contours of the neutrino. Ultimately, Wang’s team found no neutrinos that fulfilled both criteria and only one that was spatially but not temporally coincident with a black hole flare.

This result appears to be at odds with previous studies that found several neutrinos that were coincident with tidal disruption events. Wang and collaborators noted that while this work finds no association between neutrinos and black hole flares, it’s possible that the team is studying a different population of accretion events.

infrared fluxes of black hole flares

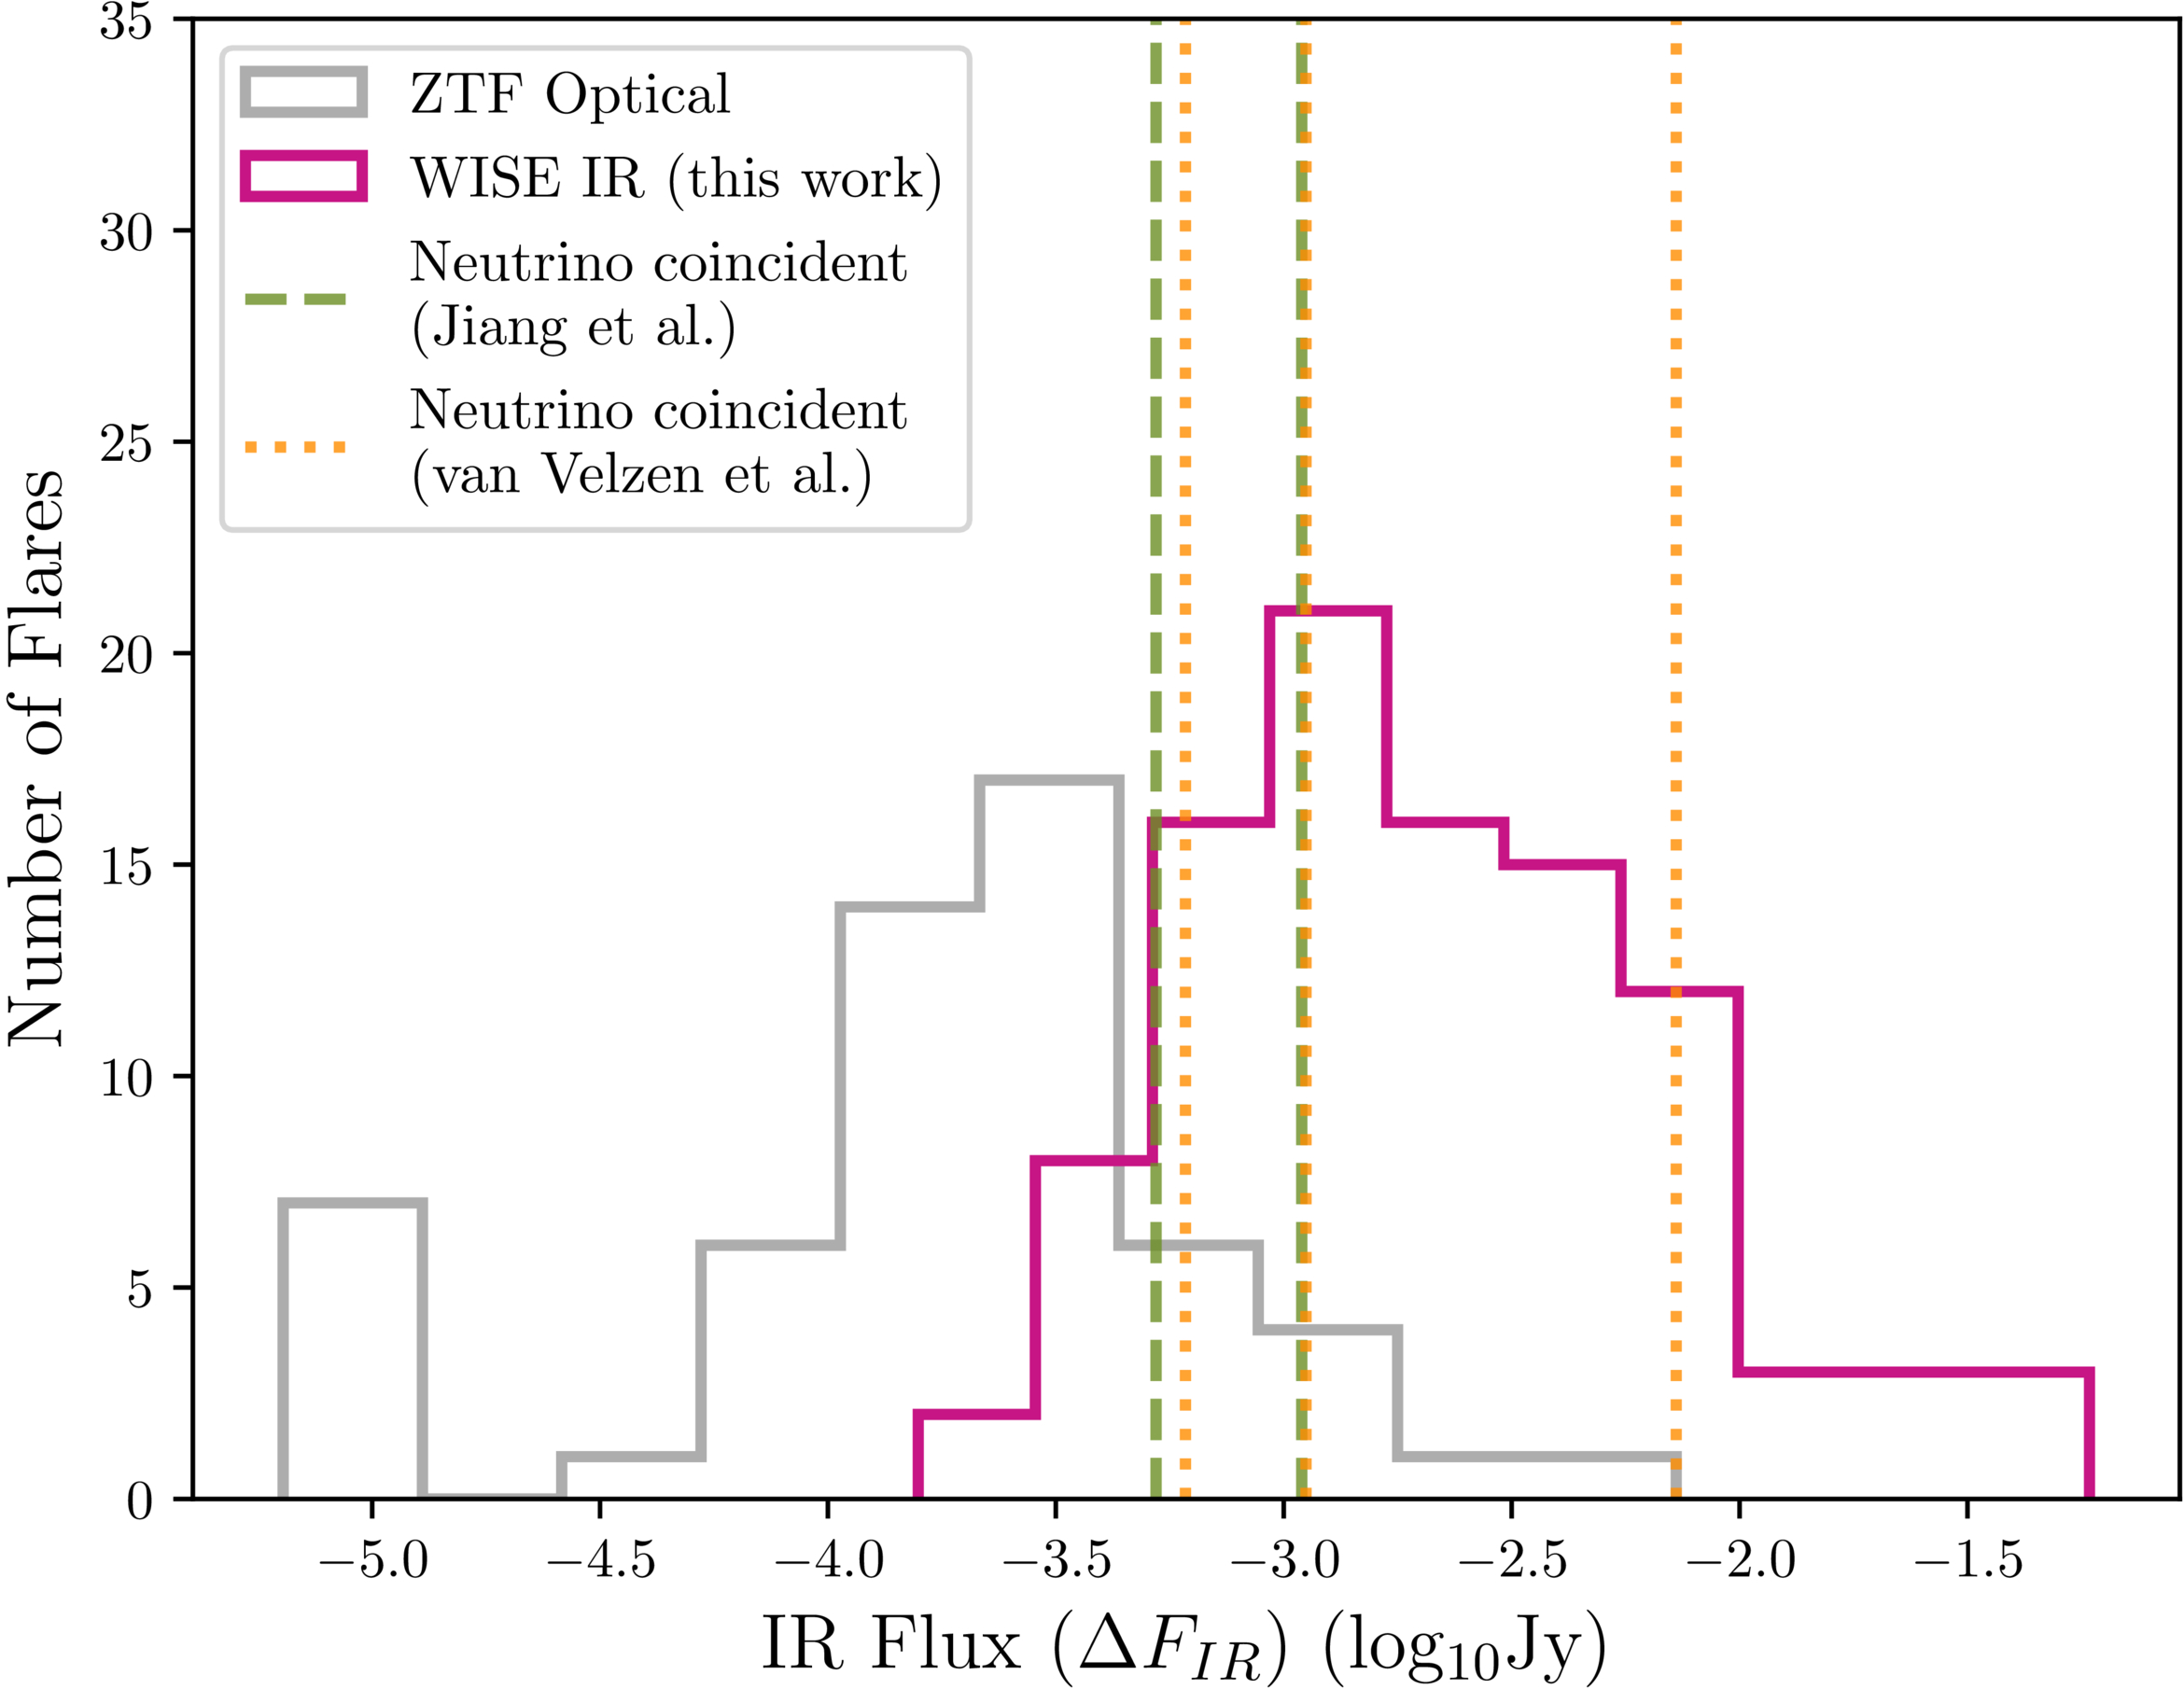
Infrared fluxes of the flares sampled in this study (magenta), optically identified flares (gray), and the tidal disruption events thought to have coincided with neutrino detections (green and gold dashed lines). [Wang et al. 2026]

For example, while the previous neutrino-associated flares were flagged for having strong mid-infrared emission, they differ from the current sample in that they were detected at optical wavelengths. The flares sampled in this work were detected in the mid-infrared and have little to no optical emission, potentially highlighting intrinsic differences compared to previous samples.

Future work, including studies that leverage upcoming datasets from the Vera C. Rubin Observatory, the Roman Space Telescope, and the NEO Surveyor, can address this question further and search for connections with specific populations of black hole flares.

Citation

“Testing the Association of Supermassive Black Hole Infrared Flares and High-Energy Neutrinos,” Megan Wang et al 2026 ApJL 998 L29. doi:10.3847/2041-8213/ae3f90

The post Do Black Hole Flares Generate Neutrinos? appeared first on AAS Nova.
  •  

JWST Follows Up on a Rare Gamma-Ray Burst

illustration of a gamma-ray burst

Discovered in July 2025, GRB 250702B is unlike any other gamma-ray burst astronomers have seen. New follow-up observations of the burst’s location have underscored the strangeness of this event.

Not Like Other GRBs

Gamma-ray bursts (GRBs) are intense flashes of gamma rays lasting anywhere from milliseconds to hours. The shortest of these bursts are thought to come from colliding neutron stars, while bursts lasting longer than a few seconds tend to come from collapsing massive stars, though notable exceptions have been discovered.

Even with known GRBs spanning such a broad range of timescales and arising from different sources, some bursts are truly exceptional. Such is the case for GRB 250702B, which was discovered on 2 July 2025 by the Fermi Gamma-Ray Burst Monitor. This event featured three separate bursts spread across several hours, as well as never-before-seen X-ray emission in the day leading up to the gamma-ray emission.

JWST on the Case

rest-frame spectrum of GRB 250702B

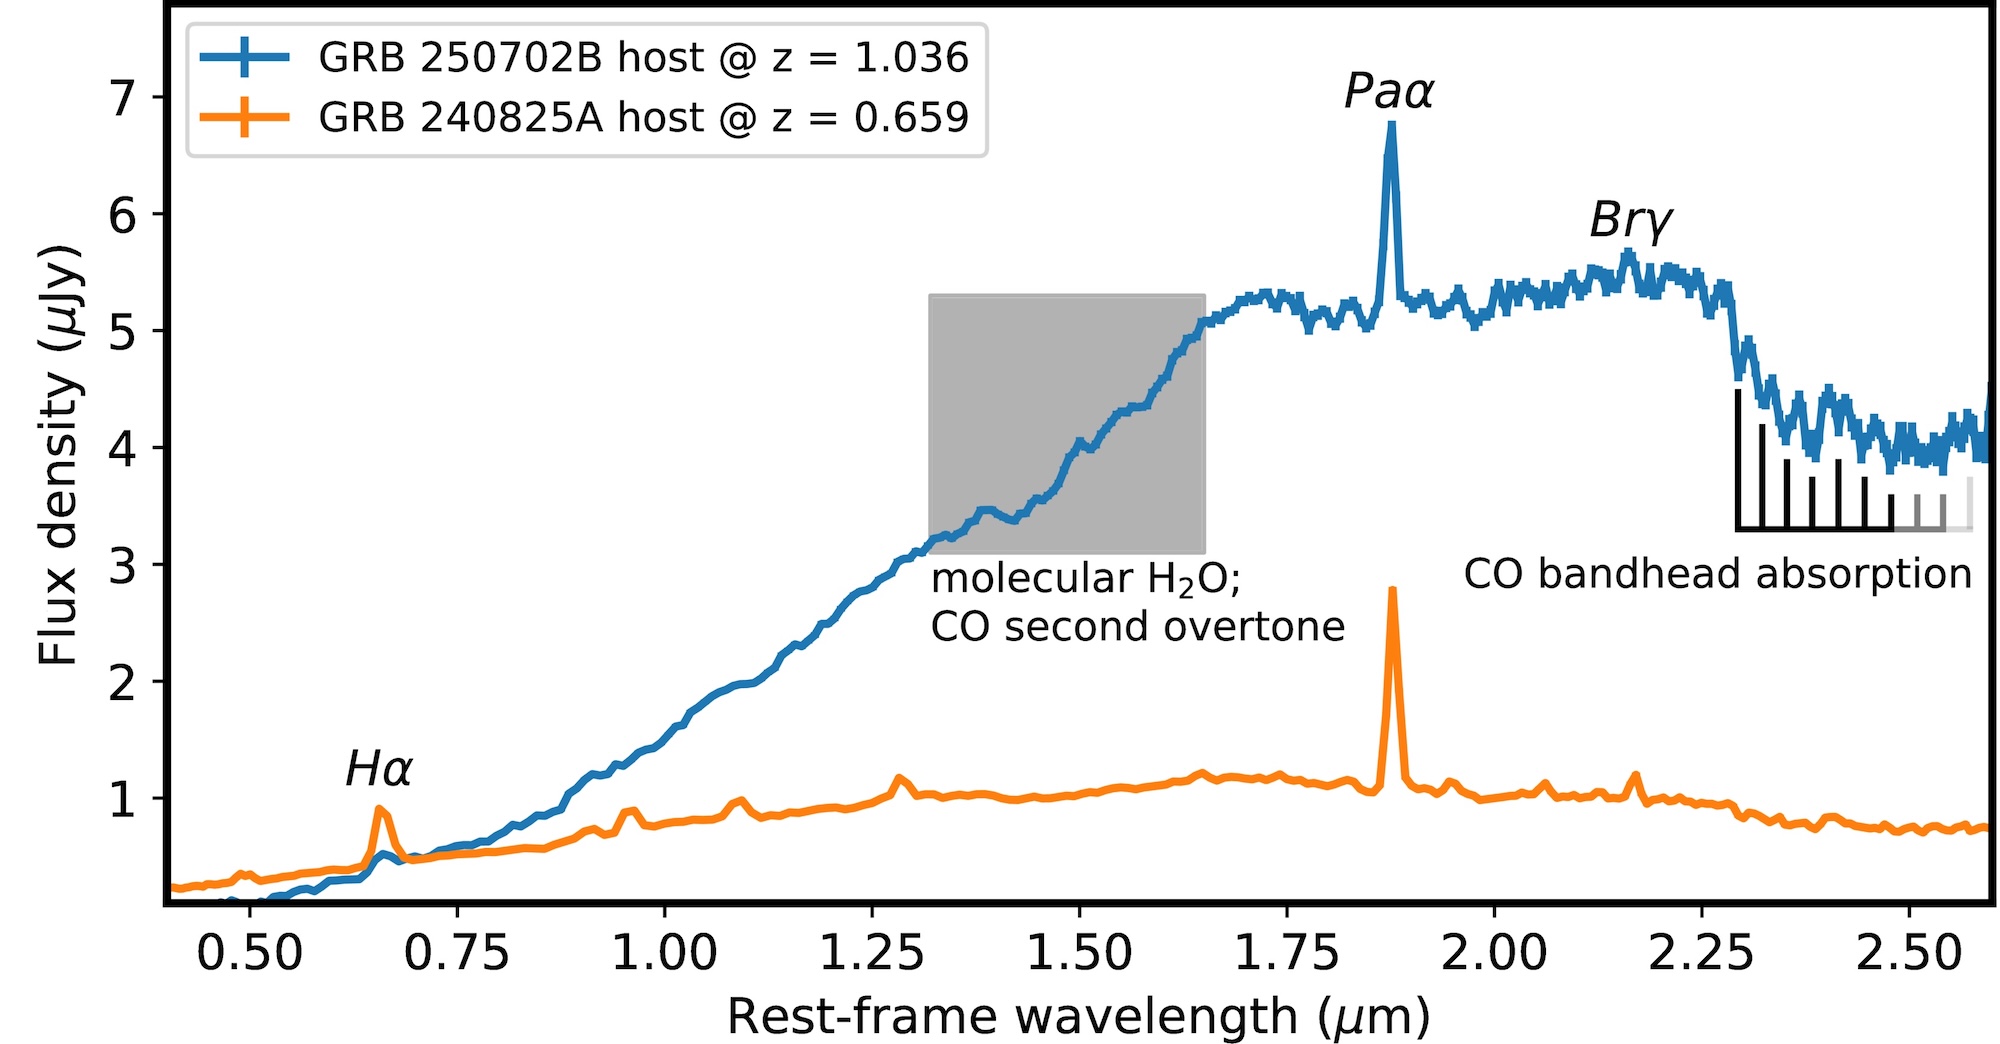
Rest-frame spectrum of GRB 250702B (blue) with the host galaxy spectrum of another burst, GRB 240825A, for comparison (orange). Click to enlarge. [Adapted from Gompertz et al. 2026]

Benjamin Gompertz (University of Birmingham) and collaborators used JWST to investigate GRB 250702B’s birthplace roughly 51 days after the burst was first detected. JWST spectroscopy revealed that GRB 250702B emerged from a galaxy at a redshift of z = 1.036, when the universe was roughly 6 billion years old.

This precisely measured redshift allowed the team to estimate the burst’s energy; in gamma rays alone, the event released at least 2.2 × 1054 ergs. This places GRB 250702B in the top 20 most energetic GRBs known, and the team estimates that events of this kind are 1,000 times less common than other long-duration GRBs and more than 100,000 times less common than typical core-collapse supernovae.

The burst’s host galaxy is also unusual. It’s larger, brighter, and dustier than other galaxies of similar redshift, and it’s unusually massive among GRB host galaxies. In the wavelength range studied here, it also appears to be the most luminous galaxy known to host a GRB.

What Caused GRB 250702B?

Now, to the cause of this unusual burst: is GRB 250702B just a very strange example of a long-duration burst arising from the collapse of a massive star into a black hole, or could it have an entirely different cause, like a star being ripped apart by a black hole?

plot of host galaxy subtracted spectra of GRB 250702B

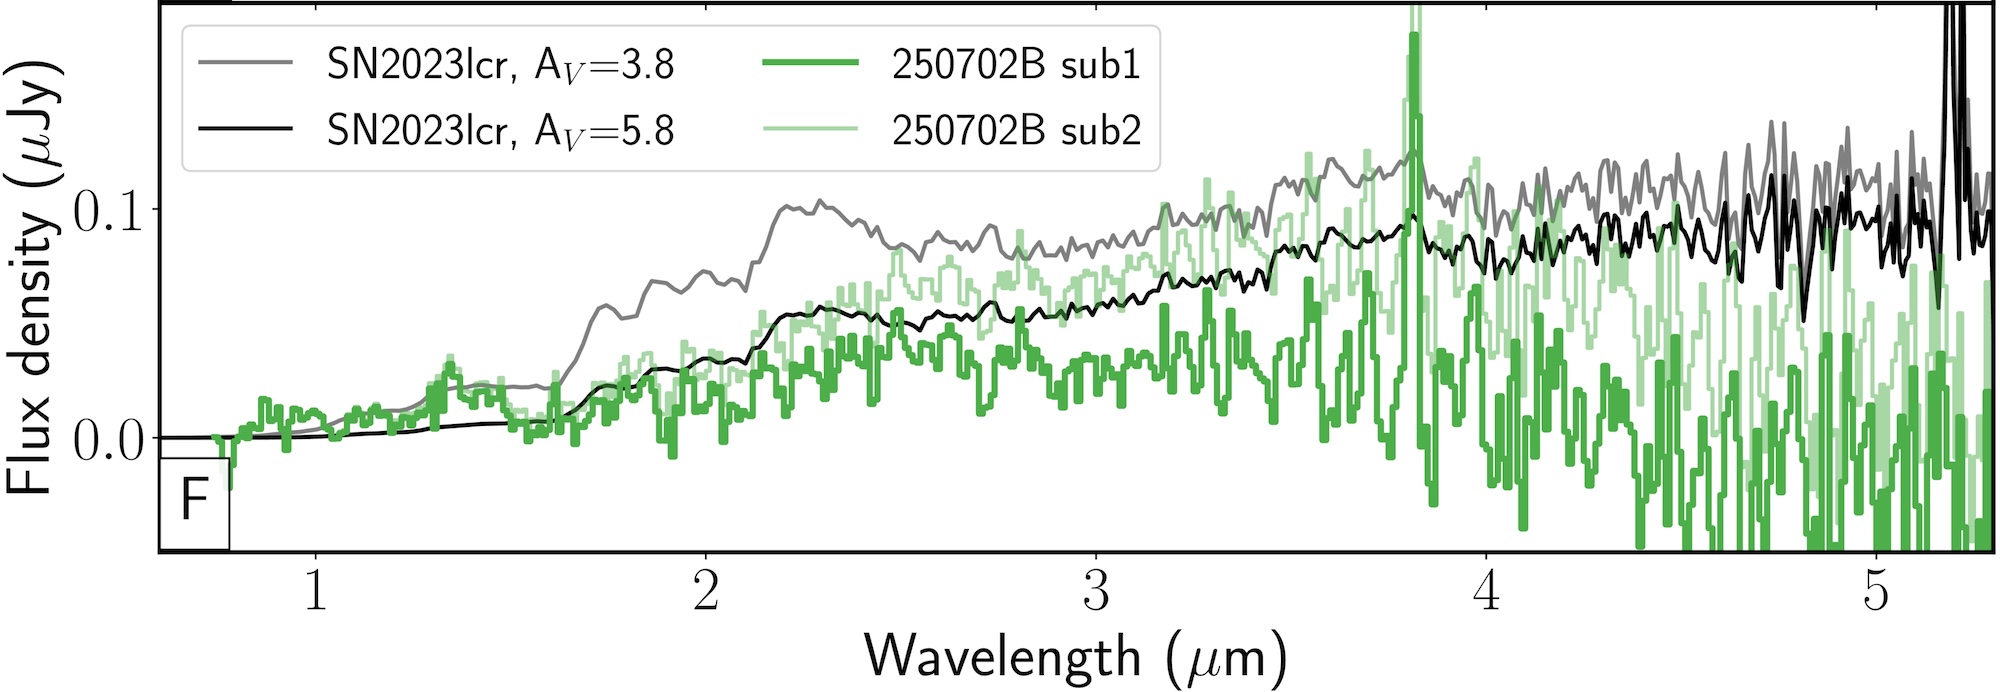
The team placed limits on the supernova emission by subtracting a spectrum of the host galaxy from the event. The green lines show this subtracted spectrum under two different normalization conditions. The black lines show for comparison the emission from the bright supernova SN 2023lcr using two possible extinction values. Click to enlarge. [Adapted from Gompertz et al. 2026]

In the collapsing-massive-star scenario, the GRB would be accompanied by a supernova. Gompertz’s team was able to rule out bright supernova emission, but uncertainties in the level of dust within the host galaxy prevented them from excluding the possibility of a significantly fainter supernova hiding within the dust.

The observations also place constraints on a tidal disruption event scenario, in which a star is ripped apart by a black hole. The data strongly favor a jetted, relativistic tidal disruption event, which makes it difficult to pin down the mass of the black hole involved. The timescales are consistent with a white dwarf spiraling around an intermediate-mass black hole, and other factors suggest that the black hole could be no more than a million solar masses, placing it firmly in the intermediate-mass regime, should this explanation prevail.

With GRB 250702B’s source still unsettled, astronomers will continue to study the burst and its unusual host galaxy. Gompertz and collaborators anticipate that follow-up spectroscopy will provide more clues in this case.

Citation

“JWST Spectroscopy of GRB 250702B: An Extremely Rare and Exceptionally Energetic Burst in a Dusty, Massive Galaxy at z = 1.036,” Benjamin P. Gompertz et al 2026 ApJL 997 L4. doi:10.3847/2041-8213/ae2ed9

The post JWST Follows Up on a Rare Gamma-Ray Burst appeared first on AAS Nova.

  •  

Investigating the Most Luminous Known Fast Blue Optical Transient

luminous fast blue optical transient

Fast blue optical transients are a rare class of emerging transients, the source of which is not yet known. A recent study of the most luminous known object in this class, AT2024wpp, reveals clues about their identity.

A New Class of Transients

In 2018, a network of robotic survey telescopes spotted a new transient source toward a galaxy 200 million light-years away. It was bright and getting brighter rapidly, rising in just a few days to become 10–100 times brighter than the brightest supernovae.

That transient, AT2018cow, was the first of now tens of known sources like it that are too blue, too rapidly evolving, and too luminous to be ordinary supernovae. Despite the growing number of luminous fast blue optical transients (FBOTs) discovered, exactly what causes them is still up for debate.

Brightest of the Bright

Enter AT2024wpp: the most luminous known fast blue optical transient to date. In about a month and a half, this record-breaking event radiated away more than 1044 Joules — which is roughly equivalent to the Sun’s radiative output over 8 billion years. Nayana A. J. (University of California, Berkeley) and collaborators carried out an extensive multi-wavelength observing campaign to track the behavior of AT2024wpp from 2 to 280 days after it was first discovered, making it only the second FBOT to undergo such detailed study. This research article describes the team’s findings at radio and X-ray wavelengths.

X-ray behavior of AT2024wpp

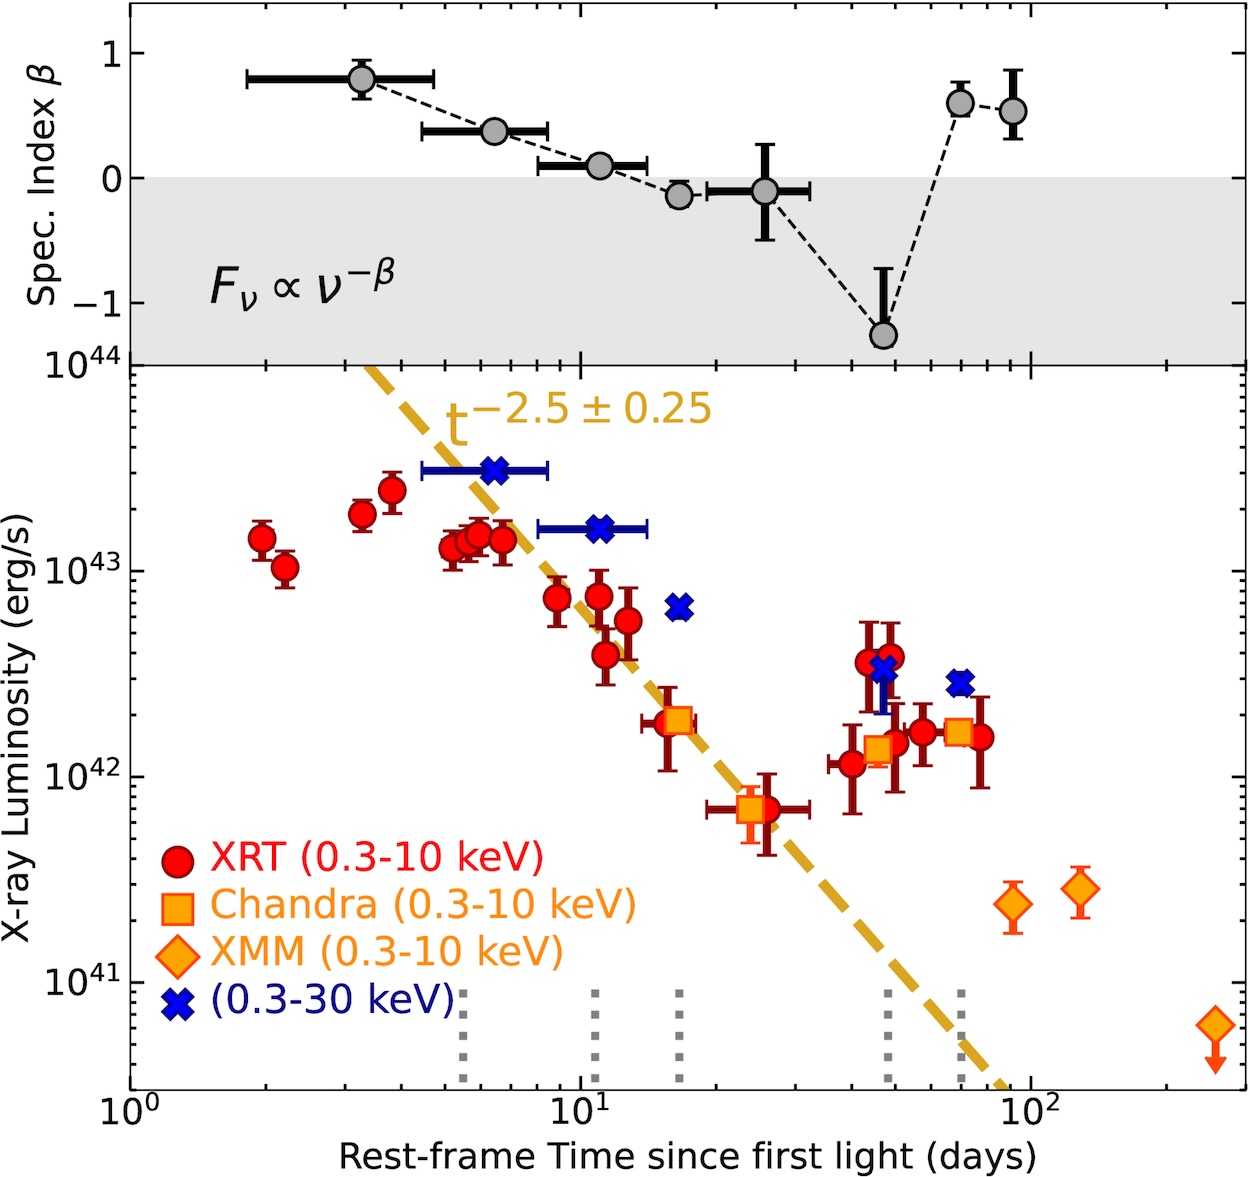
X-ray behavior of AT2024wpp. The top plot demonstrates the hardening of the spectral index (i.e., shifting toward higher energies) around the peak at 50 days. Click to enlarge. [Nayana A. J. et al. 2025]

The team enlisted the Atacama Large Millimeter/submillimeter Array, the Australian Telescope Compact Array, the Allen Telescope Array, the MeerKAT array, and the Giant Metrewave Radio Telescope to survey the source from 0.25 to 203 GHz. On the opposite end of the spectrum, they collected observations from the Neil Gehrels Swift Observatory, the Chandra X-ray Observatory, XMM-Newton, and NuSTAR to probe AT2024wpp’s X-ray emission from 0.2 to 79 keV.

These observations revealed that AT2024wpp’s X-ray emission remained bright and constant for 7 days before plummeting until day 30. The emission then rocketed up again, peaking at day 50, and shifted toward higher energies. Finally, things settled down to a lower brightness around day 75. In the radio, AT2024wpp’s behavior was complex, showing a never-before-seen meteoric rise at millimeter wavelengths around 17–32 days.

Comparison of the density of the material surrounding AT2024wpp and other FBOTs

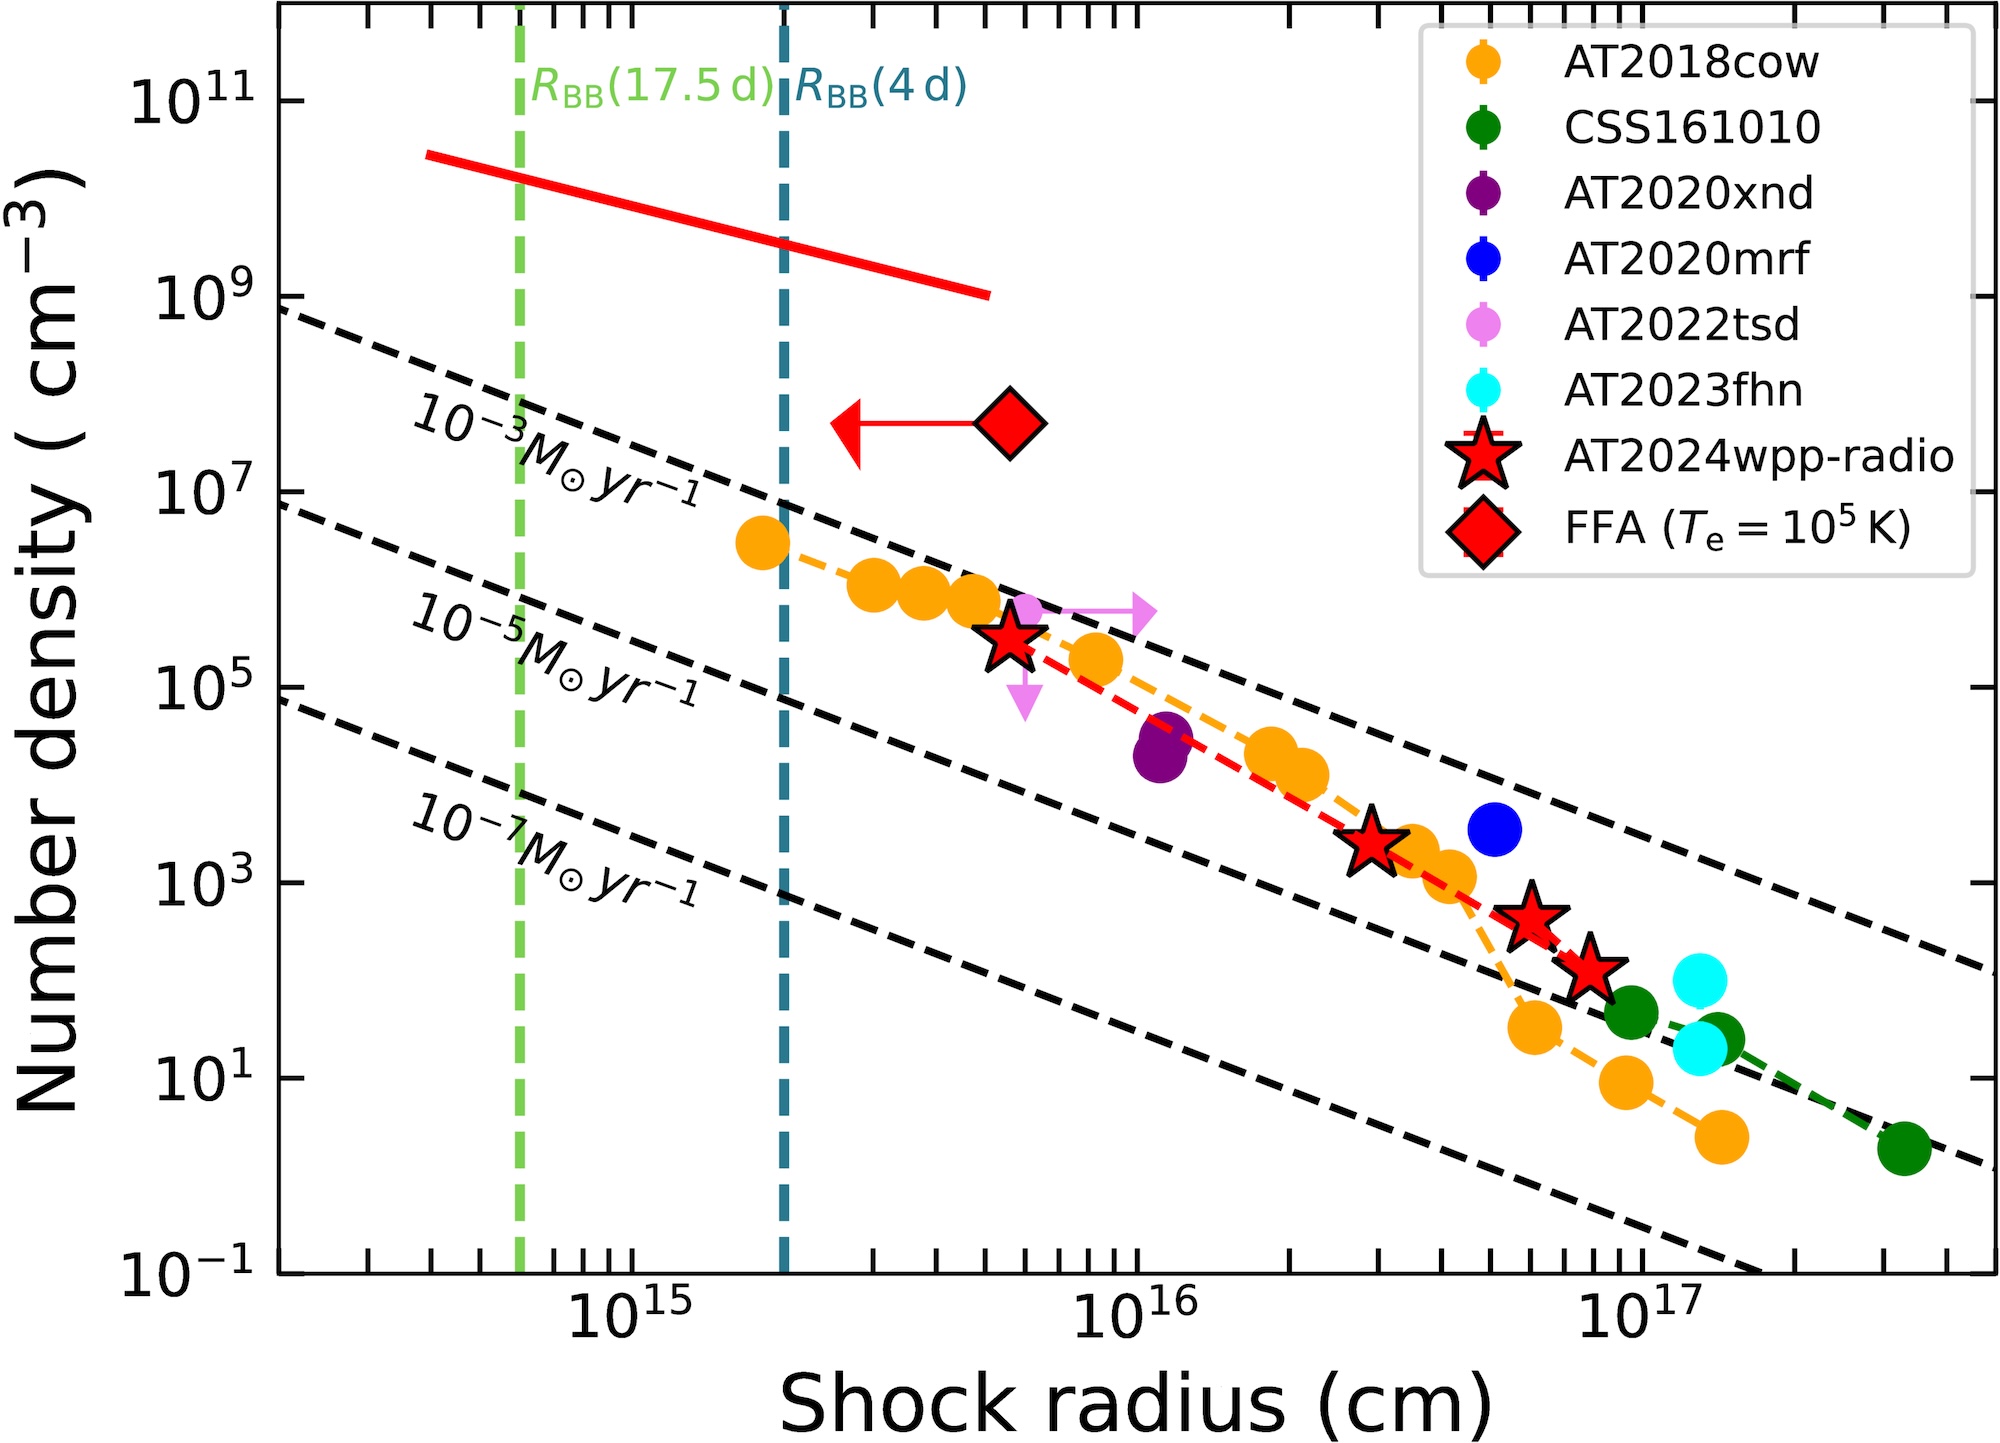
Comparison of the density of the material surrounding AT2024wpp (red stars) and other FBOTs. Click to enlarge. [Nayana A. J. et al. 2025]

Possible Scenarios

Based on these observations, the team favors a scenario involving a central compact object — a black hole or a neutron star — that is rapidly accreting matter from its surroundings. This accretion powers outflows that accelerate to more than 40% the speed of light and send a shock through dense material around the system. Notably, the team found that the density of the surrounding material is similar among FBOTs that have bright radio emission, including AT2024wpp. This suggests that similar processes are responsible for setting up these events.

The team pointed to two scenarios from the literature that are compatible with their data. In the first, a newborn neutron star or black hole collides with a stellar companion, ripping the star apart and accreting its remains. In the second, a Wolf–Rayet star (a massive star that has shed much of its atmosphere and is nearing its eventual end as a supernova) is tidally disrupted by a neutron star or a black hole. Though it’s not possible to narrow the possibilities further, the immense energies involved tilt things in favor of a black hole rather than a neutron star.

Though FBOTs remain mysterious, additional multi-wavelength studies like this one can help to illuminate their origins. And with the Ultraviolet Transient Astronomy Satellite (ULTRASAT) and UltraViolet EXplorer (UVEX) missions slated to launch within the next five years, we can expect many more FBOT discoveries in the near future.

Citation

“The Most Luminous Known Fast Blue Optical Transient AT 2024wpp: Unprecedented Evolution and Properties in the X-Rays and Radio,” Nayana A. J. et al 2025 ApJL 993 L6. doi:10.3847/2041-8213/ae0b4d

The post Investigating the Most Luminous Known Fast Blue Optical Transient appeared first on AAS Nova.
  •  

Ultra-High-Energy Neutrino Emission on the Extragalactic Express: A Mystery

galaxy Phaedra

Editor’s Note: Astrobites is a graduate-student-run organization that digests astrophysical literature for undergraduate students. As part of the partnership between the AAS and astrobites, we occasionally repost astrobites content here at AAS Nova. We hope you enjoy this post from astrobites; the original can be viewed at astrobites.org.

Title: ASKAP and VLASS Search for a Radio-Continuum Counterpart of Ultra-High-Energy Neutrino Event KM3–230213A
Authors: M. D. Filipović et al.
First Author’s Institution: Western Sydney University
Status: Published in ApJL

The Scene of the Crime

On Galentine’s Day this year, an ultra-high-energy neutrino attempted to sneak through the Mediterranean Sea, likely expecting she wouldn’t be caught. The odds were in her favor; neutrinos, ghostly particles with no electric charge and infinitesimal mass, only very rarely interact with matter. However, what she failed to account for was the awaiting undersea neutrino detector, KM3NeT, and the clever lepton within who would finally notice her. She slammed into the lepton, spewing charged particles everywhere at speeds greater than the speed of light in the water. While no particle can outrun a photon in a vacuum, water slows light down, giving us the familiar effect of refraction; similar to supersonic jets creating a boom when they break the sound barrier, these charged particles produced a distinctive blue light, known as Cherenkov light, exposing the neutrino’s position to astronomers and physicists everywhere. Busted.

The Investigation Begins

However, the neutrino was only the messenger; of even more interest is the astrophysical object that produced her. It’s not easy to generate such a high-energy particle, and no one can create a neutrino from thermal emission alone, indicating that wherever she originated, something extreme was going on. To date, only three astrophysical sources have been caught emitting neutrinos at all, and none of them are extragalactic: the Sun, although this is old news (in the 1960s, detections of solar neutrinos showed definitively that the Sun is powered by nuclear fusion, resolving the issue of how the Sun has burned long enough for life to evolve on Earth); the nearest core-collapse supernova to our galaxy in modern times, SN 1987A; and the galactic plane.

Theoretical models predict a much wider variety of objects, including extragalactic sources, to produce neutrinos, usually via cosmic-ray production: supernova remnants, star-forming galaxies, gamma-ray bursts, supermassive black holes (which are found at the centers of most galaxies), active galactic nuclei (a particularly fussy subset of supermassive black holes that are eating their host galaxies), and blazars (an extreme subset of active galactic nuclei that emit jets of radio light directly at Earth). The reason we have not detected their predicted neutrino emission is that neutrino astronomy is a new field, extragalactic sources are super far away, and neutrinos are both difficult to detect and difficult to trace back to their origin.

Rounding Up Suspects

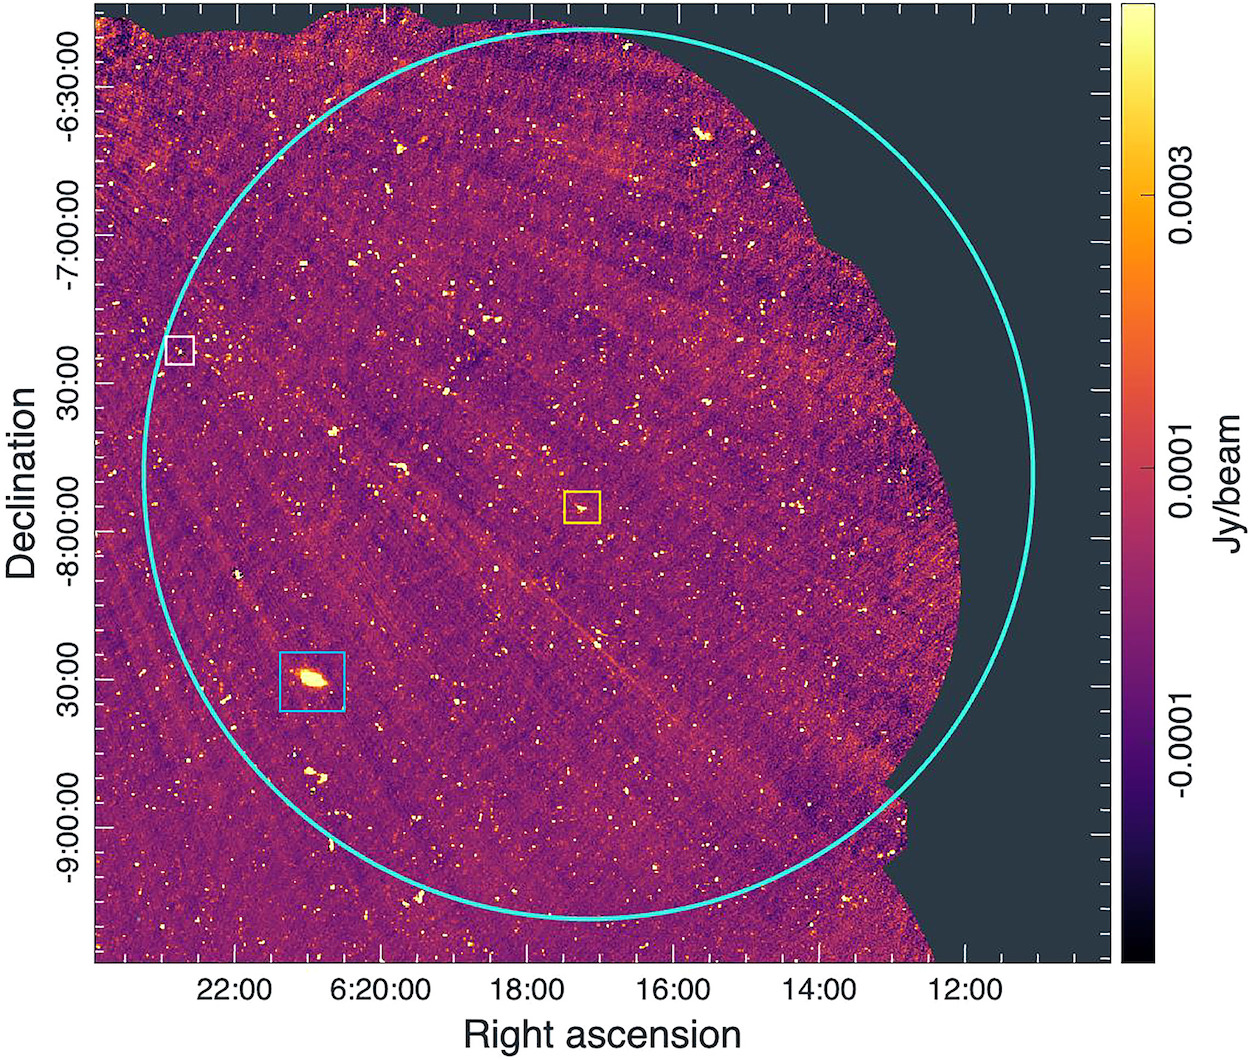
With this in mind, today’s authors embark on a quest to catch the culprit, starting in the radio band. Radio emission, like neutrino emission, is usually an indicator of non-thermal radiative processes, and one such process, synchrotron radiation (emitted by relativistic electrons getting spun around in powerful magnetic fields), can be distinguished from other types of radiation based on its radio characteristics. Conveniently, the region our neutrino hails from is spanned by multiple radio surveys conducted with the Very Large Array (VLA) and the Australian Sub-Kilometer Compact Array Pathfinder (ASKAP), and so our authors use these surveys to round up all the radio riffraff. Unfortunately, the long wavelengths of radio photons and the scarcity of neutrinos result in reduced resolution for both compared to traditional optical telescopes, and our authors find over a thousand radio emitters in the region. Of course, no one can question that many sources, so our authors limit their investigation to objects with at least two radio brightness measurements, which can be used to calculate the brightness as a function of radio wavelength (the spectral energy distribution, which tells us about what type of radiation we see) and/or as a function of time (a light curve, which tells us if our source is variable). Our authors settle on a lineup of 10 likely blazars, any of whom could have emitted our ultra-high-energy neutrino, as well as a shortlist of prime suspects warranting further investigation: Phaedra, a spiral galaxy; Hebe, a radio galaxy; and Narcissus, an unusual compact radio emitter (see Figure 1).

radio emission from the region of sky from which the neutrino originated

Figure 1: Radio emission detected by ASKAP in the region of the sky in which the neutrino originated. Every yellow dot should be considered suspect, but the three colored squares identify the primary guilty parties: Phaedra (in blue), Hebe (in yellow), and Narcissus (in pink). [Filipović et al. 2025]

Phaedra: A Spiral Galaxy with a Secret?

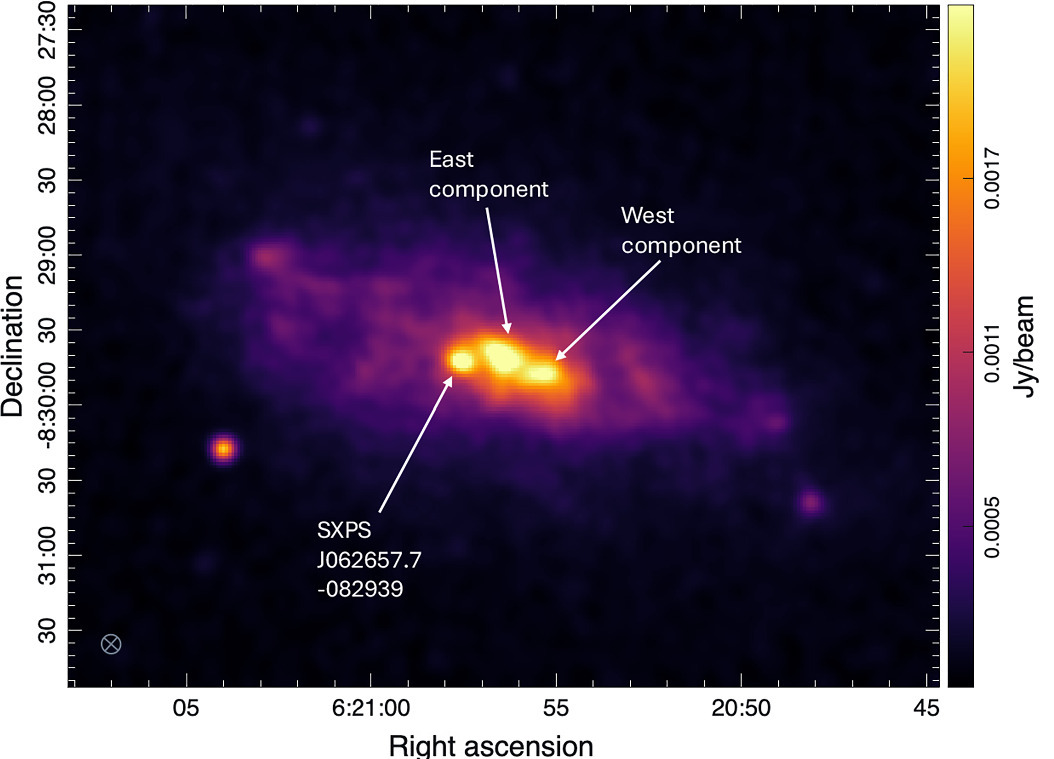
Phaedra (Figure 2), the most radio-luminous in the area, exhibits plenty of behavior typical of a galaxy guilty of neutrino emission. For starters, she has two regions of highly concentrated radio emission, and these regions are offset from her center, making them look suspiciously like active galactic nucleus jets, which are excellent particle accelerators. Furthermore, infrared observations suggest she is a starburst galaxy, churning out stars faster than a bestselling author with a team of ghostwriters churns out books. This intense star formation could have easily been triggered by jet activity. Even more suspiciously, she is closely associated with an X-ray binary, and where there are high-energy photons, there are likely to be other high-energy particles like neutrinos and cosmic rays. Phaedra’s prospects of beating the neutrino emission allegations are not looking good; these high-energy phenomena produce buckets of high-energy particles, and even if they produce only cosmic rays, the cosmic rays are bound to crash into the surrounding dense gas and photons, creating neutrinos anyway.

radio image of Phaedra

Figure 2: Radio image of Phaedra, one of our suspects. The east and west components are the likely radio jets, and the third bright blob is the radio counterpart to the X-ray binary, SXPS J062657.7-082939. [Adapted from Filipović et al. 2025]

Hebe: A Simple Radio Galaxy, or Something More?

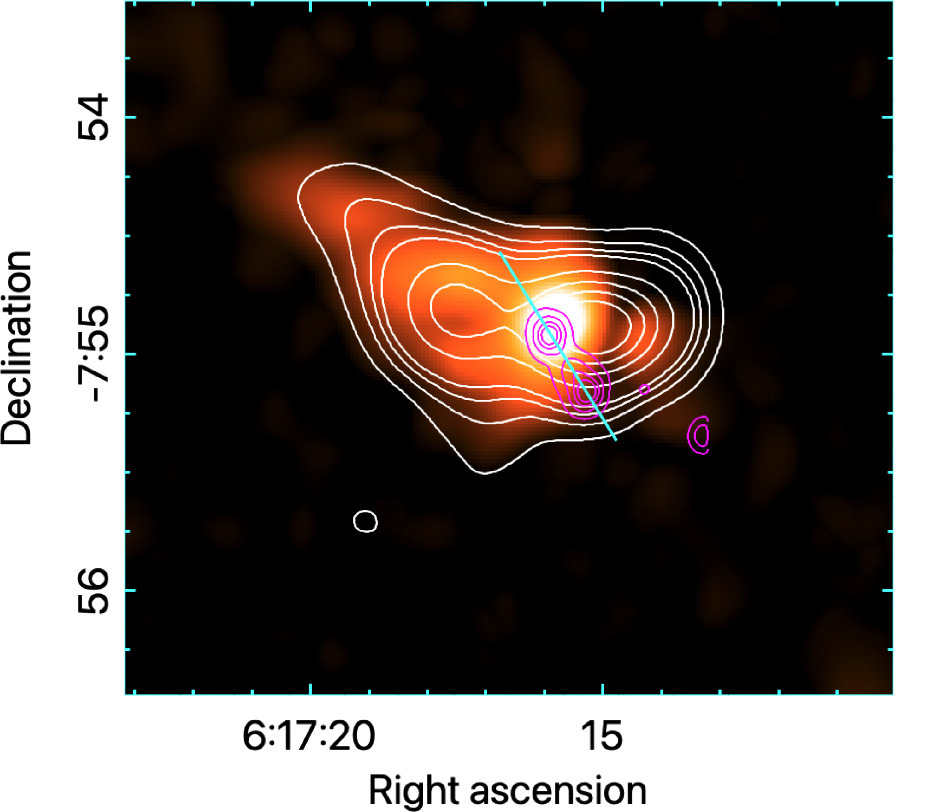
Hebe (Figure 3), the nearest extended radio source, isn’t exactly innocent-looking either. She is one of a triplet of galaxies sharing a common envelope, like peas in an extragalactic pod. Galaxies, unlike peas, however, are so massive that they can’t help but interact dynamically in such close quarters, causing a commotion that could totally produce ultra-high-energy neutrinos. She likely also has an active galactic nucleus jet, giving her the same neutrino-wielding powers as Phaedra.

infrared image of Hebe

Figure 3: An infrared image of Hebe that clearly shows the common envelope surrounding the triplets. The white contour lines denote levels of polarized intensity, which indicate the presence of a magnetic field. [Adapted from Filipović et al. 2025]

Narcissus: Double Active Galactic Nucleus?

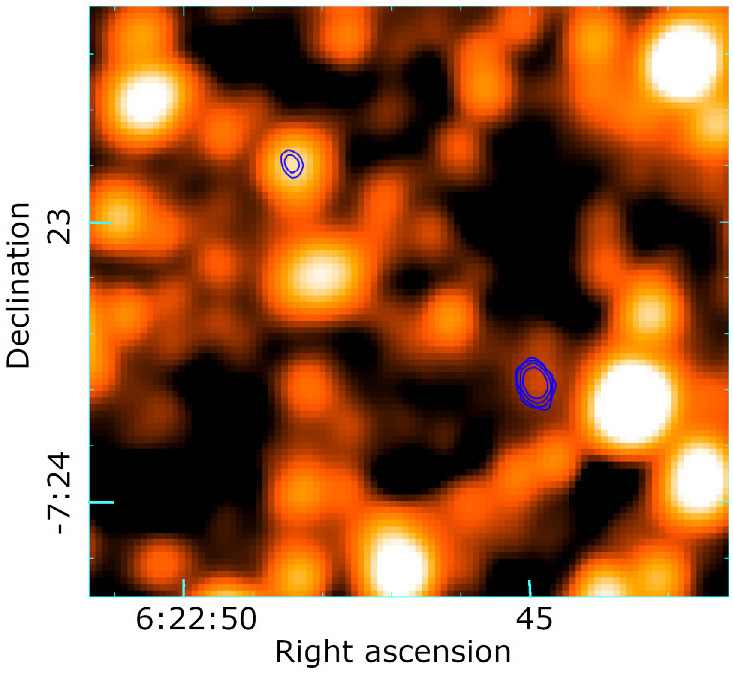
Our final suspect, Narcissus (Figure 4), consists of not one, but two active galactic nuclei. One appears to exhibit the classic synchrotron spectral energy distribution, and the other is likely a blazar, based on his notable radio variability and infrared observations.

infrared image of Narcissus

Figure 4: Infrared image of Narcissus, with the purple contours outlining the two radio sources that are likely active galactic nuclei. [Adapted from Filipović et al. 2025]

Solving the Mystery

So, who really emitted the ultra-high-energy neutrino? For now, our authors can’t jump to any firm conclusions — they’d never risk condemning an innocent galaxy — but they will continue to closely monitor the suspects and gather more evidence. In the meantime, Phaedra, Hebe, and Narcissus should find themselves a good defense attorney experienced in neutrino emission cases.

Original astrobite edited by Sandy Chiu.

About the author, Chloe Klare:

I’m a PhD student in astronomy and astrophysics at Penn State (with a physics minor, so I get to use my semester spent in QFT for something!). I study active galactic nuclei (in the radio!), and I’m currently looking for baby synchrotron jets in active galactic nuclei.

The post Ultra-High-Energy Neutrino Emission on the Extragalactic Express: A Mystery appeared first on AAS Nova.
  •  

Black Hole vs. Magnetized Neutron Star: Matchup Predictions

Artistic representation of the merger of a neutron star and a black hole

When a black hole consumes a neutron star, it’s typically thought to do so without an electromagnetic belch. New research explores the conditions under which a black hole’s neutron-star feast produces an observable electromagnetic signal.

Signaling a Collision

In the past few years, gravitational-wave detectors across the globe have detected a handful of neutron star–black hole mergers. What sorts of electromagnetic signals might accompany these outbursts of gravitational waves is a matter of intense interest.

In rare cases, if the black hole and neutron star are relatively close in mass, their gravitational tussle will rip the neutron star apart. As the shredded stellar material collects in a searingly hot disk around the black hole, it is expected to power a bright transient like a kilonova or a gamma-ray burst.

More commonly, the black hole is much more massive than the neutron star. In this case, the black hole should swallow the neutron star whole and without an electromagnetic trace — unless, as recent research shows, a strong magnetic field surrounds the neutron star.

Detailed Simulations

simulated merger of a neutron star and a black hole

The simulated merger of a neutron star and a black hole, in which the neutron star is swallowed whole. Click to enlarge. [Kim et al. 2025]

Yoonsoo Kim (California Institute of Technology) and collaborators used general relativistic magnetohydrodynamic simulations to explore the electromagnetic signals that might accompany the collision of a black hole and a magnetized neutron star. The simulations follow an 8.0-solar-mass black hole as it merges with a 1.4-solar-mass neutron star with a magnetic field of roughly 1016 Gauss — more than 10 quadrillion times the strength of Earth’s magnetic field.

As the simulated neutron star plunges toward the black hole, the neutron star’s magnetosphere — the region of space in which particles bend to the will of the neutron star’s magnetic field — begins to ripple with waves. The waves expand outward at nearly the speed of light, launching an exceptionally massive shock. This monster shock drives the creation of an electromagnetic transient: a flash of radio waves called a fast radio burst.

plot showing the striped, pulsar-like wind structure

The “striped” pulsar-like wind, shown at 7 milliseconds post-merger. The color scale shows the toroidal magnetic field component. [Adapted from Kim et al. 2025]

Striped Winds and a Fleeting Pulsar Phase

A second type of transient arises after the neutron star merges with the black hole. After the neutron star vanishes within the black hole’s waiting maw, its leftover magnetic field rearranges and begins to rotate, dragged along by the spinning black hole. Briefly, the black hole enters a pulsar-like state, surrounded by a “striped” wind created by spiraling magnetic field lines in alternating directions. As this magnetic field dissipates, a “fireball” of magnetized electron–positron plasma is ejected. When these electron–positron pairs annihilate, they briefly release another electromagnetic signal: a burst of X-rays and gamma rays.

Kim and coauthors noted that their simulated neutron star–black hole pair is similar in mass to the colliding pairs spotted by gravitational-wave detectors. This suggests that detectable gravitational-wave events may be accompanied by brief bursts at radio, X-ray, and gamma-ray wavelengths, providing another avenue to learn about these cosmic collisions.

Citation

“Black Hole Pulsars and Monster Shocks as Outcomes of Black Hole–Neutron Star Mergers,” Yoonsoo Kim et al 2025 ApJL 982 L54. doi:10.3847/2041-8213/adbff9

The post Black Hole vs. Magnetized Neutron Star: Matchup Predictions appeared first on AAS Nova.

  •  

Messier 82 (Star)bursts onto the Scene!

Messier 82

Editor’s Note: Astrobites is a graduate-student-run organization that digests astrophysical literature for undergraduate students. As part of the partnership between the AAS and astrobites, we occasionally repost astrobites content here at AAS Nova. We hope you enjoy this post from astrobites; the original can be viewed at astrobites.org.

Title: An In-Depth Study of Gamma Rays from the Starburst Galaxy M82 with VERITAS
Authors: The VERITAS Collaboration
Status: Published in ApJ

Starbursts: Not Just a Candy!

Cosmic rays are charged particles (electrons, protons, and atomic nuclei) that we’ve known about for more than a century. These particles notoriously zig and zag around the universe due to magnetic fields that attract them and then shoot them off in whichever direction the field goes. This makes it really hard to figure out what’s making them, especially because we detect them up to really high energies (petaelectronvolt-scale) — thousands of times more energetic than the particles accelerated at accelerators like the Large Hadron Collider! The mystery of what out there in the universe is making cosmic rays at these high energies has plagued astronomers ever since we discovered that cosmic rays exist in the first place.

Luckily, there are other ways to figure out where these enigmatic particles are made, including using plain old light — namely, gamma rays. Cosmic rays produce gamma rays in all sorts of different interactions with the material in the sources where they’re born. In other words, a cosmic-ray source should also be a gamma-ray source! By looking at how the gamma rays from a given astronomical object are distributed in brightness and energy (i.e., the spectral energy distribution), we can figure out what sort of cosmic rays make the gamma rays we observe and identify the big cosmic-ray factories of the universe.

Starburst galaxies (often just called “starbursts”), as their names imply, are galaxies that are forming stars very quickly — at rates 10–30 times higher than the Milky Way. This is probably just a phase, though, since these galaxies will quickly use up all their star-forming material (i.e., gas and dust) and will need to wait for this material to be re-released in supernovae or planetary nebulae when their stars eventually die.

We’ve long thought that starbursts might be cosmic-ray factories, as they host several high-energy processes such as supernovae and stellar winds launched by massive stars, hitting the dense material in star-forming regions. Since these processes don’t occur on anywhere near the same scales in our own Milky Way galaxy, we need to look elsewhere to understand if these processes are responsible for cosmic-ray production.

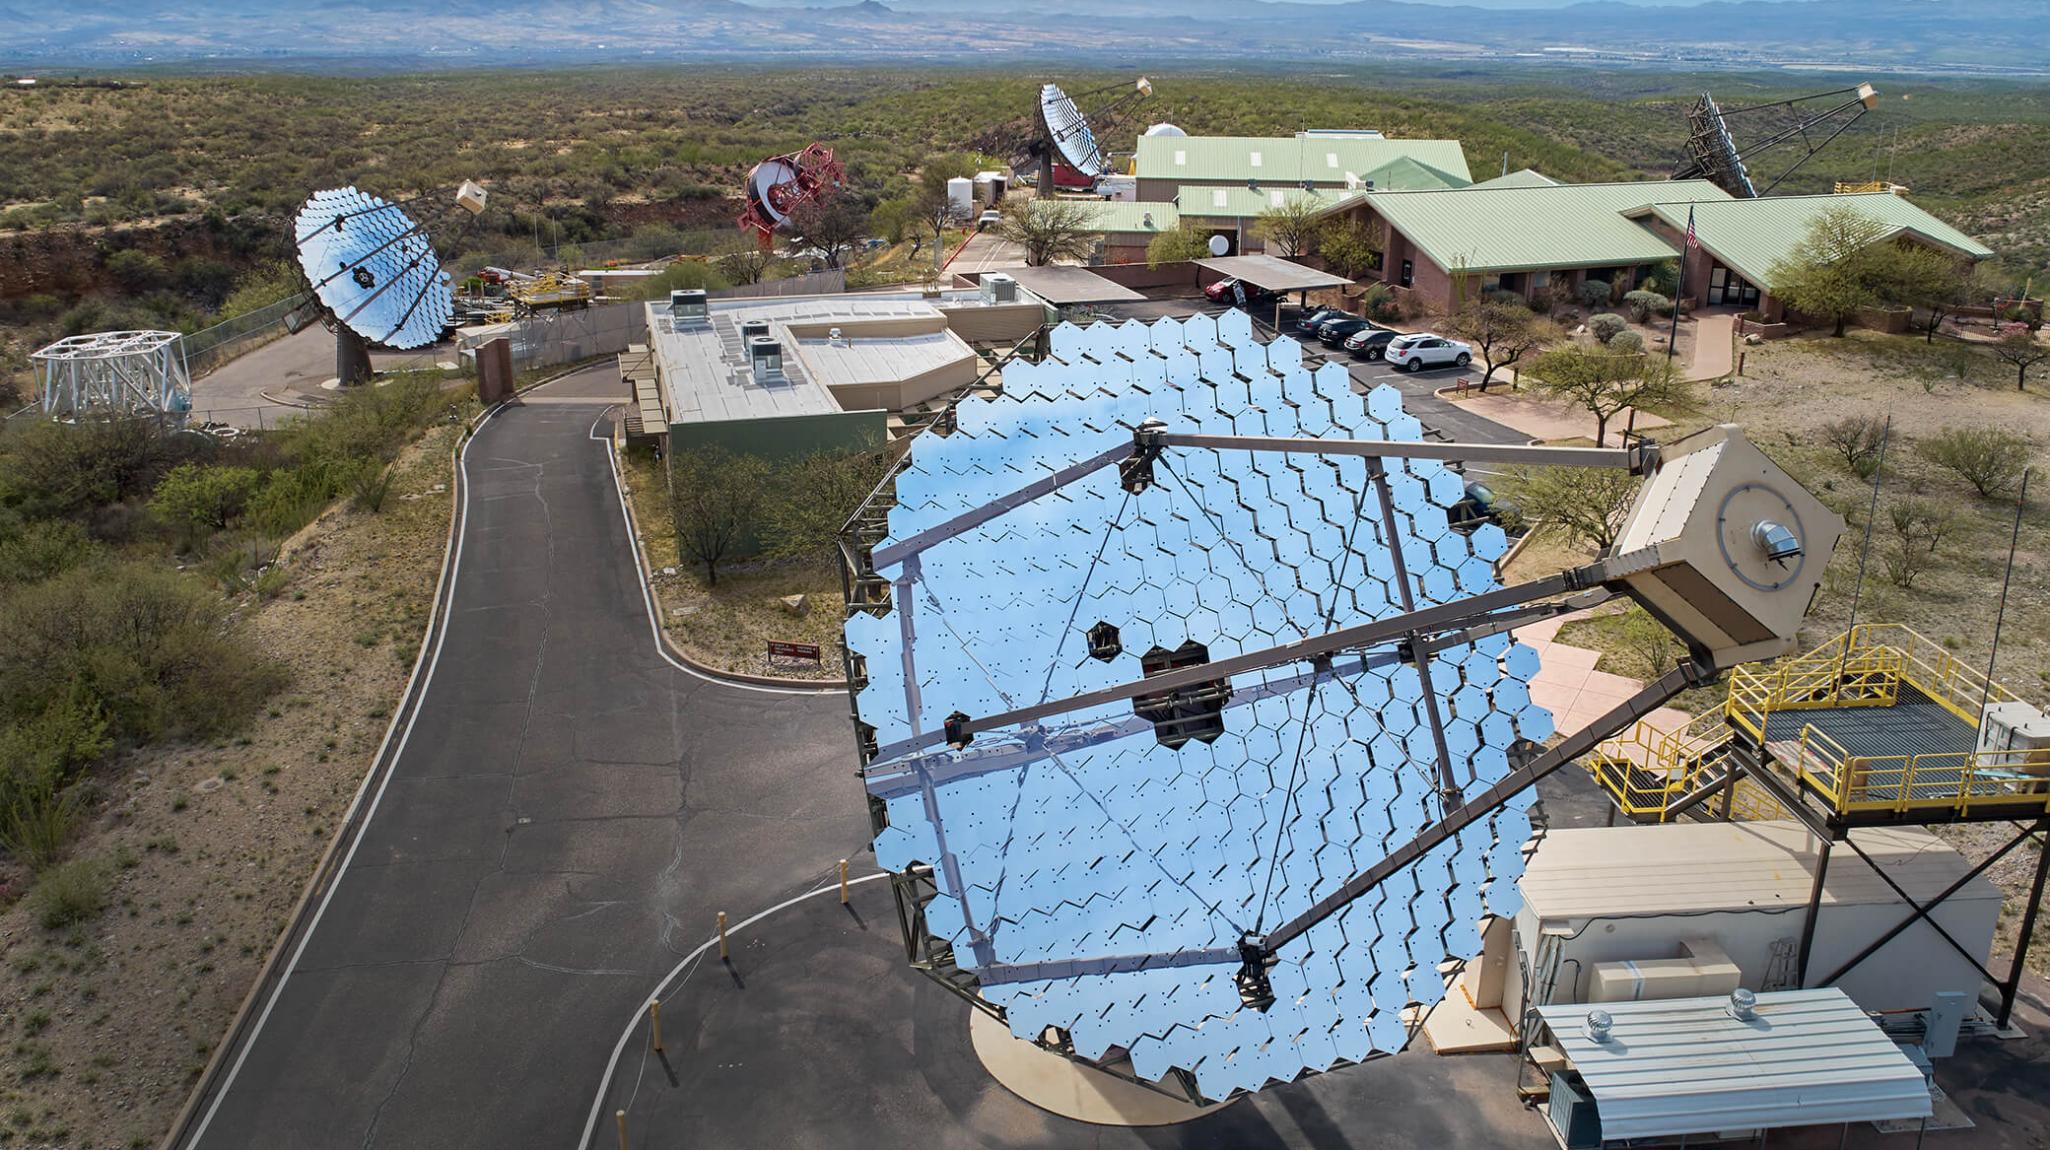
VERITAS gamma-ray telescopes

Figure 1: The VERITAS gamma-ray telescopes, which are located in southern Arizona, USA. [Center for Astrophysics | Harvard & Smithsonian]

Today’s authors look at the nearby starburst galaxy Messier 82 (also known as M82 or the Cigar Galaxy for its distinctive oblong shape; see the image at the top of this post) using 335 hours of data taken over 15 years of observations with the Very Energetic Radiation Imaging Telescope Array System (VERITAS) gamma-ray telescopes (Figure 1). They dive deeper into M82’s gamma rays than ever before and try to piece together what sorts of cosmic rays might be making these gamma rays. If starbursts are cosmic-ray factories, it’s also possible that the galaxy’s brightness can tell us directly the number of cosmic rays it’s made during star formation episodes, allowing cosmic rays to be studied much more easily than ever before.

Long Time, No Gammas

Today’s article follows up on a previous attempt to study M82 with VERITAS in 2009, which frustratingly resulted in the weakest detection VERITAS has ever reported — even after 137 hours of observations! More than a decade later, the VERITAS collaboration is back with a solid detection of gamma-ray emission from M82 (see Figure 2) and enough data to give M82 the attention it deserves!

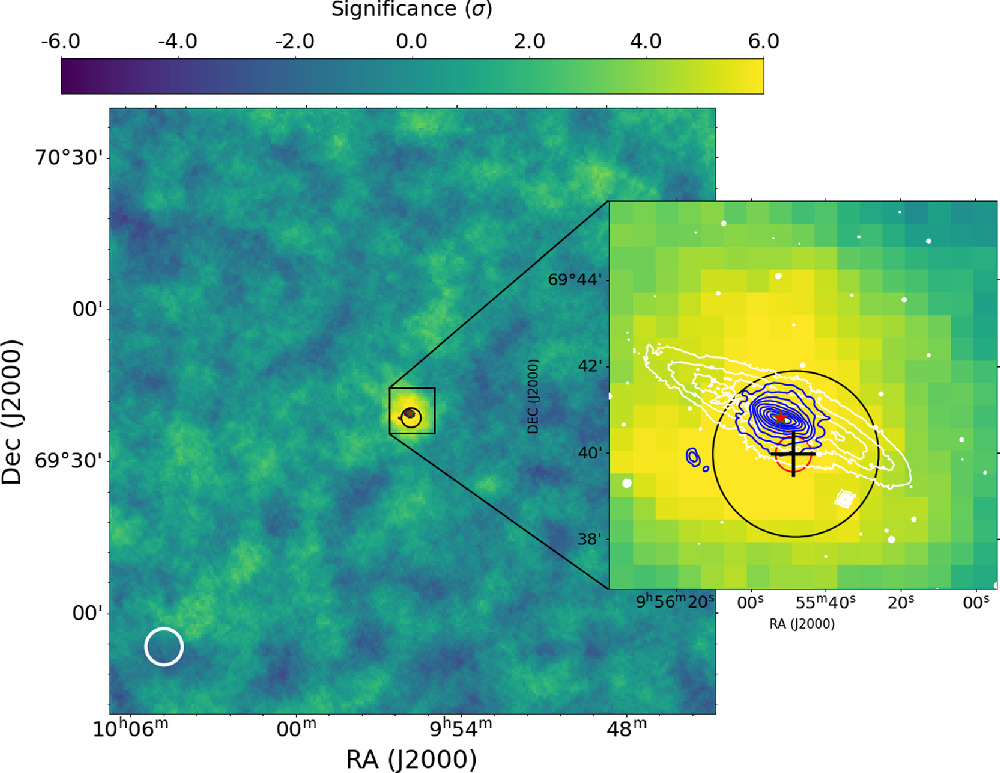
sky map of the region surrounding M82

Figure 2: Sky map of the region surrounding M82, showing the statistical significance that the gamma rays observed aren’t just random background gamma rays or cosmic rays (higher significance is better!). The angular resolution of gamma-ray telescopes is not very good compared to other wavelengths. This can be seen in the inset, which shows the contours of optical data (white) and radio data (blue), with the best-fit and location of the VERITAS data denoted by the black circle and cross. The white circle in the bottom left shows VERITAS’s point spread function, which dictates the resolution of the image. [VERITAS Collaboration 2025]

It’s All in the Spectrum!

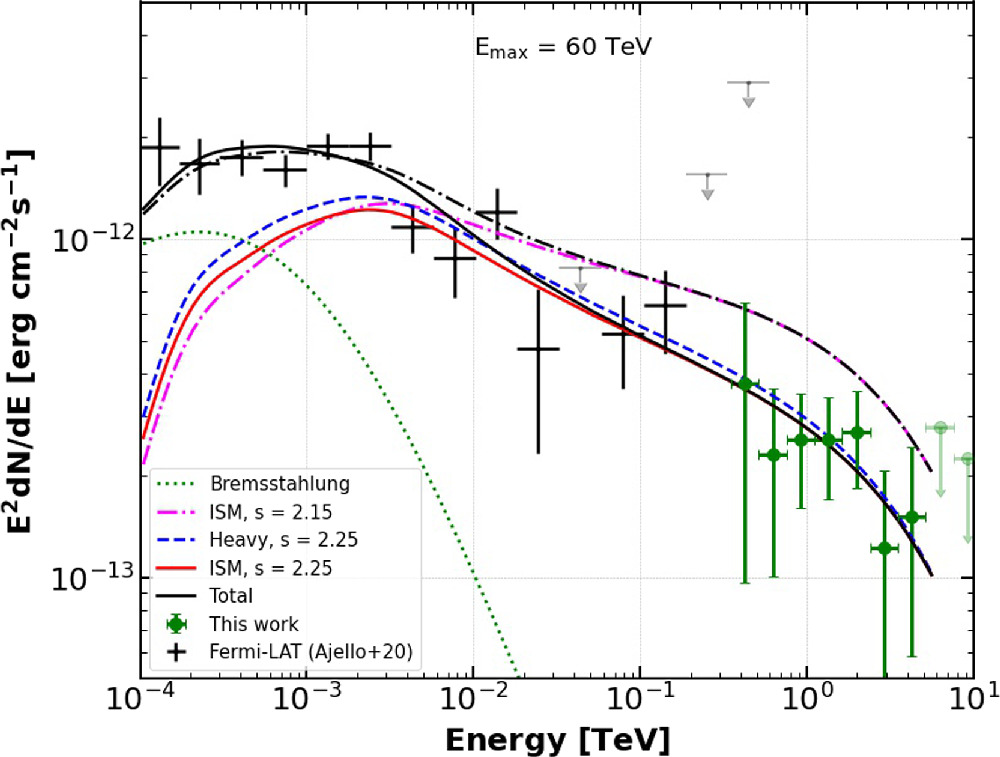
Even though M82 is 12 million light-years away (or more than a billion trillion kilometres), we can still learn an incredible amount of information about its subatomic particles, which are over half a million times smaller than a single human hair! The authors accomplish this by looking at the spectral energy distribution (see Figure 3), which shows how M82’s brightness changes with the energy (or frequency) of the gamma rays and any other light we observe.

leptonic and hadronic fits to the gamma-ray emission from M82

Figure 3: The leptonic and hadronic fits to the gamma-ray emission from M82, with Fermi-LAT data in black and VERITAS data in green. The leptonic (electron-only) model is shown by the green dashed line (called bremsstrahlung or braking radiation). The hadronic components are any of the pink, blue, or red lines, with each representing different average particle masses (denoted here with the particle’s rigidity, s, which is sort of a proxy for mass — or more precisely, how easily the particle is deviated by magnetic fields). They infer the types of particles from our own galaxy’s interstellar medium (ISM) and assume that M82 should be similar. All of these components are needed to find a fit to the data, as represented by the black solid line. [VERITAS Collaboration 2025]

The authors use simulations of how the gamma-ray spectral energy distribution would look if all the gamma rays were produced by only electrons, only protons/nuclei (together called hadrons), or a mix of both, in order to create models to fit the observed data. The reason for the distinction between particles is that electrons are the much less exciting cousin to protons and nuclei. (Sorry, electrons.) Electrons are light and fairly easy to accelerate but lose their energy pretty quickly, meaning that they can’t make up most of the high-energy cosmic-ray population that the authors are interested in. We don’t know of any astronomical sources that produce the hadrons we detect on Earth, so nailing down M82 as a hadronic source would be huge for tracking down these pesky cosmic-ray factories.

What gets a little bit hairy is that hadronic particle interactions (protons/nuclei hitting things, accelerating, decaying, etc.) will also make a bunch of electrons called secondary electrons in the process, making it so that the authors are unlikely to see the proton/nuclei-only scenario. The spectrum is more likely to look more like a blend of both electrons and hadrons, even if electrons aren’t initially involved. These electrons are created after sudden bursts of star formation produce a bunch of cosmic rays, which will go on to make these secondary electrons that will stay within the galaxy over much longer timescales, leaving a lasting imprint of the cosmic-ray production that can be measured long after the star formation stops.

The authors compare leptonic (electron-only) and hadronic models to the observed gamma-ray data, to see which particles are responsible for making the gamma rays. They find that at least some hadronic component is needed to fit the observed gamma-ray data from the Fermi Large Area Telescope (Fermi-LAT) and VERITAS (see Figure 3), meaning that M82 is probably making cosmic rays that are protons and nuclei. They can also infer properties of the cosmic rays, such as the maximum energy of 60 teraelectronvolts, which is really impressive but doesn’t quite make it to the petaelectronvolt benchmark of the mystery cosmic-ray population (1,000 times the energy of M82’s particles). We know supernovae can get close to this benchmark, but we still don’t know what’s producing the higher-energy particles.

Star Light, Star Bright, Starburst!

Starbursts are promising sources that might be producing the elusive high-energy cosmic rays that astronomers have been hunting for more than a century. They also give us a larger sample size of star-powered sources that may allow us to gain more understanding about the smaller populations of supernova remnants and massive stars that exist in our own Milky Way. With the next-generation gamma-ray telescopes coming online soon (like the Cherenkov Telescope Array Observatory, which can detect gamma-ray sources in one-tenth the time it takes current-generation telescopes like VERITAS), hopefully studying these challenging and gamma-ray-dim sources will only be easier and more fruitful from this point forward!

Disclaimer: Today’s author was an author on this research article as a member of the VERITAS collaboration but was not directly involved in this project.

Original astrobite edited by Pranav Satheesh.

About the author, Samantha Wong:

I’m a graduate student at McGill University, where I study high energy astrophysics. This includes studying all sorts of extreme environments in the universe like active galactic nuclei, pulsars, and supernova remnants with the VERITAS gamma-ray telescope.

The post Messier 82 (Star)bursts onto the Scene! appeared first on AAS Nova.
  •  
❌