❌

Reading view

Featured Image: Massive Young Star Clusters, Revealed

The Antennae galaxies are a nearby pair of interacting galaxies, shown in optical light from the Hubble Space Telescope (left) and in infrared light from JWST (right) in the image above. Between the two galaxies’ bright nuclei, there is a vast and dusty molecular cloud complex that harbors a large number of massive young star clusters — and in a recent article led by Rupali Chandar (University of Toledo), researchers have worked to pin down exactly how many clusters are embedded within the dusty whorls of the Antennae galaxies. The team used JWST to search for emission from star clusters too thickly blanketed with dust to be visible in previous observations by Hubble. They ultimately identified 45 sources, 40 of which were seen for the first time in this study. These star clusters mostly inhabit the overlap region between the two galaxies, are less than 2.5 million years old, and each contain roughly 104–106 solar masses. To learn more about how JWST’s infrared capabilities unveiled young star clusters in these interacting galaxies, be sure to check out the full article linked below.

Citation

“Nowhere Left to Hide: Uncovering All of the Massive Young Embedded Star Clusters in the Antennae with JWST,” Rupali Chandar et al 2026 ApJ 1002 64. doi:10.3847/1538-4357/ae56e8

The post Featured Image: Massive Young Star Clusters, Revealed appeared first on AAS Nova.

  •  

Featured Image: Galaxies Caught in Transition

images of six galaxies

How does environment shape a galaxy’s growth and evolution? This is the question explored in a recent study led by Gissel Montaguth (University of São Paulo). Montaguth’s team examined nearly 4,000 galaxies in low-mass, high-mass, and compact galaxy groups, as well as galaxies adrift in the field without belonging to a group. The sampled galaxies were classified as early-type, late-type, transition (generally disk galaxies with quenched star formation), or other (generally elliptical but with lingering star formation). The image above shows six transition galaxies from the sample, three of which show signs of past disturbances (top row). The team found that early-type and “other” galaxies were resilient to changes in environment, but late-type and transition galaxies could be affected by life in close groups. Late-type galaxies in compact groups tended to be somewhat smaller than their loosely grouped or field galaxy counterparts, while transition galaxies showed a significantly steeper stellar mass–size relation in group environments and smaller sizes in groups than in the field. This suggests that transition galaxies are strongly influenced by interactions, mergers, and processes like disk truncation. To learn more about the impact of environment on galaxy properties, be sure to check out the full article linked below.

Citation

“Galaxies Caught in Transition: The Role of Group Environment in Shaping the Mass–Size Relation in the Local Universe,” Gissel P. Montaguth et al 2026 ApJ 999 160. doi:10.3847/1538-4357/ae42ca

The post Featured Image: Galaxies Caught in Transition appeared first on AAS Nova.

  •  

Featured Image: Disequilibrium on Display

eight images from the Hubble Arp Galaxy Survey

Notice anything unusual about these galaxies? Each of the scenes above is crafted from observations from the Hubble Arp Galaxy Survey, which turned the talents of the Hubble Space Telescope toward 216 targets in the Arp and Arp–Madore catalogs. These catalogs contain galaxies that are visibly out of equilibrium, either caught in the middle of an interaction with another galaxy, sporting strange structures, or illuminated by brilliant starbursts. Julianne Dalcanton (Flatiron Institute; University of Washington), Meredith Durbin (University of Washington; University of California, Berkeley), and Benjamin Williams (University of Washington) designed the survey to create an archive of previously unobserved sources in these catalogs of peculiar galaxies. In addition to providing a new high-resolution view of these sources, the team hopes that the survey will serve as a launchpad for new investigations and complementary observations from facilities like JWST and the Atacama Large Millimeter/submillimeter Array. To learn more about the Hubble Arp Galaxy Survey and see more of the new images, be sure to check out the full article linked below.

Citation

“The Hubble Arp Galaxy Survey,” Julianne J. Dalcanton et al 2026 ApJS 283 25. doi:10.3847/1538-4365/adfc67

The post Featured Image: Disequilibrium on Display appeared first on AAS Nova.

  •  

Disrupted Dwarf Galaxy: Investigating the History of the Small Magellanic Cloud

Small Magellanic Cloud

Researchers show that the highly disrupted state of the Small Magellanic Cloud can be attributed to a long history of interactions with its neighbor, the Large Magellanic Cloud.

A Disrupted Dwarf Galaxy?

The Small Magellanic Cloud (SMC) is one of the largest and nearest satellites of the Milky Way. At a distance of just 200,000 light-years, the SMC has long been used as an accessible analog for low-metallicity star-forming galaxies in the early universe.

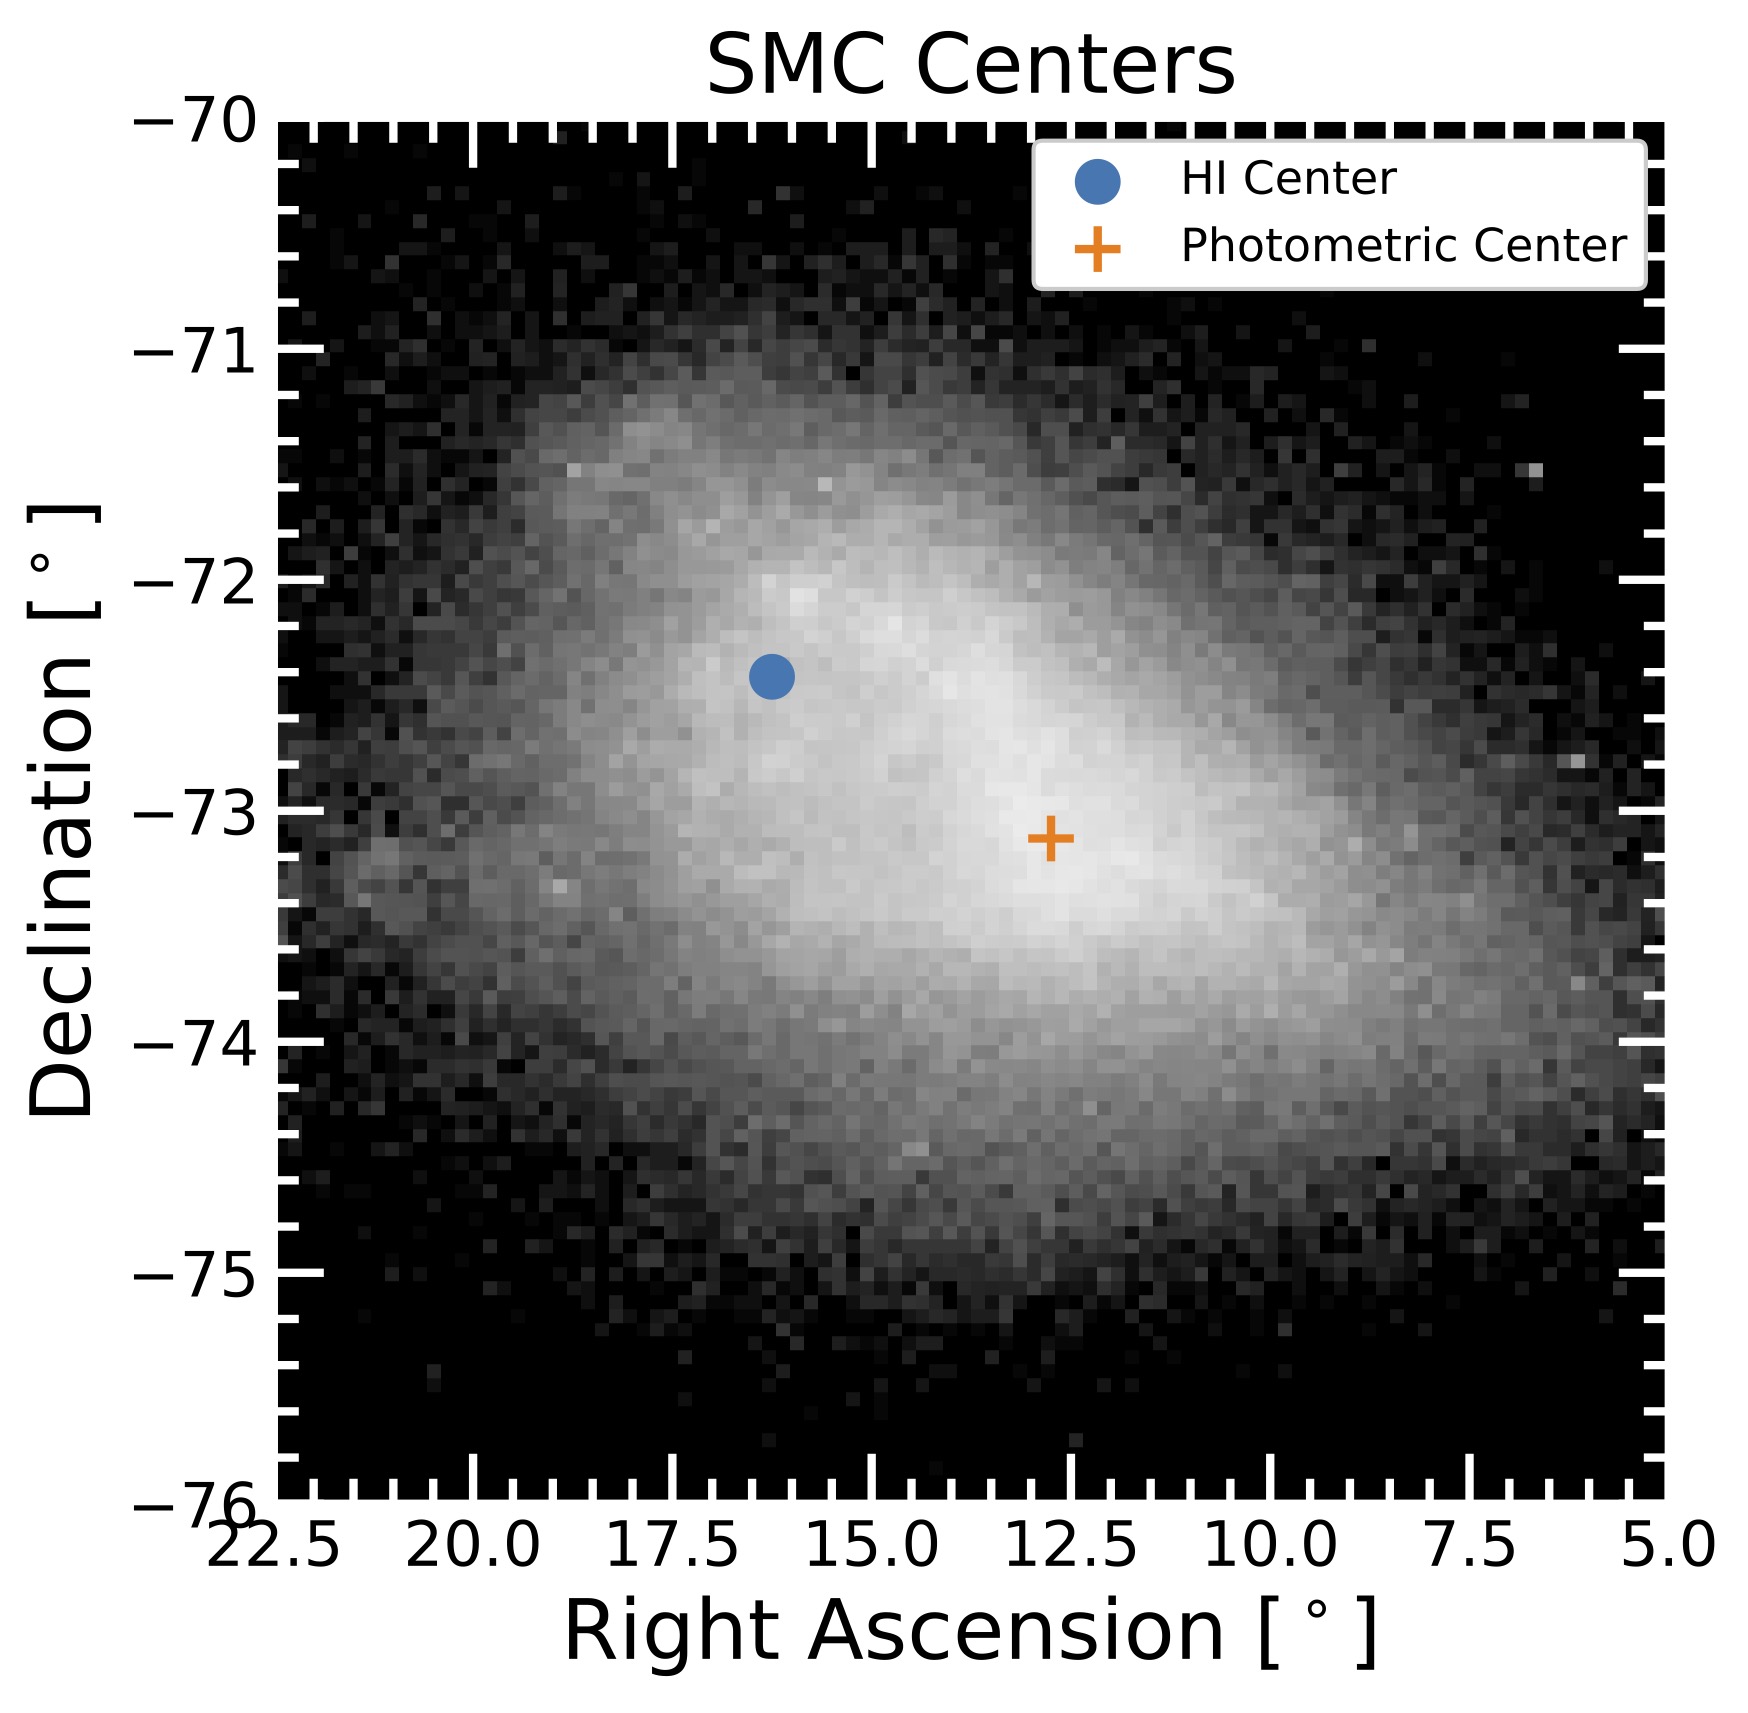
Small Magellanic Cloud photometric and HI kinematic centers

Locations of the SMC’s photometric center and hydrogen gas kinematic center. The two locations are separated by several thousand light-years. [Adapted from Rathore et al. 2026]

However, observations increasingly suggest that the SMC may not be an ideal analog for high-redshift galaxies. The SMC appears to have been disrupted: its gas seems to rotate while its stars do not, it has an unusually large line-of-sight depth compared to its extent on the sky, and its gas distribution has two peaks.

The source of this disequilibrium might be the Milky Way’s largest satellite, the Large Magellanic Cloud (LMC). As the SMC inches along its orbit around the Milky Way, it also engages in a gravitational dance with the LMC. These galaxies may be clumsy dance partners, with data suggesting a potential direct collision between the SMC and LMC within the past 200 million years.

Modeling the Magellanic Clouds

To understand how a potential collision between the Magellanic Clouds might have impacted the present-day properties of the SMC, Himansh Rathore (University of Arizona) and collaborators used hydrodynamical simulations to explore the interconnected histories of the SMC, the LMC, and the Milky Way.

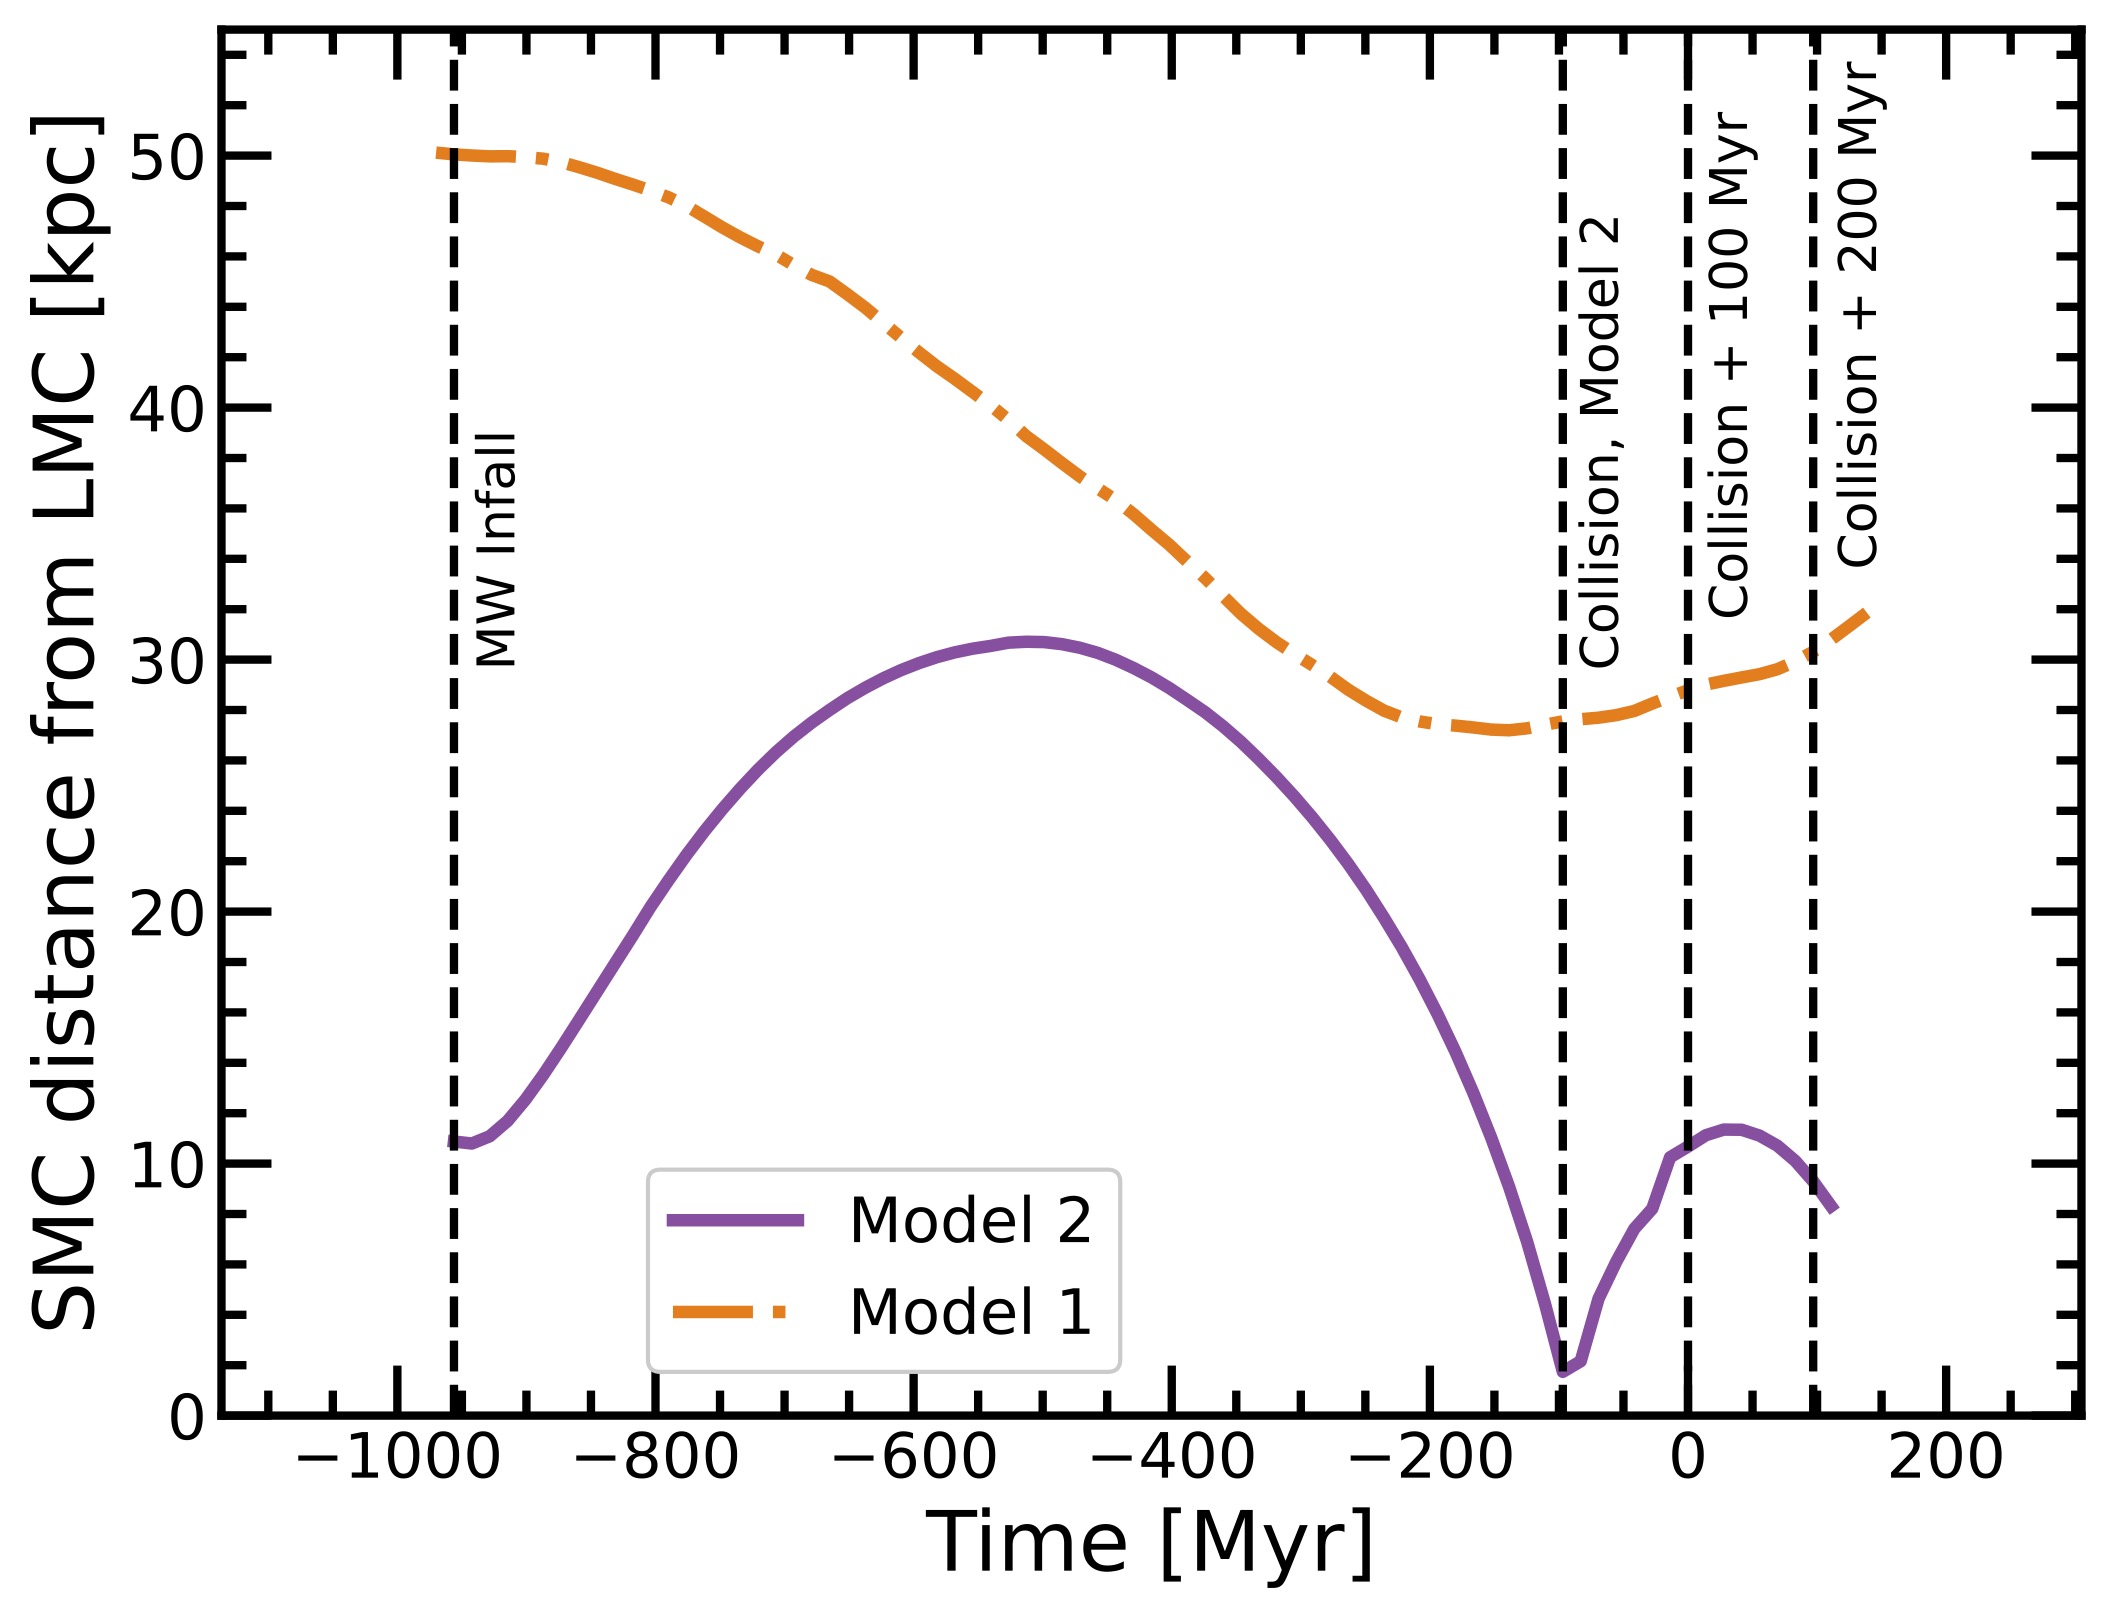
SMC–LMC separation in the authors' models

SMC–LMC separation over time in the control model (orange dot-dashed line) and the collision model (purple solid line). Click to enlarge. [Rathore et al. 2026]

At the beginning of the simulations, the SMC is in equilibrium, with its stellar and gaseous components neatly rotating in unison. From there, its fate diverged: in a control simulation, the SMC and LMC maintained a respectful distance, never getting less than about 100,000 light-years from one another. In the collision simulation, the galaxies collided 100 million years ago.

Both of these model scenarios reproduced certain features of the SMC–LMC system, such as the bridge of gas that spans the distance between them. Only the collision scenario, though, can explain the apparent discrepancy between the SMC’s stars and gas.

An Impactful Collision

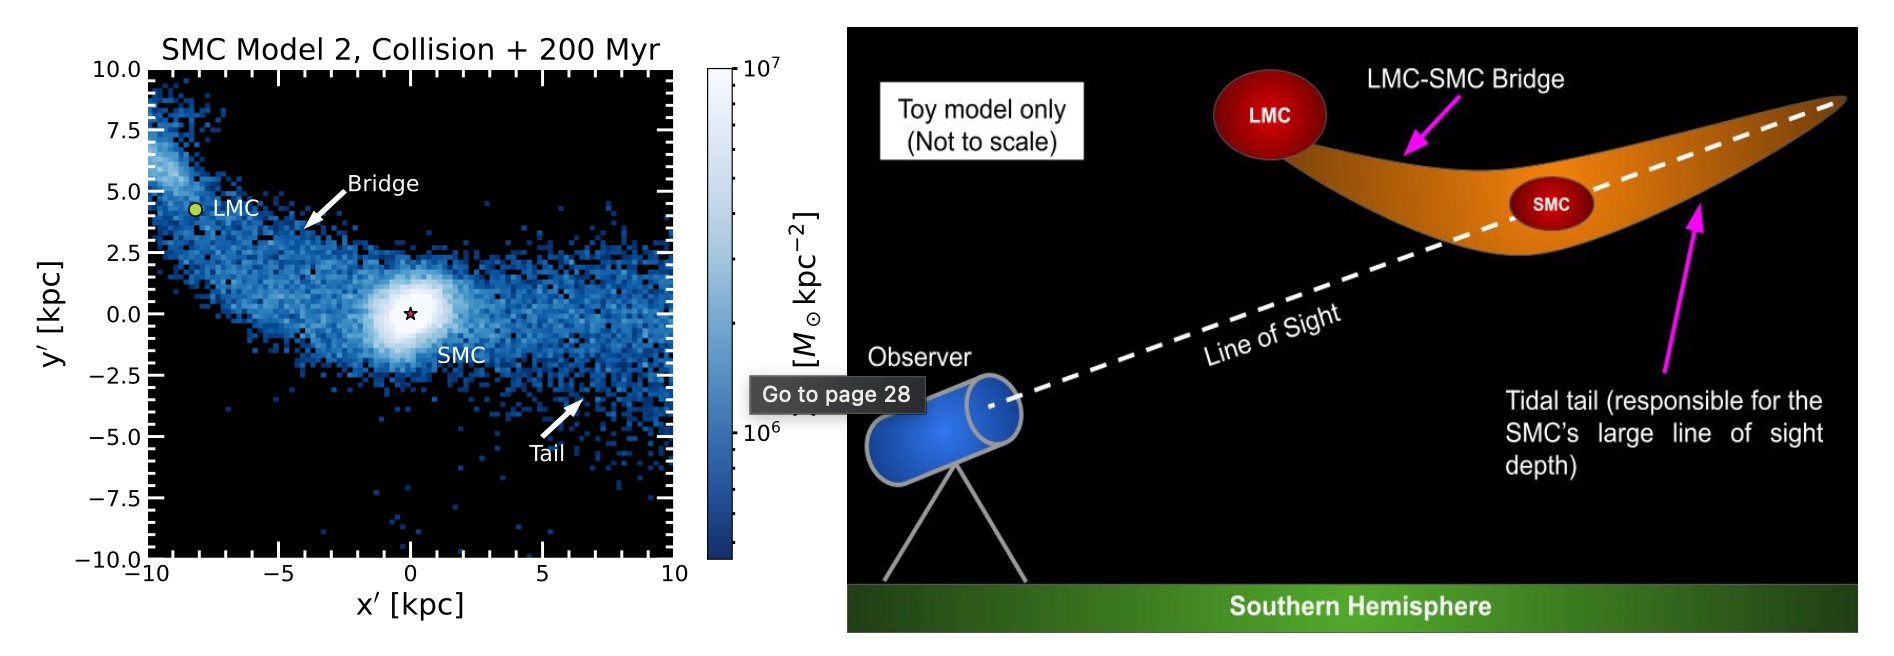
SMC stellar density and viewing schematic

Left: Simulated stellar density 200 million years post-collision. Right: A schematic of our likely perspective on the post-collision SMC–LMC system. Click to enlarge. [Rathore et al. 2026]

Post-collision, the SMC’s stellar population is significantly elongated and features a tidal tail. If this tidal tail is oriented along our line of sight, it would explain why the galaxy’s depth in that direction is unexpectedly large. The presence of a gas tidal tail may also help to explain the two peaks in the galaxy’s gas density.

In terms of the galaxy’s rotation, only the stars nearest the SMC’s center rotate, while the rest move radially outward, swayed by the tidal pull of the LMC. This radial motion is also present in the galaxy’s gas. While previous work has interpreted the observed velocity dispersion of the SMC’s gas as a sign of rotation, Rathore’s team showed that radial expansion, viewed from an inclined angle, can mimic a rotational signature. 

The team also showed that the gas is far more disturbed than the stars, reflecting the pressure exerted by the LMC’s gas when the two galaxies collided. This type of interaction can transform an irregular dwarf galaxy into an ellipsoidal or spheroidal dwarf galaxy — a transition that Rathore’s team argues is underway for the SMC.

Ultimately, these simulations demonstrate that the SMC is a profoundly disrupted galaxy, likely still reeling from a recent collision with its larger neighbor. Viewing the SMC through this lens is critical to understanding its role as an analog to early universe galaxies.

Citation

“A Galactic Transformation — Understanding the SMC’s Structural and Kinematic Disequilibrium,” Himansh Rathore et al 2026 ApJ 1000 50. doi:10.3847/1538-4357/ae4507 

The post Disrupted Dwarf Galaxy: Investigating the History of the Small Magellanic Cloud appeared first on AAS Nova.

  •  

A Triple Black Hole System Caught in the Act of Self-Quenching

SDSS J0849+1114

Editor’s Note: Astrobites is a graduate-student-run organization that digests astrophysical literature for undergraduate students. As part of the partnership between the AAS and astrobites, we occasionally repost astrobites content here at AAS Nova. We hope you enjoy this post from astrobites; the original can be viewed at astrobites.org.

Title: Episodic Feedback in Triple Active Galactic Nucleus Candidate SDSS J0849+1114 Revealed by Extended Ionized Gas
Authors: Xiaoyu Xu (许啸宇) et al.
First Author’s Institution: Nanjing University
Status: Published in ApJ

When Galaxies Collide

Galaxies are social creatures; they interact and merge (more astrobites talking about this are here and here)! When galaxies collide, the gravitational chaos acts like a funnel, driving massive amounts of cold gas toward the center. This gas rush has two major consequences: it triggers intense bursts of star formation (known as starbursts), and it feeds the central supermassive black holes, activating them as active galactic nuclei (AGNs).

But the story doesn’t end there. These powerful AGNs don’t just sit and feast on the gas. They launch high-velocity winds or jets that push back against the incoming gas, a process known as AGN feedback. (Read more about it in Astrobites here and here.) This feedback is thought to be the key mechanism by which supermassive black holes regulate their host galaxies, either by heating and expelling the gas (negative feedback, which starves star formation) or, in some cases, by compressing it (positive feedback, which promotes star formation).

While binary AGNs (two AGNs in one merging system) are rare, finding systems with three AGNs in one system is fascinatingly rare. The galaxy SDSS J0849+1114 (J0849+1114) is one such system, featuring three Seyfert 2 AGNs, a type of active galaxy with a bright, compact nucleus whose spectrum shows only narrow emission lines, within a tight region of about 5 kiloparsecs (kpc) or 16,000 light-years. Studying this system gives us a front-row seat to how multiple black holes interact and regulate their host environment during a complex merger. Very Large Array observations reveal that nucleus A (see Figure 1) contains two jets, inner and outer. In contrast, nucleus C has one jet, providing further evidence for the presence of an AGN.

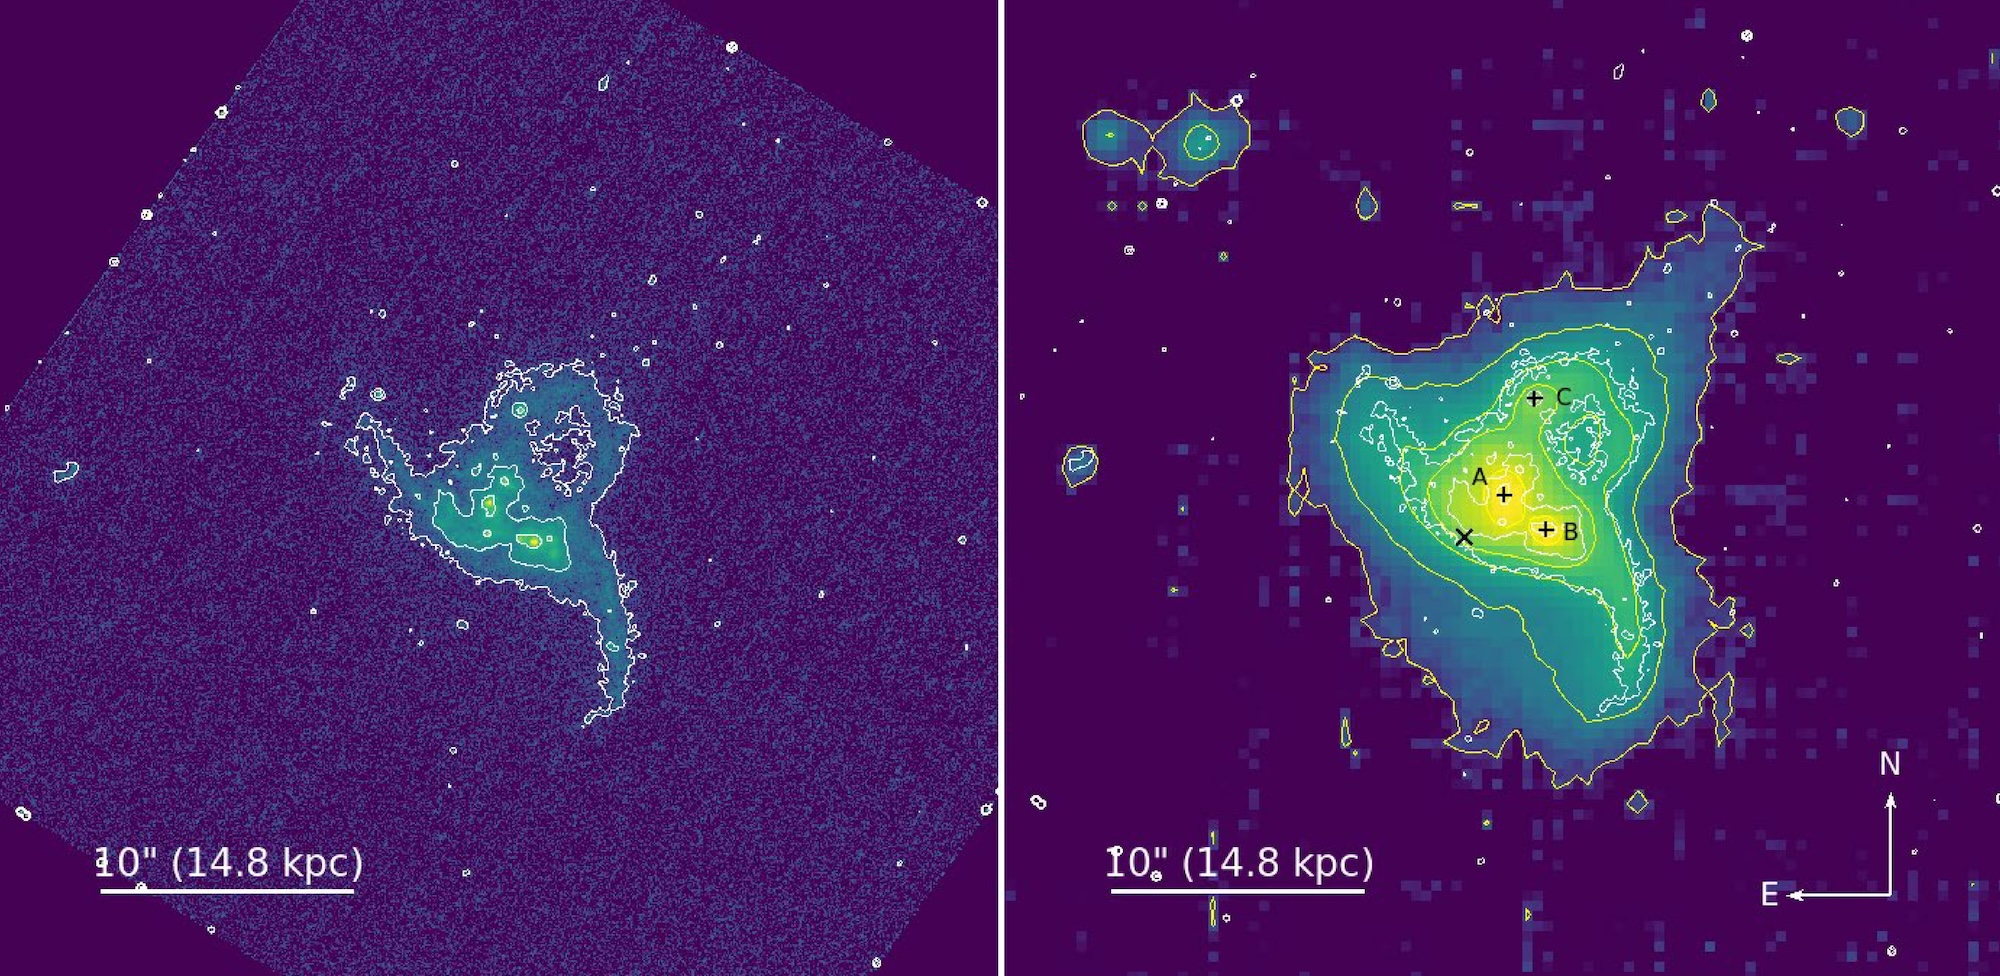
Hubble and Very Large Telescope images of J0849+1114

Figure 1: Left: Hubble Space Telescope image taken in ultraviolet light. Right: Optical image from the VLT/MUSE instrument. The three black holes, nuclei A, B, and C, are marked with black crosses. The white contours are from Hubble, like on the left, and the yellow contours are of the MUSE instrument. We can observe the complex and disturbed morphology resulting from the ongoing merger. [Adapted from Xu et al. 2025]

Peering into the Triple Core with VLT/MUSE

To understand the gas dynamics in J0849+1114, the authors used the Very Large Telescope (VLT) and its Multi-Unit Spectroscopic Explorer (MUSE) instrument. MUSE is an integral-field spectrograph, meaning it provides spectra for every single spatial pixel (or “spaxel”) across the field of view. This allows astronomers to map not just where the light is coming from, but how the gas is moving and what is causing it to glow, all resolved spatially across the galaxy.

The main technique employed was two-component Gaussian fitting of key emission lines like hydrogen alpha (Hα) and ionized oxygen ([O III]λλ4959,5007), which can be seen in Figure 2. The width of a Gaussian line (or its velocity dispersion) in a spectrum tells us how fast the gas is moving. A narrow line means the gas is relatively calm, with most of it moving at similar speeds. A broader line, on the other hand, means the gas velocities are more spread out — some parts are racing toward us, others away — indicating turbulence or outflows. By comparing the widths of different components, astronomers can separate quiet, rotating gas from the high-speed winds launched by the active black holes.

spectra of J0849+1114

Figure 2: Zoomed-in spectra showing the Hβ and [O III] (left) and Hα, [N II], and [S II] (right) emission lines from the spot marked with an “X” in the MUSE image in Figure 1. The blue line shows the observed data, the orange line shows the best-fit model, and the two colored curves (light blue and red) represent the two components of the gas. The pink line shows the leftover differences between the data and the model. The First Component is narrow, representing gas that is relatively settled, often showing signs of rotation or slow movements associated with gravitational disturbances, like tidal tails (low velocity dispersion, σ1 ≤ 50 km/s). The Second Component is broad, representing highly turbulent or fast-moving gas, characteristic of powerful outflows or winds driven by the central AGNs (high velocity dispersion, σ2 > σ1). [Adapted from Xu et al. 2025]

What They Found: Gas Tails and Outflows

The VLT/MUSE observations successfully characterized both the undisturbed (First Component) and turbulent (Second Component) gas across the system.

1. Galactic-Scale Tidal Tails

The slow-moving gas (First Component) revealed extended structures of ionized gas stretching over 10 kpc (33,000 light-years), and in some directions, even more than 15 kpc (49,000 light-years) away from nucleus A. These large, low-velocity gas clouds align well with features known as tidal tails: the stretched-out arms of gas and stars pulled away by the violent gravitational forces of the merger.

2. Two Distinct Outflows Driven by Radio Jets

The fast-moving gas (Second Component) clearly showed two distinct sites: outflows originating from nucleus A and nucleus C.

  • Outflow A: This outflow extends over 5 kpc (16,000 light-years) around nucleus A. The gas kinematics and geometry strongly suggest that this outflow is being driven by nucleus A’s radio jet. This finding is key, as the measured kinetic power of the outflow is about 10 times stronger than what star formation alone could supply, and the current luminosity of the AGN is also insufficient to power it.
  • Outflow C: A smaller but detectable outflow extends about 5.9 kpc (19,000 light-years) around nucleus C, with a lower kinetic power compared to Outflow A. But, like Outflow A, the energetics and velocity gradients suggest this outflow is also linked to nucleus C’s radio jet.

A Black Hole That’s Recently Gone Quiet

The most striking implication of this study relates to the timing of nucleus A’s activity. The presence of extended ionized gas far from the nucleus (in the tidal tails, >10 kpc or 33,000 light-years away) provides a fascinating glimpse into the AGN’s recent past.

The physical conditions of this distant gas were determined using emission line ratios ([O III]/Hα and [N II]/Hα) on the Baldwin, Phillips, and Terlevich (BPT) diagram. A BPT diagram uses emission line ratios to diagnose the energy source that ionizes the gas: star formation, AGN, or shocks. The BPT diagram of J0849+1114 indicates that an AGN currently photoionizes the gas.

By running sophisticated photoionization models, the scientists calculated how luminous nucleus A must have been to ionize the gas currently found 10–15 kpc (33,000–49,000 light-years) away. They discovered that this required nucleus A to be 20–100 times more luminous than it currently is! Since light takes time to travel, and the ionized gas quickly recombines (on timescales of less than 100 years for this gas), this luminous phase must have ended very recently, approximately 30,000–50,000 years ago. This is a long time for us, but just a blink of an eye on cosmic timescales.

The Episode of Self-Regulation

By integrating the findings across different wavelengths and timescales, the current faint luminosity state, the past luminous state inferred from the distant gas, and the presence of radio jets of different ages, the authors propose a model of episodic AGN feedback in nucleus A:

  1. Past Activity (150,000 years ago): An active phase likely launched an outer radio jet, which subsequently drove the large-scale ionized gas outflow observed today.
  2. Peak Ionization (30,000–50,000 years ago): A subsequent burst of high accretion reached its peak, ionizing the distant tidal tails.
  3. Fading and Quenching (Today): The energy released by the jet and/or outflow during the active phase likely expelled or heated the surrounding gas (negative feedback), causing the central accretion disk to run out of fuel. The AGN has since faded rapidly to its current low-accretion state, marked by the appearance of a young inner radio jet.

A Quiet Ending After a Loud Beginning

J0849+1114 is not just a statistical anomaly as a triple AGN candidate; it serves as a crucial case study demonstrating the powerful and rapid effects of AGN feedback. High-resolution observations confirm that violent galaxy mergers trigger both powerful outflows and episodic bursts of extreme luminosity. Crucially, these outflows clear the gas and cause the central supermassive black hole to quickly fade from a luminous quasar phase to a quiet, low-accretion state within tens of thousands of years. This system provides strong, spatially resolved evidence that AGN feedback rapidly suppresses accretion onto the supermassive black hole and shapes the host galaxy on kiloparsec scales during the chaotic drama of galactic mergers.

Original astrobite edited by Lindsey Gordon.

About the author, Sowkhya Shanbhog:

I am currently a first-year PhD student at Scuola Normale Superiore in Pisa, Italy, where I am focusing on studying high-redshift quasars. Prior to this, I completed a dual BS-MS degree at the Indian Institute of Science Education and Research in Pune, India. Now, I am eager to expand my involvement in science communication and outreach initiatives. I have recently developed an interest in cooking, particularly since moving to a new city. I find solace in listening to music during my leisure time.

The post A Triple Black Hole System Caught in the Act of Self-Quenching appeared first on AAS Nova.

  •  

Selections from 2025: The Nine-Ringed Bullseye Galaxy

Bullseye galaxy

Editor’s Note: For the remainder of 2025, we’ll be looking at a few selections that we haven’t yet discussed on AAS Nova from among the most-downloaded articles published in AAS journals this year. The usual posting schedule will resume January 2nd.

The Bullseye: HST, Keck/KCWI, and Dragonfly Characterization of a Giant Nine-ringed Galaxy

Published February 2025

Main takeaway:

Bullseye galaxy rings

Red ellipses overplotted on the first eight rings identified with Hubble in the Bullseye galaxy. Click to enlarge. [Pasha et al 2025]

Using a combination of the Hubble Space Telescope, the Dragonfly Telephoto Array, and the Keck Cosmic Web Imager, Imad Pasha (Yale University) and collaborators discovered and performed deep follow-up observations of a giant collisional ring galaxy aptly nicknamed the “Bullseye” galaxy (LEDA 1313424). The team identified a staggering nine rings in the Bullseye with a likely tenth that has since faded — the most rings found in any collisional ring galaxy to date. The rings are a result of a small blue dwarf galaxy shooting through the Bullseye’s core about 50 million years ago, sending ripples through the galaxy.

Why it’s interesting:

Galaxy mergers and interactions are commonplace in the universe, but it is very rare for a dwarf galaxy to strike right through a large galaxy’s core. When this does happen, the collision sends shock waves through the impaled galaxy, sweeping gas and dust outward and forming rings where star formation can occur (hence the name, collisional ring galaxy). These galaxies are valuable sites to explore galactic structure and evolution as well as provide a unique case to study galaxy mergers and interactions. Previously discovered collisional ring galaxies have at most two or three rings, so when Pasha and collaborators found the stunning nine in the Bullseye, it was clear they caught something significant.

Catching the Bullseye at a lucky time in its evolution:

Why does the Bullseye have so many rings? Theoretical studies of these head-on collisions predict that many rings will form and travel outward after the initial crash; however, the rings tend to dissolve after only a few hundred million years. Catching this collision only 50 million years after it happened means we are witnessing the earlier stages of the Bullseye’s evolution. This lucky discovery not only confirms theoretical predictions for collisional ring galaxies, it also may be a clue to how another unique galaxy type, giant low-surface brightness galaxies, originate. Given the wispy ring material found at very large radii from the Bullseye, the authors suggested that collisional ring galaxies may evolve into giant low-surface brightness galaxies as they expand outward and fade. Further investigation and a larger sample of collisional ring galaxies are necessary to confirm this hypothesis, but the Bullseye provides interesting and critical observational evidence of these predictions for the first time.

Citation

Imad Pasha et al 2025 ApJL 980 L3. doi:10.3847/2041-8213/ad9f5c

The post Selections from 2025: The Nine-Ringed Bullseye Galaxy appeared first on AAS Nova.

  •  
❌