❌

Reading view

Lake sediments trace 16,000 years of Western Balkan summers

Sediments from a small mountain lake in Bosnia and Herzegovina preserve an approximately 16,000-year record of summer temperature change in the Western Balkans, revealing abrupt climatic shifts whose effects varied across Europe. Researchers at Eötvös Loránd University reconstructed past mean July temperatures from chironomid remains and other lake-sediment indicators, then used pollen, sediment particles, organic matter and geochemical elements to track associated changes in vegetation, erosion and lake conditions. Two peer-reviewed studies published in 2026 examine different periods in the same sequence, together covering the Late Glacial, the Holocene and more recent centuries.

The reconstructed record shows that a large cooling event associated with the Younger Dryas lowered estimated mean July temperatures at Lake Prokoško by approximately 2.3°C, a change intermediate between estimates from Alpine lakes and those farther east. The lake, which covers 4.8 hectares at an elevation of 1,670 metres in the Vranica Mountains of the Dinaric Alps, also records a later Middle Holocene interval in which estimated summer temperatures may have exceeded present-day levels. These findings emerge from a paleoclimate reconstruction based on biological, chemical and physical evidence preserved in lake sediments, rather than from direct instrumental measurements.

Lake Prokoško occupies a climatically significant position between Western, Central and Eastern Europe. Over thousands of years, remains from the surrounding landscape and the lake’s own ecosystem accumulated in bottom sediments, providing material for reconstructing regional environmental and climatic history. One study, published in Palaeogeography, Palaeoclimatology, Palaeoecology, focused on rapid changes between approximately 16,000 and 10,000 years ago during the Late Glacial and beginning of the Holocene. A separate study in Quaternary Science Reviews traced conditions through the Holocene to the present, extending the interpretation of the sediment sequence across the full period represented by the two investigations.

Chironomids, a group of aquatic insects also known as non-biting midges, supplied the principal temperature indicator. Their larvae occupy lake sediments and differ in their preferences for water temperature, oxygen levels and nutrient conditions. After moulting, larvae leave chitinous head capsules that sink to the lake bed, where they can be preserved for tens of thousands of years. The researchers identified the species represented in different sediment layers and compared the fossil assemblages with faunal and climate data from hundreds of modern European lakes. This comparison supported estimates of mean July temperature, while the accompanying pollen, sediment, organic-matter and chemical records provided evidence about forests, soil erosion, lake productivity and other environmental changes.

The oldest layers examined reflect cold conditions near the end of the last glacial period. At around 14,600 years ago, reconstructed mean July temperatures around Lake Prokoško were below 8°C. They subsequently rose by approximately 2.6°C within a comparatively short interval, reaching around 10.2°C. The reconstruction associates this warming with increased biological activity in the lake, spreading vegetation and more stable conditions in the catchment. The youngest sediments in the study cover the most recent millennium, where the chironomid community reflected not only temperature changes but also centuries of alpine grazing, greater nutrient input and the later expansion of nutrient-rich conditions.

The early warming ended abruptly when the Younger Dryas began around 12,900 years ago, the last major cooling episode at the close of the last glacial period. Estimated mean July temperatures at Lake Prokoško fell by approximately 2.3°C to about 7.9°C. Cold-water chironomid species became more abundant, while increased erosion transported more clastic material into the lake. Comparisons with reconstructions elsewhere in Europe revealed a marked spatial contrast: summer cooling of 3–4°C has been reconstructed at many Alpine lakes, whereas decreases in the Eastern and Southern Carpathians were generally less than 1°C. The Lake Prokoško estimate falls between those geographic extremes.

The researchers connect this west-to-east gradient, which becomes weaker toward the east, to oceanic and atmospheric changes in the North Atlantic region. For the Carpathian Basin, the contrast illustrates that the same large-scale climatic event can produce different responses in Western, Central and Eastern Europe. Lake Prokoško consequently provides a regional reference point for examining how the magnitude of a shared climate signal varied geographically. The researchers also emphasize that alpine lakes respond sensitively to relatively small temperature changes: variations in ice-cover duration, water stratification, oxygen content and biological activity can accompany those changes, making small mountain lakes useful environmental archives.

Warming resumed at the end of the Younger Dryas. Between approximately 11,800 and 11,400 years ago, reconstructed mean July temperatures increased by around 2.9°C. By about 10,500 years ago, they may have reached approximately 12.6°C. The lake became more productive, its ice-free season lengthened, and closed-canopy forests developed in the catchment, reducing erosion. Temperatures did not remain constant throughout the Holocene. Around 6,800 years ago, reconstructed mean July temperatures may have reached approximately 14°C, meaning that some summers around Lake Prokoško were warmer than those experienced today. The researchers distinguish this Middle Holocene warmth from present-day warming: the earlier conditions were mainly seasonal and driven by gradual changes in Earth’s orbital parameters that increased Northern Hemisphere summer insolation, whereas current warming is global, year-round, more rapid and primarily associated with human-caused greenhouse gas emissions.

A cooling trend began around 6,000 to 5,500 years ago during the Neoglacial transition toward a cooler Late Holocene. Reconstructed mean July temperatures fell from approximately 14°C to around 12.8°C, then to 11.8°C by about 5,670 years ago. Pollen evidence indicates that people were altering the landscape around the lake by the end of the Neolithic, approximately 6,000 years ago. Plants associated with grazing and open habitats became more common, followed later by more intensive forest use and the expansion of open areas. The same sediment archive therefore records both reconstructed climatic variability and the growing influence of human land use, although it does not by itself establish that human activity caused the temperature changes documented in the sequence.

Later Holocene temperatures continued to vary. Around 3,000 years ago, another significant cooling began, with mean summer temperatures falling from approximately 14.7°C to 12°C. Around 2,000 years ago, reconstructed temperatures rose during the Roman Warm Period, reaching approximately 13.3°C. Over the past millennium, centuries of alpine grazing opened the surrounding landscape and increased the nutrient load entering Lake Prokoško. The chironomid community changed significantly around 700 years ago, and species preferring more nutrient-rich waters became increasingly common over the following 500 years. Together, the two studies show that the lake’s fossil and sediment record captures environmental responses shaped by both regional climate change and local human transformation, while also demonstrating that estimates for individual periods remain reconstructions derived from sediment proxies and modern comparative data.

Subject of Research: Paleoclimate reconstruction of summer temperature variability in the Western Balkans

Article Title: Where three climate zones meet

Article References: Where three climate zones meet. Original publication (Bibliographic details unavailable.)

Image Credits: AI Generated

DOI: Not provided

Keywords: Lake Prokoško, Western Balkans, summer temperatures, paleoclimate, chironomid fossils, Younger Dryas, Holocene, climate reconstruction, land use, alpine lake, three, climate
  •  

Lizard Dropped Its Tail 99 Million Years Ago, Amber Preserved Evidence

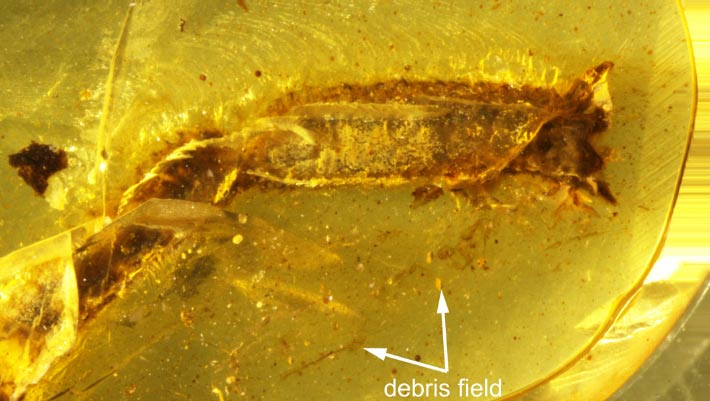
General view of the amber piece from Myanmar, arrows highlighting the debris stuck to the initial resin flow at the level of the ventral surface of the tail. Image credit: Fabrikant et al., doi: 10.26879/1706.

A tiny piece of amber from Myanmar has captured a defensive maneuver that lizards still use today: shedding part of their tail to escape a predator.

The post Lizard Dropped Its Tail 99 Million Years Ago, Amber Preserved Evidence appeared first on Sci.News: Breaking Science News.

  •  

2026’s El Niño is record-breaking — and it’s not done yet

Since June, scientists have been warning that Earth might experience an El Niño unlike any other. It now appears they were right. The periodic climate beast that emerged this year is stronger than any ever seen. And the really worrisome news: It likely hasn’t even reached its peak.

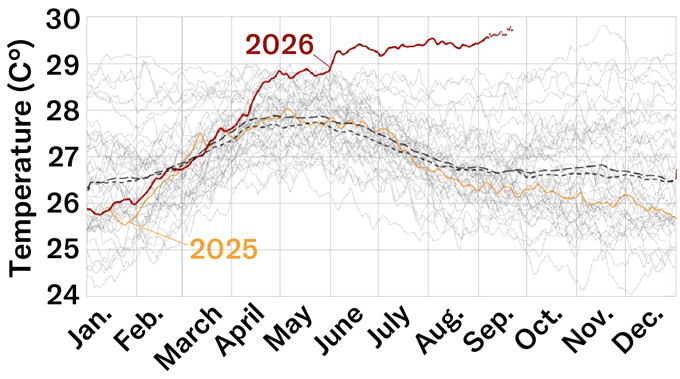
El Niños develop in the central and eastern equatorial Pacific Ocean. Over a short period, they release extraordinary amounts of ocean heat into the air. And by September 21, the daily sea-surface temperature where El Niños form was already 3.08 degrees Celsius (5.54 degrees Fahrenheit) warmer than the average from 1991 to 2020.

El Niños can fuel droughts, floods, heat waves and severe storms. The Oceanic Niño Index is a traditional measurement of their strength. Using daily sea-surface temperatures to calculate strength shows that the 2026 event is already more intense than any in recorded history.

“It has been a remarkable event,” says Nathaniel Johnson. What’s more, the climate scientist notes, this El Niño will probably strengthen even more. He expects it to peak “within the next few months.” Johnson works at the Geophysical Fluid Dynamics Laboratory in Princeton, N.J. It’s part of the National Oceanic and Atmospheric Administration (NOAA).

Ocean heat released by this El Niño could spike global land temperatures about 1.2 degrees C (2.16 degrees F) in the coming months. That may not sound like much. But by next February, it could lead to more than 450,000 additional heat-related deaths. That’s the finding of a new report out of the University of Chicago’s Climate Impact Lab.

NOAA has not yet formally called this El Niño a record-breaker. Why? It’s using a new measurement method: the Relative Oceanic Niño index. That should better capture how an El Niño’s heat will alter weather across the globe. And by this index, the El Niño in 1997 and 1998 topped the new one’s current strength.

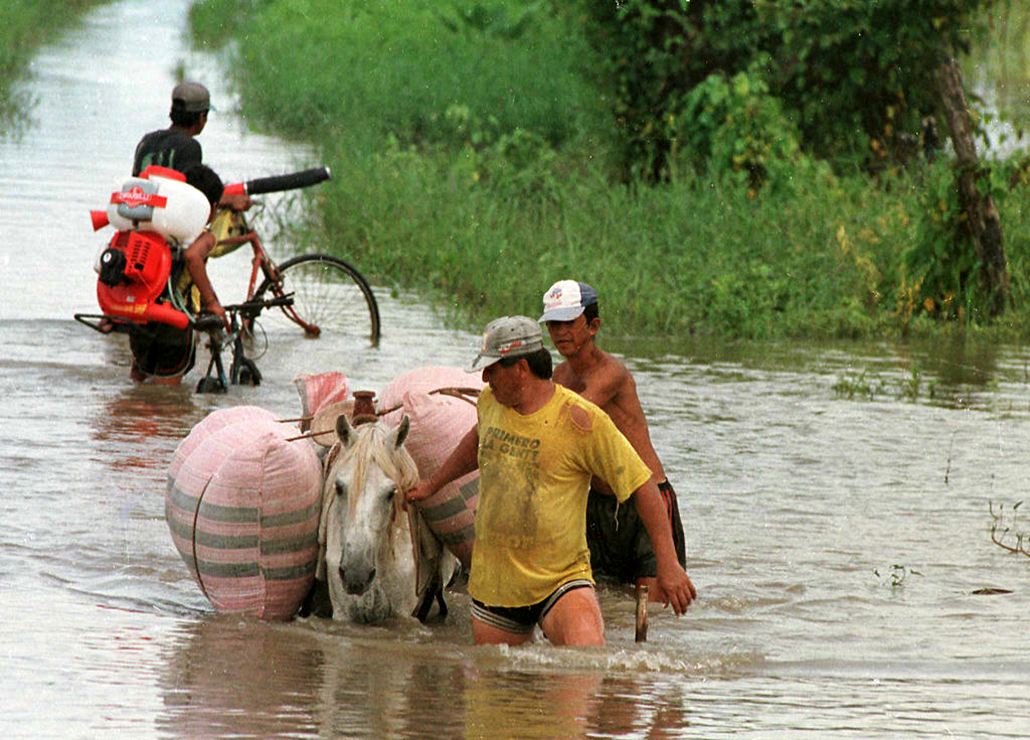
A group of men pulling a horse burdened with bags through flood water, behind them another man on a bicycle walks his bike through the water
What was one of the strongest recent El Niños developed during 1997 and 1998. One impact: It flooded large regions of Ecuador, in South America. Here in the Guayaquil region, for instance, flooding forced thousands of people out of their homes and cut off most roadways.FRANCESCO DEGASPERI/AFP/Getty Images Plus

But that record, too, is on track to be broken soon, based on a Sept. 10 forecast by NOAA’s Climate Prediction Center.

To understand what’s driving this historic event and its potential impacts, Science News spoke with two experts. One is Johnson, part of that U.S. team that produces El Niño forecasts. The other, Nathan Lenssen, is a climate scientist at the National Center of Atmospheric Research. It’s in Boulder, Colo. Their answers have been edited for length and clarity.

How much of this El Niño’s strength has been fueled by human-caused climate change?

Johnson: It’s really an unanswered question. If we look at the historical record, we have been seeing more rapid swings between El Niño and La Niña. [La Niña is the other — and opposite — extreme phase of a seesawing pair of climate patterns: Together they’re known as ENSO, or the El Niño Southern Oscillation.] There’s some evidence from computer models that increasing greenhouse-gas emissions lead to more of those extreme [ENSO] swings. But there’s no science consensus yet on how climate change is impacting El Niño. Especially an extreme one, like this.

Lenssen: There’s debate on how much we can directly attribute to climate change. But due to Earth’s warming, there is more energy in the oceans now. And El Niños release some of that ocean heat into the atmosphere.

Learn how changes in the equatorial Pacific Ocean can trigger an El Niño. Then watch where and how in coming months those changes may dramatically alter weather patterns elsewhere across the planet.

What are the most predictable and unpredictable impacts of this El Niño?

Johnson: We see a lot of the most predictable impacts in the tropics. That’s where an El Niño develops. We’ve already seen a suppressed Atlantic hurricane season and enhanced Pacific hurricane season. We’ve also seen droughts in Central America. We tend to see droughts over northern South America and the Amazon. Meanwhile, the Indian monsoon can weaken.

By late fall, we typically see more impacts a bit farther from the equator. For instance, we tend to see more rain over the southern United States, but it’s typically drier than normal over the Pacific Northwest. And it’ll be warmer than average over the northern United States and Canada.

Lenssen: While this El Niño is quite powerful, that doesn’t necessarily mean we’re more confident about its impacts. A global warming of the oceans has made some historical changes seen at mid-latitudes less likely.

So there’s a kind of twist there. The El Niño in 2023 and 2024, for instance, didn’t lead to as much wet weather in California as expected. And some research has shown that was due to other warming ocean patterns.

How long could this El Niño last?

Johnson: El Niños typically last a year. So we’ll probably see this one weaken after winter and be over by spring or early summer. But when we have a big El Niño like this, we’re more likely to see a shift in the following year to La Niña [which also has global impacts on weather]. So that’s something we’ll be keeping our eye on.

Lenssen: It’s possible that this event could be followed by a double La Niña. Those occur back-to-back, separated by a brief period of neutral conditions. That happened in 2016 and 2017, after the strong El Niño of 2014 and 2015.

Do you have a science question? We can help!

Submit your question here, and we might answer it an upcoming issue of Science News Explores

Aside from strength, what sets this event apart from past ones?

Johnson: We’ve seen such a dramatic change in the equatorial Pacific Ocean. The move has been very rapid, from a La Niña last winter to a very strong El Niño — all in less than a year. That might be the fastest transition that we’ve seen.

Is there any sort of silver lining here?

Lenssen: Though more work is needed to understand this, some research suggests future El Niños may actually become more predictable as the world continues to warm. That might give us months of additional lead time to prepare for their impacts. And that would be great.

In hot water

Since El Niño emerged in June, the daily average sea-surface temperature has become extraordinarily high in the heart of the Pacific Ocean region where El Niños develop. On September 21, it reached 3.08 degrees Celsius (5.54 degrees Fahrenheit) above both the 1991 to 2020 average (coarse dashed line) and the 1982 to 2010 average (fine dashed line). Prior to September 2026, the most extreme anomaly on record was 3.02 degrees Celsius, set by an El Niño in November 2015.

graph displaying the daily average temperature changes described in the caption
ClimateReanalyzer.org, Climate Change institute, University of Maine | Data: NOAA OISST V2.1

  •  

Heavy water isotopes make weather predictions more accurate

Weather forecasting relies on many different types of data to make accurate predictions: temperature, humidity and wind data are all used to build an accurate forecast. Researchers have now found a new way to improve weather forecasts, by adding data on water isotopes in the atmosphere.

For predicting weather, water vapour isotopes integrate key information on the history of their evaporation, condensation, mixing and transport. Heavy water (containing either deuterium or oxygen-18) exists in the atmosphere and the way that these water isotopes condense and evaporate is different to that of normal water molecules.

The release and absorption of latent heat when water condenses and evaporates is the primary energy source for atmospheric circulation. The vertical heating profile plays a major role in large-scale circulation, wave propagation, storm track positioning, cloud development and precipitation patterns. However, vertical heating structures and convective activity cannot be measured directly by satellite networks and have to be inferred instead, leading to biases and inconsistencies that degrade the accuracy of weather models.

Stable heavy water isotopes can provide a direct physical link between the latent heating processes in weather patterns through isotopic fractionation. Heavier water isotopes preferentially condense into the liquid phase because they have a greater binding energy and lower diffusive velocity. Additionally, heavy water doesn’t evaporate as easily as normal water.

Even though these water isotopes exist in small quantities, their relative abundance alters during evaporation and condensation. Observing this change in abundance of the isotopes allowed the researchers to understand where the water came from and what happened to it along the way – providing insights into the atmospheric conditions.

The research team – led by Kinya Toride from University of Colorado Boulder, NOAA and the University of Tokyo – examined data from the Infrared Atmospheric Sounding Interferometer (IASI), which provides large amounts of accurate long-term data on water vapour isotope ratios in the mid-troposphere. The researchers fed the data collected from satellite observations into a weather model using a technique called data assimilation. This approach takes the different isotope signals and translates them into the atmospheric variables that are used in weather forecasting – as the vapour behaviour alone was not sufficient to reveal atmospheric variables such as temperature, wind and humidity.

They found that inclusion of these data improved the estimation of wind, temperature and water vapour in the atmosphere, leading to more accurate weather forecasts. This included improving forecasts for up to five days ahead and providing more accurate predictions on heavy rainfall across many regions.

While it has long been theorized that water vapour isotopes could improve weather forecasting, this is the first study that has been able to show it using real-world data, rather than inside a controlled lab environment. But while the study was performed in conditions close to real operational forecasting, the researchers emphasize that it’s not something that can be implemented straightaway.

This is because there are limited real-time isotope data available and the operational forecasting models employed today by meteorologists are not designed to use such data. For isotope observations to be used in our everyday weather forecasts, a lot more real-time data will need to be collected and processed. Then either new models that incorporate these data will have to be developed or the current models will need to be adapted to include the water isotope data.

However, with more and more satellites being launched into our atmosphere, and the costs of them continuing to come down, it’s likely that more weather satellites will be available to provide these data in the coming years – and both meteorologists and weather presenters should be able to make good use of them.

The study, published in Nature Communications Earth & Environment, demonstrates the benefits of using water isotope data, particularly for predicting heavy rainfall. “Our long-term goal is to develop more accurate satellite observations of water vapour isotopes and integrate them into operational weather forecasting systems,” says co-author Kei Yoshimura from University of Tokyo in a press statement. “This additional layer of information can help make everyday forecasts more reliable.”

The post Heavy water isotopes make weather predictions more accurate appeared first on Physics World.

  •  

A modern ‘snowball’ Earth? What the movies get wrong

Earth has frozen over in the past — at least five times. Science fiction is full of takes about how it might happen again and the implications of a modern ice age. The problem: At a minimum, sci-fi gets the timetable for Earth turning into a “snowball” wrong — often laughably.

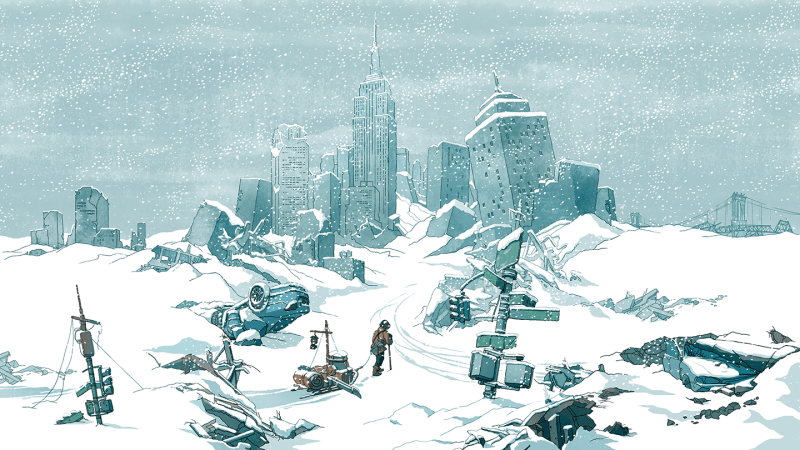
Here’s how some stories have portrayed it: Earth freezes. Humankind’s remnants huddle in ice caves, fending off giant alien monsters (Snowball Earth). Or people shelter in the New York Public Library as ice encases the Empire State Building (The Day After Tomorrow). Or a train hurtles in an endless loop, both protection and prison for Earth’s scant survivors (Snowpiercer).

These stories are all set in Earth’s near future, within a decade from now. And what makes their visions so chilling is that there’s at least a snowflake of truth in each. (Well, space monsters haven’t invaded Earth — yet.)

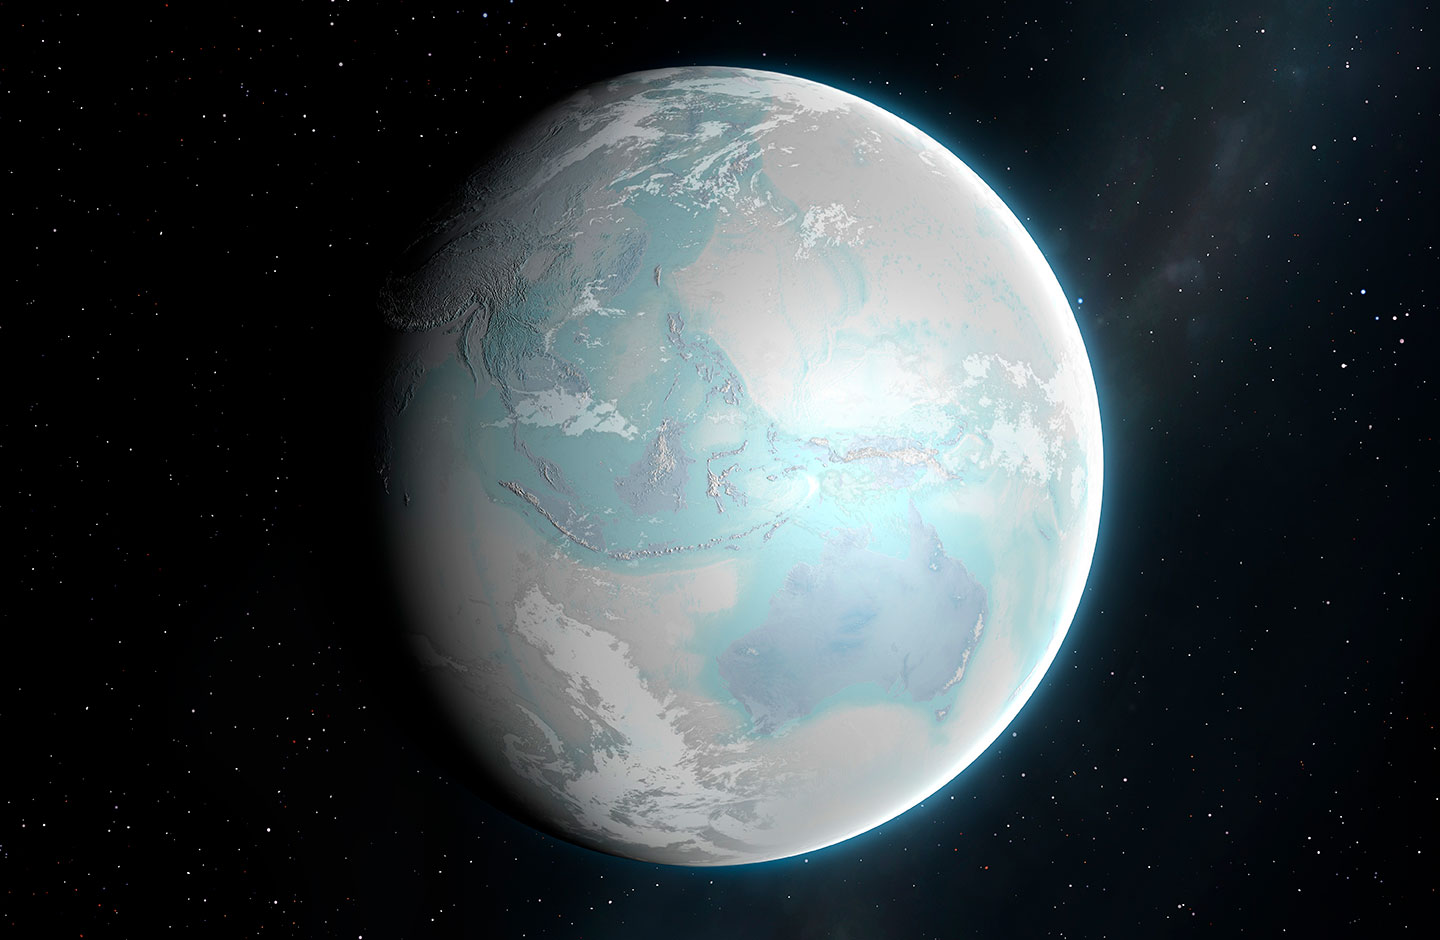
The most severe of Earth’s ice ages spanned from 720 million to 635 million years ago. It’s aptly been named the Cryogenian Period, from the Greek krýos (meaning cold) and génesis (meaning birth). At least twice during this period, glaciers extended from pole to pole. It could have amounted to a true Snowball Earth.

Although “maybe it was more of a Slushball Earth,” says Thomas Algeo. A geoscientist, he works at the University of Cincinnati in Ohio. Fossils, he says, suggest that even in the coldest times, seafloor-dwelling algae survived. They would have needed sunlight. So patches of open water must have persisted near the equator, he says.

an illustration showing a frozen Earth, from space, in whites and pale blues
The concept of a “Snowball Earth” includes glaciers and ice sheets spanning much of the globe, as imagined in this illustration.MARK GARLICK/SCIENCE PHOTO LIBRARY/Getty Images Plus

All such past deep freezes set in due to a series of geologic events. Take the Cryogenian. It developed after shifting tectonic plates caused a supercontinent to split apart. That increased rainfall and rock weathering. These dramatically reduced atmospheric carbon dioxide, which triggered a runaway cooling effect. Widespread ice, which reflects the sun’s warming rays back into space, would have exaggerated that cooling.

All of these processes are slow, which is not ideal for action flicks. Fortunately, sci-fi can play with time. It’s not unusual for fiction to take natural or human-caused climate interactions (and feedback effects) and accelerate or amp them up for drama.

The Day After Tomorrow, for example, which hit theaters in 2004, is based on a real-world scenario: the potential shutdown of a part of a global system of ocean currents. These move heat around the planet. Known as AMOC, this system is short for the Atlantic Meridional Overturning Circulation. Today, AMOC brings relative warmth to regions that might otherwise be frigid.

Back in the mid-1980s, geochemist Wallace Broecker suggested that large releases of freshwater to the North Atlantic Ocean could halt the AMOC. Such slowdowns or shutdowns in ocean currents have played a role in past ice ages, he said.

Scientists today fear it could happen again — and soon.

But to geologists, “soon” doesn’t mean in days to weeks (as portrayed in The Day After Tomorrow). For them, it means perhaps decades to a century.

Here’s the movie trailer for 2004 disaster flick The Day After Tomorrow.

The Day After Tomorrow’s filmmakers were “quite up-front” about their process, says Stefan Rahmstorf. For ultimate drama, they just “took known weather extremes — tornadoes, storm surges, cyclones, hail storms and blizzards — and amplified those.” Rahmstorf is a physical oceanographer at the Potsdam Institute for Climate Impact Research in Germany. He fact-checked aspects of the film.

Despite its super-short timeline for turning the Northern Hemisphere into a deep freeze, this film did point to some very real science, he notes. For instance, the movie starts out with its science hero giving a talk at a United Nations science meeting. Its topic was “the possible risk of a shutdown of the North Atlantic Current. I gave a very similar talk at such a UN conference in Buenos Aires in 1998,” Rahmstorf notes. “I even showed the same diagram [as the movie’s scientist].”

Snowpiercer imagines a different deep-freeze scenario. Geoengineering goes haywire in this 2013 movie, 2014 graphic novel and TV series (which ran from 2020 to 2024). Here, scientists release aerosols into the sky to reflect sunlight back to space. Their goal was to slow global warming. This idea is, in fact, based on a real type of Earth engineering known as solar-radiation management.

But in this story line, the aerosols proved an overkill. They plunged Earth into a deep freeze within weeks (hours, actually, in the novel).

Geoengineering strategies could cool Earth — just not that quickly. They would more likely take at least a few years. And they wouldn’t be that potent, either. To bring on an ice age, aerosols would have to be deliberately and repeatedly injected over generations, says Douglas MacMartin. He’s a climate engineer at Cornell University in Ithaca, N.Y.

How Earth freezes in Snowball Earth is still something of a mystery, as the manga is still in progress (though a streaming anime version debuted in April). Here, the transition to an ice world takes about a decade. And — spoiler alert — giant alien monsters might have had something to do with it. (For that, scientists don’t really have an answer.)

But the premise behind these stories — that Earth could freeze over — is grounded in very real science. It’s happened before and could again. But it won’t happen quite the way these stories tell it.

Do you have a science question? We can help!

Submit your question here, and we might answer it an upcoming issue of Science News Explores

  •  

Fossil Evidence Suggests Early Homo Had Abandoned Tree-Climbing by 1.8 Million Years Ago

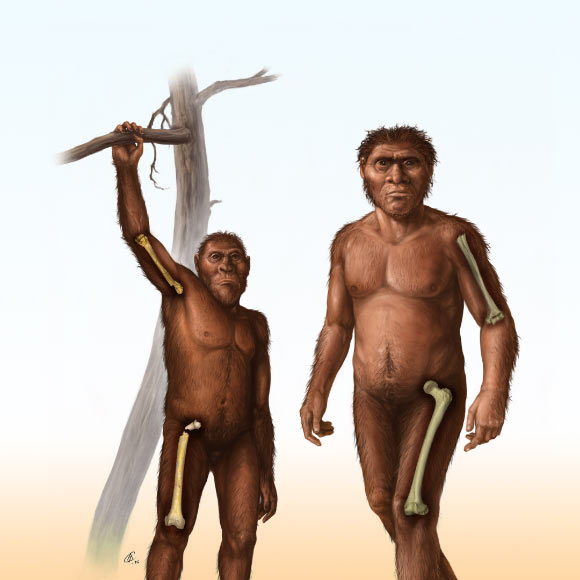
A depiction of an early Homo (right) characterized by relatively greater bone strength of the femur in the thigh compared to the humerus in the arm, and a depiction of an older human ancestor, Australopithecus (left), characterized by more equivalent strength in the bones of the arm and thigh. Image credit: Cullen Townsend.

New research led by University of the Witwatersrand and University of Southern California paleoanthropologists sheds more light on one of the most debated transitions in human evolution: when our ancestors stopped regularly climbing trees and committed fully to walking on two legs.

The post Fossil Evidence Suggests Early Homo Had Abandoned Tree-Climbing by 1.8 Million Years Ago appeared first on Sci.News: Breaking Science News.

  •  

The Sun’s Ancient Journey Through the Galaxy May Have Changed Earth’s Climate

Two NASA-funded studies trace how the Sun’s changing galactic surroundings may have altered Earth’s climate and helped warm the young planet.

The post The Sun’s Ancient Journey Through the Galaxy May Have Changed Earth’s Climate appeared first on Curiosmos.

  •  

Extreme weather reshapes how soils store and release carbon

Beneath every step we take, soils hold one of the planet’s largest reservoirs of carbon, a vast, slow-moving bank of organic matter that quietly regulates how much of the world’s carbon stays locked away and how much escapes into the atmosphere as greenhouse gas. Now a sweeping new review warns that climate-driven extremes, droughts, floods, and wildfires, are rewriting the rules of that subterranean economy in ways that conventional models and land-management practices have not yet caught up with. The analysis, led by environmental scientist Nanthi Bolan of the University of Western Australia and colleagues, including a corresponding authorship by Bolan himself, synthesizes a substantial body of global evidence on how extreme weather reshapes carbon inputs to soil, microbial processing, erosion, and the sequestration of carbon that underpins soil health, water retention, nutrient cycling, and agricultural productivity.

The work, published in the journal Carbon Research, is notable for the scale of its underlying evidence base. On 14 January 2026, the authors searched Google Scholar, PubMed, and Web of Science using terms spanning climate change, extreme weather, soil carbon, microbial activity, decomposition, erosion, dissolved organic matter, and leaching. The initial sweep returned 14,218 records; after removing duplicates and screening for eligibility, 3,754 articles remained for bibliometric and qualitative analysis. From those, 187 publications were selected for detailed synthesis based on relevance, methodological rigor, and the substantive quality of their findings. Keyword co-occurrence patterns were mapped with VOSviewer, a bibliometric tool that reveals the intellectual architecture of a research field. The result is a critical review grounded in structured literature screening rather than new experimental data, but its synthesis offers one of the most comprehensive maps yet of how extremes rearrange the soil carbon cycle.

The review’s central finding is that no two extremes act alike. Drought, the most widespread disturbance, operates largely through the plant side of the equation. When rainfall fails, photosynthesis slows, plant biomass production falls, and the total flux of carbon entering soils through roots, residues, and litter declines. There is a nuance here: under moderate water stress, plants may temporarily shift a greater proportion of their fixed carbon belowground, investing in roots to chase moisture. But prolonged drought overwhelms that compensatory response. Microbial biomass shrinks, litter decomposition stalls, and the living engine of the soil carbon cycle idles. Then comes the deceptive twist: when rain finally returns, rewetting triggers a rapid pulse of carbon dioxide as starved soil microbes seize upon the accumulated substrates left behind by months of suspended activity. That post-drought CO₂ flush, the review emphasizes, can erase much of the apparent “savings” that accumulated during the dry period. Across the assembled evidence, repeated and multi-year drought was consistently associated with declining soil organic carbon, with grasslands and arable croplands showing particularly pronounced losses, ecosystems that happen to anchor much of the world’s food production.

Flooding tells the opposite story, but it ends in many of the same places. Water saturation chokes off oxygen diffusion through soil pores, forcing microbial metabolism into anaerobic pathways. That shift changes everything downstream. Prolonged waterlogging can drive the chemical reduction of iron oxyhydroxides, minerals that in oxygenated conditions act as microscopic glues binding organic carbon to soil particles. When those minerals dissolve, the carbon they held is released as dissolved organic carbon, which can then be stripped away by erosion and leaching and exported to rivers, lakes, and ultimately the ocean. The review stresses, however, that flooding is not unambiguously a carbon loss story. Wetlands and other periodically inundated ecosystems can accumulate and retain enormous carbon stocks precisely because water constrains decomposition. Whether a flood event releases carbon or banks it depends on the interplay between plant inputs, oxygen availability, and hydrological transport, a delicate balance that shifting rainfall regimes are actively destabilizing.

Wildfire is the most dramatic and immediately visible of the three forces, and its effects cascade on multiple timescales. Combustion directly strips vegetation, litter, and soil organic matter, transferring carbon to the atmosphere in hours. But fire also rearranges the physical and biological landscape of the soil in subtler ways: it can increase erosion by removing protective ground cover, alter soil wettability in ways that change hydrological behavior, restructure microbial communities, and expose previously protected carbon, once shielded inside aggregates or mineral associations, to fresh decomposition. There is a paradoxical bright spot. Pyrogenic carbon, the charcoal-like residue of incomplete combustion, is chemically recalcitrant and can persist in soils for centuries or millennia, functioning as a long-term carbon sink. Whether a fire leaves a landscape as a net carbon source or stabilizes some of its carbon in pyrogenic form depends on fire severity, soil moisture, fuel load, ecosystem type, and the trajectory of post-fire recovery. The review is clear that this balance cannot be predicted from fire alone; it is contingent, site by site, on conditions that vary widely across the globe.

Perhaps the most consequential theme running through the synthesis is that carbon responses cannot be inferred from the type of extreme event alone. Land use, soil mineralogy, hydrology, salinity, vegetation composition, microbial community makeup, and the timing of events within a season all determine whether carbon ends up stored, mobilized, or released. Iron and aluminum oxyhydroxides and clay minerals, for instance, provide mineral protection that can shield organic matter even under stress, while sandy or low-clay soils offer little such refuge. Managed croplands respond differently from native grasslands; saline coastal soils behave differently from acidic forest soils. And compound events, drought followed by wildfire, or alternating drought and flooding in rapid succession, may produce effects that are qualitatively different from those of isolated disturbances, as when a dried landscape burns more intensely, or when post-fire soils, stripped of vegetation, wash away in the first heavy rain. The review argues that the climate science and soil science communities have largely studied these disturbances one at a time, while the real world increasingly delivers them in combination.

The implications for climate mitigation and adaptation are substantial. Soil organic carbon is frequently invoked in national climate pledges and voluntary carbon markets as a bankable sink, yet the review suggests that the security of that bank depends heavily on how often and how severely extremes strike. If multi-year droughts steadily drain carbon from grasslands and croplands, or if fires repeatedly reset accumulation cycles, the effective permanence of soil carbon storage becomes far more fragile than many accounting frameworks assume. Conversely, protecting and rebuilding soil carbon delivers benefits well beyond climate: it improves water retention in drought-prone regions, supports nutrient cycling, stabilizes soil structure against erosion, and sustains the microbial diversity on which fertility depends. Carbon stewardship, in other words, is not separable from food security or ecosystem resilience; it is the same problem viewed from different angles.

The authors are candid about the limits of the current evidence base. The article does not report newly generated datasets and does not present a dedicated limitations section, and its conclusions rest on a qualitative synthesis of selected publications. Consequently, they call for improved and more consistent evidence across soil types, land uses, and both terrestrial and aquatic environments, and across multiple temporal scales, from the instantaneous CO₂ pulse after rewetting to the multi-decadal trajectory of carbon storage. Standardizing measurements of carbon pools, microbial functions, and event intensity, they argue, would make results comparable across ecosystems and enable more confident generalization, something the field currently struggles to achieve given heterogeneous methods and site-specific reporting.

Looking forward, the review sketches a research agenda that is as technologically ambitious as it is mechanistically focused. The authors recommend integrating high-resolution remote sensing with ground observations, advanced spectroscopy, molecular analyses, and integrated modeling to track carbon as it moves through soils and into waterways. They single out several priorities: characterizing microbial genomic and functional diversity as it responds to stress, quantifying carbon stoichiometry, probing the interactions between organic matter and iron and aluminum oxyhydroxides, understanding clay-mineral protection mechanisms, tracking long-term storage outcomes, and systematically studying the sequencing of compound extreme events. Each of these threads addresses a gap in the mechanistic chain that links a weather event in the atmosphere to a molecule of carbon, stabilized or released, in the soil.

What emerges from the review is a picture of the soil carbon cycle not as a stable background process but as a dynamic, contested system whose behavior under climate extremes is far less predictable than once assumed. The same storm that floods a rice paddy and exports carbon to a river delta may, a few hundred kilometers away, end a drought and briefly green a grassland, with opposite consequences for the atmosphere. As extremes grow more frequent and more compound, the review makes the case that understanding, and safeguarding, the carbon held beneath our feet will require science that is as interconnected and as restless as the weather itself.

Keywords

soil organic carbon, extreme weather, drought, flooding, wildfire, carbon sequestration, microbial activity, dissolved organic carbon, erosion, pyrogenic carbon, climate change, soil health

Subject of Research: Impacts of climate change-induced extreme weather events (drought, flooding, wildfire) on carbon dynamics in soil

Article Title: Impacts of climate change-induced extreme weather events on carbon dynamics in soil

Article References: Bolan, N., Messiga, A. J., Sharma, S., Mukherjee, S., Bolan, S., Salehin, S. M. U., Rupngam, T., Rajan, N., Zhang, T., Yang, Y., Jagadesh, M., & Siddique, K. H. M. (2026). Impacts of climate change-induced extreme weather events on carbon dynamics in soil. Carbon Research, 5(1), Article 58. https://doi.org/10.1007/s44246-026-00300-5

Image Credits: AI Generated

DOI: 10.1007/s44246-026-00300-5

Keywords: adaptation of land management practices to climate extremes, challenges to conventional soil carbon models, Climate change impacts on soil carbon storage, effects of droughts and floods on soil microbial activity, global evidence on soil carbon dynamics, implications for greenhouse gas emissions, influence of extreme weather on nutrient cycling and water retention, resilience of soil carbon reservoirs to climate, review of climate-driven soil carbon processes, soil erosion and carbon loss due to extreme weather, soil health and agricultural productivity under climate stress, wildfire influence on soil organic matter

  •  

How far ahead can we predict the weather?

What will the weather be like tomorrow, or next week or, indeed, in a month’s time? Today’s numerical weather predictions can easily answer the first two parts of this question, but they fall short beyond about 14 days. New work on predictability limits by scientists at the University of Miami and the NOAA Cooperative Institute for Marine and Atmospheric Studies (CIMAS) say that this maximum could be extended to around 129 days – but probably no further. Whether this limit can be reached in practice, however, will depend on future improvements in forecasting technologies, they say.

Numerical weather prediction was developed in the late 1940s. Indeed, it was one of the first major applications of electronic computers. As these have advanced, so have the predictions. Indeed, thanks to ever more sophisticated mathematical models capable of analysing increasing amounts of observational data, we can now predict, for example, when hurricanes will occur as far as eight days in advance – something that was deemed impossible even a few decades ago. But how far ahead can such predictions be made?

Previous attempts to determine this predictability limit have largely relied on analysing the behaviour of very small perturbations in the atmosphere. These tiny errors, however, are inaccessible either observationally or via numerical modelling, explains Zoltan Toth of the NOAA who led this new study together with his colleague Wei Zhang. “These past studies therefore had to make some assumptions about the behaviour of the small errors, and these assumptions are necessarily somewhat arbitrary.”

Analysing the energetic balance of the atmosphere

The method developed by Toth, Zhang and their colleagues makes no reference to this error behaviour and instead goes back to analysing the energetic balance of the atmosphere, which continually absorbs solar radiation on the molecular level. In their approach, the researchers began by considering how our planet’s atmosphere would behave as a closed system, the deterministic dynamics of which preserves information about its initial state, assumed to be perfectly known. In theory, such a hypothesis would allow forecasts of the atmosphere’s behaviour right out to infinity. This is not possible in reality, they explain, because the atmosphere is obviously not a closed system: it receives and emits radiation. In the real atmosphere, the phases of photons in sunlight are completely random and cannot be determined, injecting quantum-scale uncertainty into the atmosphere.

These unknown quantum characteristics act as noise and destroy any retained information, beginning first of all on the smallest scales, explain the researchers. As these scales become bigger, noise eventually affects all parts of the system. When the total energy in the atmosphere is entirely replaced, the ability to make any prediction is completely lost.

“Using the relatively well-measured quantities of total energy in the atmosphere and the incoming and outgoing solar radiation fluxes at its upper boundary, we estimate that the range of skilful forecasts could potentially be extended from 14 days as at present to 129 (±7) days at the most,” explains Toth.

Very different from the mainstream discourse

“This result is very different from the mainstream discourse about atmospheric predictability, which to this day is strongly influenced by early publications in the field,” adds Toth. “More recently even, the authors of a 2018 article in the Bulletin of the American Meteorological Society speculated on whether current forecast systems are reaching their limits for when it comes to predicting tropical cyclones. In 2020, we argued that this limit is at least decades, if not much farther away.”

The theoretical foundation for the new methodology to determine the time limit of predictability is rather simple, he says. “At its core is a conceptual realization, which came to us intuitively. This is that the energy turnover time (that is, the time it takes for all energy in the atmosphere to be replaced by incoming solar radiation) is equivalent to the upper limit of predictability.”

While there is no complex mathematics involved, Toth notes that he and his colleagues had to find a way to describe the technique in a readily understandable way – something that was not easy, he admits, given the complexity of the subject.

Looking ahead, the researchers, who detail their present work in Advances in Atmospheric Sciences, are now looking into several other independent ways to estimate the limit of predictability. “There is no doubt, this limit has a theoretical feel to it,” Toth tells Physics World. “Yet there are a number of very practical implications for both traditional equation- and AI-based modelling of the atmosphere following on from the theory of predictability that we are also exploring in a series of ongoing studies.”

The post How far ahead can we predict the weather? appeared first on Physics World.

  •  
❌