
❌

Normal view

Open-source software tracks wrist bone motion in 3D and 4D CT scans

9 September 2026 at 18:20

In a development that could reshape how scientists study the mechanics of human movement, a team of biomedical engineers and computer scientists has unveiled an open-source software tool capable of tracking the tiny, intricate bones of the wrist as they glide and rotate during motion. The new tool, called Hierarchical 3D Registration, or 3DH, is a module within the SlicerAutoscoperM extension of the widely used 3DSlicer computing environment. Described in a study published in BioMedical Engineering OnLine, the software was validated against previously established methods using both sequential three-dimensional computed tomography, or 3DCT, scans of living participants performing thumb tasks and dynamic four-dimensional CT, or 4DCT, images of cadaveric wrists moving through flexion and extension. The results demonstrate that the open-source approach can match the accuracy of independent, previously published methodologies while offering researchers everywhere a free and reproducible path to quantifying skeletal kinematics.

The wrist has long been one of the most challenging joints for biomechanists to study. It contains eight small carpal bones, including the scaphoid and lunate, along with the radius of the forearm and the metacarpal bones of the hand, all articulating in a tightly packed arrangement that allows the remarkable range of motion humans rely on every day. Understanding how these bones move relative to one another, a field of study known as arthrokinematics, is essential for unraveling the causes of wrist instability, osteoarthritis, ligament injuries and the long-term outcomes of surgical repairs. Yet measuring those movements in living, moving joints has historically required either invasive techniques, labor-intensive manual analysis or proprietary software that few laboratories can access or verify.

Quantitative tracking of skeletal structures in vivo, with both efficiency and high temporal resolution, matters to a wide range of questions in biomechanical research, and the authors of the new study argue that the field has been held back by a shortage of accessible, semi-automated registration tools. Image registration, the computational process of aligning one three-dimensional image volume to another, lies at the heart of motion tracking from CT data. When a bone moves between two scans, its position and orientation change, and a registration algorithm must find the transformation that best overlays the bone’s image from one time point onto the next. Done well, this yields precise measurements of rotation and translation. Done poorly or inconsistently, it introduces errors that can swamp the small movements of carpal bones, which may shift by only a few millimeters and a few degrees during normal function.

The new 3DH module addresses this problem with a hierarchical strategy for registering bones across sequences of image volumes. The researchers presented and evaluated the software using two distinct classes of data drawn from previous studies. The first consisted of sequential 3DCT datasets of human participants performing various thumb tasks, in which the radius, the first metacarpal and the trapezium were the target bones. The second consisted of dynamic 4DCT datasets capturing simulated flexion-extension motion in cadaveric wrists, providing time-resolved, three-dimensional image volumes of the scaphoid and lunate in motion. By testing the tool on both static sequential scans and true dynamic imaging, the team was able to demonstrate that 3DH is not limited to a single imaging paradigm but can serve as a unified tracking solution across modalities.

To determine whether the new open-source tool could be trusted, the investigators compared the arthrokinematics computed with 3DH against values that had been previously calculated using independent approaches for the same 3DCT and 4DCT datasets. The statistical framework for this comparison was the Bland-Altman analysis, a standard method for assessing agreement between two measurement techniques. Rather than simply correlating the two sets of results, Bland-Altman analysis quantifies the mean bias, the systematic difference between methods, and the 95 percent limits of agreement, the range within which most individual differences between the methods are expected to fall. This approach is particularly well suited to method-comparison studies because it reveals whether a new technique introduces systematic error and how widely individual measurements might deviate from those of the established gold standard.

The performance figures reported in the study are striking. For the 3DCT data, in which the radius, first metacarpal and trapezium were tracked, the mean bias for the helical angle, a single-axis description of three-dimensional rotation, was just minus 0.06 degrees, with 95 percent limits of agreement ranging between minus 1.87 degrees and 1.74 degrees. Translation measurements fared nearly as well: the mean bias was 0.12 millimeters, with limits of agreement spanning from minus 2.23 millimeters to 2.00 millimeters. In practical terms, the open-source tool reproduced the rotational and translational measurements of the earlier methods to within roughly two degrees and two millimeters at the extremes, differences small enough to preserve the biological signal in most wrist kinematics experiments.

The dynamic 4DCT results told a similar story for the carpal bones. Tracking the scaphoid and lunate through simulated flexion-extension, 3DH produced mean biases of the Euler angle rotations, which decompose three-dimensional rotation into three orthogonal components, of less than 0.77 degrees about any direction. The widest 95 percent limits of agreement ranged between minus 7.11 degrees and 8.65 degrees. For translations, mean biases were less than 0.5 millimeters in any direction, with the widest limits of agreement ranging between minus 2.36 millimeters and 1.43 millimeters. The wider limits of agreement for rotations in the dynamic data likely reflect the added challenges of time-resolved imaging, including motion blur and the smaller, more complexly shaped carpal bones, but the near-zero mean biases indicate that the tool does not systematically drift away from established values.

Crucially, all target bones were successfully tracked in both the 3DCT and 4DCT datasets, meaning the hierarchical registration algorithm converged on correct solutions in every case tested. This robustness matters because registration algorithms can occasionally fail, locking onto incorrect alignments or diverging entirely, and such failures typically demand time-consuming manual intervention. A semi-automated tool that reliably succeeds across diverse bones, motion tasks and imaging protocols removes a significant bottleneck. Manual bone tracking in CT volume sequences can take hours per bone per trial, and the labor multiplies rapidly in studies involving multiple participants, multiple bones and dozens of motion cycles. By automating this process within a validated framework, 3DH promises to accelerate the pace at which wrist biomechanics data can be collected and analyzed.

The choice to build the module inside 3DSlicer, and specifically within the SlicerAutoscoperM extension, is a deliberate strategic decision with implications well beyond the wrist. 3DSlicer is a free, open-source platform for medical image computing and visualization with a large international user base spanning research, clinical and educational communities. By embedding 3DH in this ecosystem, the developers have made the tool immediately available to any laboratory already working with 3DSlicer, complete with the platform’s established infrastructure for loading DICOM data, segmenting anatomical structures and visualizing results. The authors note that the ability to track bones from both 3DCT and 4DCT data sources, with agreement to prior methodologies, demonstrates that the 3DH approach is a capable tool that could promote collaboration and consistency of results through open-source software.

Consistency is a quietly urgent issue in biomechanics. When different laboratories use different proprietary tools with undisclosed algorithms, it becomes difficult to distinguish true biological differences between study populations from mere methodological discrepancies. Open-source registration changes that calculus: the code can be inspected, verified, extended and reused, and results from different institutions become directly comparable because they are produced by identical algorithms. This transparency also lowers the barrier to entry for research groups in settings that cannot afford commercial licenses, potentially broadening the global community capable of conducting rigorous skeletal kinematics research.

The study itself emerged from a collaboration spanning several institutions. The team included Joseph J. Crisco, Amy M. Morton and John D. Holtgrewe of the Department of Orthopedics at The Warren Alpert Medical School of Brown University and Rhode Island Hospital; Cesar Lopez, Andrew Thoreson and Kristin D. Zhao of the Assistive and Restorative Technology Laboratory and the Department of Physical Medicine and Rehabilitation at the Mayo Clinic in Rochester, Minnesota; and Jean-Christophe Fillion-Robin and Beatriz Paniagua of Kitware Inc. in Clifton Park, New York. The involvement of Kitware, a company known for its leadership in open-source scientific computing, underscores the blend of academic rigor and software engineering expertise required to produce a research tool robust enough for widespread distribution. Funding was provided by the National Institute of Arthritis and Musculoskeletal and Skin Diseases of the National Institutes of Health under award numbers AR059185, AR078924 and AR071338.

The implications of this work extend naturally to the future of musculoskeletal imaging. As newer CT technologies, including photon-counting detector systems, deliver ever-finer spatial resolution and as dynamic 4DCT becomes more widely available, the volume of image data available for kinematic analysis will grow dramatically. Tools like 3DH, which are fast, semi-automated and validated across modalities, will be essential for converting that imaging bounty into quantitative biomechanical knowledge. For patients with wrist disorders, the downstream promise is equally tangible: better measurements of how carpal bones actually move in living joints can inform more accurate diagnoses, improved surgical planning, more realistic computational models of joint loading and ultimately better-designed treatments for conditions ranging from scapholunate instability to thumb-base arthritis. With the tool now openly available in the 3DSlicer environment, researchers around the world can begin putting it to work.

Subject of Research: Open-source kinematic tracking of the small bones of the wrist in sequential 3DCT and dynamic 4DCT images using Hierarchical 3D Registration

Article Title: Kinematic tracking of the small bones of the wrist in sequential 3DCT and dynamic 4DCT volume images using open-source Hierarchical 3D Registration, a module within SlicerAutoscoperM

Article References: Crisco, J. J., Morton, A. M., Lopez, C., Thoreson, A., Zhao, K. D., Holtgrewe, J. D., Fillion-Robin, J.-C., & Paniagua, B. (2026). Kinematic tracking of the small bones of the wrist in sequential 3DCT and dynamic 4DCT volume images using open-source Hierarchical 3D Registration, a module within SlicerAutoscoperM. BioMedical Engineering OnLine. https://doi.org/10.1186/s12938-026-01601-x

Image Credits: AI Generated

DOI: 10.1186/s12938-026-01601-x

Keywords: Computed tomography, 3DCT, 4DCT, Bone tracking, 3DH, 3DSlicer, Image registration, Wrist kinematics, Arthrokinematics, Open-source software, SlicerAutoscoperM, Bland-Altman analysis
AI predicts prolonged air leak after lung surgery in elderly patients

9 September 2026 at 18:09

When surgeons remove a portion of a cancerous lung, one of the most frustrating complications they can face is air. A persistent leak from the lung’s cut surface or staple lines — known as prolonged air leak — keeps chest tubes in place far longer than anyone would like, extends hospital stays, inflates costs, and elevates the risk of infection and other downstream problems. Now, a research team in China has developed a machine learning tool that predicts, with striking accuracy, which older lung cancer patients are most likely to develop this complication before it ever occurs. The study, published in BMC Cancer, combines cardiopulmonary exercise testing data with an interpretable artificial intelligence model and could reshape how thoracic surgical teams prepare for and manage one of the most common postoperative challenges in lung surgery.

The research was led by Zixiao Wang, Jiabao Ding, Huagang Liang and colleagues at the First Hospital of Qinhuangdao, in collaboration with Kai Wang of Tianjin Chest Hospital. It addressed a well-recognized gap in thoracic surgical practice. While prolonged air leak — typically defined as air leaking from the chest drainage system for more than five days after surgery — is among the most frequent complications following video-assisted thoracoscopic anatomical lung resection, the prediction models available to clinicians have historically lacked rigorous external validation and, critically, interpretability. Surgeons have been asked to trust risk scores without understanding where those risks come from, a barrier that has limited clinical uptake of computational tools in the operating room planning process.

To build their model, the investigators enrolled patients aged 60 and older with lung cancer who underwent thoracoscopic anatomical lung resection — either lobectomy, the removal of an entire lung lobe, or segmentectomy, the removal of a smaller anatomical segment. The study was designed as a dual-centre cohort investigation with both retrospective and prospective components. A total of 471 patients treated at Qinhuangdao First Hospital between January 2024 and June 2025 formed the model development cohort. A separate group of 140 patients from Tianjin Chest Hospital, enrolled prospectively between June and August 2025, provided the external validation set — a crucial test of whether the model generalized beyond the institution where it was built.

The methodology followed the emerging best-practice playbook for clinical machine learning. After preliminary data processing, the development cohort was randomly split into a training set containing 70 percent of patients and an internal validation set holding the remaining 30 percent. Because prolonged air leak affects only a minority of surgical patients, the training data were inherently imbalanced, with far more non-leak cases than leak cases — a condition that can fool machine learning algorithms into simply predicting that no one is at risk. The researchers countered this with SMOTE, the Synthetic Minority Over-sampling Technique, which generates synthetic examples of the underrepresented class to rebalance the dataset and force the algorithms to learn the genuine signature of risk.

Feature selection was performed using LASSO regression — least absolute shrinkage and selection operator — a statistical technique that penalizes model complexity and drives the coefficients of irrelevant variables to zero, effectively filtering a large panel of candidate variables down to the most predictive few. From this process, four predictors of prolonged air leak emerged: a history of emphysema, the smoking index, a previous history of thoracic surgery or chest trauma, and the ventilatory equivalent for carbon dioxide, abbreviated VE/VCO₂. This last variable is drawn directly from cardiopulmonary exercise testing, a stress test performed on a bicycle or treadmill that measures how the heart, lungs, and circulatory system respond together to increasing exertion. VE/VCO₂ reflects the efficiency of ventilation during exercise — how much air a patient must move to eliminate a given amount of carbon dioxide — and elevated values signal impaired pulmonary gas exchange and often underlying parenchymal lung disease.

With the four features in hand, the team constructed six competing machine learning models: logistic regression, support vector machine, decision tree, extreme gradient boosting, and artificial neural networks, among others. Each was evaluated using a battery of metrics including the area under the receiver operating characteristic curve, or AUC, the F1 score, and the Brier score, which measures the accuracy of probabilistic predictions. The winner was XGBoost, an ensemble method that builds a sequence of decision trees, with each new tree trained to correct the residual errors of its predecessors. In internal validation, XGBoost achieved an AUC of 0.903 (95 percent confidence interval, 0.834 to 0.960) — well within the range conventionally considered excellent discrimination — along with the highest F1 score of 0.717 and the lowest Brier score of 0.092 among all six candidates.

The external validation was arguably the study’s most important test. A model can memorize the quirks of its home institution’s patient population, equipment, and surgical practices, only to falter elsewhere. Yet when applied to the 140 previously unseen patients from Tianjin Chest Hospital, the XGBoost model maintained an AUC of 0.800 (95 percent confidence interval, 0.656 to 0.913), with a sensitivity of 0.700, a specificity of 0.833, and a Brier score of 0.133. In practical terms, the model correctly flagged seven out of ten patients who went on to develop prolonged air leak while correctly reassuring more than eight out of ten of those who did not — performance that, if replicated in routine practice, would give surgeons a meaningful window to intervene preemptively.

Interpretability was treated not as an afterthought but as a core design requirement. The researchers applied SHAP — Shapley Additive Explanations — a technique borrowed from cooperative game theory that assigns each feature a contribution value for every individual prediction. Rather than presenting clinicians with an opaque probability, SHAP reveals how much each of the four variables pushed a given patient’s risk up or down, and in which direction. Through this analysis, VE/VCO₂ emerged as the single most influential feature, followed by the other three predictors ranked by correlation. The finding is physiologically plausible: patients whose lungs ventilate inefficiently under the stress of exercise are precisely those whose lung tissue is most fragile and least likely to seal spontaneously after surgical manipulation. A history of emphysema, a heavy smoking history, and prior chest surgery or trauma each independently compound this tissue vulnerability.

The clinical utility of the work extends beyond prediction to prevention. Armed with a preoperative risk estimate, surgical teams can tailor their approach for high-risk patients. Options include more meticulous staple-line reinforcement, the use of sealants or pledgeted sutures on fragile lung tissue, choosing segmentectomy over lobectomy where oncologically appropriate, planning for ambulatory drainage systems on discharge, or scheduling earlier follow-up to catch and manage leaks before they become complicated. To lower the barrier to bedside use, the team built a web-based risk calculator that allows clinicians to enter a patient’s four variables and receive an individualized probability of prolonged air leak — no programming expertise required.

The significance of incorporating cardiopulmonary exercise testing into a surgical prediction model deserves particular emphasis. Traditional preoperative pulmonary assessment in lung cancer surgery has relied on static spirometric measures such as forced expiratory volume in one second, or FEV1, and the diffusing capacity for carbon monoxide, DLCO. These tests measure lung function at rest and provide only a partial picture of cardiopulmonary reserve. CPET, by contrast, captures the integrated response of multiple organ systems under physiological stress, and the VE/VCO₂ slope in particular has gained recognition as a sensitive marker of ventilatory inefficiency in chronic obstructive pulmonary disease and heart failure. The present study suggests that this dynamic measure carries prognostic information for surgical outcomes that static tests do not fully capture — a finding with implications well beyond air leak prediction.

Several caveats frame the work appropriately. The study population was limited to Chinese patients aged 60 and above undergoing video-assisted thoracoscopic resection, and generalization to younger patients, other surgical techniques such as robotic-assisted resection, or different health care systems remains to be demonstrated. The external validation cohort, while methodologically essential, comprised 140 patients, and wider multicenter prospective trials would strengthen confidence in the model’s performance. The published article is an accepted, peer-reviewed author manuscript shared early ahead of the final version of record. The study was funded by the Beijing Kechuang Medical Development Foundation, with the funder playing no role in study design, analysis, or manuscript preparation, and the authors declare no competing interests.

Even so, the study stands as a compelling example of where predictive medicine is heading. By pairing a rigorous dual-centre validation strategy with explainable artificial intelligence and a physiologically grounded predictor, the researchers have moved machine learning in thoracic surgery closer to genuine clinical utility rather than proof-of-concept novelty. For the growing population of older patients facing lung cancer surgery, a simple preoperative test and a few clicks in a web calculator may soon determine who needs extra surgical vigilance — and spare many of them the days of tethered chest drainage that have long been an accepted, if unwelcome, part of recovery.

Subject of Research: Machine learning-based prediction of prolonged air leak after video-assisted thoracoscopic anatomical lung resection in older lung cancer patients using cardiopulmonary exercise testing

Article Title: Machine learning-based prediction of prolonged air leak after video-assisted thoracoscopic anatomical lung resection in older patients using cardiopulmonary exercise testing: a dual-centre development and validation study

Article References: Wang, Z., Wang, K., Zhu, N., liu, H., Li, J., Liang, H., & Ding, J. (2026). Machine learning-based prediction of prolonged air leak after video-assisted thoracoscopic anatomical lung resection in older patients using cardiopulmonary exercise testing: a dual-centre development and validation study. BMC Cancer. https://doi.org/10.1186/s12885-026-16933-z

Image Credits: AI Generated

DOI: 10.1186/s12885-026-16933-z

Keywords: Machine learning, Prolonged air leak, Cardiopulmonary exercise testing, XGBoost, Lung cancer surgery, Video-assisted thoracoscopic surgery, Prediction models, VE/VCO₂, SHAP interpretability, Thoracic surgery, Predictive medicine, COPD

Rapid Wildfire Structure Risk Assessment Helps Fire-Adapted Communities

9 September 2026 at 17:27

Wildfire scientists have unveiled a new rapid risk-assessment tool that shows substantial wildfire danger to homes and buildings in three major Arctic communities, revealing that between 14% and 26% of structures in Anchorage, Fairbanks, and Whitehorse face high or very high risk from approaching flames. The study, led by Jennifer I. Schmidt of the University of Alaska Anchorage together with Robert H. Ziel, Monika P. Calef, Anna Varvak, and Julio C. Postigo, was published in the International Journal of Disaster Risk Science. Rather than relying on complex fire-behavior simulations that demand specialist analysts and expensive software, the approach combines datasets that most local governments already possess: building footprints, zoning maps, and readily available vegetation layers. The result is an updatable, affordable portrait of which buildings face the greatest threat and where mitigation dollars can do the most good.

The urgency behind the work is hard to overstate. Wildfire costs and damages in the United States alone are now estimated at between USD 394 billion and 893 billion annually, and the 2019 to 2020 Australian fire disasters cost nearly USD 100 billion. The Arctic, often imagined as too cold and wet to burn, is not immune: since 1980, wildfires have cost Alaska between USD 2 billion and 5 billion, with projections suggesting costs could rise 68% by the end of the century. Canadian suppression expenses are expected to climb by 60 to 110% relative to the 1980 to 2009 baseline. Meanwhile, structure loss from wildfire has doubled over the past two decades in the western United States, and western Canada has suffered major structure-loss events in four of the last eight fire seasons. Nearly half the global population now lives within the wildland-urban interface, the zone where people and forests meet or intermingle, making tools that translate fire science into actionable local maps increasingly vital.

The researchers’ central premise is conceptually simple but technically consequential: for a structure to be at high risk, a flammable hazard must exist nearby, within roughly 500 meters, and the surrounding landscape must exhibit high wildfire exposure. The method begins with a flammability hazard layer at 30-meter resolution, built from a modified version of NASA’s ABoVE Landcover dataset in which generic evergreen classes were refined to reflect locally flammable species such as black spruce, white spruce, lodgepole pine, and subalpine fir, each assigned hazard ratings from 0 to 100. Critically, the team treated structures themselves as fuel. Each building contributes three fuel units to the surrounding flammability score, a value chosen after systematic testing of one through ten fuel units; three proved optimal, nudging densely built environments up a hazard category without causing wholesale reclassification. Structure density was computed at 90-meter resolution, multiplied by three, and added to the vegetation-based hazard to produce an enhanced flammability hazard layer.

Wildfire exposure, the second pillar of the assessment, captures the potential for hazard to travel. It is calculated as the average flammability hazard within a 100-meter or 500-meter radius, representing the likelihood that fire can reach and burn a given location even if the local fuels themselves are sparse. Exposure values, also ranging from 0 to 100, are classified into five tiers from very low to extreme, and concentrated pockets of flammable vegetation drive scores upward. The third ingredient is structure vulnerability, produced by multiplying the enhanced flammability hazard by a structure importance factor derived from zoning data: residential buildings and critical infrastructure such as hospitals, schools, and nursing homes receive the highest weight, followed by commercial and other structures. Where zoning was unavailable, as on military installations like Joint Base Elmendorf-Richardson in Anchorage and Fort Wainwright and Eielson Air Force Base in Fairbanks, the team collaborated with base personnel or interpreted aerial imagery to classify neighborhoods. The final risk score synthesizes hazard, exposure, and vulnerability into six categories, from extremely low to very high.

The results paint a nuanced picture of Arctic fire danger. Fairbanks showed the greatest proportion of structures in the top two risk categories at 26%, followed by Whitehorse at 22% and Anchorage at 14%. Anchorage, paradoxically, had the highest share of buildings in the top vulnerability tiers, 42%, yet the lowest risk, a consequence of its large urban footprint where dense housing raises vulnerability but fragmented, less-flammable vegetation and abundant developed ground suppress exposure. Fairbanks and Whitehorse, with structures woven into spruce- and pine-dominated boreal landscapes, showed closer alignment between vulnerability and risk. Anchorage was also the only study area where more than 1% of cells jumped two or more flammability categories when buildings were counted as fuel, at 7%, reflecting its 27% share of structure area containing seven or more buildings per cell. The analysis also confirmed the primacy of exposure: when a structure’s wildfire exposure was extreme, at least 87% of such buildings landed in the highest risk category across all three communities.

A key innovation lies in how the team redrew the wildland-urban interface itself. Traditional WUI maps distinguish urban, interface, and intermix zones; the researchers added a fourth category, the transmission zone, marking areas roughly 2.4 kilometers beyond the WUI boundary where fire could move into a community and where fuel breaks might be sited. Within the 500-meter buffer around structures, urban areas were defined by exposure values of 20 or less, interface zones by 21 to 60, and intermix by values above 60, cross-referenced with Alaska and Yukon wildfire management designations that prioritize suppression from critical down to unplanned or wilderness levels. Fairbanks claimed the largest overall WUI footprint, and the transmission zone proved the largest category in every study area, spanning 23,347 square kilometers around Anchorage, 6,180 square kilometers around Fairbanks, and 665 square kilometers around Whitehorse. Across all sites, most structures fell within interface zones, 52 to 61%, followed by intermix at 20 to 35%. Thousands of buildings sit in the high-risk interface and intermix zones where mitigation should concentrate: 15,537 structures in Anchorage, 16,212 in Fairbanks, and 3,734 in Whitehorse.

The method faced its most demanding test against a real disaster. On 17 August 2019, during southcentral Alaska’s hottest and driest summer on record, the likely human-caused McKinley wildfire was driven by high winds across 13.3 square kilometers in three days, destroying 52 residential structures, 84 outbuildings, and three commercial buildings, affecting 1,028 properties and forcing roughly 350 to 400 people to evacuate. By comparing pre-fire aerial imagery from 2017 with post-fire imagery from 2020 at 0.3-meter resolution and linking vanished buildings to the Matanuska-Susitna Borough structure database, the team identified exactly which structures burned. The verdict was statistically compelling: burned structures had significantly higher wildfire exposure than those that survived, and the proportion of burned structures with exposure values above 60 was significantly larger than among unburned ones. Structure risk scores above 60 were also significantly associated with burning. Notably, the test held even under conditions so extreme that normally resistant, low-flammability fuels were igniting.

The study’s design was shaped by sustained community engagement. Through workshops in 2019, 2021, and 2023, along with 15 to 20 meetings organized by Anchorage community councils and landowner associations and public events ranging from wildfire awareness days to Arbor Day, residents and agency staff reshaped everything from color schemes to model parameters. One consequential example: Anchorage residents and fire managers insisted that the maps reflect the spruce beetle outbreak first detected in 2016 and peaking around 2020, which killed and removed many spruce trees. The team responded with rules derived from aerial detection surveys, reclassifying white spruce cells in areas of beetle intensity of 11% or greater to mixed forest, and shifting mixed forest cells to open shrub, while a succession model updated vegetation on areas burned within the last 30 years. This iterative dialogue ensured outputs that both wildfire practitioners and the general public can interpret, a prerequisite the authors see as central to building fire-adapted communities.

The practical implications for planning are direct. Because mitigation funding is often tied to officially designated WUI areas, the ability to rapidly recalculate boundaries from updated building layers expands funding opportunities and keeps pace with community growth. The framework also points to different interventions in different zones: structures in intermix areas, surrounded by vegetation, benefit most from fuel treatments, while those in interface zones, where flammable vegetation is scarcer, are better served by home hardening measures such as fire-resistant roofs, siding, decks, screens, and unburnable buffers. Given that wildfire activity tends to occur where exposure exceeds 60, the authors recommend concentrating resources on the top two risk categories. Where national products like wildfirerisk.org rely on generalized fuel layers that can overestimate unburnable area in WUI zones and are updated too slowly for annually burning landscapes, this approach trades complexity for transparency, using local data that governments already collect. The underlying wildfire exposure toolbox is publicly available on GitHub, and the team argues that empowered residents, equipped with accurate, current, neighborhood-scale information, are crucial to reducing wildfire risk, particularly where communities may prefer action without government intervention.

Subject of Research: Rapid assessment of wildfire risk to structures and wildland-urban interface delineation in Arctic communities using local vegetation, building footprint, and zoning data.

Article Title: Fueling Fire-Adapted Communities Through a Rapid Wildfire Structure Risk Assessment

Article References: Schmidt, J. I., Ziel, R. H., Calef, M. P., Varvak, A., & Postigo, J. C. (2026). Fueling Fire-Adapted Communities Through a Rapid Wildfire Structure Risk Assessment. International Journal of Disaster Risk Science, 17(2), 351-362. https://doi.org/10.1007/s13753-026-00716-y

Image Credits: AI Generated

DOI: 10.1007/s13753-026-00716-y

Keywords: Arctic, Wildfire, Risk assessment, Wildland-urban interface, WUI, Mitigation planning, Structures, Fire-adapted communities, Wildfire exposure, Flammability hazard, Alaska, Yukon

New Genetic Evidence of an Ancient Killer Has Surfaced After Being Concealed in Medieval Texts for Centuries

7 September 2026 at 13:50

The story of a Medieval European plague is coming into focus through historic manuscripts, but not in the way you might think. Instead of providing mere historical accounts, the animal skins from which these Medieval volumes are constructed provide genetic evidence for reconstructing the 3,500-year story of the sheepox virus (SPPV), which decimated European livestock.

In a recent paper published in Science Advances, an international team of interdisciplinary researchers ranging from geneticists and virologists to historians and conservators explored the history of this pre-modern plague.

The new work combs through Medieval history to reveal the lineages of diseases plaguing modern herds, providing new insight into the viruses threatening modern animal agriculture.

Medieval Texts

Chosen for the work were some of the most important Medieval manuscripts that Europe has to offer, including the millennium-old York Gospels, one of the best surviving examples of an early Anglo-Saxon illuminated manuscript. Another work used in the study was one of the earliest known English dictionaries, the Corpus Glossary of Corpus Christi College, Cambridge. Beyond these notable examples, the team exploited a variety of English and continental European works.

Medieval volumes did not contain paper pages like modern books, but instead, vellum pages made of calfskin, as well as the skins of goats and sheep. Therefore, these works are preserved as hundreds-of-years-old biological specimens for modern geneticists.

SPPV tends to target younger animals, such as the calves from whom vellum is made, and is highly contagious, rapidly spreading through large portions of a herd. While these factors made the disease easier for modern researchers to study via vellum samples, it also made it devastating to wool, meat, and milk production.

Extracting DNA

“The recording of ancient DNA of pathogens has completely changed our understanding of infectious disease in the past, and here we show that parchment can also preserve animal pathogen DNA. It is possible that archives and libraries around the world also contain the genetic traces of disease outbreaks in animals in the past,” said lead author Louis L’Hôte, PhD candidate at the University of Cambridge, Dublin.

“These genomes help us understand how these pathogens evolved and how they impacted past societies – such as sheeppox virus, which we show has been affecting Eurasian sheep herds for at least three and a half millennia,” L’Hôte added.

With the rapid spread of SPPV across herds, many manuscripts contained SPPV DNA on multiple pages within the same manuscript. Additionally, finding SPPV DNA on pages made from both calf and goat skin marks it as a rare example of cross-species infection.

“Parchment making has been considered a vanishing craft, but we are beginning to understand just how much of the past it has retained. This project shows that parchments not only preserve our cultural history for hundreds of years, but also the landscape of disease in our livestock in the medieval period,” said supervising author Dr Kevin G. Daly, Associate Professor at UCD School of Agriculture and Food Science.

“This kind of exciting, surprising discovery is only possible when researchers from a range of disciplines come together to share their expertise and data,” Day said, calling this “a generosity and trust that collaborative science depends on.”

Exploring Medieval DNA

The Medieval manuscripts combine with even older surviving biological records, such as teeth, to show the virus reaching back 3,700 years. Between the manuscripts and archaeological finds, the team identified 41 samples containing related viruses.

Along with the goatpox virus and the lumpy skin disease virus, SPPV belongs to a category called capripoxviruses. The new research allowed the team to compare the ancient and modern sequences to determine that the division between the various viruses in the group occurred between 3,700 and 11,500 years ago, around the time animal domestication took hold in Europe as sheep came off the steppe.

“Ancient genomes can help us understand how these pathogens affecting us today evolved. We find that, unlike the smallpox virus, the sheeppox virus genome was very stable over the last few millennia,” L’Hôte concluded. “This might mean that genetic changes before this point were very important to how the sheeppox virus evolved to infect its host, which may help us fight the pathogen in the future.”

The paper, “3,500 years of Sheeppox Virus Evolution Inferred from Archaeological and Codicological Genomes,” appeared in Science Advances on September 2, 2026.

Ryan Whalen covers science and technology for The Debrief. He holds an MA in History and a Master of Library and Information Science with a certificate in Data Science. He can be contacted at ryan@thedebrief.org, and follow him on Twitter @mdntwvlf.

Seismic waves reflected from Earth’s core moved parts of Japan 5 mm east

14 August 2026 at 15:00
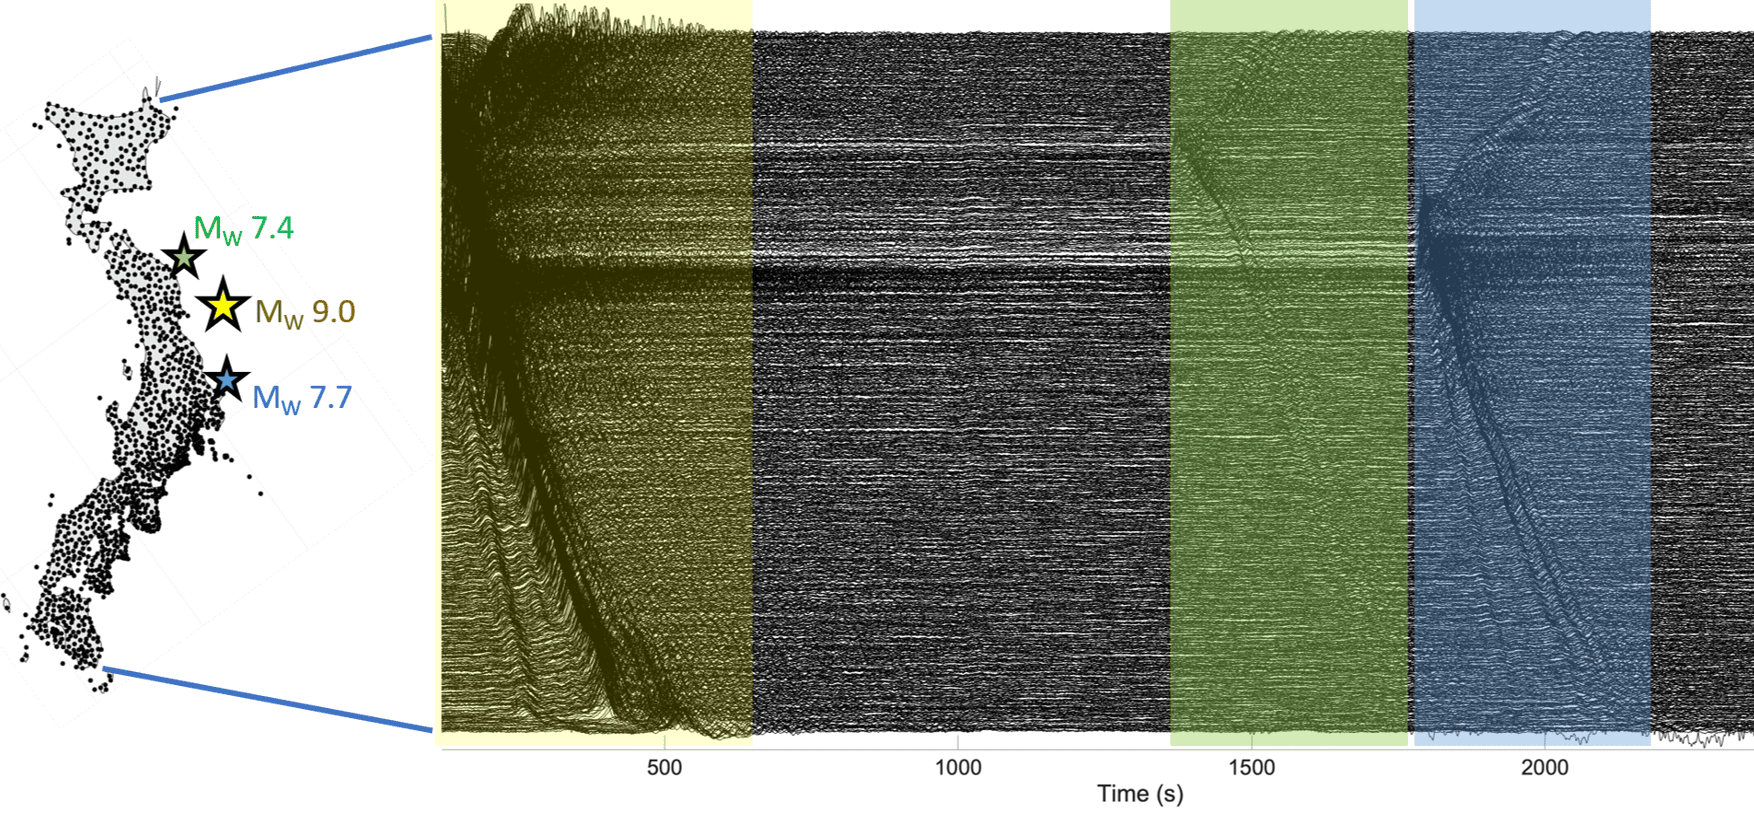
(left) A map of Japan densely covered with dots. Three stars off its eastern coast show the locations of the epicentres. (right) Graph showing eastward components of ground motion at each site. The graph resembles a bunched-up sheet, with the biggest bunches associated with the main quake (a period of up to ~600 s shown in yellow) and the two aftershocks shown in green and blue at 1500s and 2000s respectively.
Shifting eastward (left) A map of Japan showing the epicentres of the main shock (Mw 9.0) and two strongest aftershocks (Mw 7.7 and 7.4) in the Tohoku-Oki earthquake. Each black dot represents a GNSS station. (right) The observed eastward components of ground motion at each of the GNSS sites from northeast (top) to southwest (bottom) of Japan are shown in black traces, with the shaded areas representing ground motion corresponding to the main shock and the aftershocks. (Courtesy: Sunyoung Park; motion data from P Xu et al. Earth, Planets and Space 71 43 2019)

A previously unrecognized source of seismic hazard caused parts of Japan to move eastwards by up to 5 mm within minutes of the 2011 Tohoku-Oki earthquake. Conventionally, such shifts occur when seismic waves generated by rupturing tectonic plates cause the plates to slip, triggering movements of the land mass and the ocean floor. But a new study finds that in the Tohoku-Oki quake, the real culprit was waves that travelled down to Earth’s core and back – a phenomenon more usually associated with efforts to image structures deep inside the Earth.

The 2011 Tohoku-Oki quake occurred at the boundary between the Pacific plate and the North American plate, with an offshore epicentre around 130 kilometres east of Sendai. At magnitude 9, it was one of the largest recorded earthquakes in history, and it caused widespread devastation, including thousands of fatalities. The tsunami that followed exacerbated this damage, with meltdowns of three out of six nuclear reactors at the Fukushima Daiichi power station releasing radioactive caesium into the air and water and prompting a large-scale evacuation with long-term health impacts.

The earthquake was bigger than most models estimated, which compelled seismologists to examine and revise existing models of the largest possible earthquakes and their frequencies in the boundaries of tectonic plates. Instrumented records of this earthquake are still revealing new information about geophysical processes in the boundaries of tectonic plates.

Surface to core and back

In the new work, researchers led by Sunyoung Park at the University of Chicago, US studied shear waves recorded following the earthquake in Japan’s dense network of high-rate Global Navigation Satellite System instruments. Along with the expected seismic waves from the earthquake rupture, the team found so-called ScS waves that travelled thousands of kilometres through the Earth, bounced off the core and travelled back to the surface, arriving across Japan almost simultaneously 13 minutes after the main shock. “The name ScS reflects that path: S[hear] through the mantle, c for reflection at the core-mantle boundary, and then S again on the return path,” Park explains.

Although seismologists have studied ScS waves extensively, they have mostly done so for the purpose of imaging the deep Earth. “Because [ScS waves] reflect from the core-mantle boundary, they have helped constrain the depth and properties of the core-mantle boundary; the structure of the lowermost mantle; attenuation and anisotropy in the mantle; and source characteristics of large earthquakes,” Park explains.

The team’s study offers the first evidence that ScS waves can also trigger significant displacement-causing slip after an earthquake, meaning that earthquake hazard researchers may need to consider these waves to fully capture consequences of earthquake ruptures on the land as well as deep within tectonic plates.

A high-quality, high-resolution dataset

Two aspects of the Tohoku-Oki earthquake made it an incredible opportunity to study the role of ScS waves in triggering a slip event. The first is the nature of the earthquake itself. As well as releasing tremendous amounts of energy, it occurred on a shallow tectonic fault that is dipping down. This combination sent strong shear wave energy travelling nearly vertically down to the core, generating ScS waves strong enough to trigger movement in the tectonic plates.

The second was the quality and resolution of data. “Because Japan is so densely instrumented, we can look for small, coherent signals that would likely be invisible elsewhere,” Park says. “This made it a natural case in which to ask whether delayed seismic phases might trigger additional deformation.”

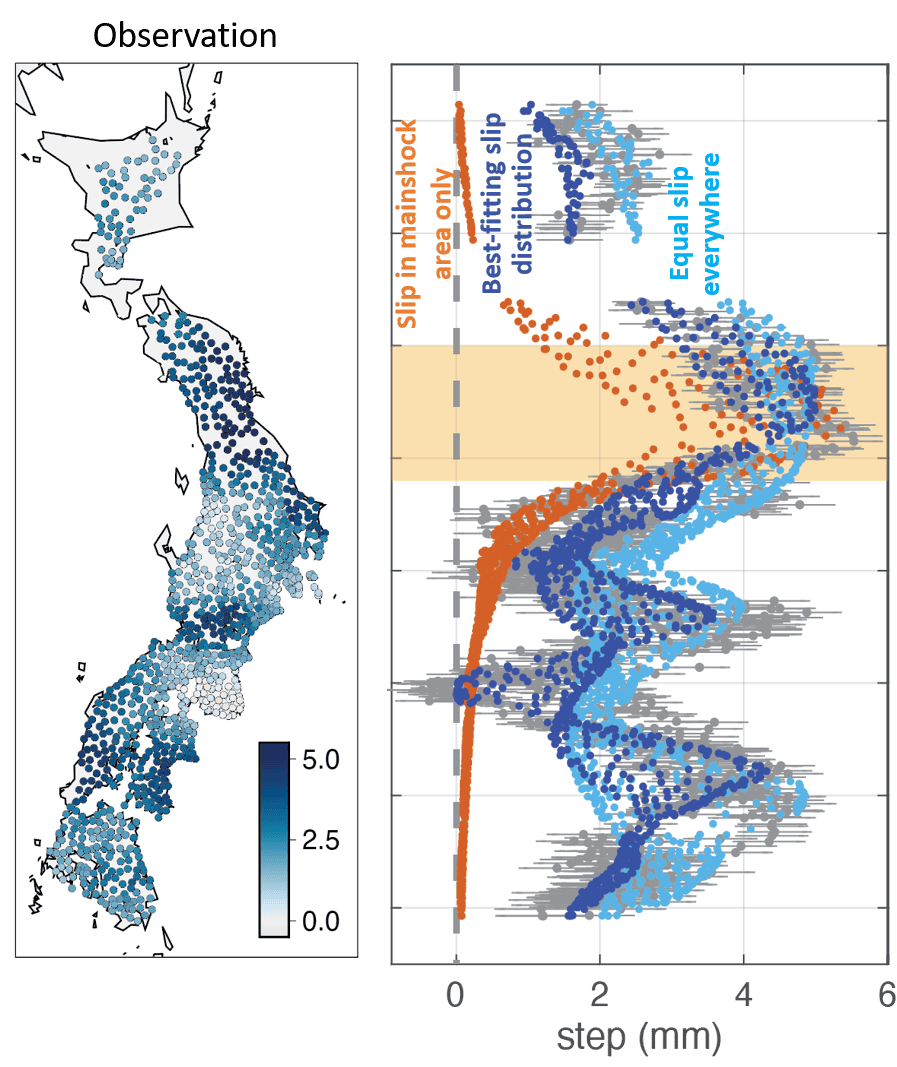
Working with Hiroo Kanamori at the California Institute of Technology (Caltech), US, and Luis Rivera at the University of Strasbourg, France, Park considered whether Earth’s elastic response to the main shock could explain Japan’s 5-mm displacement. To better understand this possibility, they calculated displacements at all the instrumented locations for many possible configurations of the earthquake rupture. However, the results did not reproduce the observed eastward motion.

At left, a map of Japan covered with dots in different shades of blue, with lightest blue representing no displacement and the darkest blue representing 5mm displacement. Large areas of Japan, especially the northeast, are dotted in dark blue. At right, a set of orange, dark blue and light blue dots representing the results of different models of displacement. The simulated data for equal slip everywhere fits the observed data better than the data for slip in main shock area only.
Competing models (left) Observed displacements in mm shown with coloured dots at each GNSS site across Japan. (right) The calculated displacement that would have occurred for slip only in the main shock area (orange dots), equal slip across the tectonic plates (light blue dots) and best fit slips corresponding to the observed displacement (dark blue dots). (Courtesy: Sunyoung Park)

The researchers then simulated possible slip scenarios across the tectonic plate interfaces, hoping to better characterize the levels and spatial extent of the slip that caused the eastward displacement. “The inferred slip event likely involved interfaces where the Pacific plate subducts beneath the Okhotsk Plate, and where the Philippine Sea plate subducts beneath the Eurasian plate,” Park says. Exactly how far this slip propagated, however, is still unknown because of the paucity of instrumented locations beyond Japan.

A slow-motion slip

Although the most memorable earthquakes and tsunamis are the ones that manifest havoc on Earth’s surface, the tectonic plates underneath are in perpetual but slow motion. At higher depths, these slow-moving plates produce earthquake events that unfold over days or weeks. Such events are called slow-slip or silent earthquakes and are important for accumulating and releasing stress as part of the earthquake cycle.

Rather than triggering a fast earthquake rupture, the ScS waves from the Tohoku-Oki quake appear to have set off a slow slip event spread over a very large area at intermediate depths of 20–60 km. This is the depth range where seismologists commonly observe silent earthquakes, and it provides avenues for understanding the dynamic processes that impact the earthquake cycle. This continuous flux in Earth’s deeper layers is a source of curiosity for many seismologists, including Park.

“A broader motivation for me is a general interest in deep-shallow interaction in the Earth,” Park tells Physics World. “I am especially interested in cases where processes or wave propagation involving the deep interior can influence faulting and deformation in the shallow lithosphere or vice versa.”

The researchers report their findings in Science.

The post Seismic waves reflected from Earth’s core moved parts of Japan 5 mm east appeared first on Physics World.

❌