❌

Normal view

Super Typhoon Bavi

9 July 2026 at 05:01
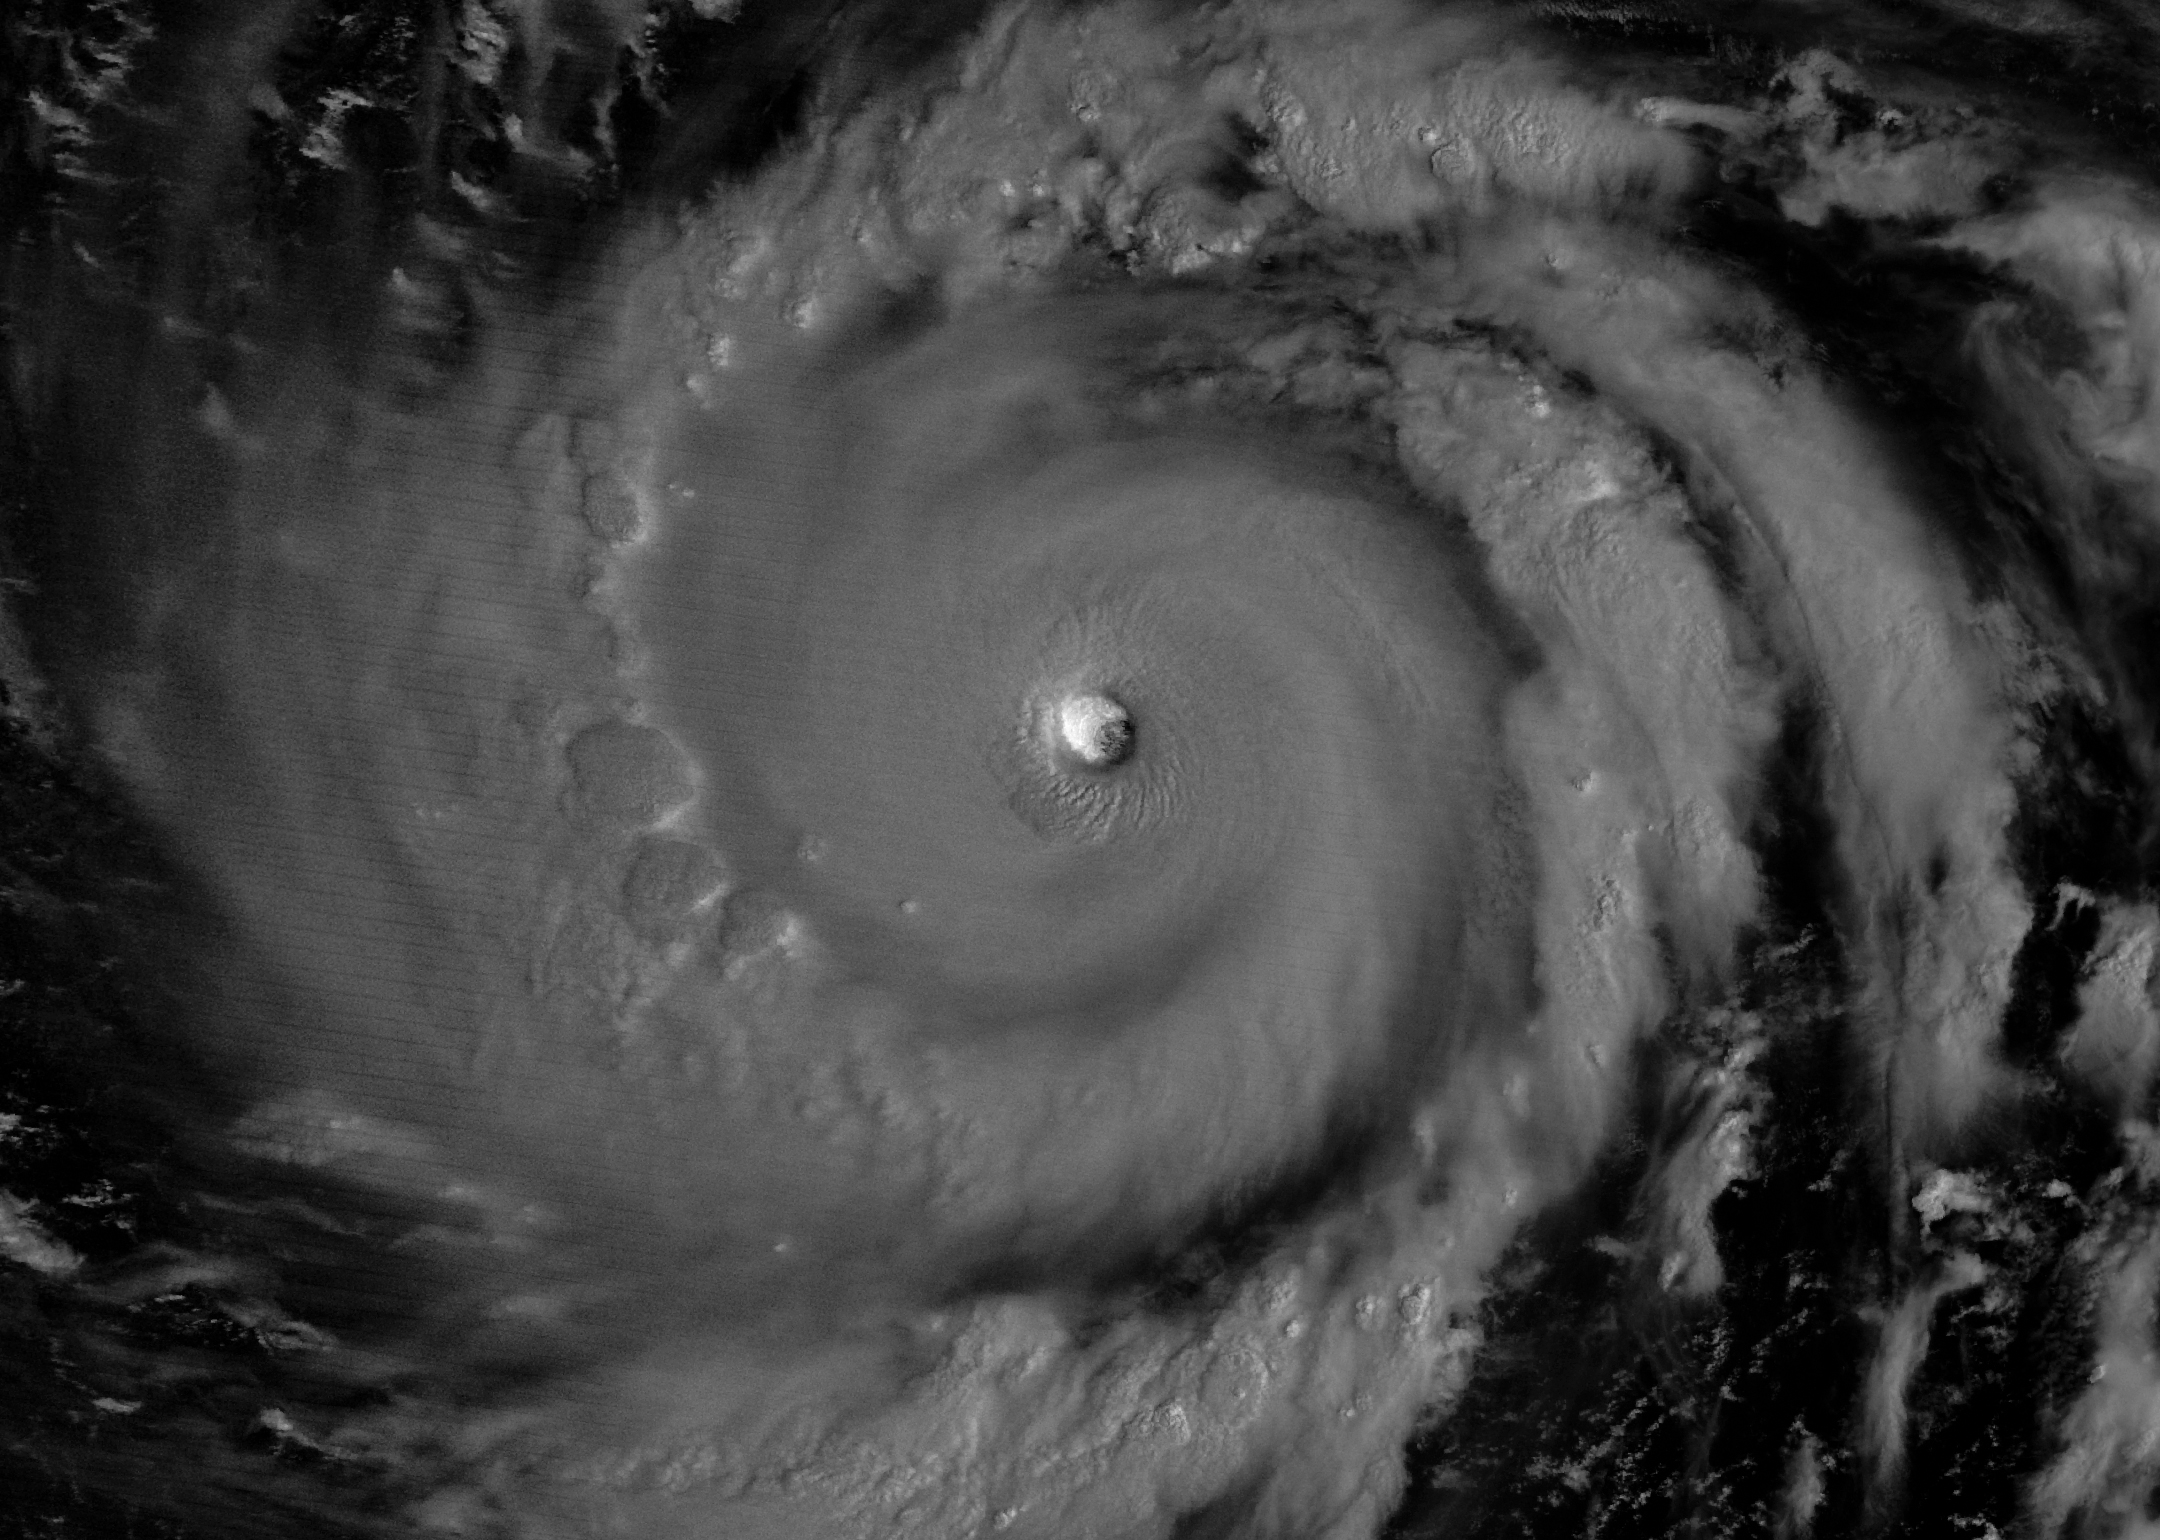
The eyewall of a super typhoon is partially illuminated by moonlight in a nighttime satellite image.
Moonlight illuminates the western side of Super Typhoon Bavi’s eyewall at about 15:30 Universal Time on July 5 (1:30 a.m. local time on July 6). The image was acquired with the VIIRS (Visible Infrared Imaging Radiometer Suite) day-night band on the NOAA-20 satellite.
NASA Earth Observatory/Michala Garrison

In early July 2026, for the second time in three months, a powerful typhoon crossed the U.S. Northern Mariana Islands and Guam in the North Pacific Ocean. Super Typhoon Bavi was at peak intensity when it neared the islands on the night of July 5, bringing winds of 290 kilometers (180 miles) per hour, along with torrential rain and dangerous storm surge.

This nighttime image, captured by the VIIRS (Visible Infrared Imaging Radiometer Suite) on the NOAA-20 satellite, shows Bavi’s eye at about 15:30 Universal Time on July 5 (1:30 a.m. local time on July 6). Light from the Moon, which was in the waning gibbous phase, illuminates the eyewall’s western side. The eye passed over Rota, north of Guam, several hours after the image was acquired.

Bavi became a super typhoon in the early hours of July 4 local time while tracking west over the warm ocean. Satellite observations indicated that sea surface temperatures were around 30 degrees Celsius (86 degrees Fahrenheit) in the region. Bavi was the third tropical cyclone in 2026 to reach category 5 intensity on the Saffir-Simpson wind scale.

The typhoon caused extensive damage across Guam, Rota, and Saipan, according to news reports, downing power poles and lines; flooding roads and littering them with debris; and damaging buildings, including a water distribution station on Rota. U.S. Coast Guard crews worked to clear navigation hazards in the waterways around Guam and the Northern Marianas and reopen ports as dangerous marine conditions subsided, according to reports. This damage comes on top of destructive winds and flooding from Super Typhoon Sinlaku, which crossed the islands in mid-April.
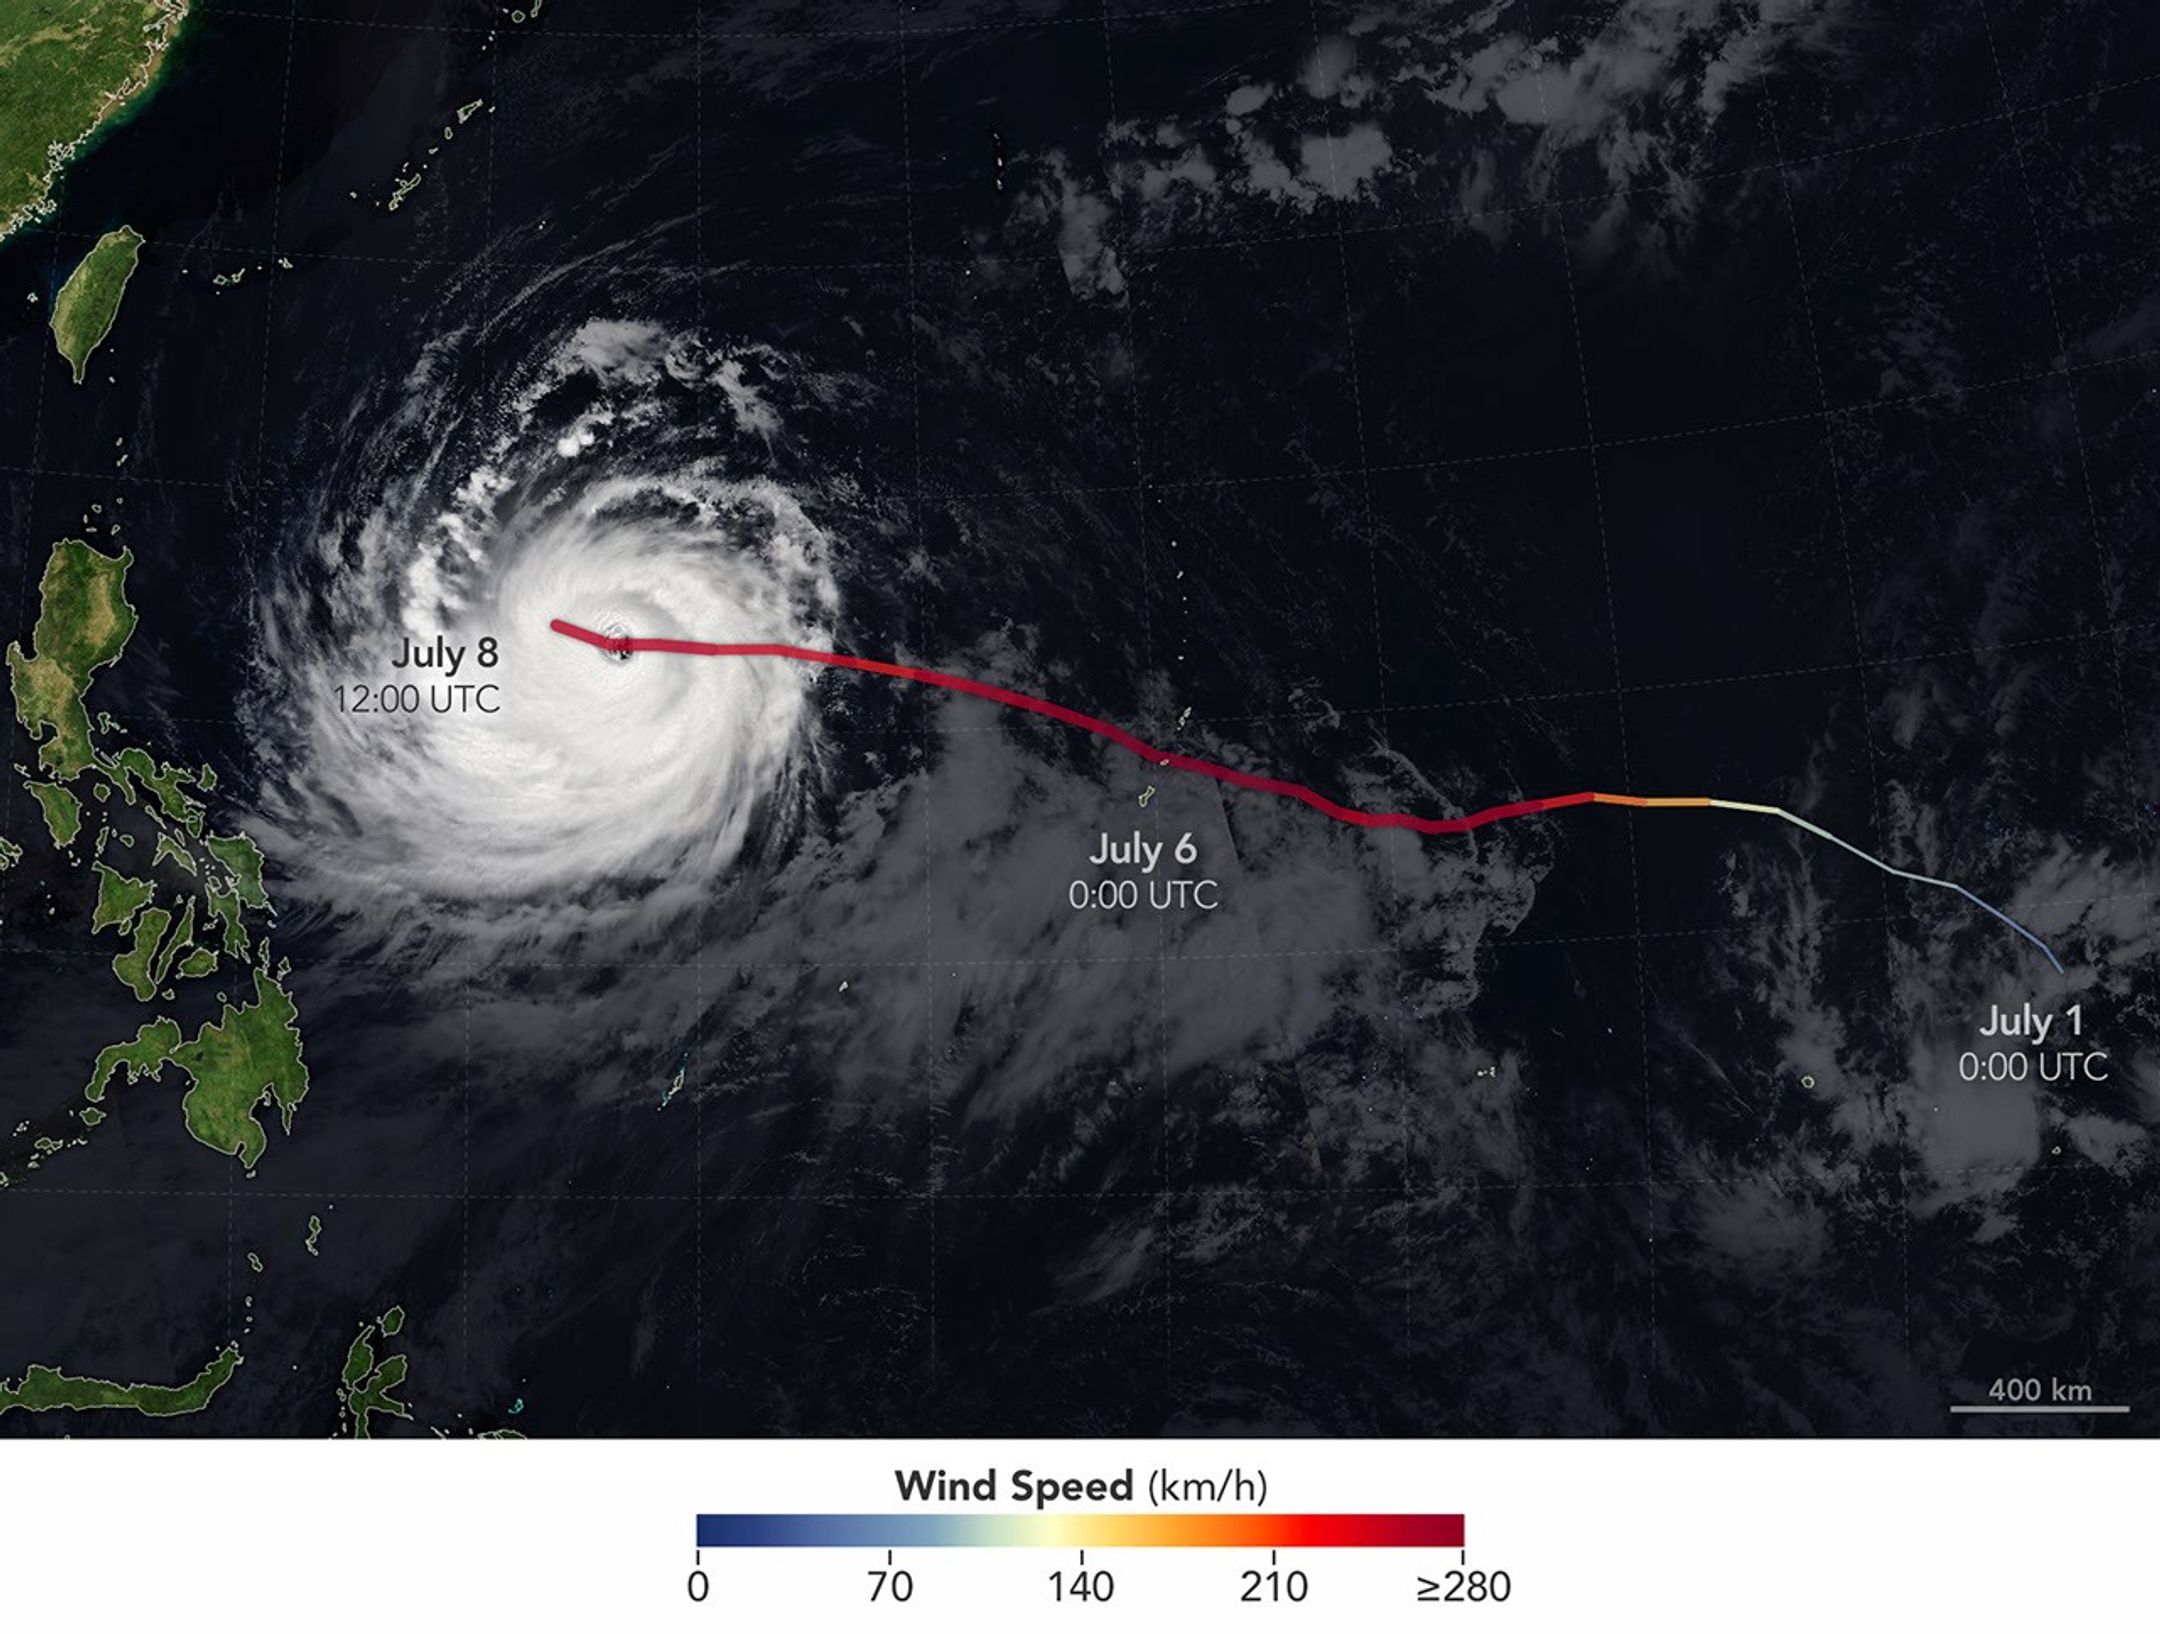
The spiraling clouds of Super Typhoon Bavi appear over the Philippine Sea southeast of Taiwan. The storm’s westward track is shown in colors corresponding to wind speed.
Super Typhoon Bavi tracked west over the Northern Mariana Islands toward Asia in early July 2026. The storm’s clouds and path are overlaid on a Blue Marble: Next Generation image built from scenes captured by the MODIS (Moderate Resolution Imaging Spectroradiometer). The image of the storm was captured by the VIIRS (Visible Infrared Imaging Radiometer Suite) on the NOAA-21 satellite on July 8, 2026, at about 04:30 Universal Time.
NASA Earth Observatory/Michala Garrison

On July 8, Bavi remained a powerful typhoon as it moved west over the Philippine Sea. In the early afternoon, when the image above was captured, the National Weather Service reported maximum sustained wind speeds of 250 kilometers (155 miles) per hour. Forecasts indicated the typhoon’s track could bend northwest toward Taiwan, the Ryukyu Islands of southern Japan, and mainland China and weaken over the next several days.

Writing in Yale Climate Connections, meteorologist Jeff Masters said that Bavi is the type of storm that might be expected when a strong El Niño event is building, which is currently the case. El Niño-year typhoons may form farther east, giving them more time over warm water to intensify before curving toward Asia, Masters explained, “resulting in a greater chance of reaching Category 5 intensity.”

NASA Earth Observatory images by Michala Garrison, using data from NASA EOSDIS LANCE, GIBS/Worldview, and the Joint Polar Satellite System (JPSS), and hurricane track data from the U.S. Naval Research Laboratory. Story by Lindsey Doermann.

Downloads

The eyewall of a super typhoon is partially illuminated by moonlight in a nighttime satellite image.

July 5, 2026

JPEG (1.47 MB)

The spiraling clouds of Super Typhoon Bavi appear over the Philippine Sea southeast of Taiwan. The storm’s westward track is shown in colors corresponding to wind speed.

July 8, 2026

JPEG (1.54 MB)

References & Resources

You may also be interested in:

Stay up-to-date with the latest content from NASA as we explore the universe and discover more about our home planet.

Super Typhoon Sinlaku

3 min read

The violent storm aimed at the U.S. Northern Mariana Islands and Guam in mid-April 2026.

Article

Typhoon Jangmi

2 min read

The sprawling storm promised to deliver torrential rain across a wide swath of southern Japan.

Article

Gravity Waves From Super Typhoon Sinlaku

4 min read

Satellites observed striking upper-atmosphere phenomena generated by an intensifying tropical cyclone.

Article

Cottonwood Fire Chars Utah

8 July 2026 at 05:01


June 5
June 29

Mountainous landscapes appear green and untouched by fire in a satellite image acquired on June 5, 2026.
NASA Earth Observatory/Michala Garrison

An image of the same area shows a large brown patch spanning much of the image in an image acquired after the fire on June 29, 2026.
NASA Earth Observatory/Michala Garrison

Mountainous landscapes appear green and untouched by fire in a satellite image acquired on June 5, 2026.
NASA Earth Observatory/Michala Garrison
An image of the same area shows a large brown patch spanning much of the image in an image acquired after the fire on June 29, 2026.
NASA Earth Observatory/Michala Garrison

June 5

June 29


A burned landscape spans more than 150 square miles (390 square kilometers) of rugged terrain northwest of Junction, Utah, as seen in this pair of images captured by the OLI (Operational Land Imager) on Landsat 8 and Landsat 9 on June 5, 2026 (left) and June 29, 2026 (right). NASA Earth Observatory images by Michala Garrison.

After a winter of below-average snowpack and an unusually warm and dry start to summer, the National Interagency Fire Center warned that the Great Basin and parts of the Rockies faced an elevated risk of wildfires in July 2026.

The warning proved accurate. By July 7, firefighters labored to contain nearly three dozen large, early-season wildland fires that raced through forests in several parts of the western U.S. Utah was among the most active states, with fires having charred 558 square miles (1,445 square kilometers) and four major fires that were not fully contained still burning.

The Cottonwood fire ranked as one of Utah’s—and the country’s—largest and most destructive fires of the year so far. As of July 7, it had burned 150 square miles (390 square kilometers), just shy of the Babylon fire in eastern Utah. Landsat 9 captured the false-color image (bands 7-5-4) above (right) on June 29, 2026, when blackened vegetation spanned a large patch of rugged terrain along the Beaver River. The image on the left shows the same area on June 5, a few weeks before the fire ignited. In this band combination of shortwave infrared, near infrared, and visible light, unburned vegetation appears bright green, snow is blue, and clouds are white.

Ponderosa pine, oak, sagebrush, and grasses were among the vegetation types that burned. Officials with the state’s forestry division told news media that the Cottonwood fire had destroyed up to 150 structures. Eagle Point Ski Resort, which lost more than 100 condos and 30 cabins, also reported damage to four of its five chairlifts.

The damage to forests was extensive, though isolated patches survived largely unscathed, remaining as green oases within the broader burned area. Among them were the forests around Tushar Campground, the site of a 4-H summer camp. Beaver County officials credited years of forest treatments, such as clearing brush and trimming branches, with helping save the campground and surrounding forests.

The fire spreads especially rapidly on June 23 and June 26. The fire perimeters in this visualization are based on data from NASA’s Fire Events Data Suite.
NASA Earth Observatory/Michala Garrison

As the fire spread, NASA’s Fire Events Data Suite (FEDS) tracked its progression and rate of growth. The visualization above, based on the FEDS system, shows the fire surging on June 23 and tripling in size over 12 hours that day as it spread to the north, east, and south. It also grew rapidly on June 26, when it made a run to the north. FEDS draws on data from the VIIRS (Visible Infrared Imaging Radiometer Suite) sensors aboard the Suomi NPP, NOAA-20, and NOAA-21 satellites, which detect active fires day and night by their thermal infrared signature.

FEDS is one of several tools available to firefighters and emergency management officials when responding to fires. First responders often rely on higher-resolution airborne imagers or on firefighters walking fire edges to map perimeters. FEDS offers a different advantage: consistent, easily accessible data that do not need to be specially requested, according to Tempest McCabe, a University of Maryland scientist based at NASA’s Goddard Space Flight Center who helped develop the tool. As a result, FEDS often detects a fire’s start earlier than other sources and tracks blazes for their full duration. To capitalize on strengths like these, the FEDS team is working closely with operational fire behavior analysts, with support from NASA’s FireSense program, to better understand and anticipate periods of rapid fire spread.

A total of 1,289 firefighters have been deployed to the Cottonwood fire, according to InciWeb, a website managed by the National Interagency Fire Center. As of July 7, the fire was 56 percent contained, but forecasters expect a hot, dry weather pattern to persist in the coming days, with fire behavior likely to be “very active to extreme” over the next 72 hours.

Government satellite data are part of a global system of observations used to track fire behavior and analyze emerging trends. Among the real-time wildfire monitoring tools that NASA makes available are FIRMS (Fire Information for Resource Management System), the Worldview browser, and the Fire Event Explorer.

As of July 7, 2026, fires had burned 5,265 square miles (13,636 square kilometers) across the United States, according to the National Interagency Fire Center. That’s 46 percent more than the 10-year average (2016-2025) for that point in the season.

NASA Earth Observatory images by Michala Garrison, using Landsat data from the U.S. Geological Survey and fire perimeter data from the Fire Events Data Suite. Story by Adam Voiland.

Downloads

Mountainous landscapes appear green and untouched by fire in a satellite image acquired on June 5, 2026.

June 5, 2026

JPEG (1.39 MB)

An image of the same area shows a large brown patch spanning much of the image in an image acquired after the fire on June 29, 2026.

June 29, 2026

JPEG (1.41 MB)

An animation shows the expansion of the fire between June 23 and July 7, with the burned area from the fire beginning as a small patch near Beaver, Utah, and then spreading north, east, and south.

FEDS fire perimeter (June 23-July 7)

JPEG (1.80 MB)

References & Resources

You may also be interested in:

Stay up-to-date with the latest content from NASA as we explore the universe and discover more about our home planet.

Fires Tear Through Nebraska Grasslands

3 min read

Dry, warm, and windy conditions across the U.S. Great Plains led to extreme fire activity in March 2026.

Article

Fire’s Footprint on Santa Rosa Island

3 min read

A wildland fire charred grassland, coastal sage scrub, and chaparral across one-third of the island, the second largest of the…

Article

Smoke Rises Over Big Cypress National Preserve

2 min read

The National fire has burned tens of thousands of acres within the Florida preserve, fueled by vegetation dried by prolonged…

Article

July 2026 Satellite Puzzler

7 July 2026 at 16:48
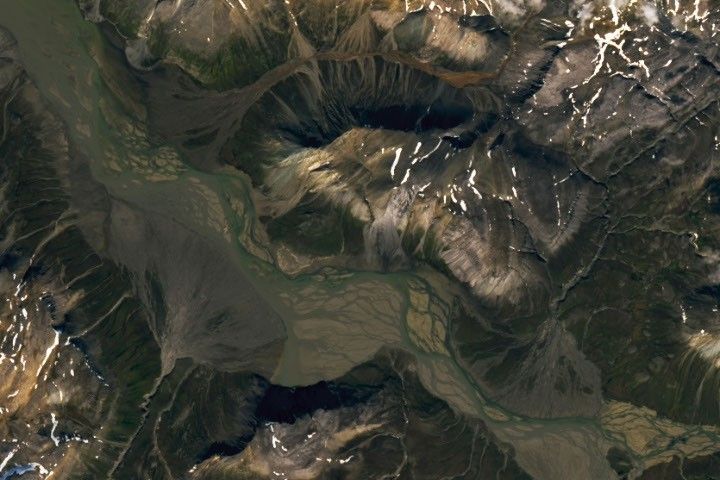
A braided river meanders across the image. Smaller streams empty into the wide channel from either side, forming fan-shaped deposits.

Every month, NASA Earth Observatory features a puzzling satellite image. The July 2026 puzzler appears above. 

Your Challenge
I
dentify the location shown in this satellite image. Share what clues you see, where you think it is, and what makes this place interesting or unique to you.

How to Answer
Submit your response using this form and select “Puzzler Answer” as the topic. Please include your preferred name or alias.

You can keep it simple and just guess the location. Want to impress us? Tell us which satellite and instrument captured the image, which spectral bands were used, or point out a subtle detail about the geology or history of the area. If something catches your eye, or if this is your home or means something to you, we’d love to hear about it.

The Prize
We can’t offer prize money or a trip to space to see Earth like satellites and astronauts do. But we can offer something almost as rewarding: puzzler bragging rights.

About a week after the challenge, we’ll post the answer at the top of this page, along with a link to an Earth Observatory Image of the Day story that explains the image in more detail. We’ll recognize the first person who correctly guesses the location, and we may also highlight readers who share especially thoughtful or interesting answers. By submitting a response, you acknowledge that your comments may be edited, excerpted, and published on this page.

Until then, zoom in, look closely, and enjoy the challenge. See you at the reveal!

The World Cup From 250 Miles Up

7 July 2026 at 05:00
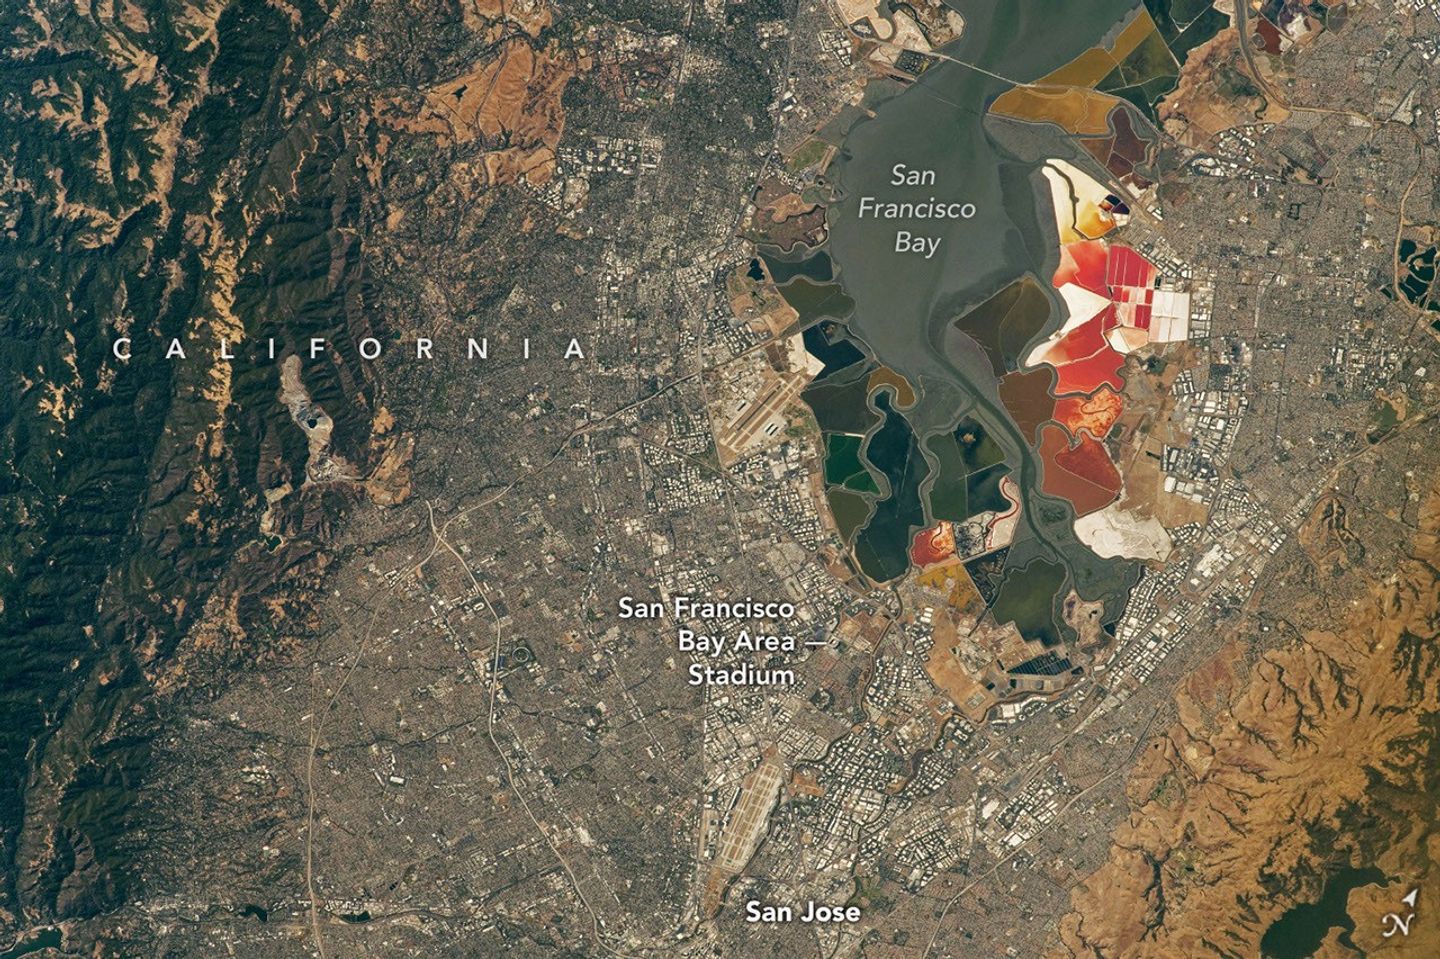
An aerial view of the San Francisco Bay Area Stadium, middle-left, is surrounded by urban infrastructure. Colorful ponds of the southern San Francisco Bay are visible toward the top.
July 26, 2022

In summer 2026, sixteen stadiums across North America hosted matches as part of the FIFA World Cup. Over the years, astronauts aboard the International Space Station have captured a top-down view of the infrastructure, landscapes, and ecosystems surrounding many of these venues.  

Six of the matches were played at the San Francisco Bay Area Stadium, beginning on June 13 with a match-up between Qatar and Switzerland. This stadium (also called Levi’s Stadium) is located in Santa Clara, California, adjacent to San Jose and around 40 miles (64 kilometers) south of San Francisco. An astronaut aboard the International Space Station took this photo (above) on July 26, 2022.

The stadium, completed in 2014, is surrounded by a mix of recreational, housing, and business infrastructure. The scene includes the southern part of San Francisco Bay, which is 23 years into a 50-year effort to restore up to 90 percent of the region’s salt ponds to tidal wetlands and marshlands, while retaining some of its salt-making heritage.

The Bay Area hosted its sixth and final World Cup match on July 1, when the U.S. faced off against Bosnia and Herzegovina in a knockout match. The U.S. advanced to the round of 16 following a 2-0 win.

An aerial view of the San Francisco Bay Area Stadium, middle-left, is surrounded by urban infrastructure. Colorful ponds of the southern San Francisco Bay are visible toward the top.
April 17, 2022

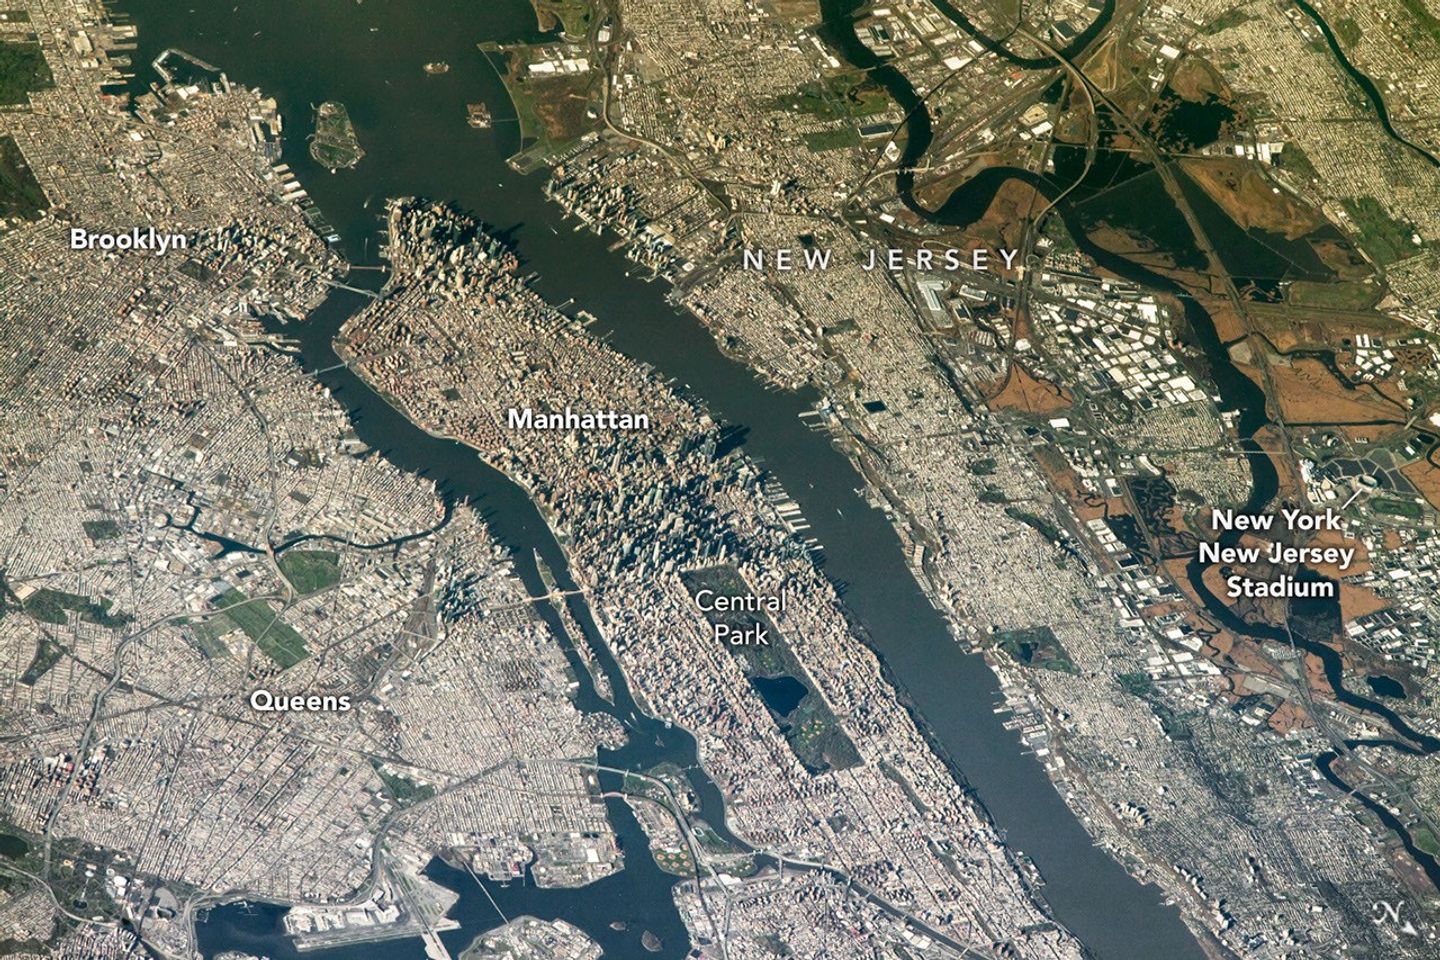
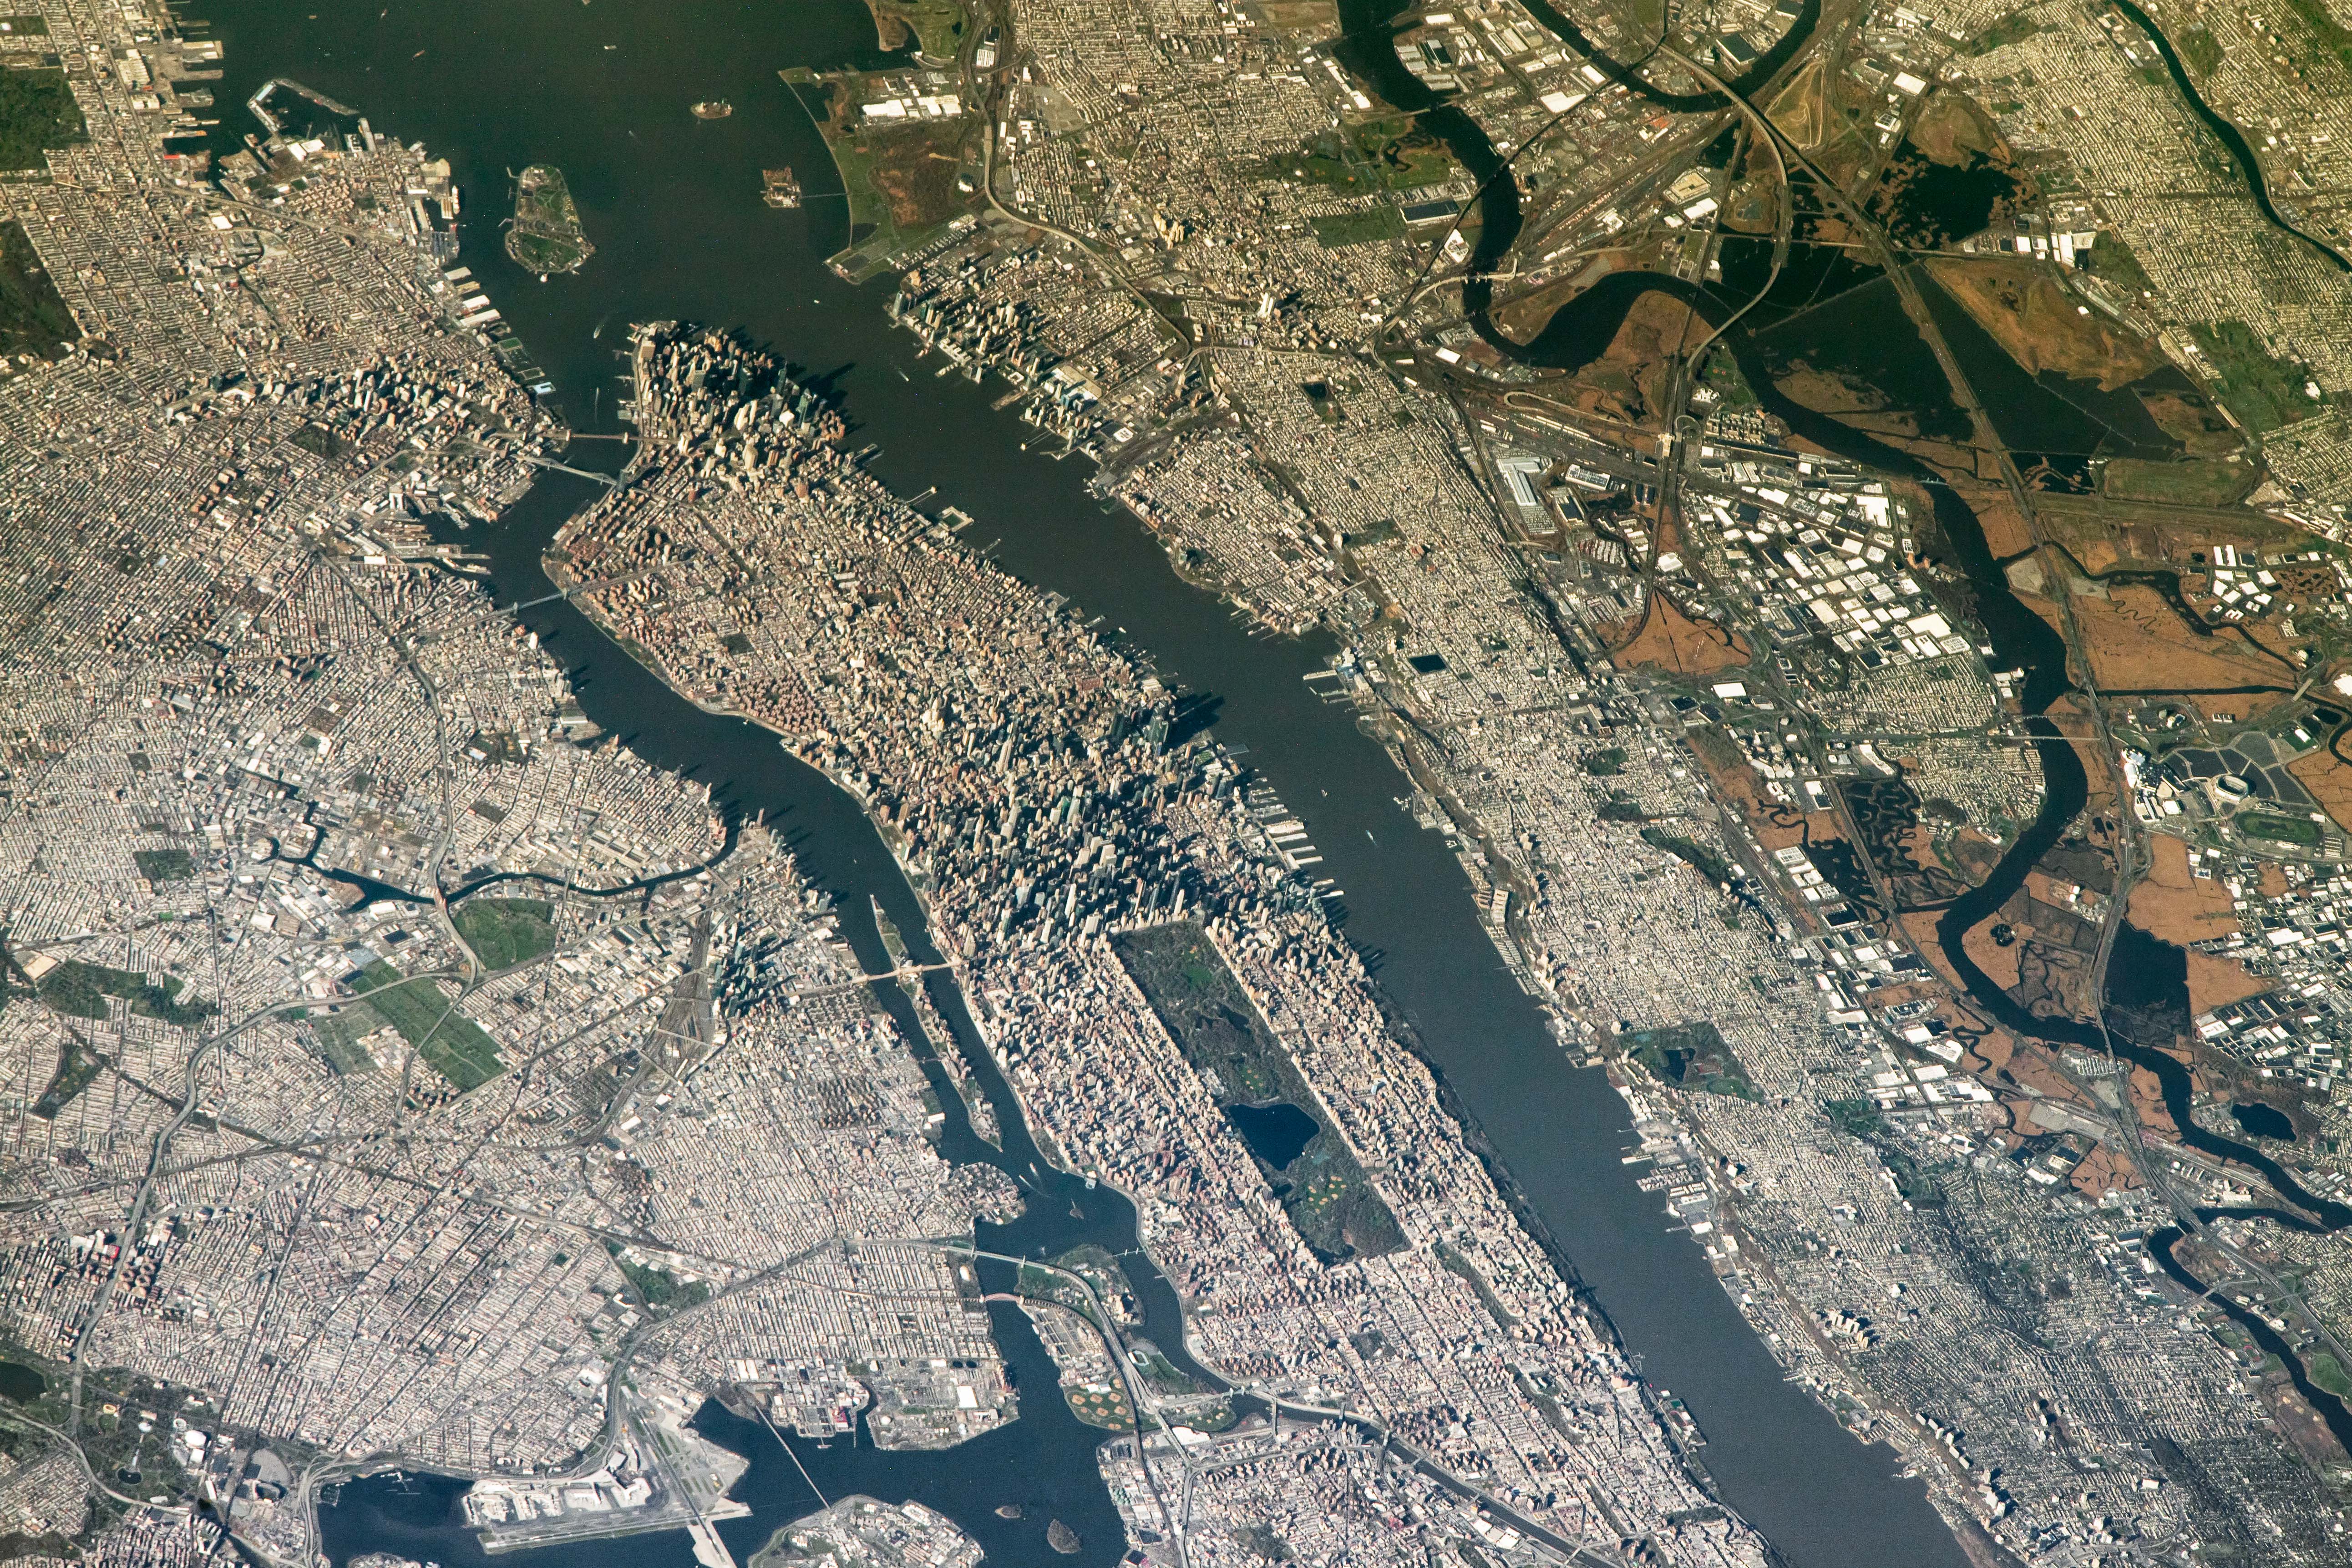
The FIFA World Cup final is scheduled for July 19 at New York New Jersey Stadium, part of the Meadowlands Sports Complex, in East Rutherford, New Jersey. The stadium (also called MetLife Stadium) sits along the New Jersey Turnpike, west of Midtown Manhattan. Note that north is toward the bottom-right of this photo, captured by an astronaut on April 17, 2022.

The area has seen centuries of human impact. Colonists cleared wetlands and cedar forest for settlements, and development for a range of economic and industrial uses followed. In the 20th century, it became an unregulated dumping ground. In recent decades, though, wetland restoration efforts have occurred alongside the development of the sports and entertainment complex.

Other World Cup host cities have also appeared in astronaut photography and satellite imagery. Guadalajara Stadium (Estadio Akron), Los Angeles Stadium (SoFi Stadium), Houston Stadium (NRG Stadium/Reliant Stadium), and BC Place Vancouver (BC Place) are among the venues that have been observed from above.

Astronaut photograph ISS067-E-202213 was acquired on July 26, 2022, with a Nikon D5 digital camera using a focal length of 400 millimeters, and astronaut photograph ISS067-E-18580 was acquired on April 17, 2022, with a Nikon D5 digital camera using a focal length of 1150 millimeters. They are provided by the ISS Crew Earth Observations Facility and the Earth Science and Remote Sensing Unit at NASA Johnson Space Center. The images were taken by a member of the Expedition 67 crew. The images have been cropped and enhanced to improve contrast, and lens artifacts have been removed. The International Space Station Program supports the laboratory as part of the ISS National Lab to help astronauts take pictures of Earth that will be of the greatest value to scientists and the public, and to make those images freely available on the Internet. Additional images taken by astronauts and cosmonauts can be viewed at the NASA/JSC Gateway to Astronaut Photography of Earth. Story by Kathryn Hansen.

Downloads

An aerial view of the San Francisco Bay Area Stadium, middle-left, is surrounded by urban infrastructure. Colorful ponds of the southern San Francisco Bay are visible toward the top.

July 26, 2022

JPEG (17.97 MB)

An aerial view shows the New York New Jersey Stadium and surrounding Meadowlands on the right, with the dense urban landscape of Manhattan Island centered in the frame.

April 17, 2022

JPEG (3.18 MB)

References & Resources

You may also be interested in:

Stay up-to-date with the latest content from NASA as we explore the universe and discover more about our home planet.

Great Balls of Fire

4 min read

An astronaut on the International Space Station was surprised to photograph a shower of light streaking through the darkness while…

Article

San Francisco’s Metropolitan Mosaic

3 min read

Urban development, green spaces, and maritime activity converge in this Northern California city.

Article

A Moonlit Earth as Seen From Artemis II

4 min read

An astronaut’s photo, taken en route to the Moon, reveals our planet and its place in space in a novel…

Article
❌