❌

Normal view

When Bright Spots Go Dark

9 September 2026 at 17:00

solar faculae and sunspots imaged at 1400 Angstroms

Light and dark regions speckle the Sun and other stars, complicating the interpretation of exoplanet transmission spectra. New modeling suggests that faculae — bright areas on the visible surface of the Sun — appear dark on cooler stars, adding a new wrinkle to this challenge.

Dark Spot, Bright Spot

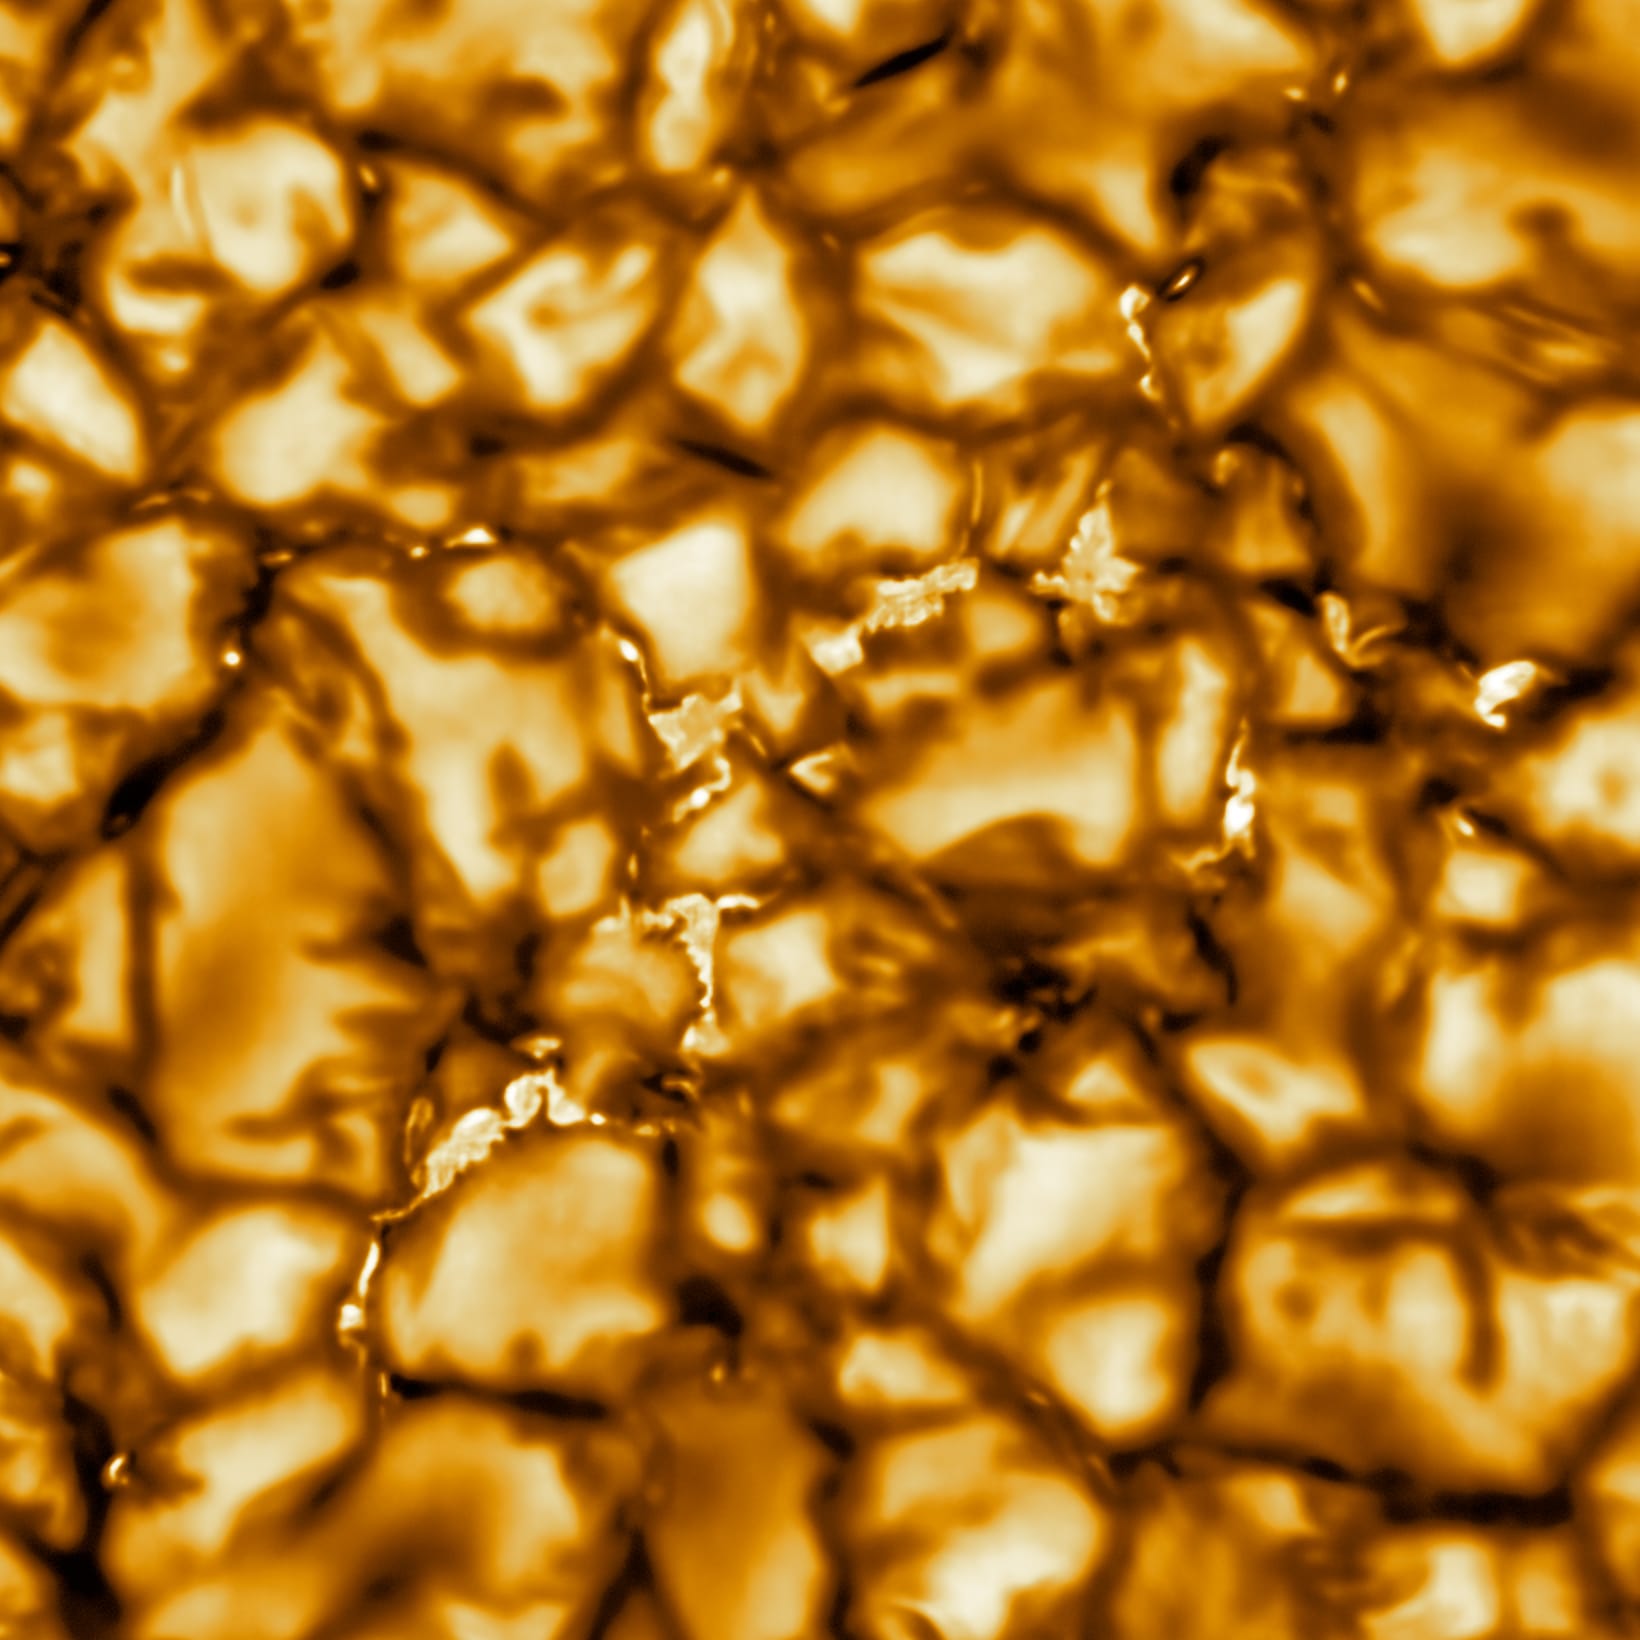
solar granules

This image from the Daniel K. Inouye Solar Telescope shows solar convective cells called granules. The bright points in the dark lanes between granules are regions of enhanced magnetic field strength. [NSO/AURA/NSF; CC BY 4.0]

It’s an adage as old as exoplanet science itself: know thy star, know thy planet. This recommendation is key when using transmission spectroscopy to tease out the components of an exoplanet’s atmosphere; the backdrop to this process is a rotating star dotted with ever-changing active regions, and the better the star’s behavior is understood, the more reliable the extracted spectrum becomes.

The Sun is freckled with dark spots — sunspots — as well as bright regions called faculae. Sunspots form where the Sun’s magnetic field bubbles up, creating pockets of cooler, less luminous plasma. Solar faculae form in regions of concentrated magnetic field, creating bright spots that line the dark crevasses between convective cells.

Other stars also have starspots and faculae, but thus far, astronomers have no direct observations of faculae on any star except the Sun. Out of necessity, researchers interpreting exoplanet spectra assume that faculae on other stars are similar to those on the Sun — but are they actually?

Would a Facula on Any Other Star Look as Bright?

To explore what faculae might look like on stars other than the Sun, Alexander Shapiro (University of Graz; Max Planck Institute for Solar System Research) and collaborators turned to three-dimensional radiative magnetohydrodynamics simulations and radiative transfer modeling. Their aim was to simulate the appearance and spectra of faculae on stars of spectral type G2, K2, M0, and M4 — from Sun-like to substantially smaller and cooler than the Sun.

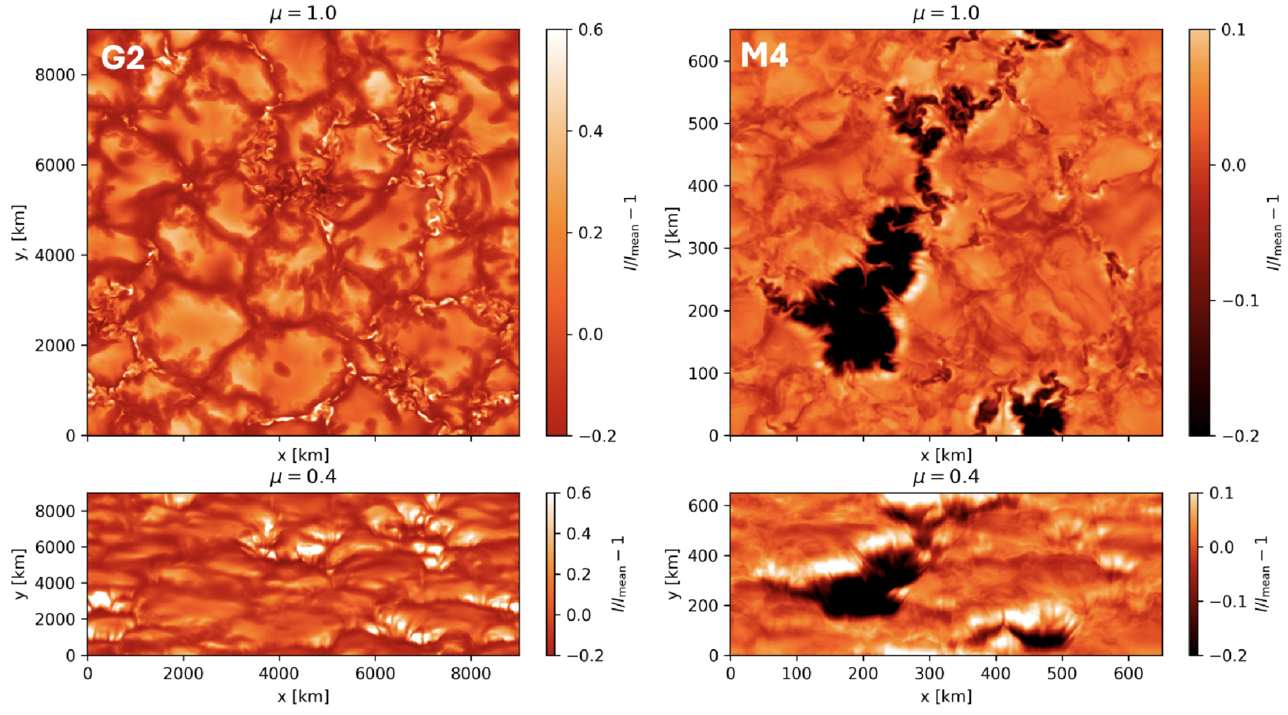
simulated faculae on a Sun-like star and a cooler M dwarf

Simulated faculae on a Sun-like star (left) and an M4 star (right). These images show the faculae at 600 nm. Click to enlarge. [Shapiro et al. 2026]

The modeled faculae on the Sun-like G2 star were bright, as expected. On the K2 and M0 star, these features were fainter, with the faculae on the M0 star being roughly as bright as the surrounding stellar surface. On the M4 star, the faculae were darker than surrounding areas, upending the assumption that faculae on all stars are brighter than the stellar surface.

Exoplanetary Effects

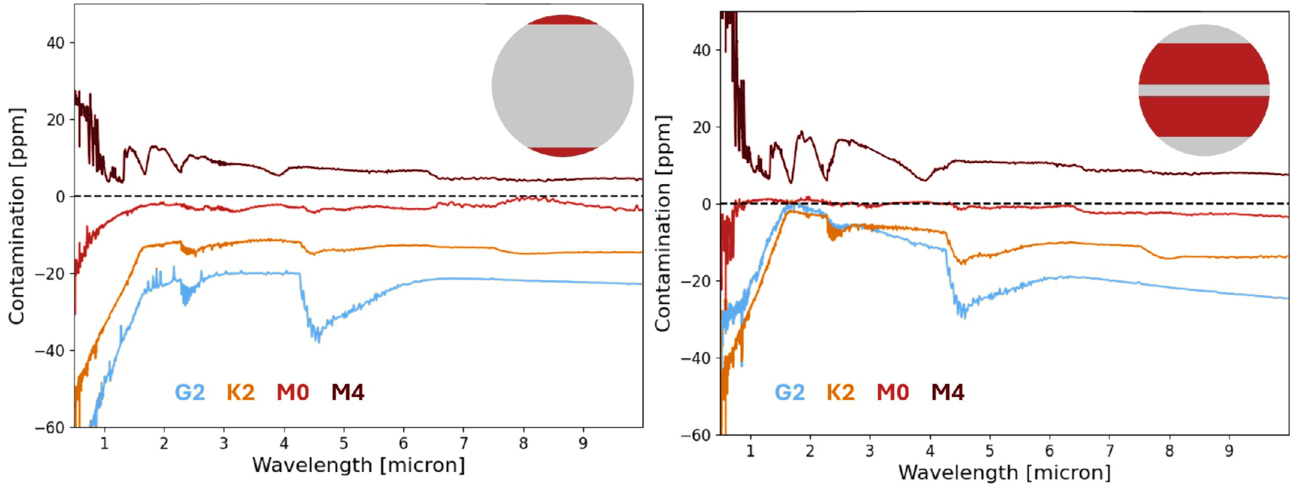
The transition from bright faculae on Sun-like stars to dark faculae on M4-class stars directly affects interpretations of exoplanet transmission spectra. The existence of dark faculae increases the derived exoplanet radius, whereas bright faculae on Sun-like stars decrease the derived radius. The contamination due to the faculae is wavelength dependent, with the largest contamination occurring at shorter wavelengths. This contamination, if not fully accounted for, can mimic spectral features from an exoplanet’s atmosphere.

plot of spectral contamination due to faculae

Contamination of transmission spectra by faculae near a star’s poles (left) and closer to the star’s equator (right). Faculae are bright for the simulated G2, K2, and M0 stars, and they are dark on the simulated M4 star. Click to enlarge. [Shapiro et al. 2026]

What determines whether faculae appear brighter or darker than their surroundings? Using a qualitative framework, Shapiro and coauthors found that the appearance of faculae can be traced to a few competing factors: the strong magnetic fields within faculae prevent the incursion of hotter material (making the spots appear darker), while the magnetic field lowers the opacity of the gas in that region, allowing us to peer deeper and glimpse hotter material (making the spots appear brighter). On cooler stars, effects related to higher surface gas pressure tilt the balance in favor of darker faculae.

Citation

“The Curious Case of Dark Faculae on M Dwarf Stars,” A. I. Shapiro et al 2026 ApJ 1008 24. doi:10.3847/1538-4357/ae7105

The post When Bright Spots Go Dark appeared first on AAS Nova.

Thermal Electrons Can Explain the Mysterious Radio Behavior of a Tidal Disruption Event

8 September 2026 at 17:00

illustration of a tidal disruption event

Editor’s Note: Astrobites is a graduate-student-run organization that digests astrophysical literature for undergraduate students. As part of the partnership between the AAS and astrobites, we occasionally repost astrobites content here at AAS Nova. We hope you enjoy this post from astrobites; the original can be viewed at astrobites.org.

Title: Thermal Electrons in the Radio Afterglow of Relativistic Tidal Disruption Event ZTF22aaajecp/AT 2022cmc
Authors: Lauren Rhodes et al.
First Author’s Institution: McGill University
Status: Published in ApJ

Tidal disruption events (TDEs, see Figure 1), which occur when a star gets a little too close to a supermassive black hole (SMBH) and gets ripped apart, are a hot topic across the electromagnetic spectrum. During a TDE, the star can no longer hold itself together under the gravitational pull of the SMBH. Some bits of the star end up accreting onto the black hole, which can launch a temporary outflow, or, in especially dramatic cases, a relativistic jet.

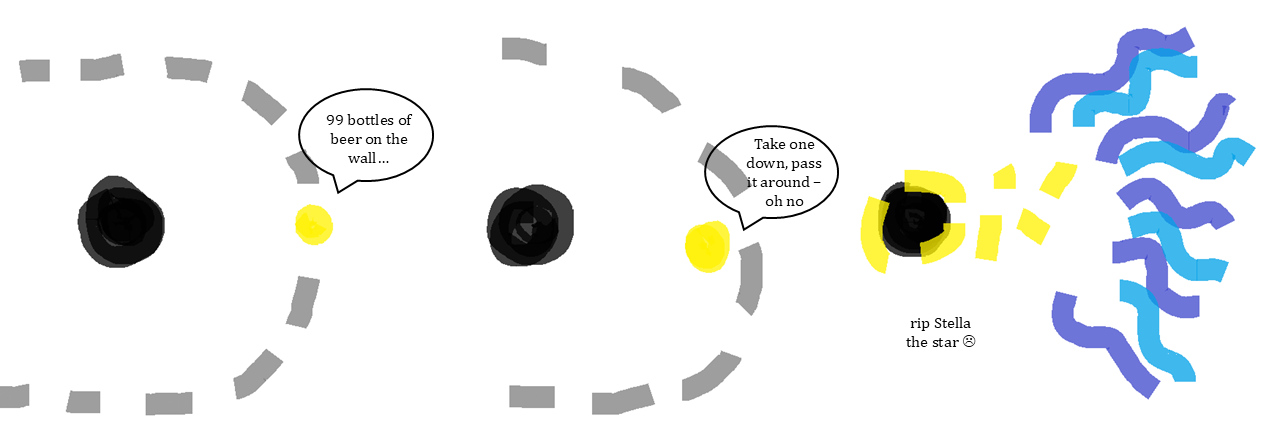
cartoon of a star orbiting a black hole, getting to close, and being ripped apart

Figure 1: Timeline of events leading to a tidal disruption event. [Chloe Klare]

Aside from being cool transients (as far as spectacular stellar deaths go, they are rivaled only by the supernova), TDEs are valuable to study for a variety of reasons. They likely play a role in galaxy evolution, SMBH growth, and even the life cycles of active galactic nuclei (AGN, in which material is constantly swirling onto the SMBH). Not to mention, they are a great tool for eyeballing the mass of the SMBH responsible for the TDE; if the black hole is any bigger than about 1 billion times the mass of the Sun, its event horizon — the point at which not even light can escape its gravity — extends too far, and a star will disappear across the event horizon before it ever gets ripped apart.

How to Spot a TDE

Usually, TDEs are discovered in the X-ray (after all, not many transients are powerful enough to generate an X-ray flare) or in the optical (thanks to high-cadence, wide-field surveys like the Zwicky Transient Facility and the Legacy Survey of Space and Time). However, radio is a particularly useful regime for TDE searches, especially in dusty host galaxies where we cannot see the optical TDE signatures at all; while dust obscures optical light, the radio is unaffected! There is just one catch: how exactly can we identify a TDE based on only its radio emission?

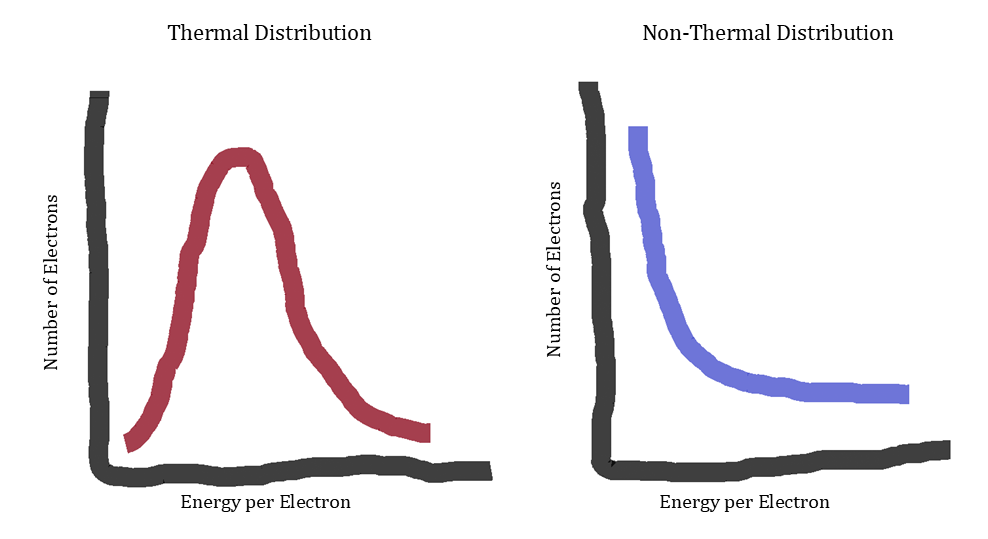
The radio light in a TDE is generated via synchrotron radiation — which is caused by fast moving electrons in strong magnetic fields — and originates in jets or shocks. Unfortunately, this is also the case in AGN, the primary extragalactic source of variable radio emission, and it can be difficult to distinguish between the two. Additionally, the amount of light we see from synchrotron radiation at a given frequency depends on how energy is distributed among the electrons in the source, which is unknown. Perhaps the simplest case — or at least the one you’ll learn about first in your undergraduate statistical mechanics course — is that the energy is distributed among the electrons thermally (left panel in Figure 2). However, most radio transients associated with black holes are assumed to have non-thermal electron energy distributions, usually where there are exponentially many more low-energy electrons than high-energy electrons (right panel in Figure 2).

cartoon showing thermally distributed and non-thermally distributed electrons

Figure 2: Energy can be distributed among the electrons in a source either thermally (left panel), where most electrons have a medium amount of energy, or non-thermally (right panel), where most electrons have a small amount of energy. Often, extragalactic radio transients are assumed to originate from non-thermal electrons, but today’s article argues why we shouldn’t ignore thermal electrons. [Chloe Klare]

As a further challenge, very few TDEs have had extensive follow-up observations in the radio, so we don’t have strong constraints on how most TDEs should behave, especially in the long term. Luckily, some astronomers are working to change this.

This includes today’s authors, who have focused on one particular TDE, ZTF22aaajecp/AT2022cmc (I’m sure everyone mispronounces her name), or 2022cmc for short. 2022cmc is a special TDE: it is one of only five TDEs suspected to have launched a relativistic jet, and it has the highest redshift (z ~ 1.2) of the five. It was observed first in the optical and then in the X-ray and radio. The X-ray emission was highly variable for 400 days post-TDE, and then disappeared, and the first 100 days of radio emission indicated there was a relativistic outflow. At the time, it was concluded that the jet shut off and the X-ray emission ceased. However, the story doesn’t end there; the authors of today’s article continued to observe 2022cmc in the radio for an additional 900 days at frequencies spanning about 1–100 GHz.

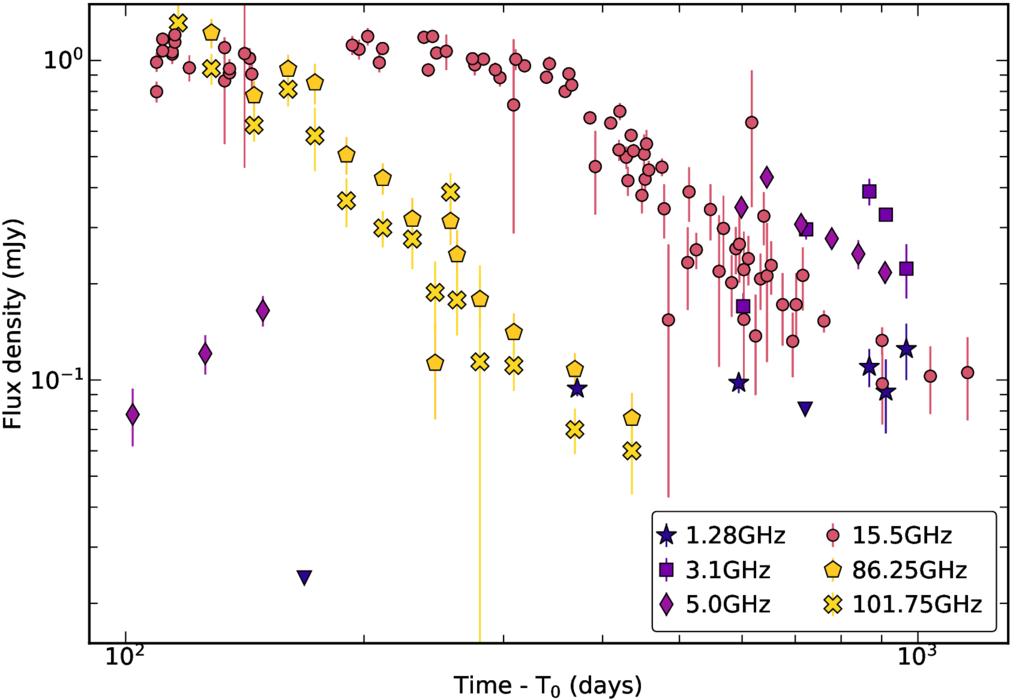
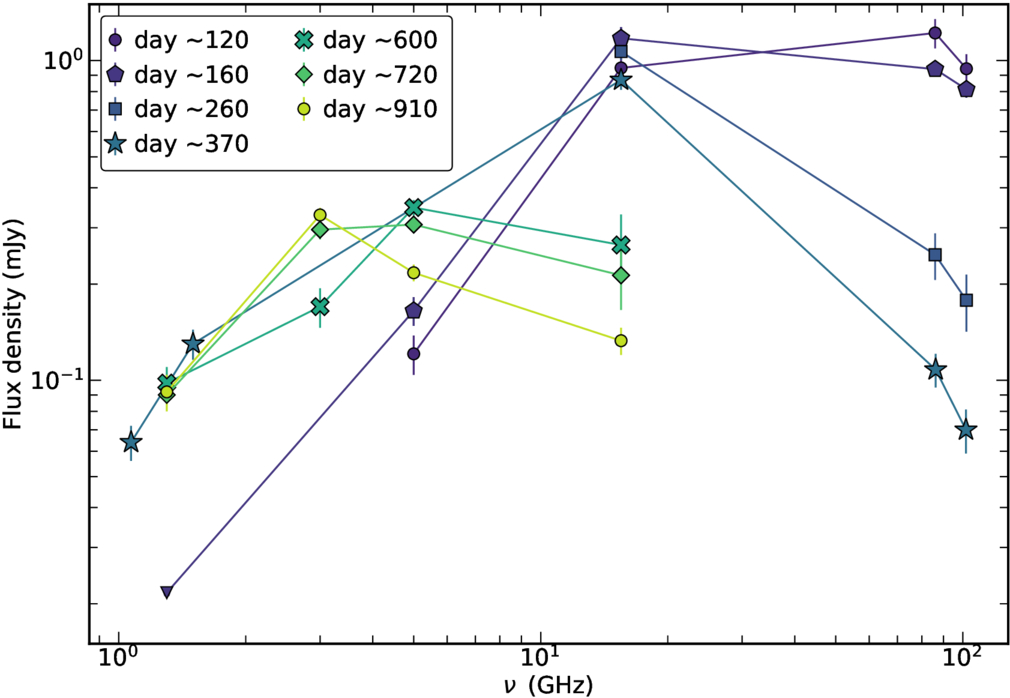
Our authors had two key observing strategies: wide frequency coverage and long duration. Measuring the change in brightness with observing frequency, or the spectral energy distribution (SED), is important for determining which processes are responsible for the radio emission, since thermal electrons and non-thermal electrons will produce different SEDs. On the other hand, measuring the change in brightness over time, or the light curve, is important for determining what is happening at the source, such as whether there is a jet and, if so, how long it lasts. Here, our authors combine light curves at six different frequencies (Figure 3) and SEDs at nine different epochs (Figure 4) to investigate both.

Plot of flux density over time

Figure 3: Light curves spanning six frequencies and 900 days obtained by today’s authors. [Rhodes et al. 2025]

Plot of flux density as a function of frequency

Figure 4: Nine epochs of radio SEDs, which show the peak moving to lower frequencies over time. [Rhodes et al. 2025]

The Findings

Our authors find a couple of interesting results. First, in the time domain, they find the highest-frequency light curves fade with time, while the lower-frequency light curves increase initially, hit peaks at different times (after 300 days at 15.5 GHz, and after 800 days at 1.3 GHz), and then begin to decay. The spectral evolution is even more intriguing; the SED is always peaked, and the peak shifts to lower frequencies over time, which is typical for an expanding emission region. At frequencies below the peak, the SED doesn’t change much. However, the high-frequency side of the SED shows confusing behavior: early on, it has a very steep slope (the amount of light drops off sharply at higher frequencies), but it eventually flattens.

Investigations Begin

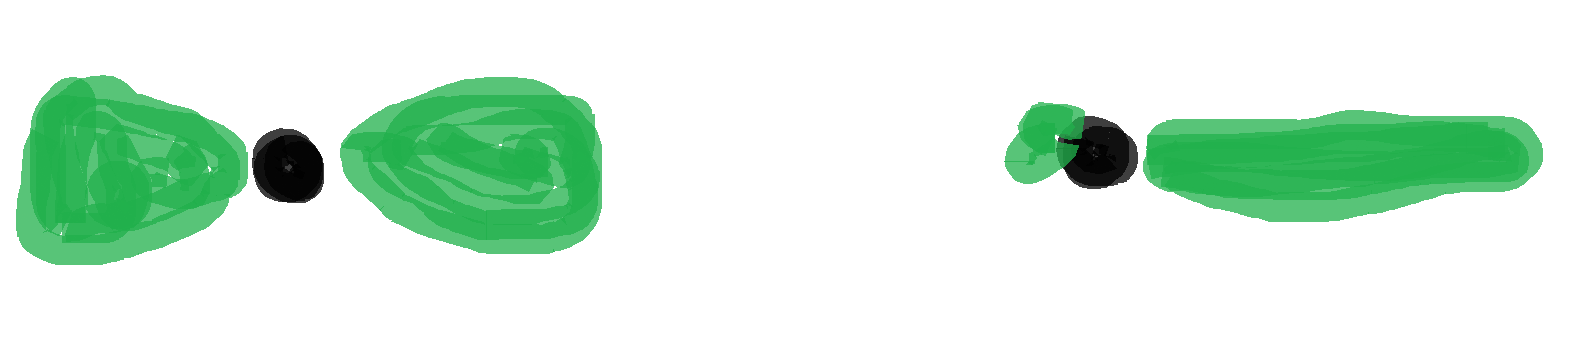
Next, our authors consider three possibilities to explain these observations. They first consider synchrotron radiation from only non-thermal electrons in a relativistic jet (Figure 5), which is the canonical model for a gamma-ray burst radio afterglow. Initially, the jet is so fast that all its radio light is relativistically beamed in one direction (like a flashlight), and we can only see the jet if it’s pointed directly at us. Eventually, the jet slows down enough that it is no longer beamed, and light is emitted in all directions (like a light bulb). At this point, we see the light fade over time, which is exactly what happened in the high-frequency light curves. However, there is one glaring problem: this model cannot possibly explain the observed long-lasting steep SED at high frequencies. So, our authors discard this theory.

cartoon showing the jets of a black hole with and without relativistic beaming

Figure 5: The left image shows what a black hole–generated jet looks like in the rest frame of the jet itself. As long as the jet isn’t moving too fast, this is what we see too. However, if the material in the jet is moving near the speed of light, we observe a relativistically beamed jet (right image). [Chloe Klare]

Instead, our authors consider a jetted outflow that has non-thermal and thermal electrons both independently generating synchrotron emission1, giving us the superposition of two radio spectra. This model also doesn’t fit the data well. The peak of the SED moves too slowly, a very dense local environment is required, and, once again, the authors cannot reconcile that steep high-frequency SED.

Lastly, our authors keep the thermal/non-thermal electrons combo and ditch the jet entirely, modeling a spherical outflow. Excitingly, this model best fits the observations, and, most importantly, can explain the mysterious high-frequency behavior. Initially, most of the radio emission originates in the thermal electron population, which produces more light at higher frequencies. As the outflow expands, the non-thermal electrons begin to dominate, and the SED transforms into the classic non-thermal synchrotron shape.

Next Steps

Ideally, our authors want to compare 2022cmc to other TDEs, but few TDEs have such thorough follow-up observations. They speculate that thermal electrons were important in the radio evolution of one of the few such TDEs, Swift J1644, and recommend we revisit its emission models. More broadly, they recommend two future priorities: first, we need extensive radio observations for larger samples of TDEs, especially around 100 GHz, where the thermal electrons contribute most to the SED; secondly, we should stop neglecting thermal electrons not just in TDE models, but in models of any black hole jets, including gamma-ray bursts and X-ray binaries. While this work addresses only one event, one thing is clear. For theorists and observers alike, there is a myriad of exciting work to be done, so it’s no wonder TDEs have garnered so much attention lately.

  1. A convenient property of extragalactic synchrotron sources is that all their electrons radiate independently of one another, even if they are part of the same electron population. This is called incoherent emission. (Galactic sources are another story, but I’ll save that for another time.) ↩︎

Original astrobite edited by Flavia Pascal.

About the author, Chloe Klare:

I’m a PhD student in astronomy and astrophysics at Penn State (with a physics minor, so I get to use my semester spent in QFT for something!). I study active galactic nuclei (in the radio!), and I’m currently looking for baby synchrotron jets in active galactic nuclei.

The post Thermal Electrons Can Explain the Mysterious Radio Behavior of a Tidal Disruption Event appeared first on AAS Nova.

Who Needs Jupiter?

4 September 2026 at 21:17

A photograph of Uranus against a black background.

A planned flagship spacecraft to Uranus was aiming to use Jupiter for a gravitational boost to shorten its journey to the outer solar system. Now that the mission’s launch date has been pushed back, it’ll need to find another way to its target.

Redesigning the Route

Uranus and Neptune, the ice giants of our solar system, have been comparatively neglected by humanity’s fleet of interplanetary probes. While all of the other major bodies have been visited by at least an orbiter or even a lander, the most detailed exploration we’ve done of these two planets happened when the Voyager 2 spacecraft went screaming past on its way toward interstellar space.

A two-panel top down view of the solar system with different trajectories overplotted.

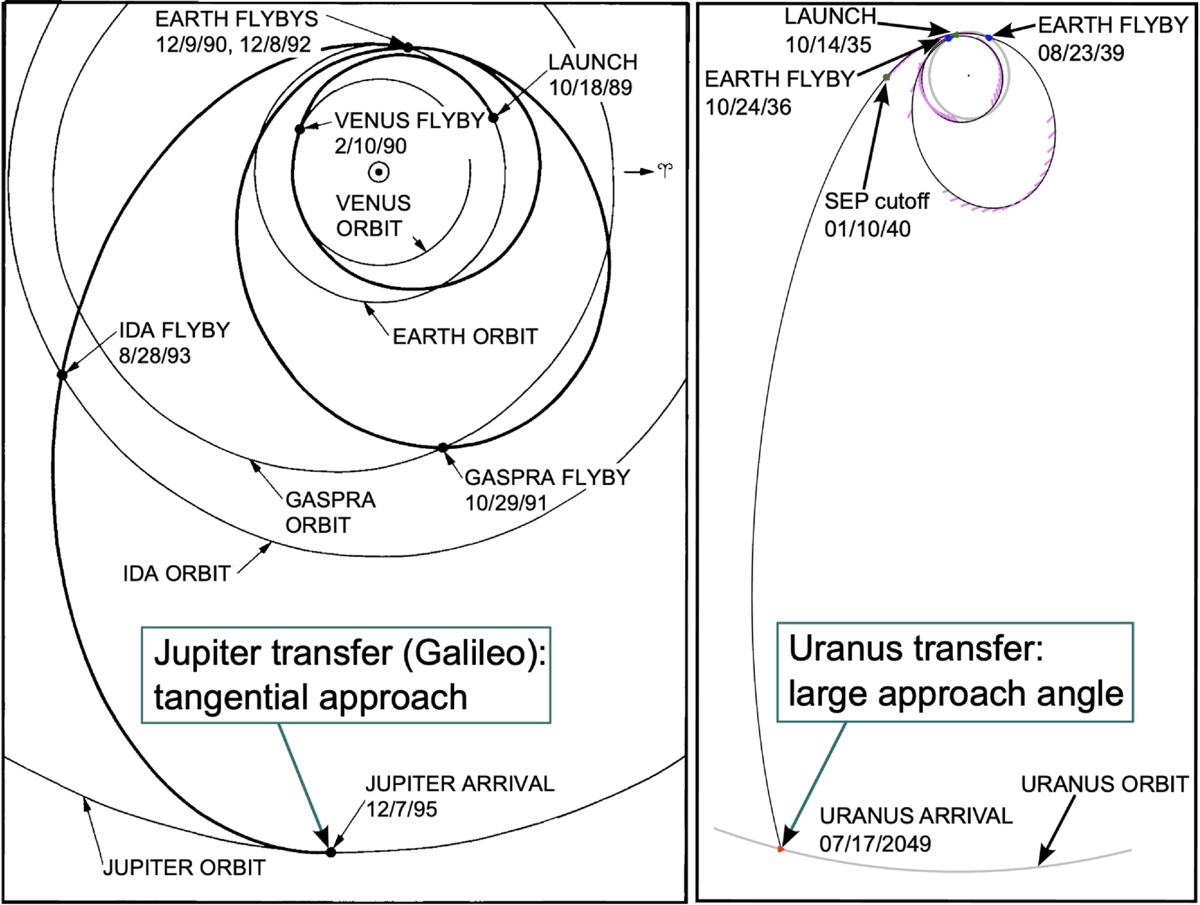
Schematics of different trajectories within the solar system. Left: The path the Galileo spacecraft took to Jupiter. This path arrived nearly parallel to the planet’s motion. Right: One of the proposed paths to Uranus. This path will intersect the planet’s orbit at a much steeper angle to shorten the flight time. Click to enlarge. [Simon et al. 2026]

So it was no surprise when a panel of scientists and engineers charged with setting scientific exploration priorities between 2023 and 2032 recommended finally sending a spacecraft to Uranus, depositing it into orbit around the planet, and keeping it there for a while to collect data. The study itself suggested a basic design for the mission: a pair of spacecraft, one orbiter and one sacrificial atmospheric probe, collectively weighing about 4,000 kg.

Getting these spacecraft to their destination will be a challenge The thriftiest path to get to Uranus, a trajectory called a Hohmann transfer that’s been used for other missions aimed elsewhere in the solar system, would take 16–17 years. Rather than accept the long wait, the original authors suggested that the mission instead fly toward Jupiter, using the giant planet’s massive gravitational tug to slingshot the spacecraft toward Uranus.

However, this plan relied on Jupiter being in just the right place when the spacecraft approached. This in turn relied on the mission launching sometime in 2031 or 2032: any earlier or later, the slingshot would be aimed in the wrong direction. Now that timelines and budgets have slipped for this flagship mission, hitting this launch window seems unlikely. And, without the boost from Jupiter, the mission will have to cross 20 au of open interplanetary space on its own.

Solar Electric Propulsion to the Rescue

A 3-row figure showing the same interplanetary probe flanked by every-growing sets of solar panels.

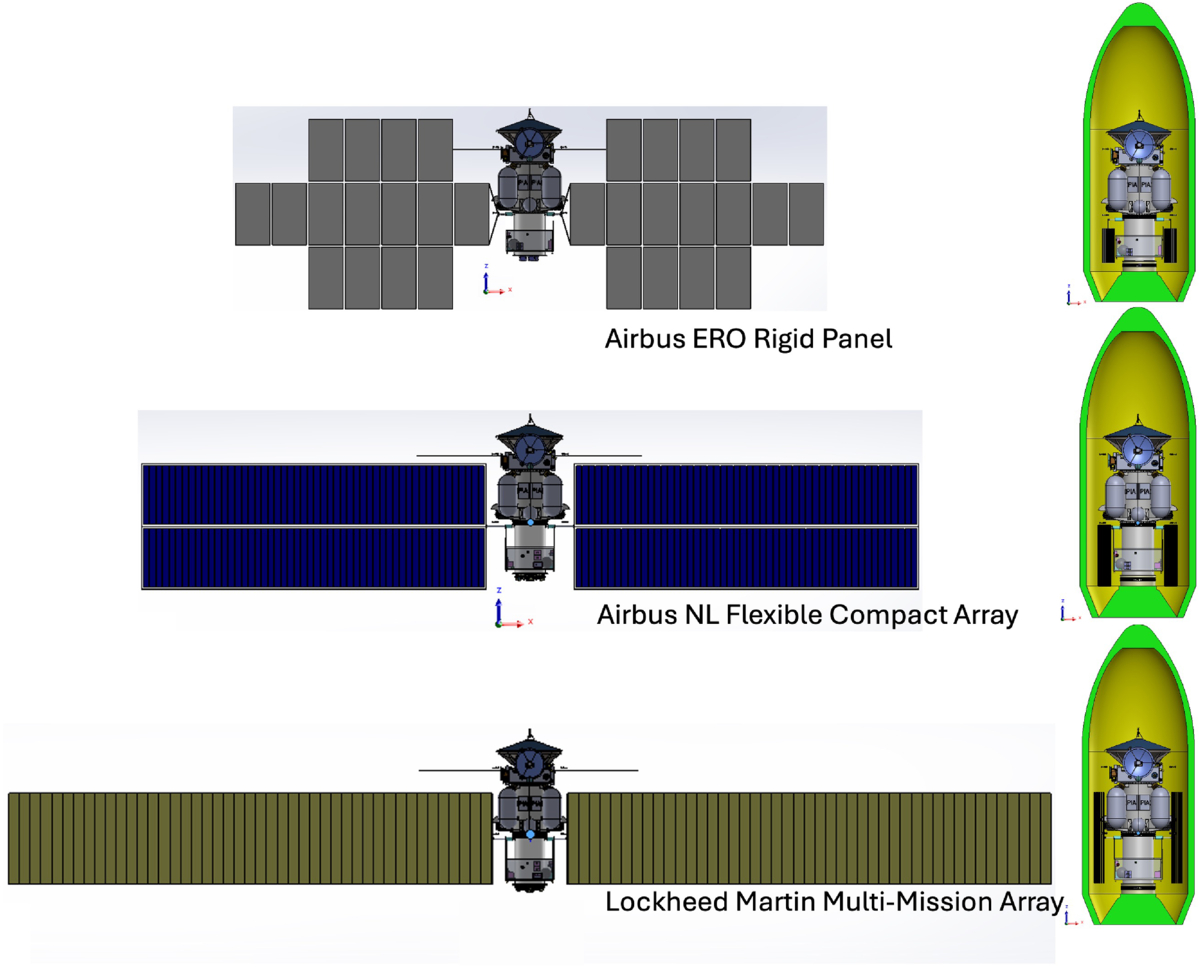
Several proof-of-concept designs for the mission’s SEP components. How these designs would be packaged into a rocket fairing for launch is shown at right. Click to enlarge. [Simon et al. 2026]

Recently, a team led by Amy Simon, NASA Goddard Space Flight Center, took on this challenge and tried to chart a new path through the solar system. The team realized that solar electric propulsion (SEP), a technique that relies on using solar panels to create electricity and accelerate ions to create thrust, might offer a path forward. By using SEP, the mission could leave Earth, unfurl wings of solar panels, then gradually accelerate for as long as there was enough sunlight to power the engine.

The power levels would likely get too low just a few astronomical units into their journey, but that would be enough: after discarding the SEP stage, the mission could coast to Uranus on a journey that would take only 13 years. Even better, this technology has a proven flight history and would require little maturation or development. The BepiColombo mission to Mercury is currently using SEP, and similar techniques are used on satellites in Earth orbit today.

Simon and collaborators also took on a number of other challenges that have cropped up since the mission was proposed, including fewer available plutonium power sources and a re-assessment of Uranus’s rings that revealed hazards in the original flight path. Their work brings the mission closer to the launch pad and illustrates how much iteration goes into the spacecraft that finally takes to the stars.

Citation

“Uranus Orbiter and Probe: Mission Challenges and Concept Updates Since the Origins, Worlds, and Life Decadal Survey,” Amy A. Simon et al 2026 Planet Sci. J. 7 143. doi:10.3847/PSJ/ae680c

The post Who Needs Jupiter? appeared first on AAS Nova.

Primordial Planetesimals from the Guts of Population III Stars

2 September 2026 at 21:45

Protoplanetary Disk

While previous investigations of planet formation across the universe’s history suggest that planets trickled into the picture, a recent study has found that primordial planetesimals could have formed much earlier from the insides of the first stars in the universe.

First Stars, First Planets?

When the first stars flickered on, the universe was filled with pristine gas, containing only hydrogen, helium, and a little lithium. This gas, though great at making massive stars known as Population III (Pop III) stars, was not yet enriched with the heavy elements necessary for planet formation and, of course, life. Past studies have suggested that planet formation in the universe was gradual, taking several billion years to peak after billions of stars created and spilled the needed metals into the universe. However, local pockets of enriched gas from Pop III stars could have created the right conditions for planet formation earlier in the universe’s history.

Pop III stars burned bright and fast, exploding violently in pair-instability supernovae that completely shredded the progenitor, ejecting over 100 solar masses of metals into their previously pristine surroundings. Cosmological simulations suggest that oxygen from these supernovae could have produced significant water fractions within the dense cores of the supernova remnant. This may have set the stage for planet formation in water-rich disks around subsequent generations of stars as early as 150–200 million years after the Big Bang — does numerical modeling support this planet formation hypothesis?

Protoplanetary disk growth

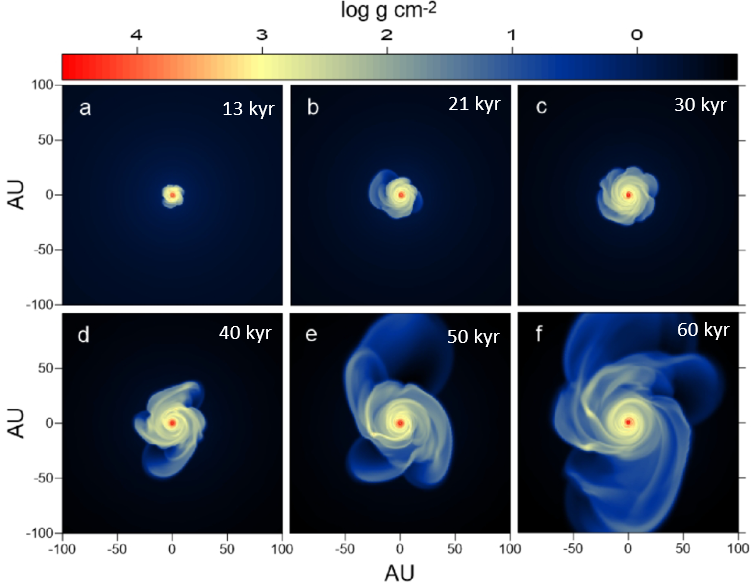
Simulation snapshots showing the formation and evolution of the protoplanetary disk for 13, 21, 30, 40, 50, and 60 thousands of years after protostellar birth. Click to enlarge. [Modified from Vorobyov et al 2026]

Primordial Planetesimals in Simulated Water-Rich Disks

To test if these water-rich dense cores within Pop III supernova remnants could form planetesimals, the building blocks of terrestrial planets, Eduard I. Vorobyov (University of Innsbruck; Southern Federal University) and collaborators performed numerical simulations tracing the collapse of one such gas core into a protoplanetary disk around a protostar. The simulations begin from the gravitational collapse of a 1-solar-mass gas cloud core, with a protostar emerging 24 thousand years after the initial cloud collapse. As the protostar’s gravity pulled in material from its surroundings, a rotating disk formed around the growing star.
Protoplanetary disk evolution and planetesimal growth
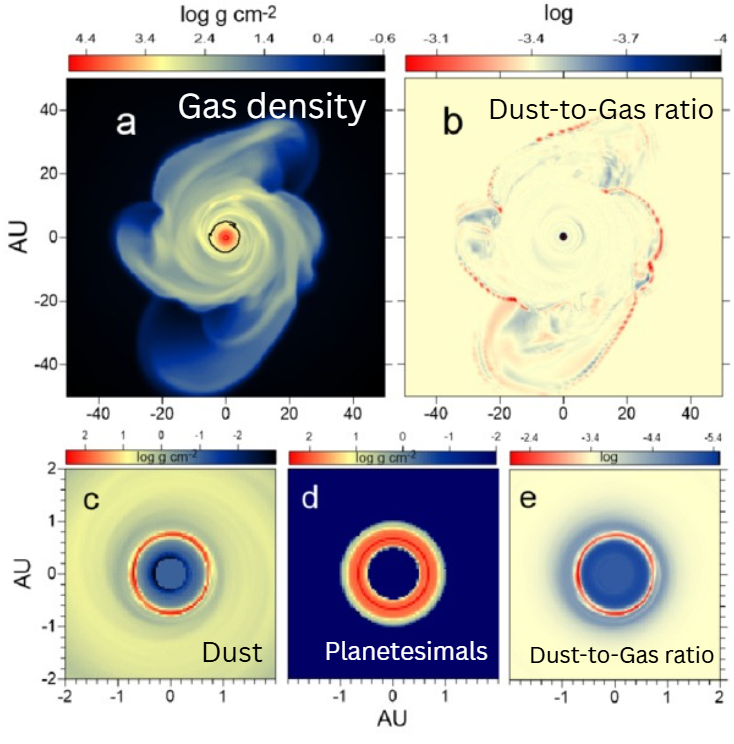
Simulation snapshot 40 thousand years after the formation of the protostar showing the gas, dust, and planetesimal surface densities and the dust-to-gas ratio. Click to enlarge. [Modified from Vorobyov et al 2026]

Tracking the gas and dust evolution in the disk, the authors found that several Earth masses of planetesimals formed within 0.5–1.0 au of the 0.4-solar-mass protostar. While the simulations did not trace the disk all the way to planet formation (this requires complex multi-body modeling and lots of computing power), enough planetesimals formed to create a Mars- or Earth-mass planet in the future. Luckily, unlike their live-fast and die-young predecessors, low-mass stars born from Pop III supernova remnants would still be burning hydrogen in their cores today, and ancient metal-poor stars in the Milky Way’s halo may be home to the universe’s first planets that could be detected in future exoplanet surveys. This study showed, for the first time, that water-rich protoplanetary disks with planetesimals could pop up billions of years earlier than previously thought, changing our understanding of planet formation in the universe.

Citation

“Planet Formation at Cosmic Dawn: Planetesimals in H2O-rich Disks around Low-mass Stars,” Eduard I. Vorobyov et al 2026 ApJL 1007 L51. doi:10.3847/2041-8213/ae907c

The post Primordial Planetesimals from the Guts of Population III Stars appeared first on AAS Nova.

Hitchhiking PAHs Caught Catching a Ride on Galactic Winds

1 September 2026 at 17:00

IC 5332

Editor’s Note: Astrobites is a graduate-student-run organization that digests astrophysical literature for undergraduate students. As part of the partnership between the AAS and astrobites, we occasionally repost astrobites content here at AAS Nova. We hope you enjoy this post from astrobites; the original can be viewed at astrobites.org.

Title: JWST Discovery of Warm Dust in the Circumgalactic Medium of the Makani Galaxy
Authors: Sylvain Veilleux et al.
First Author’s Institution: University of Maryland
Status: Published in ApJ

The Windy Galaxy

Billions of light-years away lies Makani, a record-breaking galaxy discovered in 2019 by researchers at the Keck Observatory atop Maunakea, Hawaiʻi. The galaxy shows evidence of a large merger event, where two galaxies collided to form a larger galaxy. This event triggered starburst activity, or several waves of intense star formation, that changed the makeup of not just Makani, but the region around it.

There are several processes that can create galactic winds. An active supermassive black hole at the center of the galaxy can slingshot particles out of the galaxy at close to the speed of light, or supernovae leftover from previous starburst activity can help to expel material from the galaxy. Makani, whose name in Hawaiian just so happens to mean “wind,” has both factors contributing to its galactic winds: massive amounts of star formation and a very active black hole in its center.

This contributes to some of the strongest galactic winds discovered to date, stretching approximately 100 kiloparsecs (330,000 light-years) beyond the galaxy, roughly ten times the extent of a typical galactic wind. These galactic winds remove gas from the galaxy and help to enrich the circumgalactic medium around the galaxy. There is still much to discover about how galactic winds change the makeup of such galaxies, and what exactly they take with them on their way out.

Earth’s Favorite Carcinogen: Polycyclic Aromatic Hydrocarbons

Polycyclic aromatic hydrocarbons (PAHs, pronounced P-A-Hs or “paws”) are small flat dust grains scattered into every corner of the universe, from the atmosphere of Earth in the form of exhaust and wildfire smoke to the circumgalactic medium (the mostly empty space between galaxies). These PAHs contribute to regulating the temperature of the interstellar medium, but astronomers have long wondered how they migrate across galaxies.

Even though they are smaller than a human hair, PAHs are still easily observable even in very distant galaxies.  These dust grains emit infrared light, and if there are enough PAHs in a region, they are bright enough to be observed with modern telescopes, such as JWST. By combining multiple observations across multiple filters, astronomers can calculate ratios that reveal information about the PAHs’ size, temperature, and charge, allowing reserachers to further discern properties about the regions in which these PAHs reside.

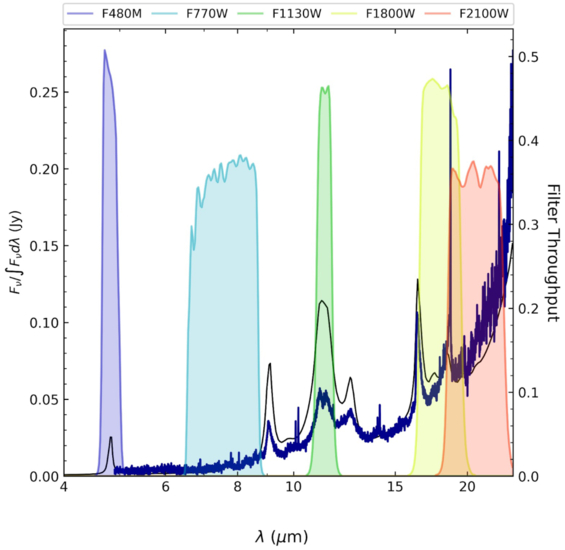
With redshifted galaxies like Makani, the light from PAHs is stretched beyond its usual wavelength, but fortunately for today’s authors, the light was stretched just enough to land known PAH features well within JWST filters, as seen in Figure 1. The authors were then able to use this information to track the distribution of these PAHs across Makani.

JWST spectrum of the galaxy Makani

Figure 1: Makani’s spectrum overlaid on top of the JWST filters. The peaks in the spectrum are PAH features that neatly overlap with JWST’s observing bands. [Veilleux et al. 2025]

PAHs Gone Extragalactic

Using JWST, the authors scrutinized Makani for any signs of PAHs. They found that not only did PAHs exist within the galaxy, these molecules were found up to 30 kpc (~100,000 light-years) outside the galaxy. Makani’s strong galactic winds were ejecting the dust grains from the galaxy over an estimated timescale of a billion years.

Previously, astronomers had not expected to find high quantities of dust grains outside the protection of a galaxy. The journey across a galaxy is long and hot, with temperatures in the millions of degrees. A dust grain would likely not survive the trip, as it would be destroyed by high-energy photons. This suggests that the PAHs were somehow shielded from the hotter parts of the interstellar medium and circumgalactic medium in large enough volumes to make it beyond the edge of Makani.

This answered questions about how galaxies enrich the circumgalactic medium, but it also added several more. Since today’s authors were limited by the sensitivity and range of their instruments, they were unable to confirm if there were PAHs along Makani’s entire wind structure, or just the first 35 kpc (114,000 light-years) of it. They also would like to turn their sights towards the intergalactic medium to see if PAHs could make it even farther beyond the reach of their host galaxy.

Original astrobite edited by Chloe Klare.

About the author, Natalie Price:

As a first-year master’s student at Wesleyan University, I study how stellar winds interact with the local interstellar medium. Outside of the observatory, you can find me dancing, with my nose in a book, or running at non-relativistic speeds.

The post Hitchhiking PAHs Caught Catching a Ride on Galactic Winds appeared first on AAS Nova.

Featured Image: A Pulsar in a Nebula in a Supernova Remnant

31 August 2026 at 17:00

When a massive star collapses, the subsequent supernova can leave behind the star’s condensed core in the form of a neutron star. Some neutron stars are also pulsars, which rotate at incredible speeds, emit beamed radio emission, and expel winds of charged particles. A pulsar’s relativistic charged-particle winds billow around the pulsar as it travels through space — often at a few hundreds of kilometers per second or faster, having received a “kick” when its progenitor star exploded. When these winds interact with the surrounding supernova ejecta or the interstellar medium, the interaction creates a detectable pulsar wind nebula. The image above combines data from the Australian Square Kilometre Array Pathfinder (orange) and Wide-field Infrared Survey Explorer (cyan) to show a pulsar wind nebula, indicated with a white rectangle, within a larger supernova remnant. Sanja Lazarević (Western Sydney University) and collaborators discovered this pulsar wind nebula, which they’ve named “Thunder” in a nod to the supernova remnant’s moniker, “Nimbus.” The cometary shape of the pulsar wind nebula suggests that the pulsar is moving quickly, traveling outward from the center of the explosion that occurred some 30,000–45,000 years ago. To learn more about the discovery and characterization of this pulsar wind nebula, check out the article linked below.

Citation

“EMU Discovery of Thunder: A Bow-Shock PWN Powered by PSR J1631–4722 Escaping the Nimbus SNR (G336.7+0.5),” S. Lazarević et al 2026 ApJ 1007 159. doi:10.3847/1538-4357/ae7f11

The post Featured Image: A Pulsar in a Nebula in a Supernova Remnant appeared first on AAS Nova.

An Interstellar Comet’s Coma Composition

21 August 2026 at 17:00

A photograph showing a fuzzy comet coma and some streaked stars alongside.

Astronomers have been measuring comets for centuries. But in December of last year, researchers collected a unique set of comet observations: they recorded some of the highest-quality data of one of the weirdest known comets while it was far from the Sun.

Simultaneous Spectra and Images

A few months after the famous interstellar comet 3I/ATLAS rounded the Sun and began its journey back into the space between the stars, a group of astronomers led by Nathan Roth (NASA Goddard Space Flight Center) aimed JWST in the direction of its retreat to watch it fade away. Using a special observing mode that leveraged the Integral Field Unit (IFU) in JWST’s Near Infrared Spectrometer, these observations didn’t result in just a single image of the comet, but a full stack of images, each corresponding to a different wavelength of light.

Using the IFU allowed the observers to combine the best of both regular imaging, which reveals spatial structure, and standard spectroscopy, which reveals wavelength dependencies. As a result, they could make spatially resolved maps of how the emission from the comet’s fuzzy atmosphere of gas and dust, or coma, changed with distance from the comet’s icy nucleus and angle to the Sun. Since different molecules radiate at different wavelengths, these maps in turn reveal the composition and geometry of 3I/ATLAS’s coma.

Mapping the Coma

A flux vs. wavelength plot showing a forest of narrow, well-resolved lines.

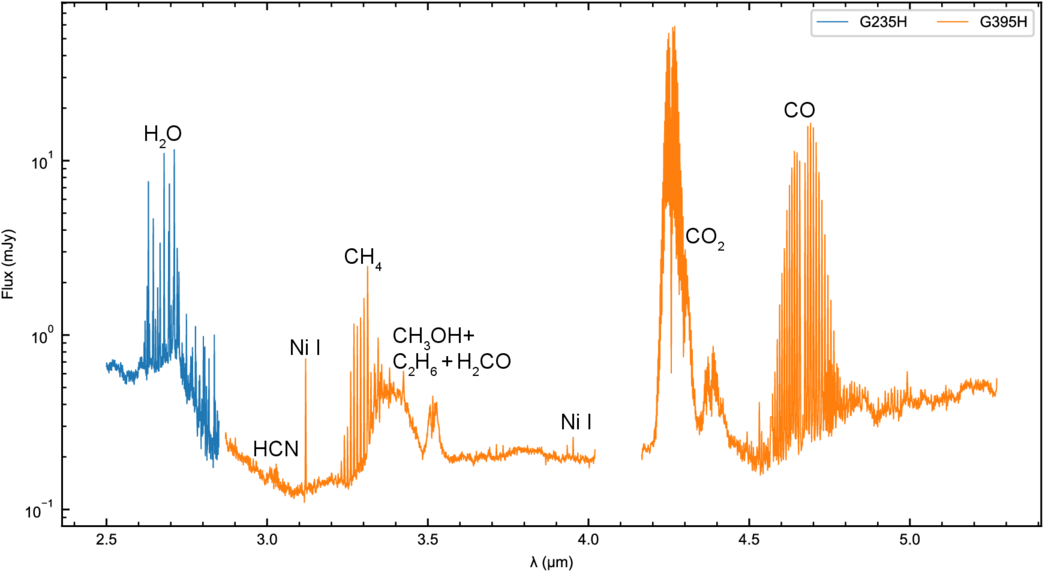
The spectrum of the coma of 3I/ATLAS. Note that this is a real spectrum, not a simulation. The contributions of various molecules are labeled alongside their most prominent emission lines. Click to enlarge. [Roth et al. 2026]

These maps, and the spectrum created by summing all of the spatial pixels together, reveal the comet’s coma in gorgeous detail, including hundreds of individual spectral lines that can be attributed to specific molecules. These maps revealed two unique features.

First, in contrast with normal solar system comets where water is the most abundant molecule, water was actually a secondary player here: there was significantly more carbon monoxide, or CO, than water in 3I/ATLAS’s coma. The researchers note that this might not be representative of the true distribution of the two species, but instead be the result of the timing of these observations. When observing a standard solar system comet, astronomers usually examine their targets when the object in question is within 2 au of the Sun. At these close distances, solar radiation is strong enough that water ice dominates the outgassing and activity in a coma.

However, these IFU measurements were taken when 3I/ATLAS was about 2.4 au from the Sun, or right in the transition region where water doesn’t sublimate as easily as CO or carbon dioxide (CO2). It’s likely that as the comet approaches the so-called “ice line” where water will naturally freeze out, CO will only increase its domination of the coma.

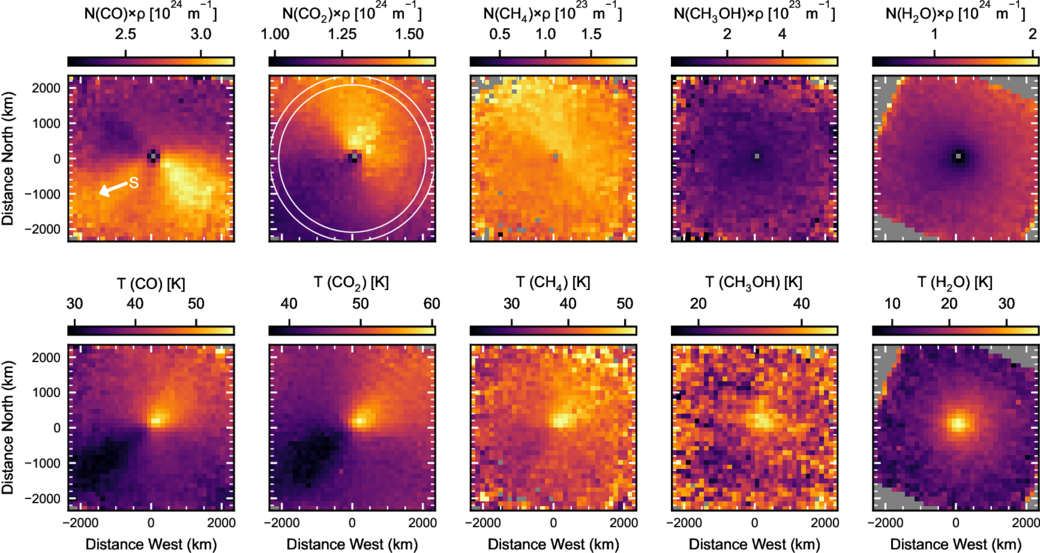
Top row: Maps of the distribution of various molecules in the coma. The white arrow shows the direction toward the Sun. Bottom row: The spatial distribution of the temperature of each species. Click to enlarge. [Roth et al. 2026]

Every Molecule for Itself

Second, each molecule seemed to be outgassing in its own unique direction from the coma. CO is leaving the nucleus in two different jets, one aimed directly back at the Sun and one perpendicular to it; CO2 and methane (CH4) are both leaking away in the anti-Sun direction; and water and methanol (CH3OH) are sublimating in nearly spherically symmetric shells. The authors speculate that these geometries may be caused by different “active sites” on the comet, and that had they observed the comet for one full rotational period, they might have seen these jets pointing in different directions.

Although 3I/ATLAS is now too far and faint for observations like these, this study reveals just how much we can learn in the brief time interstellar visitors spend in our solar system. When the fourth interstellar comet inevitably wanders through the inner solar system, astronomers will doubtless be ready to use this observing mode again.

Citation

“Coma Physics of an Interstellar Object: JWST Spatial-Spectral Mapping of 3I/ATLAS,” Nathan X. Roth et al 2026 ApJL 1005 L5. doi:10.3847/2041-8213/ae7443

The post An Interstellar Comet’s Coma Composition appeared first on AAS Nova.

Probing Dust in the Disk of a Growing Giant Planet

19 August 2026 at 17:00

ALMA observations of PDS 70

New research suggests that the circumplanetary disk surrounding the exoplanet PDS 70c contains a ring of dense dust, and the conditions within this ring may allow baby moons to form.

A Disk Within a Disk

closeup of PDS 70c's circumplanetary disk

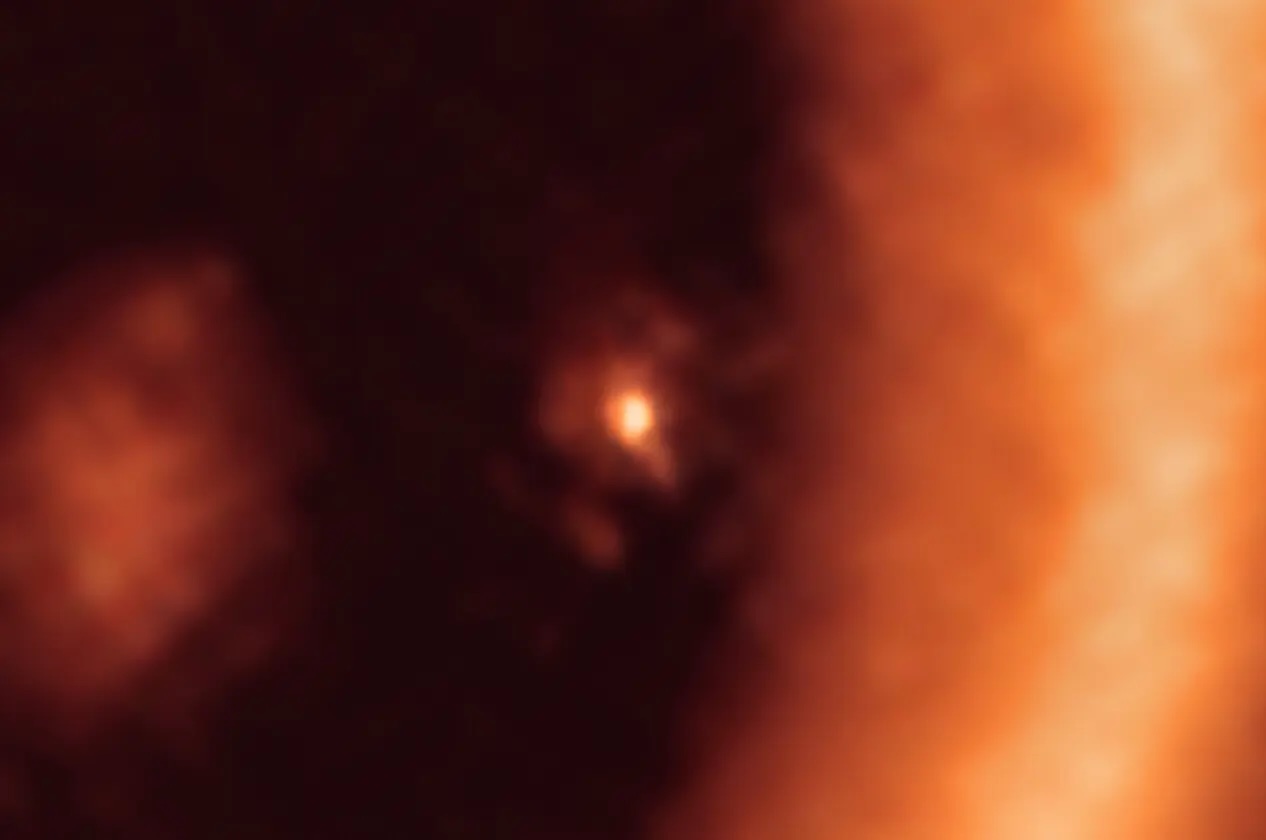
A closeup of PDS 70c’s circumplanetary disk within PDS 70’s protoplanetary disk. [ALMA (ESO/NAOJ/NRAO)/Benisty et al.; CC BY 4.0]

The young star PDS 70 has become famous for its protoplanetary disk and its two growing giant planets, PDS 70b and PDS 70c. At least one of these planets is surrounded by a disk of its own; in 2019, researchers using the Atacama Large Millimeter/submillimeter Array (ALMA) reported the first-ever observation of a circumplanetary disk around PDS 70c, and later observations with ALMA brought clearer views of this disk.

There’s still debate over the exact source of the emission detected by ALMA. Does this emission come from dust, and if so, how is the dust distributed? Is the disk optically thick or optically thin? Does the emission even come from dust, or could it instead be free–free emission from unbound electrons navigating a charged-particle maze?

Dust Diagnosis

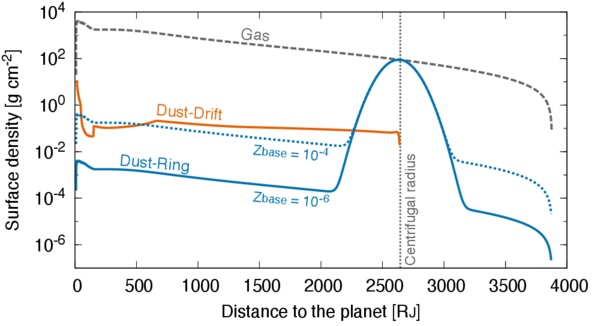
Yuhito Shibaike (Kagoshima University) and collaborators recently examined the hypothesis that the emission from PDS 70c’s circumplanetary disk arises from dust distributed in an optically thick ring. To test this hypothesis, the team explored two possible dust distributions, which they call “drift” and “ring.” In the drift model, dust grains within the circumplanetary disk migrate inward toward the planet, leaving much of the disk optically thin. Modeling suggests that this migration is typical in protoplanetary disks, and it might be common in circumplanetary disks as well.

plot of modeled dust distributions

Dust and gas surface density for the modeled disks in the drift (orange) and ring (blue) models. Click to enlarge. [Adapted from Shibaike et al. 2026]

In the ring model, the dust grains are concentrated within an optically thick ring at a certain distance from the planet. Simulations suggest that the formation of this type of dust ring is feasible, arising from a localized increase in gas density, outflows, or other causes.

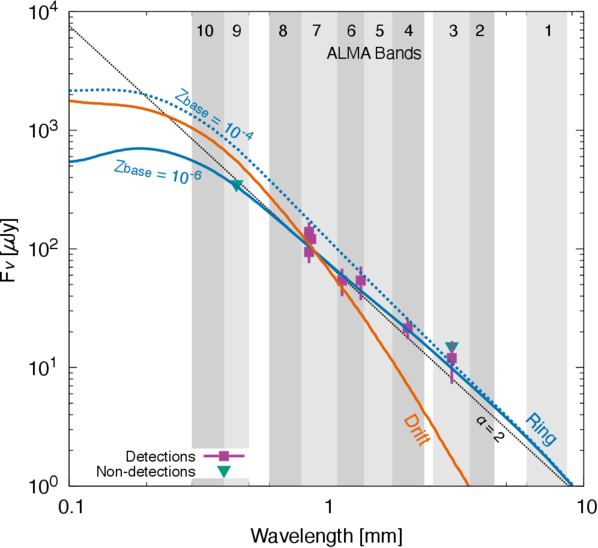
Shibaike and coauthors found that the ring model naturally reproduced the observed spectral energy distribution for a range of reasonable parameters. The drift model, on the other hand, required an unrealistically high dust-to-gas ratio for the material accreted onto the circumplanetary disk from the parent protoplanetary disk to reproduce the observed spectral index.

Future Prospects and Moon-Making Possibilities

comparison of ALMA observations and model predictions

Comparison of ALMA observations (colored symbols) and model predictions (colored lines) from the drift (orange) and ring (blue) models. Click to enlarge. [Adapted from Shibaike et al. 2026]

This work demonstrated the feasibility of the dust-ring model, but it didn’t rule out a contribution due to free–free emission from unbound electrons, which has also been proposed to explain the disk’s appearance. The team noted that distinguishing between thermal dust emission and free–free emission is challenging with existing data, as the two sources produce spectral energy distributions with similar shapes.

Luckily, this likely won’t remain a mystery forever: the next-generation Very Large Array, which is anticipated to begin full science operations in the mid-2030s, should be able to resolve the location of the dust within the circumplanetary disk and illuminate the source of emission.

Finally, if the dust surrounding PDS 70c is concentrated within a ring, what does that mean for the possibility of moons forming within the disk? Shibaike and collaborators found that the conditions within the ring likely satisfy the requirements of both the streaming instability and the gravitational instability, which are required for dust grains to clump together and form the rocky building blocks of baby moons. Perhaps the PDS 70 system will one day be the site of not only a circumplanetary disk, but an exomoon as well!

Citation

“Interpreting ALMA Multiwavelength Continuum Observations of PDS 70 c: An Optically Thick Dust Ring in the Circumplanetary Disk,” Yuhito Shibaike et al 2026 ApJL 1006 L26. doi:10.3847/2041-8213/ae86f5

The post Probing Dust in the Disk of a Growing Giant Planet appeared first on AAS Nova.

Galaxies of Many Colors

18 August 2026 at 17:00

Messier 83

Editor’s Note: Astrobites is a graduate-student-run organization that digests astrophysical literature for undergraduate students. As part of the partnership between the AAS and astrobites, we occasionally repost astrobites content here at AAS Nova. We hope you enjoy this post from astrobites; the original can be viewed at astrobites.org.

Title: Unbreaking the Universe: MINERVA Measurements of Color Gradients in Massive Quiescent Galaxies Can Help Ease Too-Early Star Formation Tensions
Authors: Sam E. Cutler et al.
First Author’s Institution: Tufts University
Status: Published in ApJL

Universe Breakers

JWST launched in 2021, and one of its key goals was to observe the first galaxies as they formed. Early results from JWST found something surprising: extremely massive galaxies in the early universe that had “quenched,” or stopped making new stars, much faster than was expected. These early results led some to believe that our understanding of how quickly massive galaxies can form and quench was fundamentally wrong.

Before concluding that our understanding of the universe is broken, it’s important to find other reasons why we might see very massive galaxies in the early universe. One theory is that these galaxies are actually less massive than we think. To “weigh” a galaxy, astronomers first measure the amount of light being emitted by that galaxy. If all the light in a galaxy comes from stars (which should be true in the early universe, though active black holes can contribute a lot of light in some galaxies), you can infer the total number of stars by accounting for the average amount of light emitted per star of a certain mass; this is called the “mass-to-light ratio.” Since massive stars emit a lot more light than low-mass stars, and high-mass stars die out faster than low-mass stars, the mass-to-light ratio is higher for older stellar populations. To accurately “weigh” a galaxy, scientists therefore need both a good measurement of the total amount of light in the galaxy and how old its stellar population is. The authors of today’s article suggest that the uncertainty in these measurements might be leading to overestimates of galaxy masses and underestimates of galaxy star formation rates, possibly explaining the existence of the earliest massive quiescent (non-star-forming) galaxies.

The Impact of Color Gradients

Previous works about the massive quiescent galaxies in this study used spectroscopy to determine the galaxies’ masses and star formation rates. These spectra were taken with a “slit,” which introduces a source of error: if the slit is smaller than the image of the galaxy, some of the galaxy’s light will be missed in the spectrum. Astronomers usually correct for this by checking how much of the total light of a galaxy image is covered by the slit and scaling up the spectrum to account for the missing light, but this correction assumes that the spectrum is basically the same across the entire galaxy.

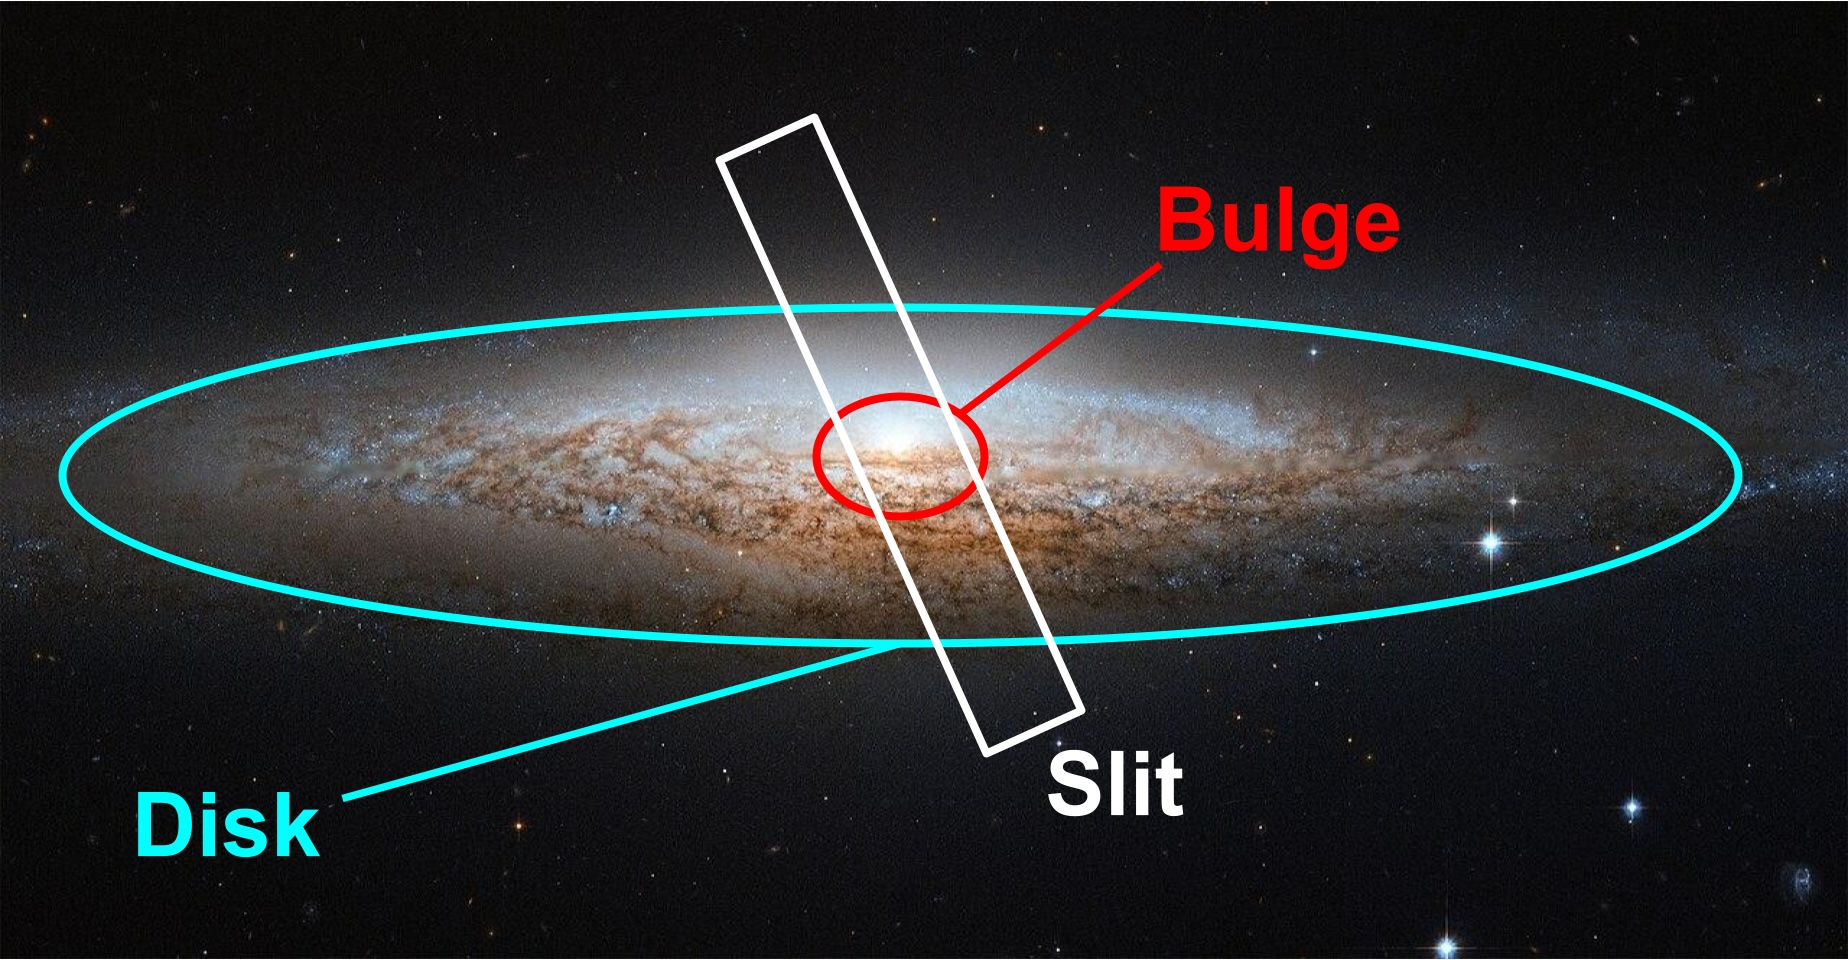
However, this assumption is rarely correct. In the local universe, star-forming spiral galaxies like the Milky Way tend to be made of a central “bulge” surrounded by a “disk” (see Figure 1). The bulge is no longer actively forming new stars, leading to a red-to-blue color gradient as you move out from the center of the galaxy. In astronomy, this is considered a “negative” color gradient. A slit that only covers the galaxy center would lead to an overall overestimate of the stellar mass and underestimate of the star formation rate. If the galaxies instead had a positive color gradient, with more star formation in the center of the galaxy, the mass would be underestimated and the star formation rate would be overestimated. Galaxies with both positive and negative color gradients have been found in the distant universe. By measuring the color gradient for each individual galaxy in their sample, the authors can correct the mass and star formation rate calculations from spectra taken with a slit spectrograph.

NGC 2683 with annotations

Figure 1: The spiral galaxy NGC 2683 with its bulge and disk labeled. The inner part of the galaxy (“bulge”) contains older, redder stars; the outer part of the galaxy (“disk”) contains bright blue stars that indicate that star formation is ongoing. Here, the slit spectrograph only covers the galaxy’s bulge, leading to incorrect mass and star formation rate measurements. [ESA/Hubble & NASA (CC BY 4.0) with annotations by Margaret Verrico]

Results

Instead of using spectra, the authors of today’s article use imaging in different filters to measure color gradients for a sample of four galaxies in the early universe that had previously been found to be extremely massive and no longer forming stars. They use medium-band filters, or filters that let in only a small part of a galaxy’s spectrum, to produce a spectral energy distribution at each radius. This spectral energy distribution is less informative than a spectrum (think a handprint versus a fingerprint), but it’s detailed enough to model the likely stellar population at each radius to determine whether the galaxies have positive, negative, or no color gradients, allowing for better corrections to the properties measured from the galaxies’ centers. They also model the stellar population from the central part of the galaxy that would normally be covered by a slit, as well as from the actual spectrum, to test whether any differences in their results come from their choice of modeling techniques.

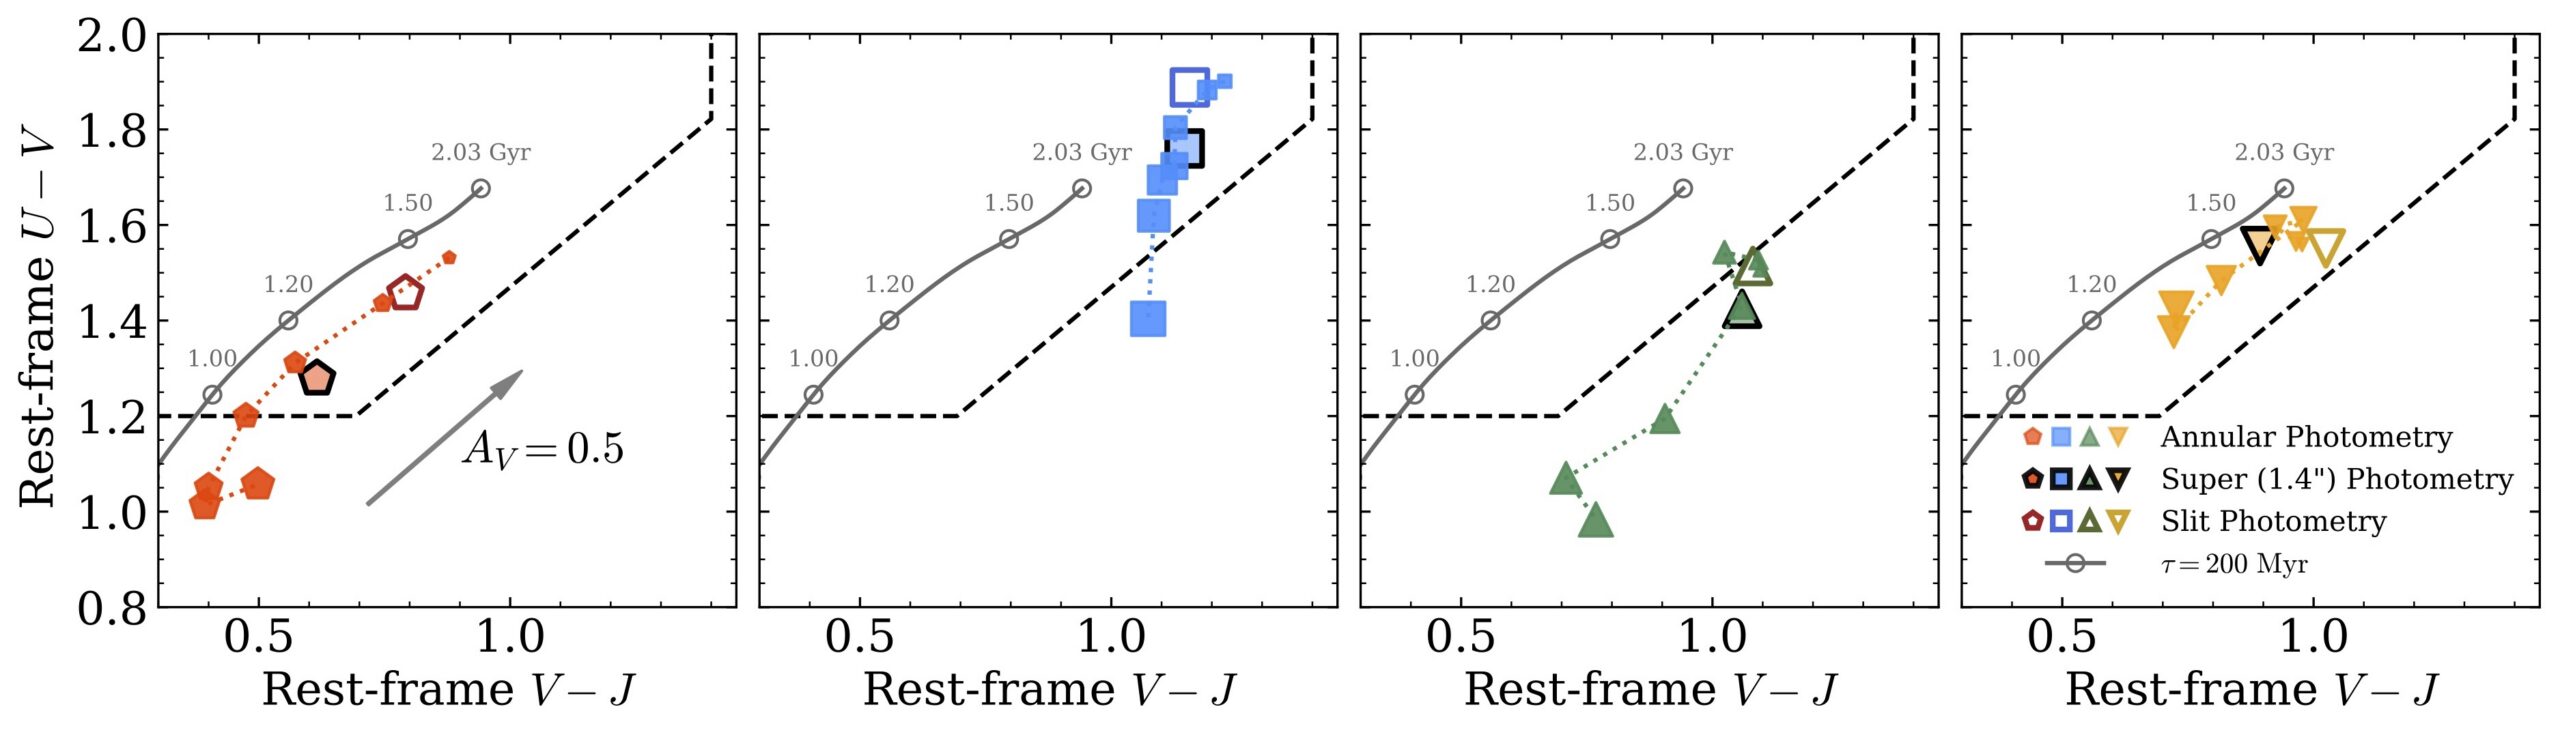
The authors find that three of the four galaxies have a negative color gradient in at least some areas. The fourth galaxy has a relatively flat color gradient, though this measurement is less certain due to the object’s redshift. When the authors plot the galaxies’ colors on a diagnostic diagram that separates red and old galaxies from young and blue galaxies, they find that three of the four galaxies have centers that appear red and old but outskirts that appear young and blue (Figure 2). This means previous measurements of the mass may have been overestimated, and previous measurements of the star formation rate may have been underestimated.

color-color diagram for the galaxies studied

Figure 2: The location of each of the four galaxies on a color–color diagram that separates red galaxies (above/to the left of the dashed lines) from blue galaxies (below/to the right of the dashed lines). The open markers indicate the galaxy color as measured from the center of the galaxy; the filled-in markers show the color at different radii from the galaxy center. For all but one galaxy, the color at several radii is bluer than at the center, indicating that the galaxy might have younger stars at least at some radii. [Adapted from Cutler et al. 2026]

Next, the authors model the stellar ages across the galaxies using spectral energy distribution modeling. This technique compares the measured spectral energy distribution to libraries of stellar spectra, rules about how different dust or chemical composition impact galaxy appearance, and observational effects to predict the actual stellar makeup of a galaxy. In this case, the authors can’t know for sure whether the redder colors at galaxy centers come from an older stellar population, more dust, or changes in the chemical composition (the so-called “dust–age–metallicity degeneracy”). To account for this, the authors try modeling the stellar population two ways: once by assuming all change in color comes from a change in stellar age, and again by allowing the dust and chemical composition of the galaxy to change with radius. They find that if only the stellar age varies across the galaxy, age gradients in the galaxy stellar population can bring the estimated galaxy masses and star formation rates back toward agreement with models of galaxy evolution in the early universe, though not all the way. However, allowing dust and chemical composition to change across the face of the galaxy lead to higher stellar masses and less star formation, meaning the mystery may not yet be solved.

Is the Universe Broken?

To determine whether these galaxies still count as “universe breakers,” the authors use a cosmological model to predict the largest expected galaxy mass in the observed area at different periods in cosmic time. The previous results had less than a 0.3% chance of occurring under current cosmological models; with their updated numbers and stellar population models, the authors find that the observed galaxies sometimes have more than a 5% chance of occurring, though there is still tension. They point out that their analysis ignores processes that could help galaxies grow and quench in the early universe, like galaxy mergers; still, the existence of these massive galaxies with such low star formation rates remains a puzzle.

Original astrobite edited by Ansh Gupta.

About the author, Margaret Verrico:

I am a fourth-year graduate student at the University of Illinois Urbana-Champaign. I study the connection between supermassive black hole transients and their host galaxies. I am also an avid knitter and reader, and I am passionate about opening up STEM opportunities for people of all backgrounds.

The post Galaxies of Many Colors appeared first on AAS Nova.

Featured Image: The Microquasar and the Manatee

17 August 2026 at 17:00

multiwavelength view of SS 433 / W50

The supernova remnant W50 — nicknamed “the Manatee” because its blobby radio emission resembles an aquatic mammal floating through starry waters — harbors an extreme system at its heart. Near the center of the remnant, the microquasar SS 433 exhibits an immense pair of relativistic jets, likely powered by a stellar-mass black hole accreting material from a companion star. In the image of W50/SS 433 above, radio emission is in red, optical light is in yellow, and soft, medium, and hard X-ray emission are in green, cyan, and magenta, respectively. Brydyn Mac Intyre (University of Manitoba) and collaborators focused on the region circled above, using NuSTAR and XMM-Newton to understand the source of the X-ray emission in that region and the potential for SS 433 to accelerate particles to relativistic velocities. These observations suggest that W50/SS 433 accelerates electrons up to energies of more than 100 teraelectronvolts, and it may launch other particles into the highly sought-after petaelectronvolt range. To learn more about the particle-acceleration possibilities in this remarkable region, be sure to check out the full research article linked below.

Citation

“The Western Jet of SS 433/W50: Hard X-Ray Emission, Spectral Evolution, and Comparison to the Eastern Jet,” Brydyn Mac Intyre et al 2026 ApJ 1006 69. doi:10.3847/1538-4357/ae7a47

The post Featured Image: The Microquasar and the Manatee appeared first on AAS Nova.

A Lyman-Leaking Galaxy Merger Confirmed with JWST

14 August 2026 at 19:43

Epoch of Reionization

Exactly how the universe became reionized after cooling to form stars and galaxies remains an open question. A recent study investigates how a merging set of galaxies may have spurred an onslaught of ionizing photons into the intergalactic medium.

Lyman Continuum Leakers and Merging Galaxies

After its chaotic and blistering beginning, the universe cooled and began to coalesce, stars and galaxies flickering on to set the universe alight. From a few hundred million to about a billion years after the Big Bang, galaxies pumped high-energy ionizing Lyman continuum (LyC) photons into the intergalactic medium during what is known as the epoch of reionization. The exact mechanisms that produced and allowed LyC emission to escape galaxies during this era remain elusive.

Galaxy Merger

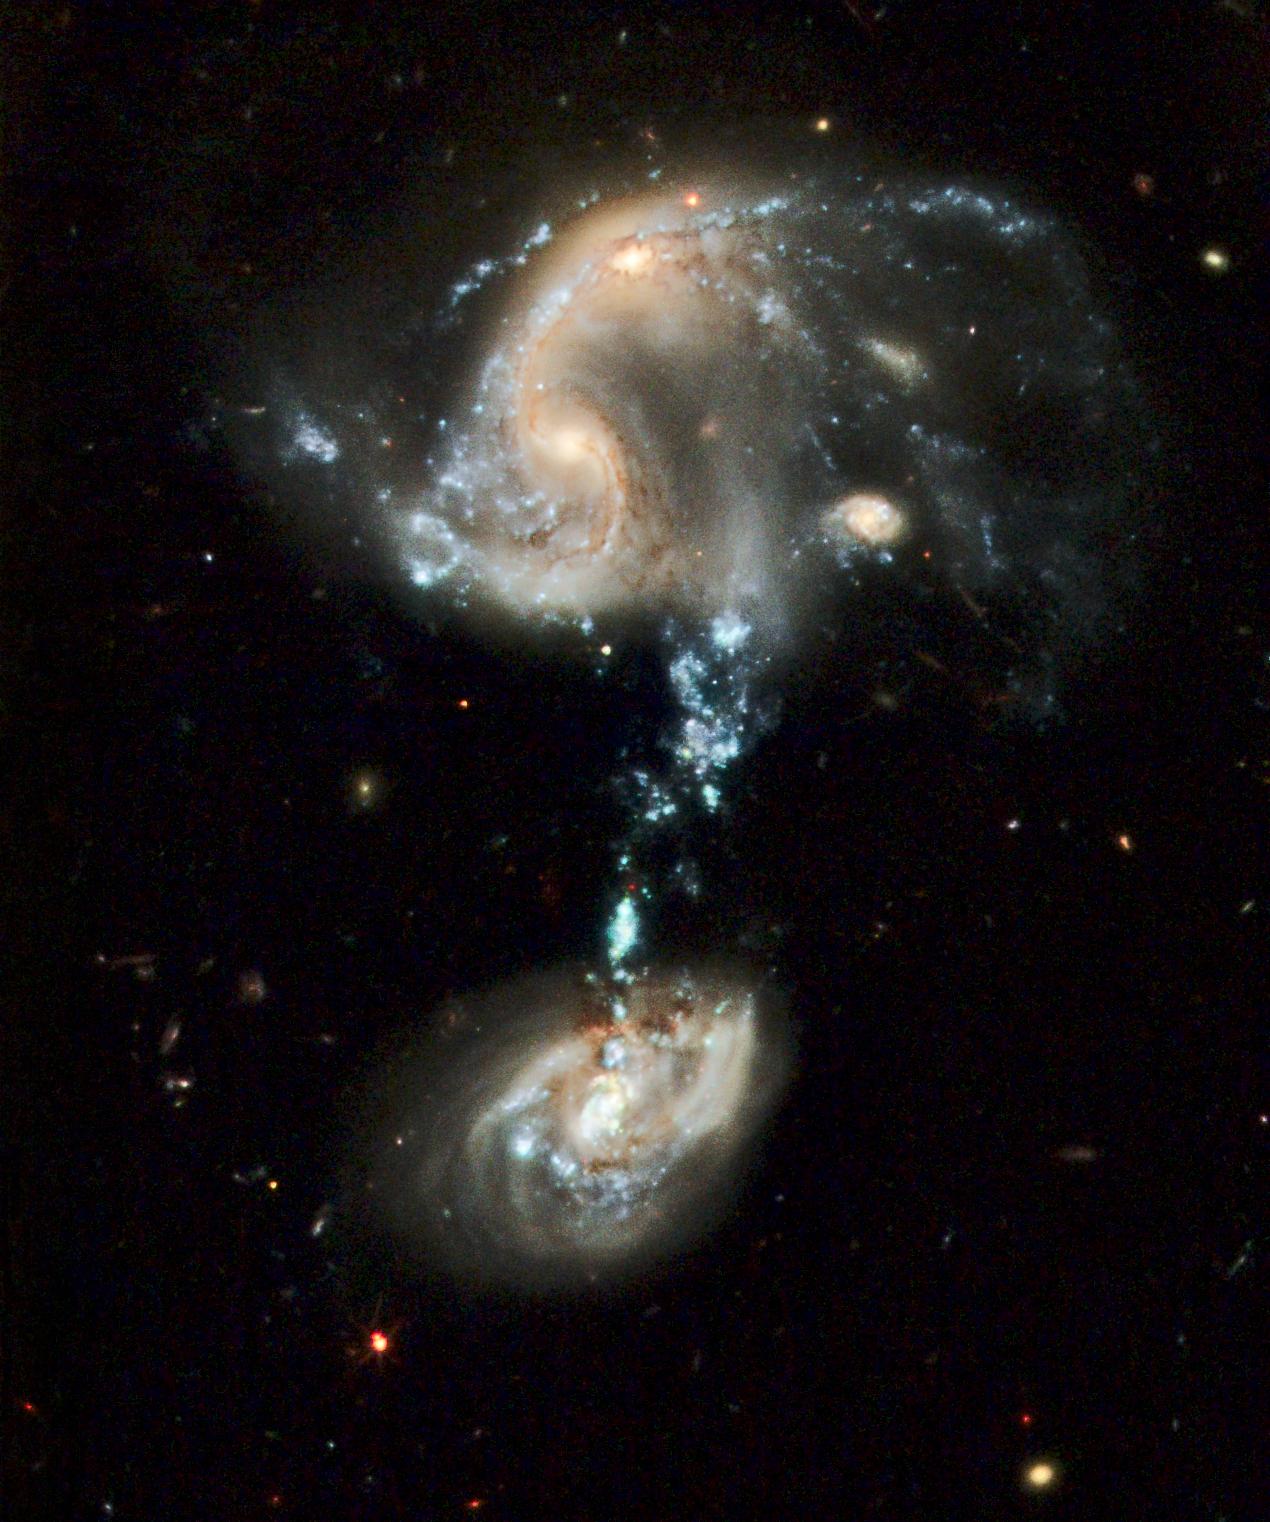
Hubble Space Telescope image of the interacting galaxy group Arp 194. The blue stream connecting the galaxies is where tidally stripped gas formed millions of new stars. [NASA, ESA, and the Hubble Heritage Team (STScI/AURA)]

One promising driver of LyC leakage is galaxy mergers — strong gravitational interactions and interstellar medium mixing can induce bursts of star formation, creating the hot, young stars that emit LyC photons. In particular, galaxy mergers can create tidal tails, streams of wispy gas, that can sustain brief but intense bouts of star formation that quickly use up surrounding gas. With no interstellar gas left to absorb radiation, the fresh stars in these streams can easily pump their high-energy photons into the intergalactic medium, contributing to cosmic reionization.

While observational studies have increasingly pointed to galaxy mergers as considerable drivers of LyC escape, only a small number have explicitly considered the role of mergers in the epoch of reionization due to spectral and spatial resolution limitations. Leveraging the high-resolution capabilities of JWST, Shengzhe Wang (University of Chinese Academy of Sciences; National Astronomical Observatories, Chinese Academy of Sciences) and collaborators performed detailed analyses of two LyC-leaker candidates to better understand the role of galaxy mergers in heating up the universe.

Confirming (and Refuting) Merger-Driven Leaks with JWST

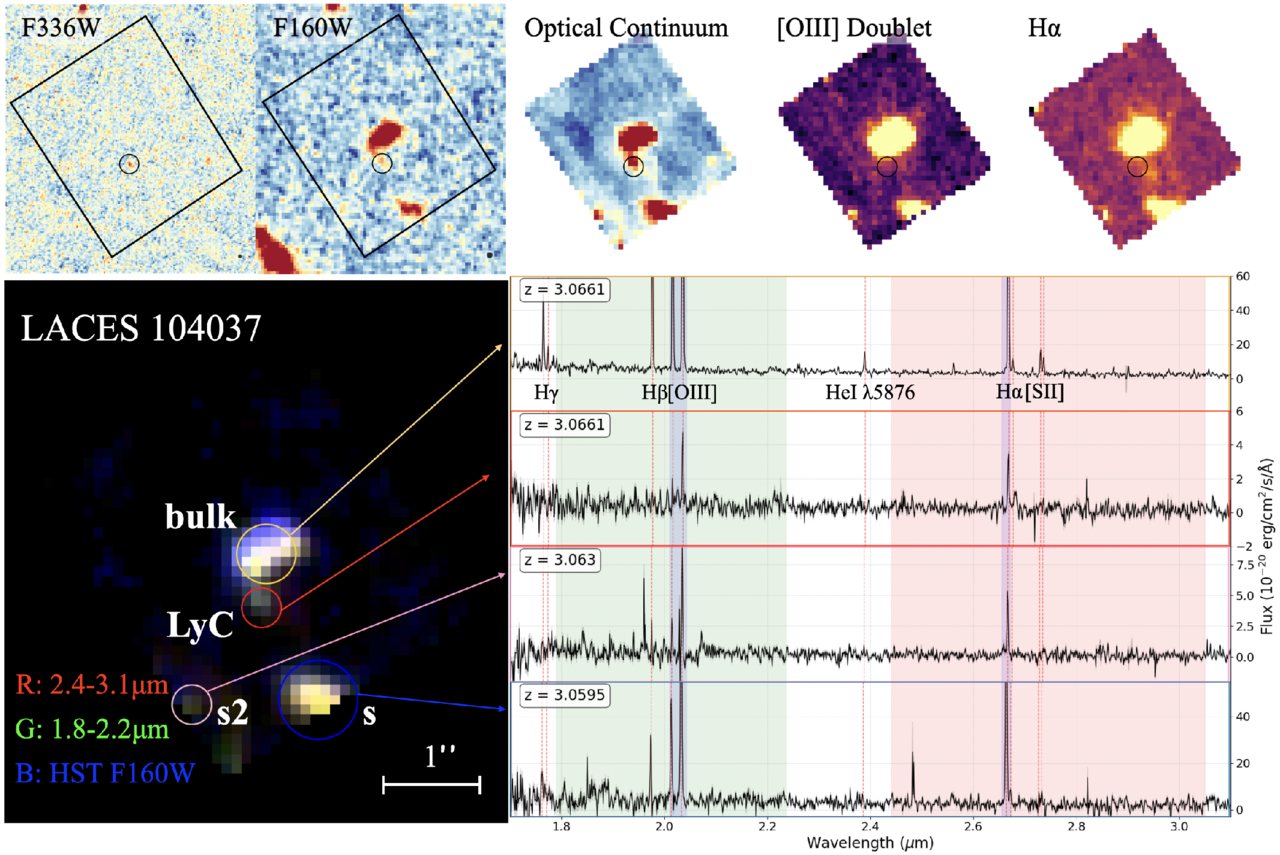
Using candidate LyC leakers first identified in the LymAn Continuum Escape Survey (LACES) carried out with the Hubble Space Telescope, Wang and team obtained high-resolution JWST spectroscopy for two galaxies at redshift z = 3.1 (about 2 billion years after the Big Bang), LACES94460 and LACES104037. After carefully identifying and measuring emission lines in each candidate, the authors confirmed LACES104037 as a merger-driven LyC leaker. However, the apparent LyC emission from LACES94460 was determined to be contamination from a low-redshift object.

LACES 104037

Hubble and JWST observations of LACES104037. The top panels show the Hubble images (first two panels) and the JWST spectral observations (last three panels). The bottom panel shows a composite three-color image marking the location of two primary interacting galaxies and the LyC emission along with the associated spectra. Click to enlarge. [Wang et al 2026]

Based on the JWST spectroscopy, LACES104037 is an early-stage merger system with two primary interacting galaxies (LACES104037-bulk and LACES104037s) with a tidal-tail structure connecting them (LACES104037-LyC) where the LyC emission originates. Using model predictions based on the JWST spectroscopy and photometry from previous studies, the team found that LACES104037-LyC is a star-forming clump in a tidal tail with a stellar age of about 5 million years and an extreme LyC photon escape fraction of approximately 0.99. This points to merger-induced star formation being an extremely efficient way to dump ionizing photons into the intergalactic medium.

LACES104037-LyC represents the first confirmed LyC leaker of its kind: an external clump of star formation in a tidal tail. This discovery aids in our understanding of how mergers can drive high-energy photon emission, and highlights the critical role galaxy mergers may play in the epoch of reionization. Future high-resolution observations will hopefully reveal more knots of LyC-leaking stars within merging galaxies and provide a deeper understanding of this important evolutionary phase of the universe.

Citation

“Confirmation and Refutation of Lyman Continuum Leakers at z ~ 3 with JWST NIRSpec IFU,” Shengzhe Wang et al 2026 ApJL 1006 L17. doi:10.3847/2041-8213/ae8523

The post A Lyman-Leaking Galaxy Merger Confirmed with JWST appeared first on AAS Nova.

Complexities and Mysteries in the Atmosphere of Ultra-Hot Jupiter WASP-121b

12 August 2026 at 22:48

illustration of WASP-121b

Ultra-hot Jupiter WASP-121b is once again puzzling astronomers. New JWST observations have revealed aspects of this superheated planet’s atmosphere that models cannot yet explain.

An Extreme Planet

Among the more than 6,000 known exoplanets, there are many types of worlds that aren’t represented in our solar system. The most exotic and unfamiliar planets might be the ultra-hot Jupiters: giant planets nestled so close to their host stars that they are tidally locked, with temperatures on their permanently starlit sides climbing to thousands of degrees.

WASP-121b, which circles its F-dwarf host star every 30.5 hours, is one of the best-studied ultra-hot Jupiters. Previous work has started to reveal the complexity of its atmosphere, and now, data from JWST have opened a new window onto WASP-121b’s behavior.

New View from JWST

representation of an exoplanet's phase curve

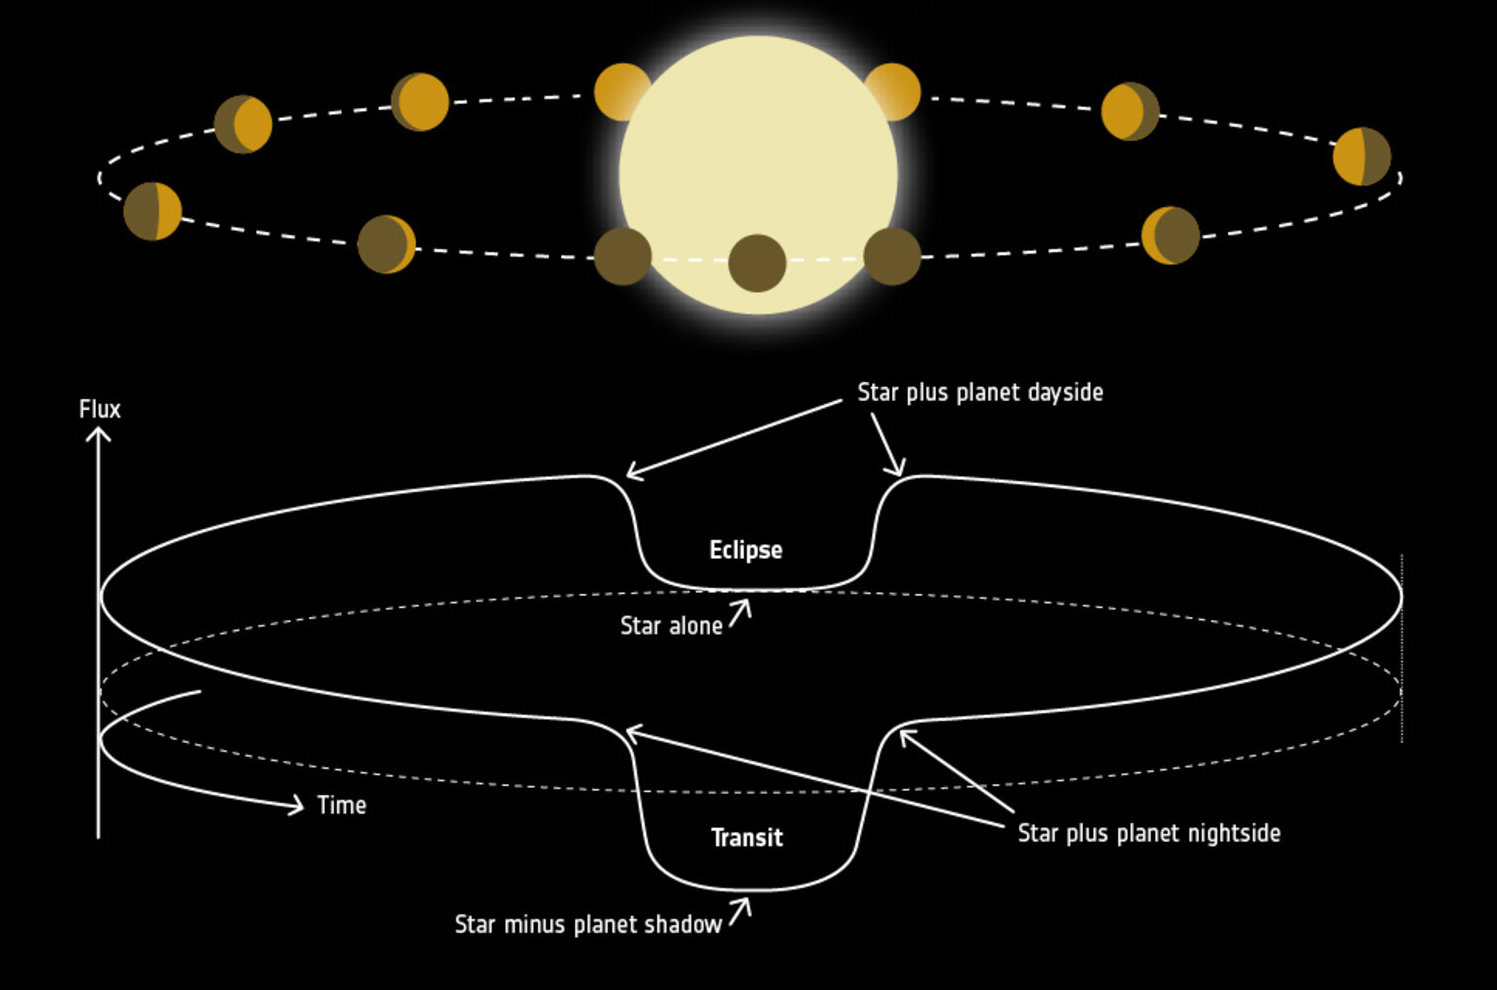
A representation of an exoplanet’s phase curve. Click to enlarge. [ESA]

To learn more about WASP-121b’s atmosphere, Robert C. Frazier (University of Michigan) and collaborators analyzed JWST Near Infrared Imager and Slitless Spectrograph (NIRISS) observations covering more than one full orbit of the planet. These observations allowed them to construct the system’s phase curve, which describes the total amount of emitted and reflected light from the planet and its host star over an entire orbit.

The team used two 3D general circulation models to predict the planet’s atmospheric structure and extract synthetic spectra and phase curves to compare against the JWST observations. Using nine model configurations in total, the team varied several inputs, including sources of atmospheric opacity, sources of atmospheric drag, and assumptions about whether clouds are able to form on the planet’s cooler nightside.

Left with a Mystery

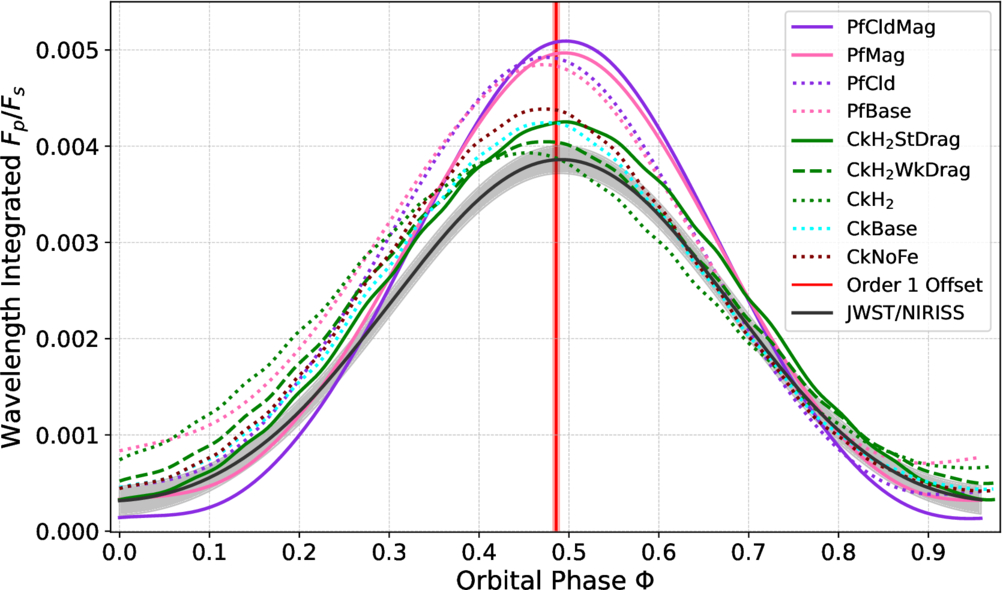
Frazier and collaborators found two aspects of WASP-121b’s phase curve that their models couldn’t explain: the planet emits less light overall than predicted, and the location of its phase-curve offset changes with wavelength.

phase curve of WASP-121b

Modeled phase curves, shown as the flux of the planet divided by the flux of the star, for WASP-121b (colored solid and dotted lines) compared to the best fit to the JWST observations (black line). Click to enlarge. [Frazier et al. 2026]

The models predict, on average, 12–15% more emission from the planet than observed. This discrepancy might be traced back to how the planet’s radius is determined, which is a simple-sounding task that can be deceptively difficult; WASP-121b isn’t perfectly spherical, and its emitting area changes with wavelength, making it challenging to normalize the planet’s radius for use in models.

The phase-curve offset is the difference between a planet’s sub-stellar point (where the star is directly overhead) and the brightest point in the planet’s atmosphere. In general, some degree of offset is expected because planetary winds tend to whisk heat away from the sub-stellar point, placing the brightest point somewhere to the east (usually). For WASP-121b, the offset is unexpectedly small — suggesting a source of drag in the atmosphere that prevents winds from transporting heat away from the sub-stellar point — and it’s larger at shorter wavelengths. This wavelength dependence isn’t predicted by any of the models, and it’s not clear what causes it.

These results demonstrate something remarkable: that our observations of a planet nearly 900 light-years away have become so precise that they’re pushing our already complex models to include more physics — an exceptionally exciting motivation for model improvement!

Citation

“The Days Drag On on WASP-121 b: Interpreting Its NIRISS Spectroscopic Phase Curve with General Circulation Models,” Robert C. Frazier et al 2026 ApJ 1004 102. doi:10.3847/1538-4357/ae69ca

The post Complexities and Mysteries in the Atmosphere of Ultra-Hot Jupiter WASP-121b appeared first on AAS Nova.

A Seriously Dusty Supernova

11 August 2026 at 22:00

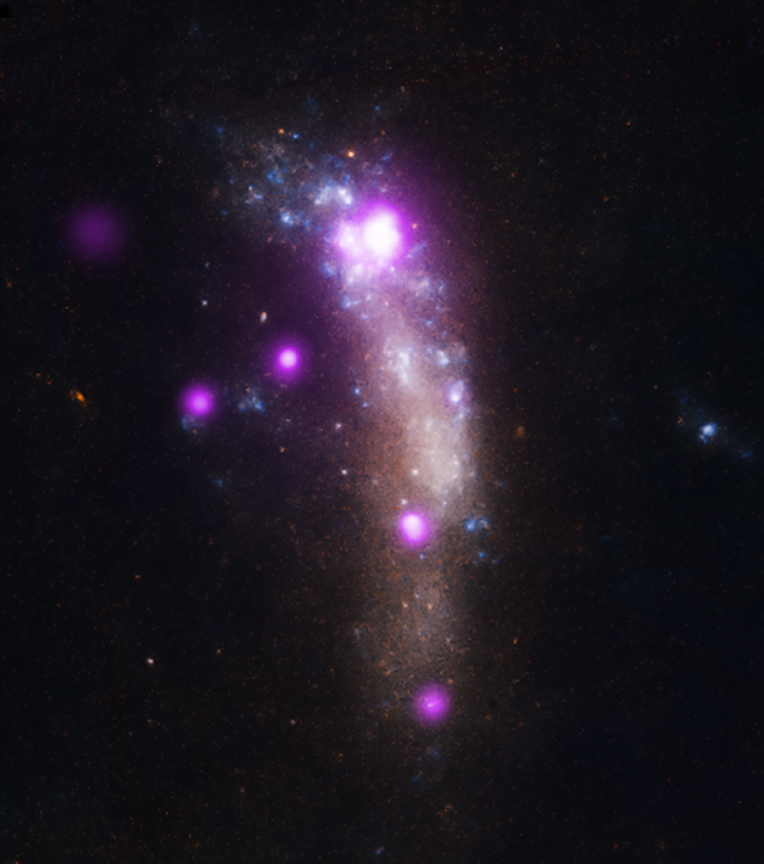
galaxy UGC 5189A, host of the supernova SN 2010jl

In 2010, the supernova SN 2010jl illuminated a corner of a small, irregular galaxy 150 million light-years away. More than a decade later, researchers have found evidence that this collapsing massive star has created a significant amount of cosmic dust.

Superluminous Supernova

SN 2010jl in its host galaxy

This X-ray and optical image shows SN 2010jl in its host galaxy. The supernova is the brightest X-ray source, near the top of the galaxy. [X-ray: NASA/CXC/Royal Military College of Canada/P.Chandra et al); Optical: NASA/STScI]

From high-redshift galaxies to nearby star-forming regions, it’s clear that the universe is a dusty place — but where does all this dust come from? Core-collapse supernovae are one possible source. These cataclysms fling enriched material into interstellar space, where dust grains coalesce out of the cooling ejecta. This is a promising explanation for dust in high-redshift galaxies, which require more rapid dust production than other sources, like evolved low- to intermediate-mass stars, can provide.

SN 2010jl offers an excellent chance to study the dust-forming potential of core-collapse supernovae. This supernova was unusually luminous because of intense interactions between the expanding supernova shock and the dense material surrounding the exploding star, and it’s possible that these types of interactions spur the creation of dust. In the first few years after the supernova was discovered, researchers found evidence that it had produced new dust. What has it been up to since?

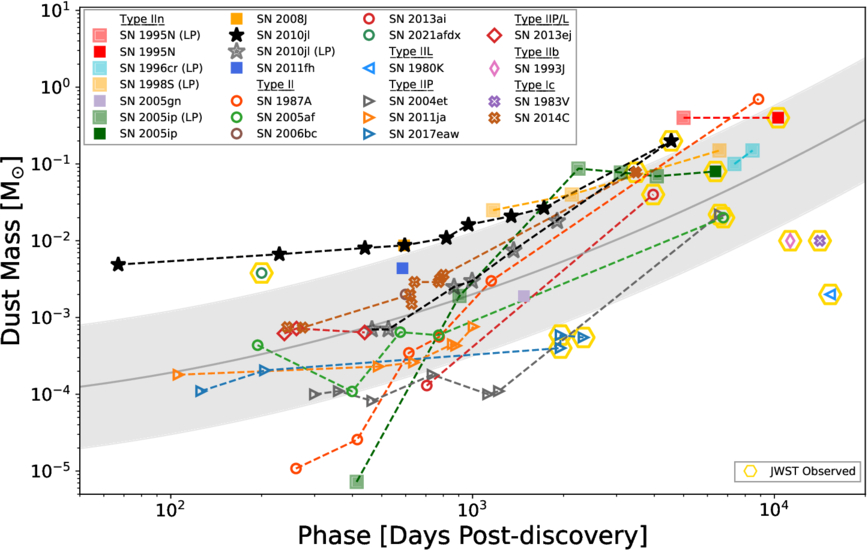
SN 2010jl dust mass over time

SN 2010jl’s inferred dust mass over time (black stars) compared to other supernovae. Click to enlarge. [Smith et al. 2026]

Checking Back In

Thirteen years after SN 2010jl was discovered, Nathan Smith (Steward Observatory) and collaborators checked in on its dust production. The team collected new ground-based optical spectra from the Keck I telescope and the MMT Observatory and mid-infrared spectra from JWST. The optical spectra — among the latest collected for any superluminous supernova — show numerous narrow emission lines that indicate that the expanding supernova continues to interact with its surroundings.

In the JWST observations, SN 2010jl is the brightest mid-infrared point source in its host galaxy. Through spectral energy distribution modeling, Smith and coauthors found that the brilliant infrared emission is likely due to a shroud of warm dust totaling roughly 20% of the mass of the Sun. This is about 80 times more dust than inferred from observations made a decade earlier.

Where’s the Dust?

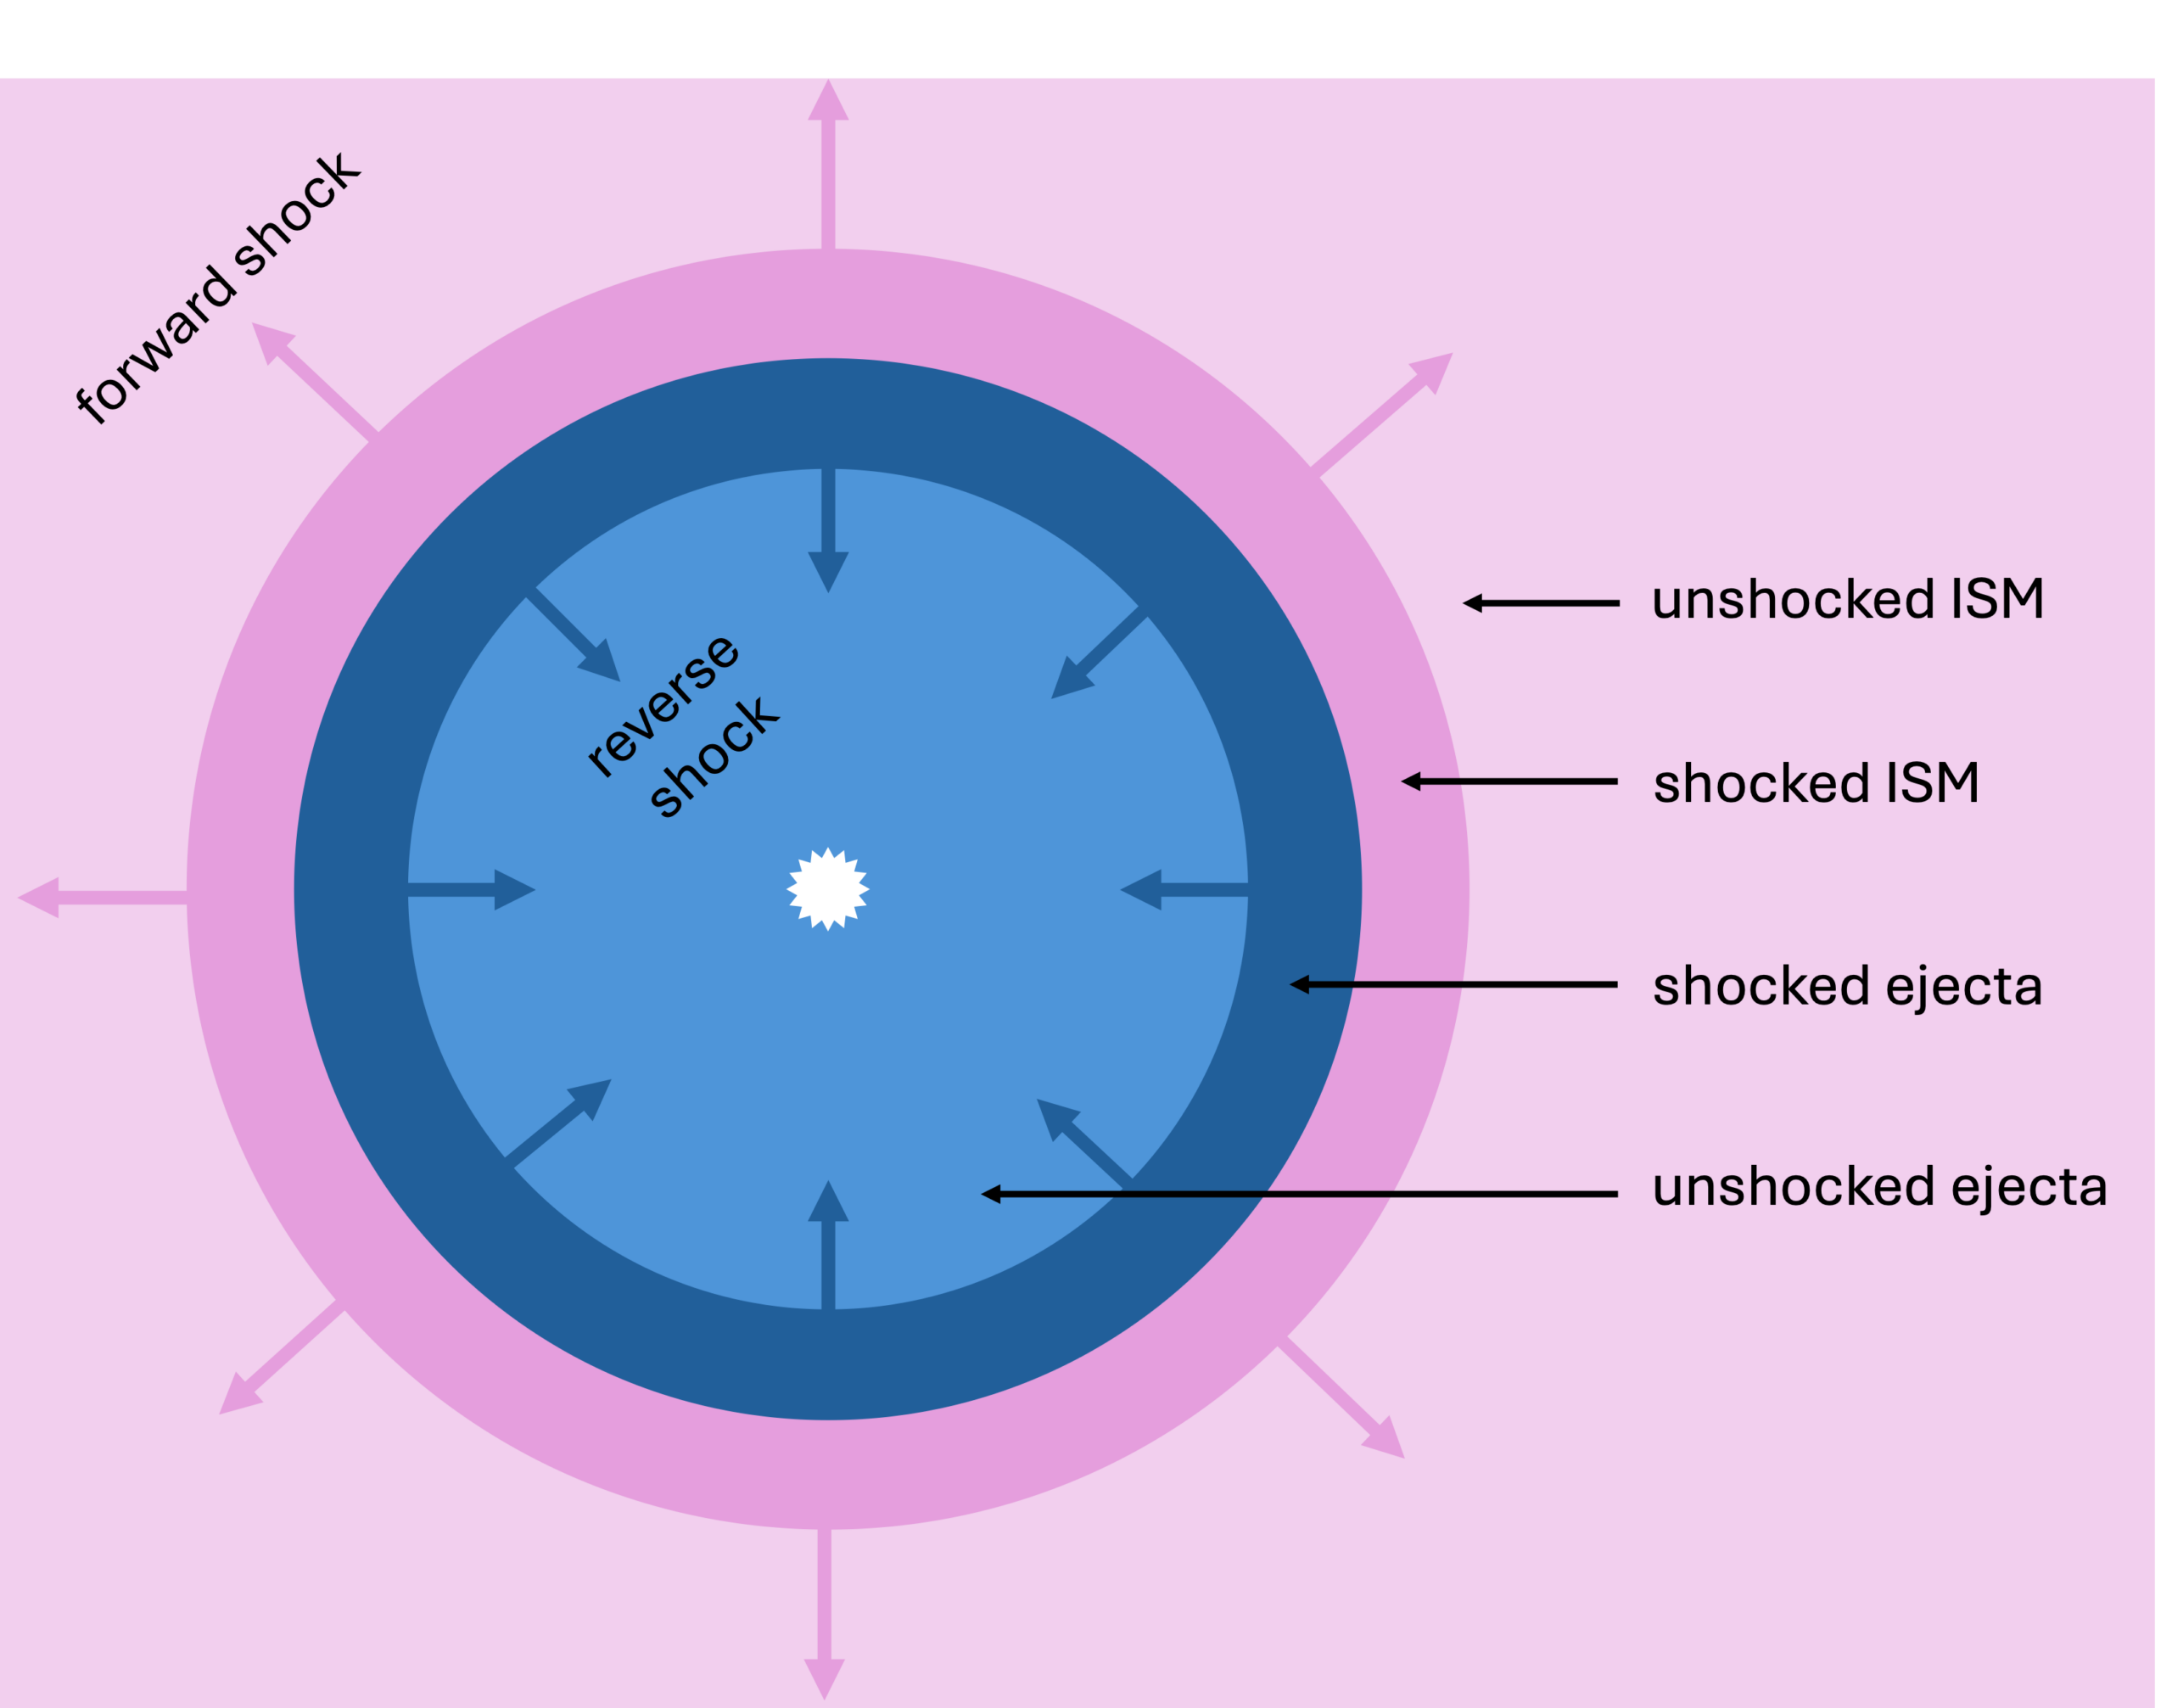
diagram of a supernova's shocks

Diagram showing the outward-moving forward shock and inward-moving reverse shock of a supernova that is interacting with the interstellar medium (ISM). The post-shock region is located between the two shocks and contains shocked ejecta as well as shocked interstellar material. Click to enlarge. [AAS Nova/Kerry Hensley]

While these data appear to tell the tale of a prolific dust-producing supernova, interpreting these results isn’t straightforward — at a distance of 150 million light-years, it’s difficult to pin down the exact location of the dust. If the dust formed in the supernova ejecta that has not yet withstood the passage of the reverse shock, that dust might be destroyed when it passes through the shock. It’s also possible that the emission comes from preexisting dust in the interstellar medium that was destroyed by the passage of the supernova shock, then re-formed as the material cooled. If instead the dust formed in the post-shock region (between the outward-moving forward shock and the inward-moving reverse shock), it should survive and become incorporated into the interstellar medium.

While it’s not possible to rule out the other options entirely, Smith and collaborators argue that at least some of the dust can be traced to new growth in the post-shock region. Because post-shock dust grains are likely to reach the interstellar medium, this suggests that superluminous, strongly interacting supernovae like SN 2010jl are a viable source of dust in the present-day universe and in high-redshift galaxies alike.

Citation

“JWST Spectra Indicate a Large Mass of Postshock Dust Formed by SN 2010jl,” Nathan Smith et al 2026 ApJ 1006 224. doi:10.3847/1538-4357/ae74c5

The post A Seriously Dusty Supernova appeared first on AAS Nova.

Do Galaxies Really Glow in Sync — or Are We Just Tilting Our Heads?

10 August 2026 at 17:00

NGC 1068

Editor’s Note: Astrobites is a graduate-student-run organization that digests astrophysical literature for undergraduate students. As part of the partnership between the AAS and astrobites, we occasionally repost astrobites content here at AAS Nova. We hope you enjoy this post from astrobites; the original can be viewed at astrobites.org.

Title: Geometry, Not Calorimetry, Drives the Radio–Infrared–γ Ray Correlation
Authors: T. A. Porter, I. V. Moskalenko, and G. Jóhannesson
First Author’s Institution: Stanford University
Status: Published in ApJ

Galaxies emit light not only in the visible band, but also across other wavelengths via different physical mechanisms. Finding correlations between emissions at different wavelengths is a powerful tool for astrophysicists to explore the underlying mechanisms of galaxy formation. One of the most famous examples is the infrared–radio continuum correlation, which holds across several orders of magnitude in luminosity.

The typical explanation for this correlation is that both infrared light and radio synchrotron emission share the same energetic origin: star formation. Young stars emit ultraviolet radiation, which is absorbed by interstellar dust and re-radiated in the infrared. When these stars end their lives in core-collapse supernovae, the resulting shock waves accelerate cosmic-ray electrons, which then interact with the magnetic field to produce synchrotron emission.

For this correlation to hold, cosmic-ray electrons must radiate away all their energy within the galaxy, unable to escape and carry away some of their energy. Otherwise, the amount of radio emission would depend on how quickly cosmic rays escape and would no longer correlate with the infrared emission. This assumption is called the “electron calorimeter” model, which assumes that electrons lose all their energy due to radiation without escaping the galaxy. However, observations show that the infrared–radio correlation persists even in low-density galaxies where cosmic rays can easily escape, suggesting that the calorimeter model may not be the full story. To reconcile this, previous studies proposed “conspiracy-like” scenarios in which cosmic-ray injection, transport, magnetic-field amplification, and gas density are all coupled in a finely self-regulating way to maintain the correlation across diverse galactic environments — a somewhat awkward explanation that requires multiple unrelated physical processes to conveniently work together.

With the increased sensitivity of the Fermi Large Area Telescope, high-energy gamma-ray (or γ-ray) detections add new information to this picture. A galaxy’s γ-ray emission is produced by two different sources: cosmic-ray protons interacting with the interstellar medium gas, and cosmic-ray electrons inverse-Compton scattering off of nearby starlight or photons from the cosmic microwave background. Since both processes involve cosmic rays, the total γ-ray emission should also reflect the amount of star formation and therefore correlate with infrared and radio emission.

Because all three wavelengths trace different pieces of the same cosmic-ray population, studying them together reveals how the galaxy’s total cosmic-ray energy budget is distributed across its multi-wavelength emission.

The infrared–radio correlation has been established not only at the scale of entire galaxies, but also locally, down to patches roughly 100 parsecs across. Think of it like the relationship between a city’s electricity consumption and its population: we have long known they track each other city-wide, but it turns out the same relationship holds block by block. The infrared–radio correlation works the same way: zoom into any 100-pc region within a galaxy, and the correlation is still there. Unfortunately, the resolution of γ-ray observations is still stuck at around the kiloparsec scale. It is therefore unclear whether the local infrared–radio correlation reflects a genuine local physical coupling, one that would extend to γ-rays if we had sufficient resolution, or whether it is simply a spatial average of the emission, smoothed out by insufficient resolution. The answer determines whether radio and γ-ray emission can be used as reliable tracers of star formation, or whether they are just smeared out by cosmic-ray propagation over kiloparsec scales.

In this study, the authors numerically model galactic cosmic-ray transport, building a suite of physically motivated three-dimensional models of the Milky Way. They consider two variants for each of the four key inputs: 1) the cosmic-ray source distribution, 2) the interstellar gas, 3) the amount of starlight within the galaxy (the interstellar radiation field), and 4) the galactic magnetic field. Crucially, every model is normalized to reproduce the locally observed cosmic-ray data to within 5%, so that any differences in the predicted emission come purely from the large-scale geometry of each input, rather than from variations in the total cosmic-ray budget.

After evolving cosmic-ray transport for these realistic models, the authors then compute synthetic observations at radio, infrared, and γ-ray bands from various viewing inclinations to investigate how the underlying galactic model and the viewing angle affect the correlations between these emissions.

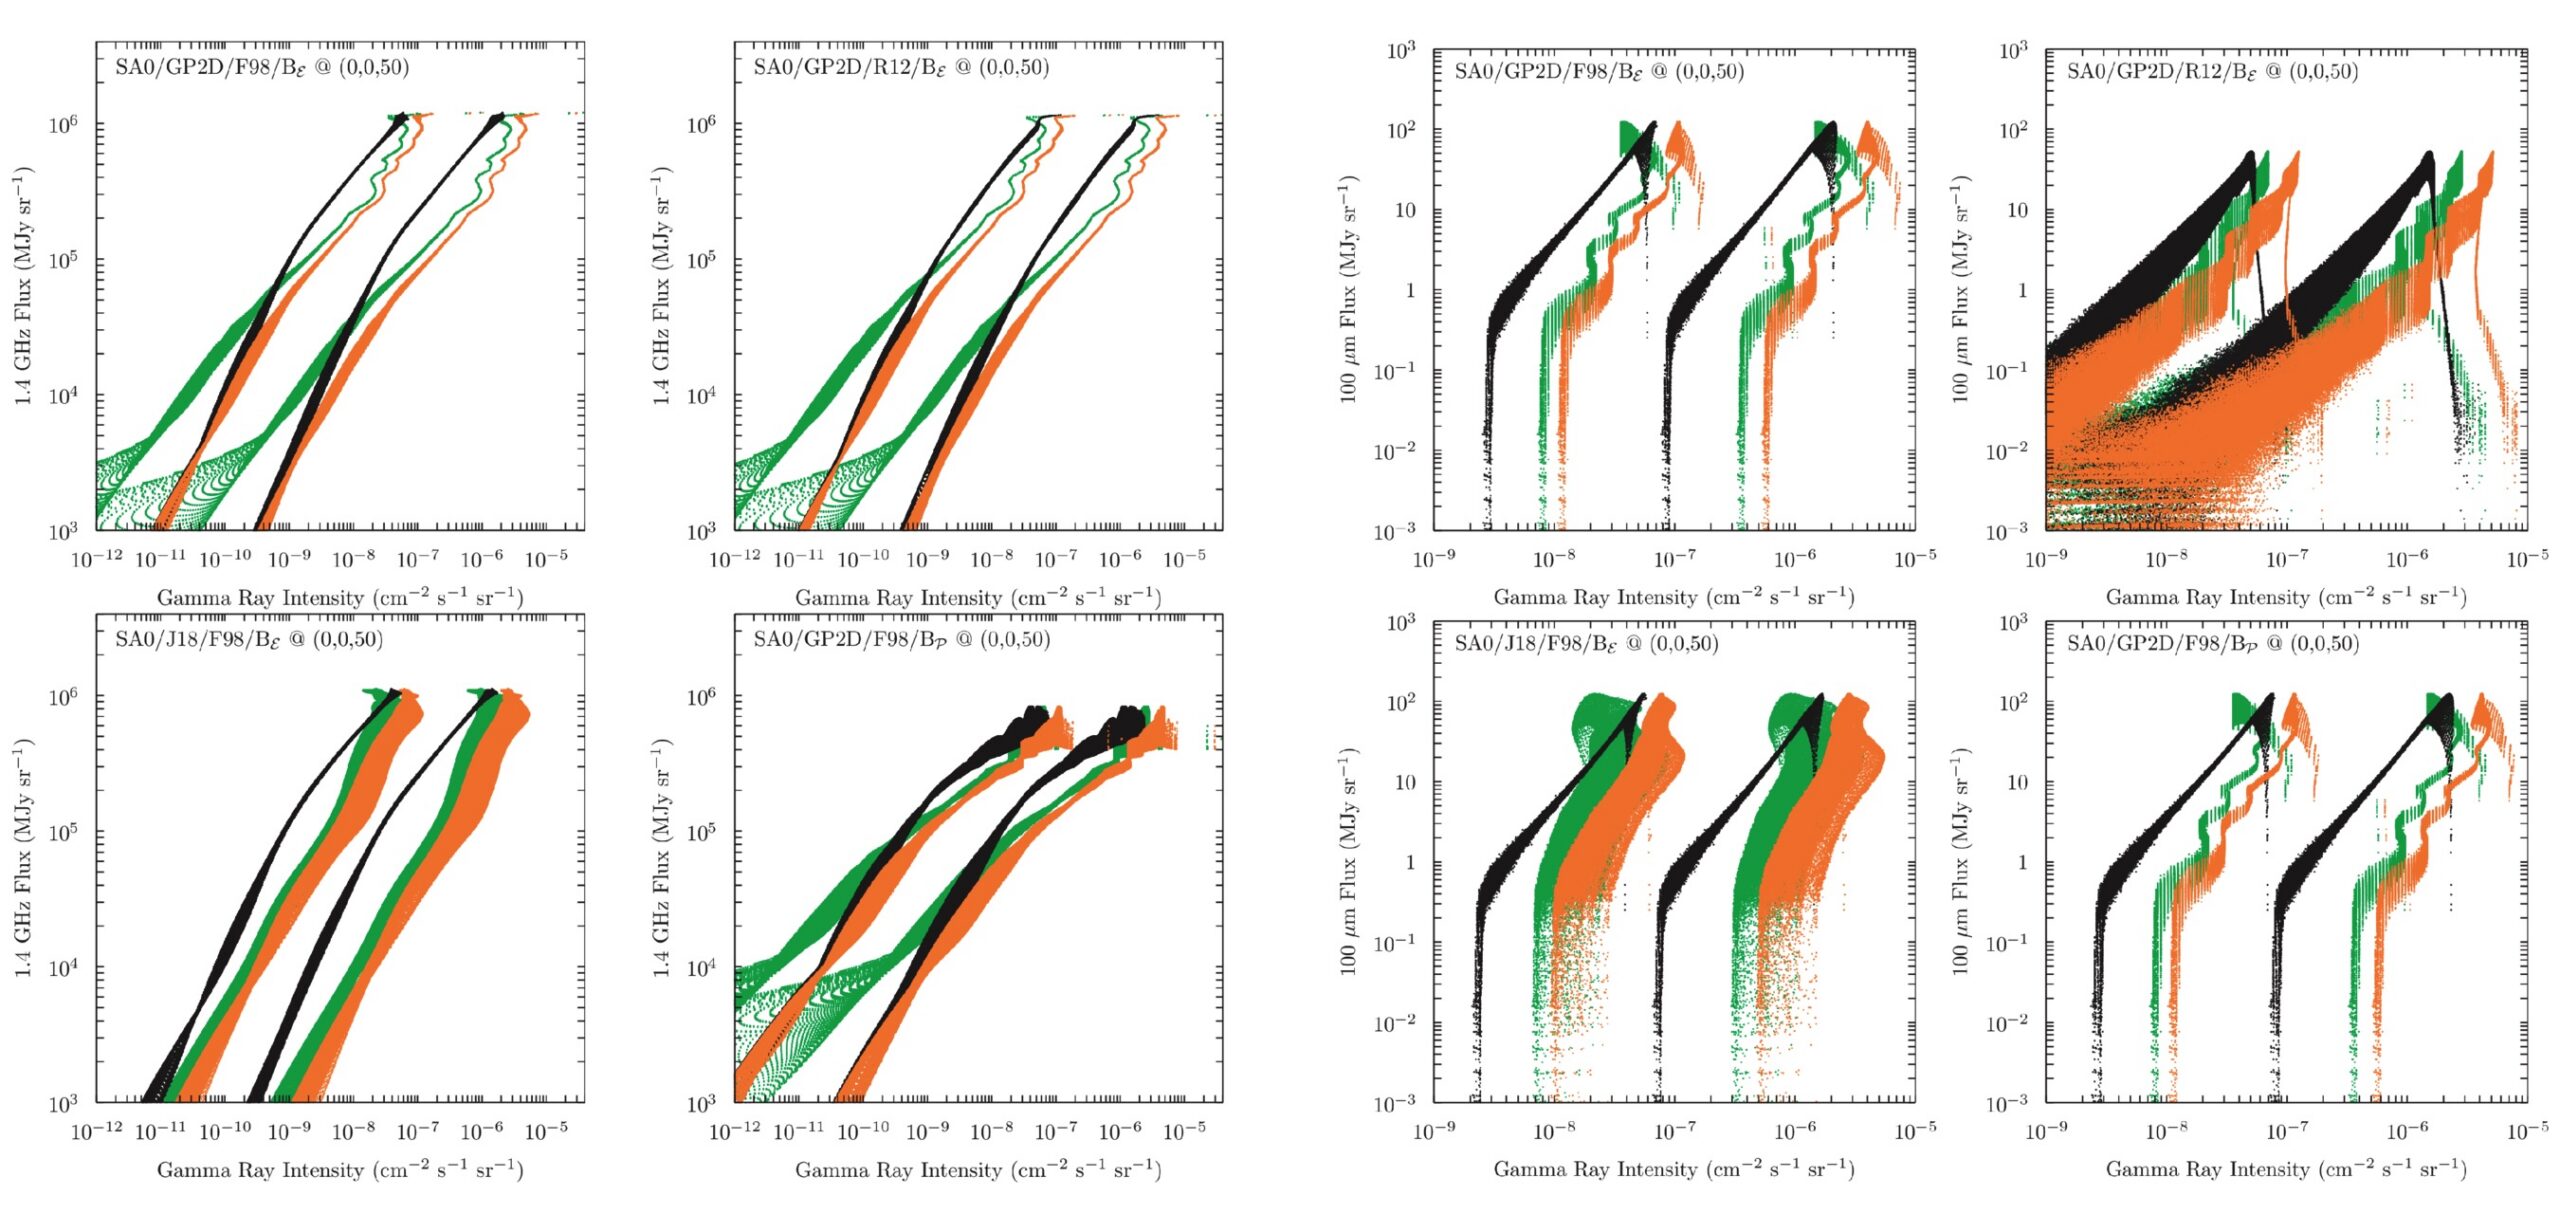
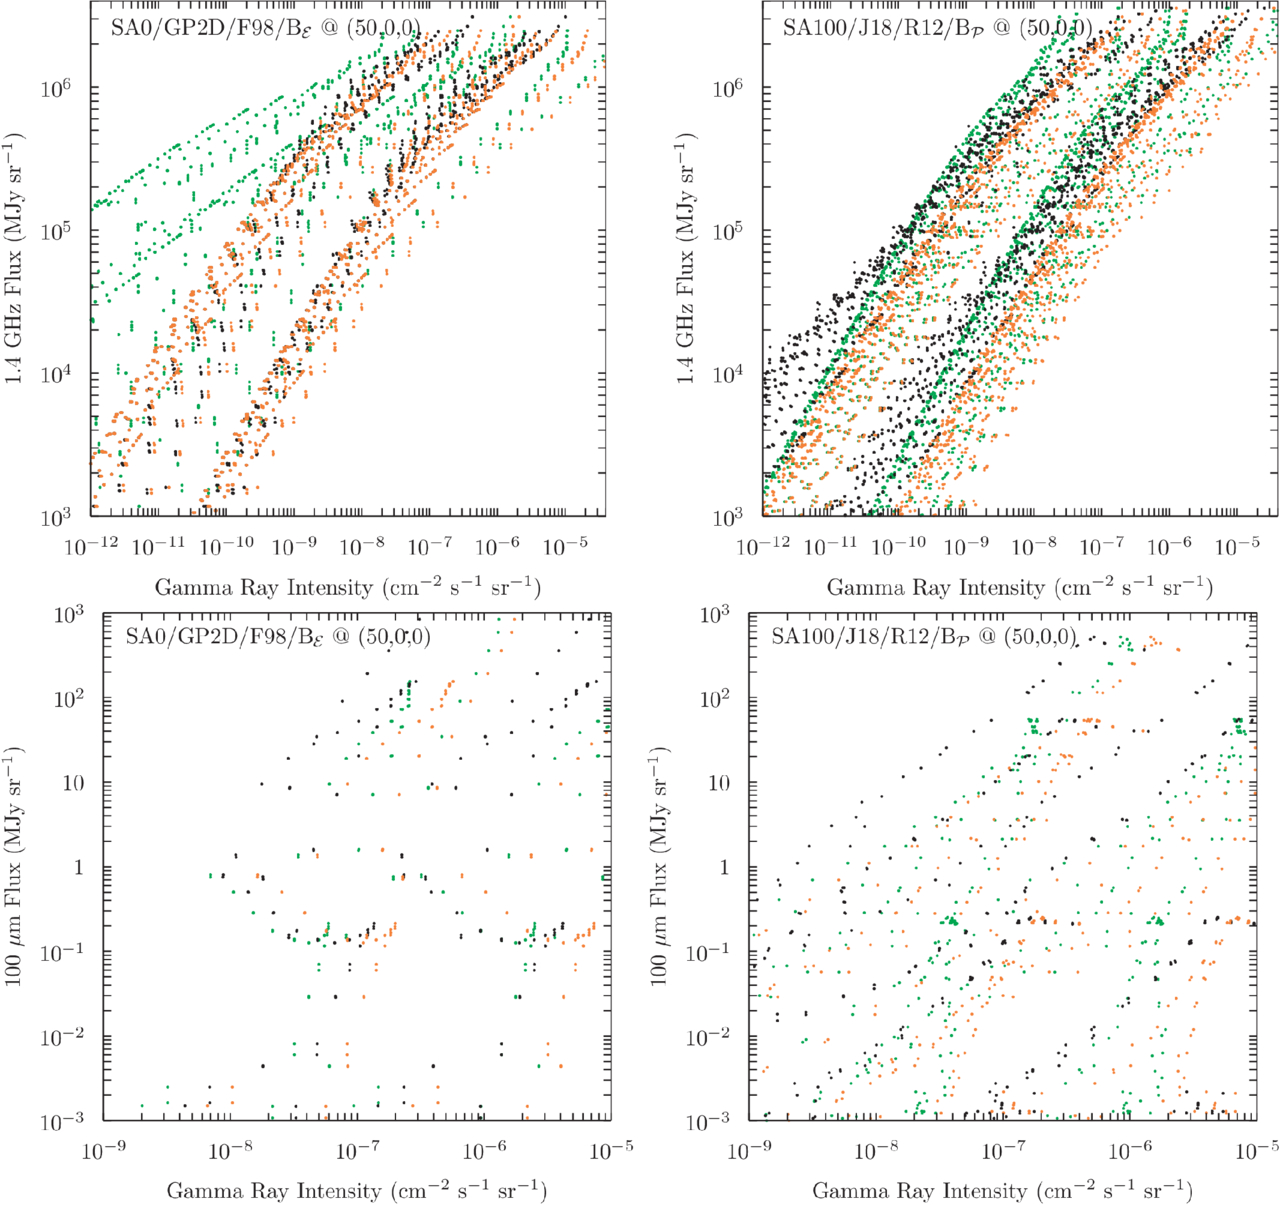
Surprisingly, inclination plays the most important role — more so than the cosmic-ray source distribution, the radiation field, or the magnetic field. Figure 1 shows the correlation plots between the radio and γ-ray emission (left two columns) and between infrared and γ-ray emission (right two columns) when viewing the galaxy face-on (i.e., viewing the galaxy from directly above the disk). Different colors represent γ-ray emission components from different physical mechanisms, with orange showing the total γ-ray emission. For both sets of correlation plots, starting from the upper-left panel, each panel modifies one physical input and recomputes the emission. Although there is some variation, one can see that the γ-ray emission correlates with both the radio and the infrared emission over several orders of magnitude, regardless of the underlying input model.

plots of radio and infrared flux versus gamma-ray intensity

Figure 1: Radio (left two columns) and infrared (right two columns) vs. γ-ray correlation plots for a galaxy viewed face-on from 50 kpc. Each panel modifies one input — the cosmic-ray source distribution, gas, radiation field within the galaxy, or magnetic field — relative to a baseline model. Colors indicate γ-ray production mechanisms (green: proton–gas; black: inverse-Compton; orange: total). Across all variations, both the radio–γ-ray and infrared–γ-ray correlations remain quasi-linear over several orders of magnitude, showing that the correlations are robust to the choice of underlying galactic model. [Adapted from Porter et al. 2026]

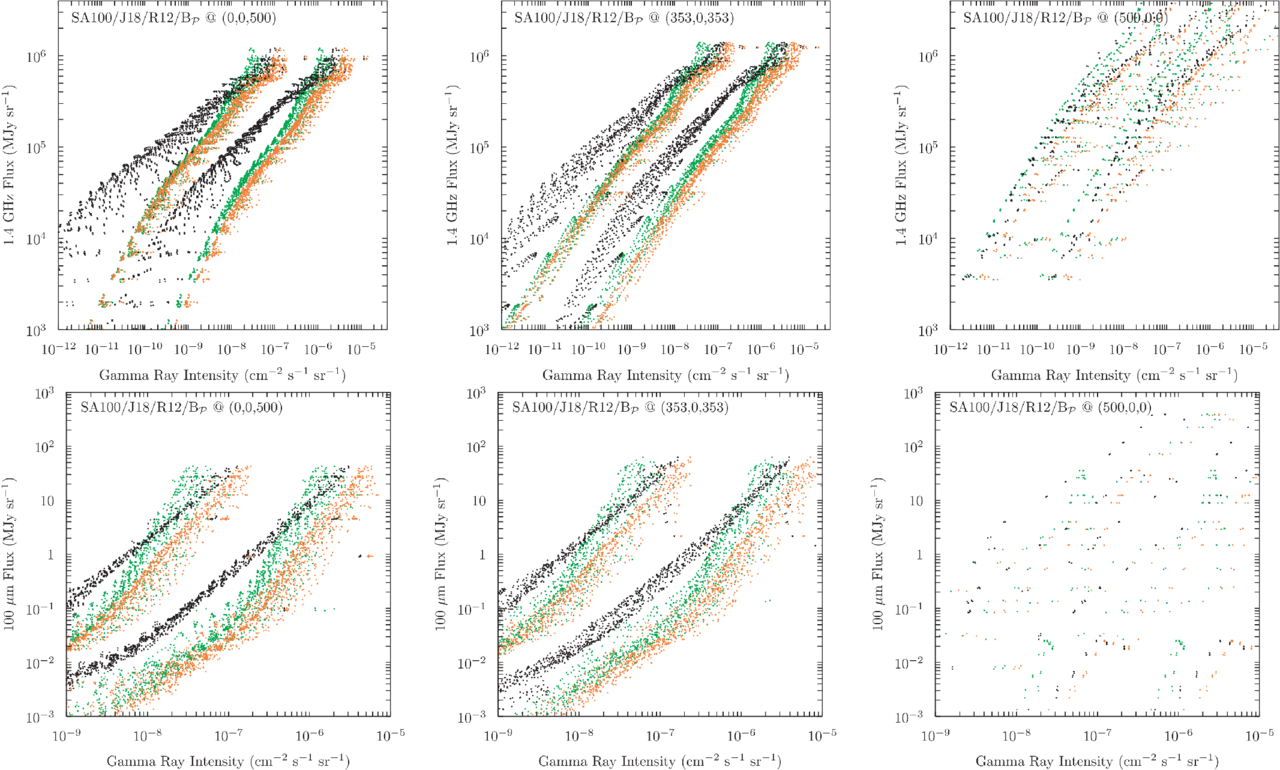
In contrast, Figure 2 shows the correlation plot between radio and γ-ray emission (upper panels) and between infrared and γ-ray emission (lower panels) when viewing the galaxy edge-on (viewing the disk from the side). The radio–γ-ray correlation is preserved, while the infrared–γ-ray correlation is no longer observed. This is because, at this inclination, geometric projection separates the emission components. Infrared-emitting dust and γ-ray emission from cosmic ray–interstellar medium interactions are confined to the disk, while synchrotron radio emission and γ-ray emission from inverse-Compton scattering extend to larger distances above and below the disk. As a result, in an edge-on view, a sight line passing through the disk sees strong infrared emission, while a sight line that misses the disk sees zero infrared but still some γ-ray emission, breaking the infrared–γ-ray correlation. On the other hand, because radio emission is more extended than infrared emission, sight lines that miss the disk can still see both radio and γ-ray emission together, preserving the radio–γ-ray correlation.
relationships between infrared, radio, and gamma-ray flux for two types of galaxy models

Figure 2: Correlation plots for two galaxy models viewed edge-on from 50 kpc — simple axisymmetric (left) and complex with spiral arms (right). Top: radio vs. γ-ray; bottom: infrared vs. γ-ray. Colors indicate γ-ray production mechanisms (green: proton–gas; black: inverse-Compton; orange: total). The infrared–γ-ray correlation breaks down, while the radio–γ-ray correlation is broadened but partially preserved. [Porter et al. 2026]

However, there is one situation where the edge-on correlation comes back: when the observer is far enough away that the image becomes too blurry to resolve the galaxy’s internal structure. Figure 3 shows the same galaxy model viewed from 500 kpc, roughly the distance to Messier 31, our nearest large neighbor. At this distance, a single pixel in the image covers about 1 kpc, large enough for everything along the line of sight. The messy, broken-up pattern seen in the closer 50 kpc edge-on view (lower-right panel of Fig. 2) disappears, and a tight, nearly linear correlation comes back. This explains why nearly all distant, unresolved galaxies show tight radio–infrared–γ-ray correlations: the tightness is simply what you get when you blur everything together, not evidence that cosmic rays are actually losing all their energy locally inside those galaxies.
relationships between infrared, radio, and gamma-ray flux for simulated galaxies viewed from 500 kiloparsecs

Figure 3: Correlation plots from a complex galaxy model viewed from 500 kpc, at three different inclinations (face-on, 45°, edge-on). Top row: radio vs. γ-ray; bottom row: infrared vs. γ-ray. Colors indicate different γ-ray production mechanisms (green: proton–gas; black: inverse-Compton; orange: total). At this distance, the blurring effect of large pixels restores a tight correlation even in the edge-on view. [Porter et al. 2026]

Now we have a consistent picture of the radio–infrared–γ-ray correlation: the authors conclude that this correlation is not a direct signature of cosmic-ray calorimetry, but a geometric projection effect. In face-on systems, a single sight line integrates emission from both the disk and off-disk regions, naturally producing a linear correlation, even when cosmic rays do not lose all their energy locally to radiation (i.e., local calorimetry is absent). In edge-on systems, the correlation breaks down because geometric stratification separates the different emission components. The practical implication is significant: for unresolved galaxies, the tightness of the global correlation alone cannot be used as evidence for cosmic-ray calorimetry, and the physically meaningful information about cosmic-ray transport and escape efficiency is encoded in the scatter around the mean trend, not in the correlation itself.

Original astrobite edited by Kelsie Taylor.

About the author, Sandy Chiu:

I’m a PhD candidate at the University of Michigan, Ann Arbor. I’m interested in numerical simulations of cosmic rays feedback in galaxies and their comparison with observation.

The post Do Galaxies Really Glow in Sync — or Are We Just Tilting Our Heads? appeared first on AAS Nova.

Finishing Off an Asteroid

7 August 2026 at 17:00

A rendering of a small star surrounded by a ring of gas and some larger asteroids.

Only one white dwarf star has ever been caught eating an asteroid. Recently, however, astronomers may have found another that just finished its meal.

Eating Asteroids

Although stars like our Sun don’t explode in violent supernovae like their massive counterparts, they don’t slink quietly into a peaceful old age either. When a solar-mass star reaches the end of its main sequence life, it first swells dramatically (the Sun may eventually grow so large that it consumes Earth and the device you’re reading this on), then shrinks down to a tiny but incredibly hot ember known as a white dwarf.

A rendering of an asteroid with large cracks and a tail of dust.

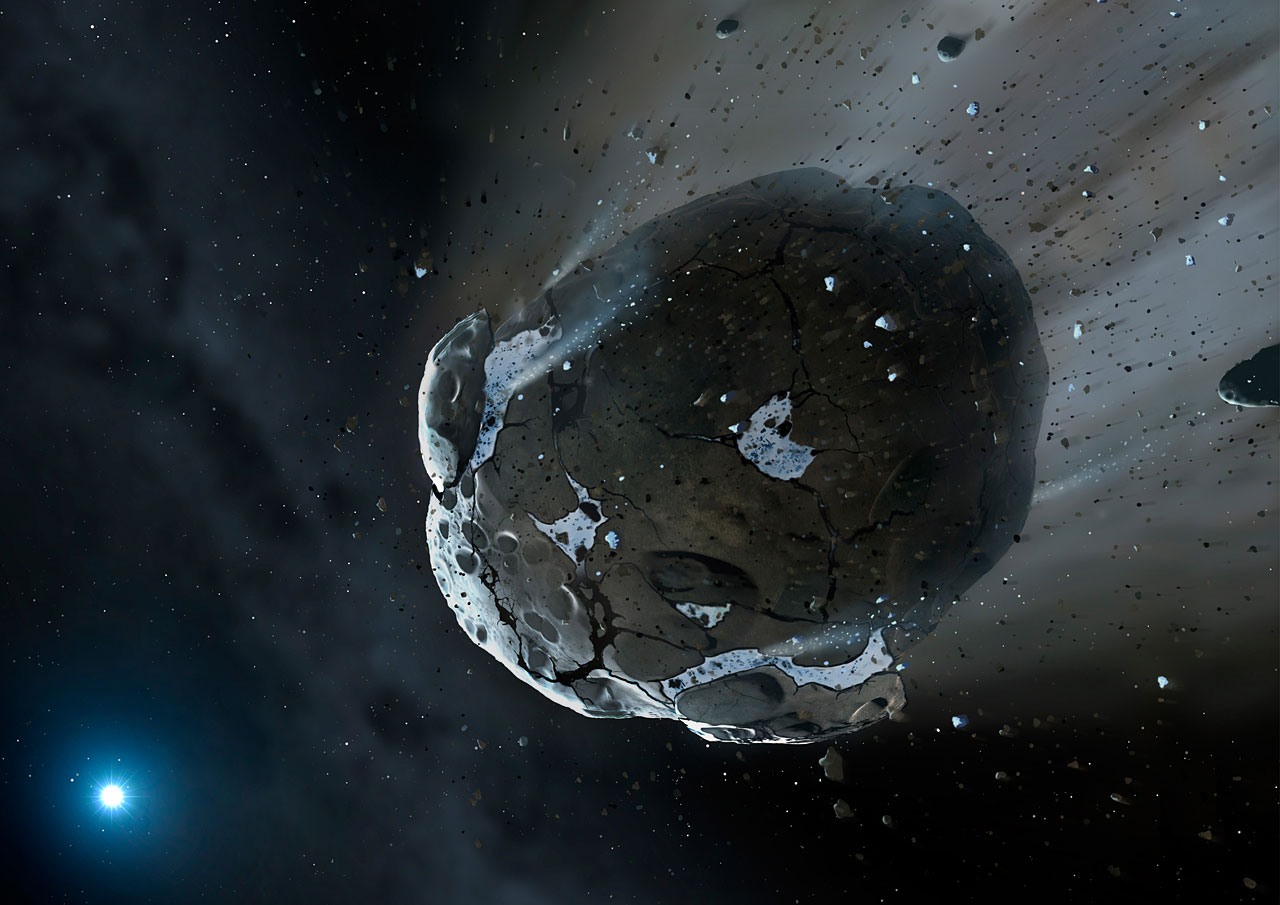
An artist’s impression of an asteroid breaking up near a white dwarf star. [NASA, ESA, M.A. Garlick (space-art.co.uk), University of Warwick, and University of Cambridge]

As one might imagine, this process is not kind to any planets or asteroids that were previously circling the star. While some might survive, others are sent spiraling inwards where they break apart and are accreted onto their hosts. Due to the extreme temperatures and surface gravity of white dwarfs, whatever falls on their surfaces is vaporized, sorted by weight, and quickly dragged out of sight. Since heavy elements cannot last long in a white dwarf’s atmosphere, whenever astronomers see their stains in the star’s spectrum, they know that the star must have recently consumed the rocky remains of their former asteroids and planets.

However, although researchers have found these stains in over a quarter of white dwarfs and consequently have reasoned that asteroid snacking must be common, they’ve only ever caught one star mid-meal. Recently, Ben Zuckerman (University of California, Los Angeles) and a team of collaborators may have found another, though it may have just finished dining.

Leftover Crumbs

A time vs. flux plot showing a flat trend.

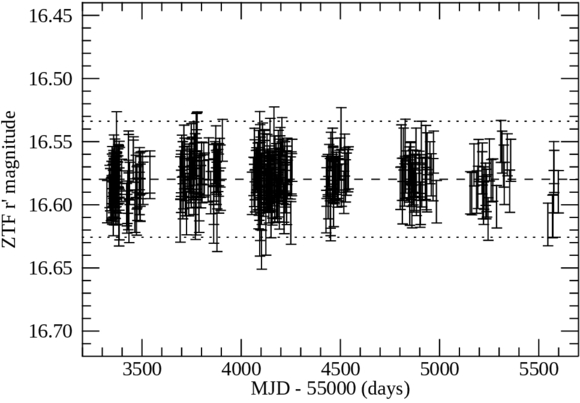
The light curve of WD J0234-0406 measured by the Zwicky Transient Facility. Unlike WD 1145+017, which frequently changes brightness, this white dwarf appears remarkably steady despite the high-velocity gas surrounding it. [B. Zuckerman et al. 2026]

This new star, called WD J0234-0406, shares some characteristics with the “iconic” WD 1145+017 that was first spotted mid-meal, but it also differs in an interesting way. High-resolution spectroscopy reveals that both stars have gaseous material orbiting around them along highly non-circular paths. These have been interpreted as “precessing rings of high velocity gas” that previously belonged to parent asteroids. However, while WD 1145+017 appears to flicker as bits of disintegrating asteroids pass between it and our line of sight, WD J0234-0406 is rock steady. Neither TESS nor the Zwicky Transient Facility have detected any dips in light from the star despite the evidence that solid material must have recently drizzled into the star’s atmosphere.

The researchers suggest that this relative quiet is a matter of timing. While asteroids are actively breaking up around WD 1145+017, the parent bodies that supplied the gas and dust around WD J0234-0406 may have shattered long ago and have already been either vaporized or ground down into smaller particles. All that is left over are the crumbs slowly spiraling toward the star.

Although WD J0234-0406’s meal may not be as dramatic as WD 1145+017’s feast, it’s still exciting to expand the sample of known white dwarf-asteroid interactions. And, with the upcoming release of data from the DESI survey poised to reveal the spectra of tens of thousands of white dwarfs, the sample is likely to grow again soon.

Citation

“High-velocity Circumstellar Gas Orbiting a White Dwarf Star,” B. Zuckerman et al 2026 ApJ 1004 254. doi:10.3847/1538-4357/ae23c4

The post Finishing Off an Asteroid appeared first on AAS Nova.

Diving into the Darkest Corners of the Universe with Fast Radio Bursts

5 August 2026 at 18:25

The cosmic web

Even the darkest corners of the universe are not completely empty. A recent study has used fast radio bursts to provide the first estimate of the baryon content in cosmic voids.

What’s in a Void?

Cosmological studies have revealed the large-scale filamentary structure of the universe known as the cosmic web. Chains of galaxies and galaxy clusters fall into spindly strands (or filaments) of matter overdensities, opening up cavernous cosmic voids that comprise the darkest corners of the universe. These seemingly vacant voids serve as critical test beds for cosmology, allowing researchers to constrain things like the nature of dark energy and the matter density of the universe.

Despite their name, voids are not completely empty but are instead underdensities with considerably less matter compared to the bustling filaments they border. The baryon (normal matter) content of cosmic voids has important implications for cosmological models and large-scale galactic feedback processes, but assessing how many baryons actually occupy voids has only recently become observationally accessible.

FRB and void sky maps

Sky maps centered on the north celestial pole showing the CHIME fast radio burst sample (top) and the SDSS void catalog (bottom). [Sharma et al 2026]

Fast radio bursts — brief, intense flashes of radio waves emitted by compact objects — have proven to be versatile tools for measuring both underdensities and overdensities throughout the universe. The dispersion measure of fast radio bursts, which tells us how many free electrons fall between the radio emitter and observer, can be directly used to map the baryon content along the lines of sight. Fast radio burst sight lines passing through overdensities will produce a dispersion measure excess, and those passing through underdensities will produce a dispersion measure deficit relative to the cosmic mean. Thus far, fast radio bursts have been used extensively to study overdense galaxy and cluster filaments, but their sensitivity to underdense regions like voids has yet to be explored.

Chiming In on the Baryon Search

In concept, directly stacking fast radio burst sight lines that coincide with the positions of known cosmic voids provides a direct measurement of the baryon underdensity inside voids. With no previous observational exploration of this quantity, Kritti Sharma (California Institute of Technology) and collaborators leveraged the second catalog of the Canadian Hydrogen Intensity Mapping Experiment Fast Radio Bursts (CHIME/FRB) sample in conjunction with the Sloan Digital Sky Survey (SDSS) Baryon Oscillation Spectroscopic Survey (BOSS) void catalog to provide the first observational assessment of the baryon underdensity in cosmic voids.

Anticorrelations between FRB dispersion measures and void positions

Anticorrelations between fast radio burst dispersion measures and void positions. There is a clear dispersion measure deficit closer to voids centers. [Sharma et al 2026]

Stacking thousands of fast radio burst sight lines that spatially align with thousands of known voids, the authors measured a statistically significant dispersion measure deficit toward void centers. This deficit indicates that, as theory predicts, baryons inhabit cosmic voids at a suppressed level. The team used cosmological models to quantify the electron density contrast between the interior and exterior of voids, finding an approximate baryon underdensity of 60% ± 30% relative to the cosmic mean. Combining this result with existing thermal scattering measurements of the cosmic microwave background, the authors estimated a mean void gas temperature of about 1.1 million kelvin — voids are occupied by a suppressed amount of warm-hot diffuse gas.

This study provides a unique approach to baryon mapping and opens up the door for future investigation of cosmic voids. While not physically containing much, voids hold vast astrophysical and cosmological significance. With the astronomical stage primed with galaxy-mapping powerhouses like the Dark Energy Spectroscopic Instrument, Vera Rubin Observatory, Nancy Grace Roman Space Telescope, and Euclid Space Telescope, cosmic voids will become a cornerstone of cosmological studies.

Citation

“Baryons in the Darkest Sites of the Universe,” Kritti Sharma et al 2026 ApJL 1006 L3. doi:10.3847/2041-8213/ae81ac

The post Diving into the Darkest Corners of the Universe with Fast Radio Bursts appeared first on AAS Nova.

EXCELlent Work, Detectives! Solving the Murder of Star Formation in Galaxies with JWST

4 August 2026 at 17:00

Arp 142

Editor’s Note: Astrobites is a graduate-student-run organization that digests astrophysical literature for undergraduate students. As part of the partnership between the AAS and astrobites, we occasionally repost astrobites content here at AAS Nova. We hope you enjoy this post from astrobites; the original can be viewed at astrobites.org.

Title: The JWST EXCELS Survey: Insights into the Nature of Quenching at Cosmic Noon
Authors: Maya Skarbinski et al.
First Author’s Institution: Johns Hopkins University
Status: Published in ApJ

How to Quench a Galaxy

Look at an image of the sky taken with a sufficiently sensitive telescope, and you’ll quickly notice that galaxies tend to cluster into two main types: blue spiral galaxies, which have flat disk shapes with a central bulge, and red elliptical galaxies, which look like spherical or elliptical balls of red stars. Blue spiral galaxies can form tens to hundreds of stars every year, while elliptical galaxies have completely stopped forming stars, meaning that some process has to transform star-forming spirals into non-star-forming, or “quiescent,” elliptical galaxies. To form the current population of massive elliptical galaxies, this process had to be common about 2–3 billion years after the Big Bang at “cosmic noon,” the period when star formation in the universe peaked. The processes that “quench” star formation in massive galaxies are still being studied, and one of the best ways to study them is to find galaxies that recently quenched and look for clues about the processes that quenched them.

Post-starburst galaxies are galaxies that have rapidly quenched after a short burst of star formation. Because these galaxies quenched so quickly and so recently, it’s often possible to find signs of whatever quenched them, like the signatures of past galaxy mergers, feedback from supermassive black hole accretion, or the shutoff of gas flowing into the galaxy. Rapid quenching is pretty uncommon now, but it was a much more common way for galaxies to quench at cosmic noon. Understanding post-starburst galaxies at cosmic noon is therefore critical for understanding the formation of massive elliptical galaxies in the local universe.

The Quest for Quenched Galaxies

Today’s article uses data from the JWST Early eXtragalactic Continuum and Emission Line Survey (EXCELS) to identify post-starburst galaxies at cosmic noon and try to determine why they quenched. EXCELS is a spectroscopic survey, so the authors get a spectrum for every galaxy. The spectrum encodes information about the galaxy’s stellar population, including the mass of stars in the galaxy, the number of stars forming every year, and the history of star formation throughout the galaxy’s life.

The authors use a technique called principal component analysis to further divide the sample into young and old post-starbursts. Principal component analysis is a machine-learning technique that learns the most important features of a data set. This technique is used for “dimension reduction,” or reducing the number of data points needed to learn something about the object. A typical spectrum has hundreds or even thousands of data points, which means performing data analysis on a spectrum can be very computationally expensive. Principal component analysis takes these thousands of data points and learns broad patterns that correlate with each other. These patterns are called “supercolors” in the context of spectral data, and they encode things like the overall shape and color of the spectrum as well as the spectral shape around key features (see Figure 1 for a visualization). Since the overall shape, color, and emission/absorption line features of a spectrum come from the galaxy’s stellar population, this method can be used to identify galaxies with lots of star formation a billion years ago but very little star formation today — in other words, post-starburst galaxies.

demonstration of principal component analysis for spectra of different types of galaxies

Figure 1: An example of principal component analysis for sample star-forming (SF), quiescent (Qu), and post-starburst (PSB) galaxy spectra (left-hand side). Principal component analysis simplifies a many-dimensional data set (for example, spectra) into fewer dimensions. In this case, Super-Color 1 measures the overall color of the spectrum (shown on the left-hand side as the slope of the spectra, marked with red lines), while Super-Color 2 measures the shape of the spectrum around 4,000 angstroms (orange box). The authors use principal component analysis to identify post-starburst galaxies for further analysis (right-hand side). [Adapted from Skarbinski et al. 2026]

The authors apply principal component analysis to the galaxies in their sample and find that 11 of the galaxies in their sample are classified as post-starburst, 9 are quiescent, and 4 still have some star formation. To further analyze the stellar populations of the post-starbursts in their sample, the authors use a program called Bagpipes to fit the galaxies’ spectra. Bagpipes is a spectral energy distribution fitting software, which means that it takes the observed spectrum of a real galaxy and tries to match it to a library of different stellar spectra. By measuring the relative contribution of different kinds of stars (which all have different lifetimes), Bagpipes can compute the likely history of star formation in the galaxy (e.g., when the star formation rate peaked) as well as the present-day properties of the galaxy (things like the mass in stars versus dust and the current star formation rate). The authors use the galaxies’ star formation histories to try to find clues as to how they quenched.

How Quickly Do Post-Starbursts Quench?

First, the authors measure something called a “quenching timescale,” which they define as the length of time between when the galaxy’s star formation rate peaked and when it fell low enough that the galaxy was quenched. The quenching timescale depends on which process shut down star formation in the galaxy — feedback from black hole accretion or star formation should cause fast quenching, while galaxies that are starved of gas from the intergalactic medium should quench more slowly. The authors find that 15 of their galaxies quenched in under 500 million years, 6 took between 500 million and 1 billion years, and 3 took longer than 1 billion years to quench. The galaxies that had the highest peak star formation rates quenched the fastest, suggesting that feedback from star formation could have played a role in quenching these galaxies.

plots showing possible evolutionary tracks for two example galaxies

Figure 2: Possible evolutionary tracks in supercolor for two example galaxies as they quench. The galaxy in the top panel quenches quickly and has post-starburst supercolors for about a billion years, while the galaxy in the bottom panel quenches without ever going through the post-starburst phase. The authors use these tracks to determine how important the post-starburst phase is for quenching massive galaxies. [Skarbinski et al. 2026]

Next, the authors measure how important the post-starburst phase is to form massive quiescent galaxies. Not all galaxies that quench go through a post-starburst phase; some objects, especially those that quench slowly, will transition directly from star forming to quiescent. The authors use the star formation histories from their spectral energy distribution fits to predict how the galaxies’ supercolors changed after their star formation peaked (Figure 2) and find that six of the nine quiescent galaxies went through a post-starburst phase in the past, while the other three did not. For the objects that went through a post-starburst phase, the median time spent as a post-starburst was around 600 million years.The authors can use this measured “visibility timescale” to constrain whether the post-starburst phase is important for forming massive quiescent galaxies. If the fraction of post-starburst galaxies in a sample is high, that can be for two reasons: either a larger fraction of galaxies will eventually go through a post-starburst phase, or the post-starburst phase is very long, making it easy to find post-starburst galaxies. Using the measured timescale of 600 million years and combining with results from another article, the authors find that 40% of quiescent galaxies likely went through a post-starburst phase; for the more massive end of the sample, this fraction increases to around 73% due to the shorter visibility timescale. This suggests that the post-starburst phase is very important for forming the kind of massive quiescent galaxies we see in the local universe.

While the post-starburst phase is important, the different quenching timescales present across the sample suggest that multiple pathways existed to quench galaxies at cosmic noon, similar to what has been found in less-distant galaxies and at cosmic noon in other samples. This is also supported by the fact that four of the five galaxies with sufficient data show evidence of an actively accreting supermassive black hole that may help shut down star formation in many (but perhaps not all) massive galaxies. While the precise processes that quench massive galaxies are still uncertain, one thing is clear: JWST EXCELS at solving the mystery!

Original astrobite edited by Anavi Uppal.

About the author, Margaret Verrico:

I am a fourth-year graduate student at the University of Illinois Urbana-Champaign. I study the connection between supermassive black hole transients and their host galaxies. I am also an avid knitter and reader, and I am passionate about opening up STEM opportunities for people of all backgrounds.

The post EXCELlent Work, Detectives! Solving the Murder of Star Formation in Galaxies with JWST appeared first on AAS Nova.

Featured Image: Citizen Science and Solar Structure

3 August 2026 at 17:00

solar corona during a solar eclipse

During the 8 April 2024 solar eclipse, the path of totality swept across North America, dazzling millions of skygazers. Scattered along this path were 82 viewing sites of the Dynamic Eclipse Broadcast Initiative citizen science project, which aimed to observe the dynamics of the tenuous solar corona. Though poor weather dashed many observers’ hopes, the project managed to collect data at 11 sites spanning 2,700 kilometers, capturing 49 minutes of coronal behavior. The image above shows the solar corona as seen during totality from one of the DEB Initiative sites. In a recent research article, Matthew J. Penn (Southern Illinois University Carbondale; Tucson Amateur Astronomy Association) and collaborators described the results of the Initiative’s viewing efforts, including identification of downflows and outflows, plumes, coronal loops, and apparent motion of background stars. To learn more about these observations of the solar corona, be sure to check out the full article linked below.

Citation

“Structure and Dynamics of the Inner Corona Measured from the DEB Initiative 2024 Eclipse Image Sequence,” Matthew J Penn et al 2026 ApJL 1006 L25. doi:10.3847/2041-8213/ae8797

The post Featured Image: Citizen Science and Solar Structure appeared first on AAS Nova.

Spying on a Split Comet

31 July 2026 at 17:00

240P

Traversing through the solar system, a comet split in two, and a recent study used six months of observations to investigate when and why.

A Split Comet

Orbit map

Orbital path of 240P/NEAT (purple) and the position of the comet on 30 July 2026 (light blue teardrop). Click to enlarge. [TheSkyLive]

While we often think of comets as icy remnants of the solar system’s formation that populate the Kuiper Belt and Oort Cloud, some comets make their homes closer to the Sun. One such class, known as Jupiter-family comets, traveled from the Kuiper Belt to short orbital periods (less than 20 years) whose paths through the solar system are shaped by Jupiter’s gravity. Discovered in 2002, 240P/NEAT is a Jupiter-family comet that loops between Jupiter and Mars on a 7.6-year orbit. Making close approaches to Jupiter, 240P experiences frequent, strong interactions with the gas giant that can alter the comet’s orbit and cause sudden bursts in brightness as ice and dust are heated and outgassed from the comet’s surface.

Most recently, 240P swept closest to Jupiter in July 2007, shifting the comet’s perihelion distance (closest approach to the Sun) from 2.5 to 2.1 au, and several long-lived bursts in brightness in 2018/2019 could have been spurred by this orbital shift. Excitingly, a fainter comoving object, 240P-B, was first reported in June 2025 as the comet headed toward perihelion — at some point recently, 240P had split in two!

Over the last century, numerous split comets have been recorded, but detailed physical studies of these objects are rare. With growing evidence suggesting splitting and disintegration are the primary mechanisms of comet destruction, understanding the properties and cause of 240P’s split is imperative.

Observing 240P

With 240P on the move to perihelion, David Jewitt (University of California, Los Angeles) and collaborators monitored the comet from October 2025 to April 2026 to establish the likely cause of its split. Employing the Alhambra Faint Object Spectrograph and Camera on the 2.56-meter Nordic Optical Telescope, the authors obtained detailed imaging of the comet from two months before to four months after perihelion to characterize both components.

Tracking both photometric and morphological changes across their observations, the authors estimated the dust-loss rates, physical sizes, and separation speed of 240P-A and 240P-B. The brighter component, 240P-A, has an estimated radius between 400 and 600 meters and a dust-loss rate almost four times higher than 240P-B. Because 240P-B is fainter, its radius is harder to constrain observationally. From its lower dust-loss rate and lower brightness, the authors estimated a radius around 300 meters (and no smaller than 50). Based on how the separation of the two comet pieces changes over time, the authors determined that the split of 240P occurred at least three years before their observations.

dust mass-loss

Dust mass-loss rates for 240P-A (green circles) and 240P-B (yellow diamonds) over the course of the observations. Both components peak shortly before perihelion (dashed vertical line). Click to enlarge. [Jewitt et al 2026]

Source of the Split

How exactly did this fragmented comet get this way? The authors considered a number of comet-splitting mechanisms: tidal forces, asteroid impact, pressure buildup below the comet’s surface, thermal stresses, and rotational instability. Given the comet’s orbit, it has not had close enough encounters with the Sun or other planets for tidal forces to be the culprit, and it traverses well above the asteroid belt, avoiding collisions. Pressure buildup and thermal stresses can fracture comets, but both are unlikely to launch such a large fragment as seen in this system.

This leaves rotational instability as the likely source of 240P’s split. Outgassing torques lead to rotational instability, especially in subkilometer comets like 240P, and 240P has exhibited recent outgassing. In addition, the separation speed between the 240P components is comparable to the escape speed of the primary comet, which is expected for rotational breakup. To confirm this hypothesis, future observations measuring the rotation period of 240P are necessary, but this study adds to the small number of split-comet observations that aid in understanding comet destruction.

Citation

“Investigation of Split Comet 240P/NEAT,” David Jewitt et al AJ 172 113. doi:10.3847/1538-3881/ae83ac

The post Spying on a Split Comet appeared first on AAS Nova.

Monthly Roundup: The Fourth Catalog of Gravitational Wave Events from LIGO, Virgo, and KAGRA

29 July 2026 at 17:00

Illustration of gravitational waves emanating from a pair of black holes approaching a merger

A recent Focus Issue of the Astrophysical Journal Letters describes the fourth version of the catalog of gravitational wave events (GWTC-4.0) from the Laser Interferometer Gravitational Wave Observatory (LIGO), the Virgo interferometer, and the Kamioka Gravitational Wave Detector (KAGRA).

This catalog contains transient gravitational wave events recorded through January 2024, during the observatories’ fourth observing run, which concluded in November 2025. GWTC-4.0 displays the results of significant improvements to our suite of gravitational wave detectors, including higher-powered lasers and reduced quantum noise. A fifth catalog of gravitational wave events was released in Spring 2026, with the accompanying scientific articles being submitted to the Astrophysical Journal and the Astrophysical Journal Letters.

This Monthly Roundup consists of short descriptions of each of the currently published research articles in the LIGO–Virgo–KAGRA Gravitational Wave Transient Catalog (GWTC): Release 4 Focus Issue. Each snippet links to the corresponding research article, and the Focus Issue landing page is linked at the bottom of this post. Be sure to revisit the landing page to catch new articles as they’re published!

Introducing GWTC-4.0

timeline of gravitational wave observatories' observing runs

A timeline showing observing runs between 2015 and 2024. Click to enlarge. [LVK Collaboration 2025]

First up, the collaboration orients the reader to many important aspects of the catalog and the articles contained in the Focus Issue. This article describes how four detectors, each with two arms 3–4 kilometers long, monitor gravitational waves from Hanford, Washington; Livingston, Louisiana; Santo Stefano a Macerata, Italy; and Hida, Japan. These detectors work in concert, ready to receive signals from the universe during coordinated observing runs separated by periods of downtime for construction and commissioning. During these pauses, a smaller instrument, the German–British GEO600 gravitational wave detector, has kept an ear out for signals and will continue to do so until the end of 2026.

After these detectors record subtle spacetime squiggles from compact objects colliding millions to billions of light-years away, the collaboration converts the raw signals into the data contained in catalogs like GWTC-4.0. This process involves modeling the gravitational wave signals, filtering them to identify candidate transients, and pinpointing the most significant events.

After collecting and cleaning the signals, the collaboration undertakes a critical step: making their data accessible to researchers and the public. The data are available through the Gravitational Wave Open Science Center, and the Focus Issue article on open data describes how to navigate the online portal, how the datasets archived online are structured, and how the data were calibrated.

Science Results

This fourth version of the gravitational wave transient catalog greatly expands the sample of gravitational wave transients recorded by detectors across the globe. Including events from previous catalogs, GWTC-4.0 brings us to 218 events for which the probability of the source being astrophysical in nature is more than 50% and for which there is little chance of the signal being an instrumental artifact. This represents a more than 100% increase in the number of recorded gravitational wave events fulfilling this criterion, broadening our understanding of colliding compact object pairs. This release also includes some superlative signals, such as the most massive black hole binary with a low false-alarm rate and the highest signal-to-noise ratio for a gravitational wave event thus far.

Detected in November 2023 by both LIGO Hanford and LIGO Livingston, GW231123 is in many ways an exceptional gravitational wave transient. The total mass of the merging components appears to be between 190 and 265 solar masses, and the false-alarm rate for this signal is less than one per year. This makes it the most massive merger event with such a low false-alarm probability. The two components also appear to have high spins, which complicates the interpretation of the signal with existing models. A binary black hole merger in which one or more components lies within the pair-instability mass gap is the likeliest explanation for this signal, but the authors also present alternative scenarios, such as a core-collapse supernova or a gravitationally lensed gravitational wave signal.

GW230814 gravitational wave signal

Representations of the GW230814 gravitational wave signal. Click to enlarge. [LVK Collaboration 2026]

GW230814, which was detected only by LIGO Livingston, is the loudest signal in the catalog. This signal is consistent with the collision of two black holes, each of roughly 30 solar masses. During the analysis of this signal, the team discovered potential deviations from the predictions of general relativity in the ringdown phase, when the remnant black hole settles into its final shape. Without a detection from another facility to corroborate this finding, it’s difficult to pinpoint the cause of the deviation, but the team could not rule out statistical noise fluctuations as the source.
Plot of the differential merger rate

Plot of the differential merger rate as a function of the mass of the more massive of the two merger components. This shows overdensities at 10, 35, and possibly 20 solar masses. Click to enlarge. [LVK Collaboration 2026]

Surveying merging black holes and neutron stars on the population level, the team analyzed 158 gravitational wave signals from the current catalog. This analysis supported findings from previous transient catalogs, including multiple overdensities in the distribution of merging black hole masses, broadly distributed neutron star masses, and an increase in the merger rate with redshift. The new data strengthened certain previously identified trends, such as an increase in the width of the effective spin distribution with redshift, and weakened others.

The full list of articles in the GWTC-4.0 Focus Issue can be found here.

Citation

“GWTC-4.0: An Introduction to Version 4.0 of the Gravitational-Wave Transient Catalog,” A. G. Abac et al 2025 ApJL 995 L18. doi:10.3847/2041-8213/ae0c06

“GWTC-4.0: Methods for Identifying and Characterizing Gravitational-Wave Transients,” A. G. Abac et al 2026 ApJL 1004 L21. doi:10.3847/2041-8213/ae447b

“Open Data from LIGO, Virgo, and KAGRA Through the First Part of the Fourth Observing Run,” A. G. Abac et al 2026 ApJ 1004 232. doi:10.3847/1538-4357/ae211e

“GWTC-4.0: Updating the Gravitational-Wave Transient Catalog with Observations from the First Part of the Fourth LIGO–Virgo–KAGRA Observing Run,” A. G. Abac et al 2026 ApJL 1004 L22. doi:10.3847/2041-8213/ae2c74

“GW231123: A Binary Black Hole Merger with Total Mass 190–265 M⊙,” A. G. Abac et al 2025 ApJL993 L25. doi:10.3847/2041-8213/ae0c9c

“GW230814: Investigation of a Loud Gravitational-Wave Signal Observed with a Single Detector,” A. G. Abac et al 2026 ApJL 1004 L23. doi:10.3847/2041-8213/ae2ad3

“GWTC-4.0: Population Properties of Merging Compact Binaries,” A. G. Abac et al 2026 ApJL 1005 L51. doi:10.3847/2041-8213/ae771e

The post Monthly Roundup: The Fourth Catalog of Gravitational Wave Events from LIGO, Virgo, and KAGRA appeared first on AAS Nova.

❌