❌

Normal view

Black Eye Galaxy

12 June 2026 at 14:59
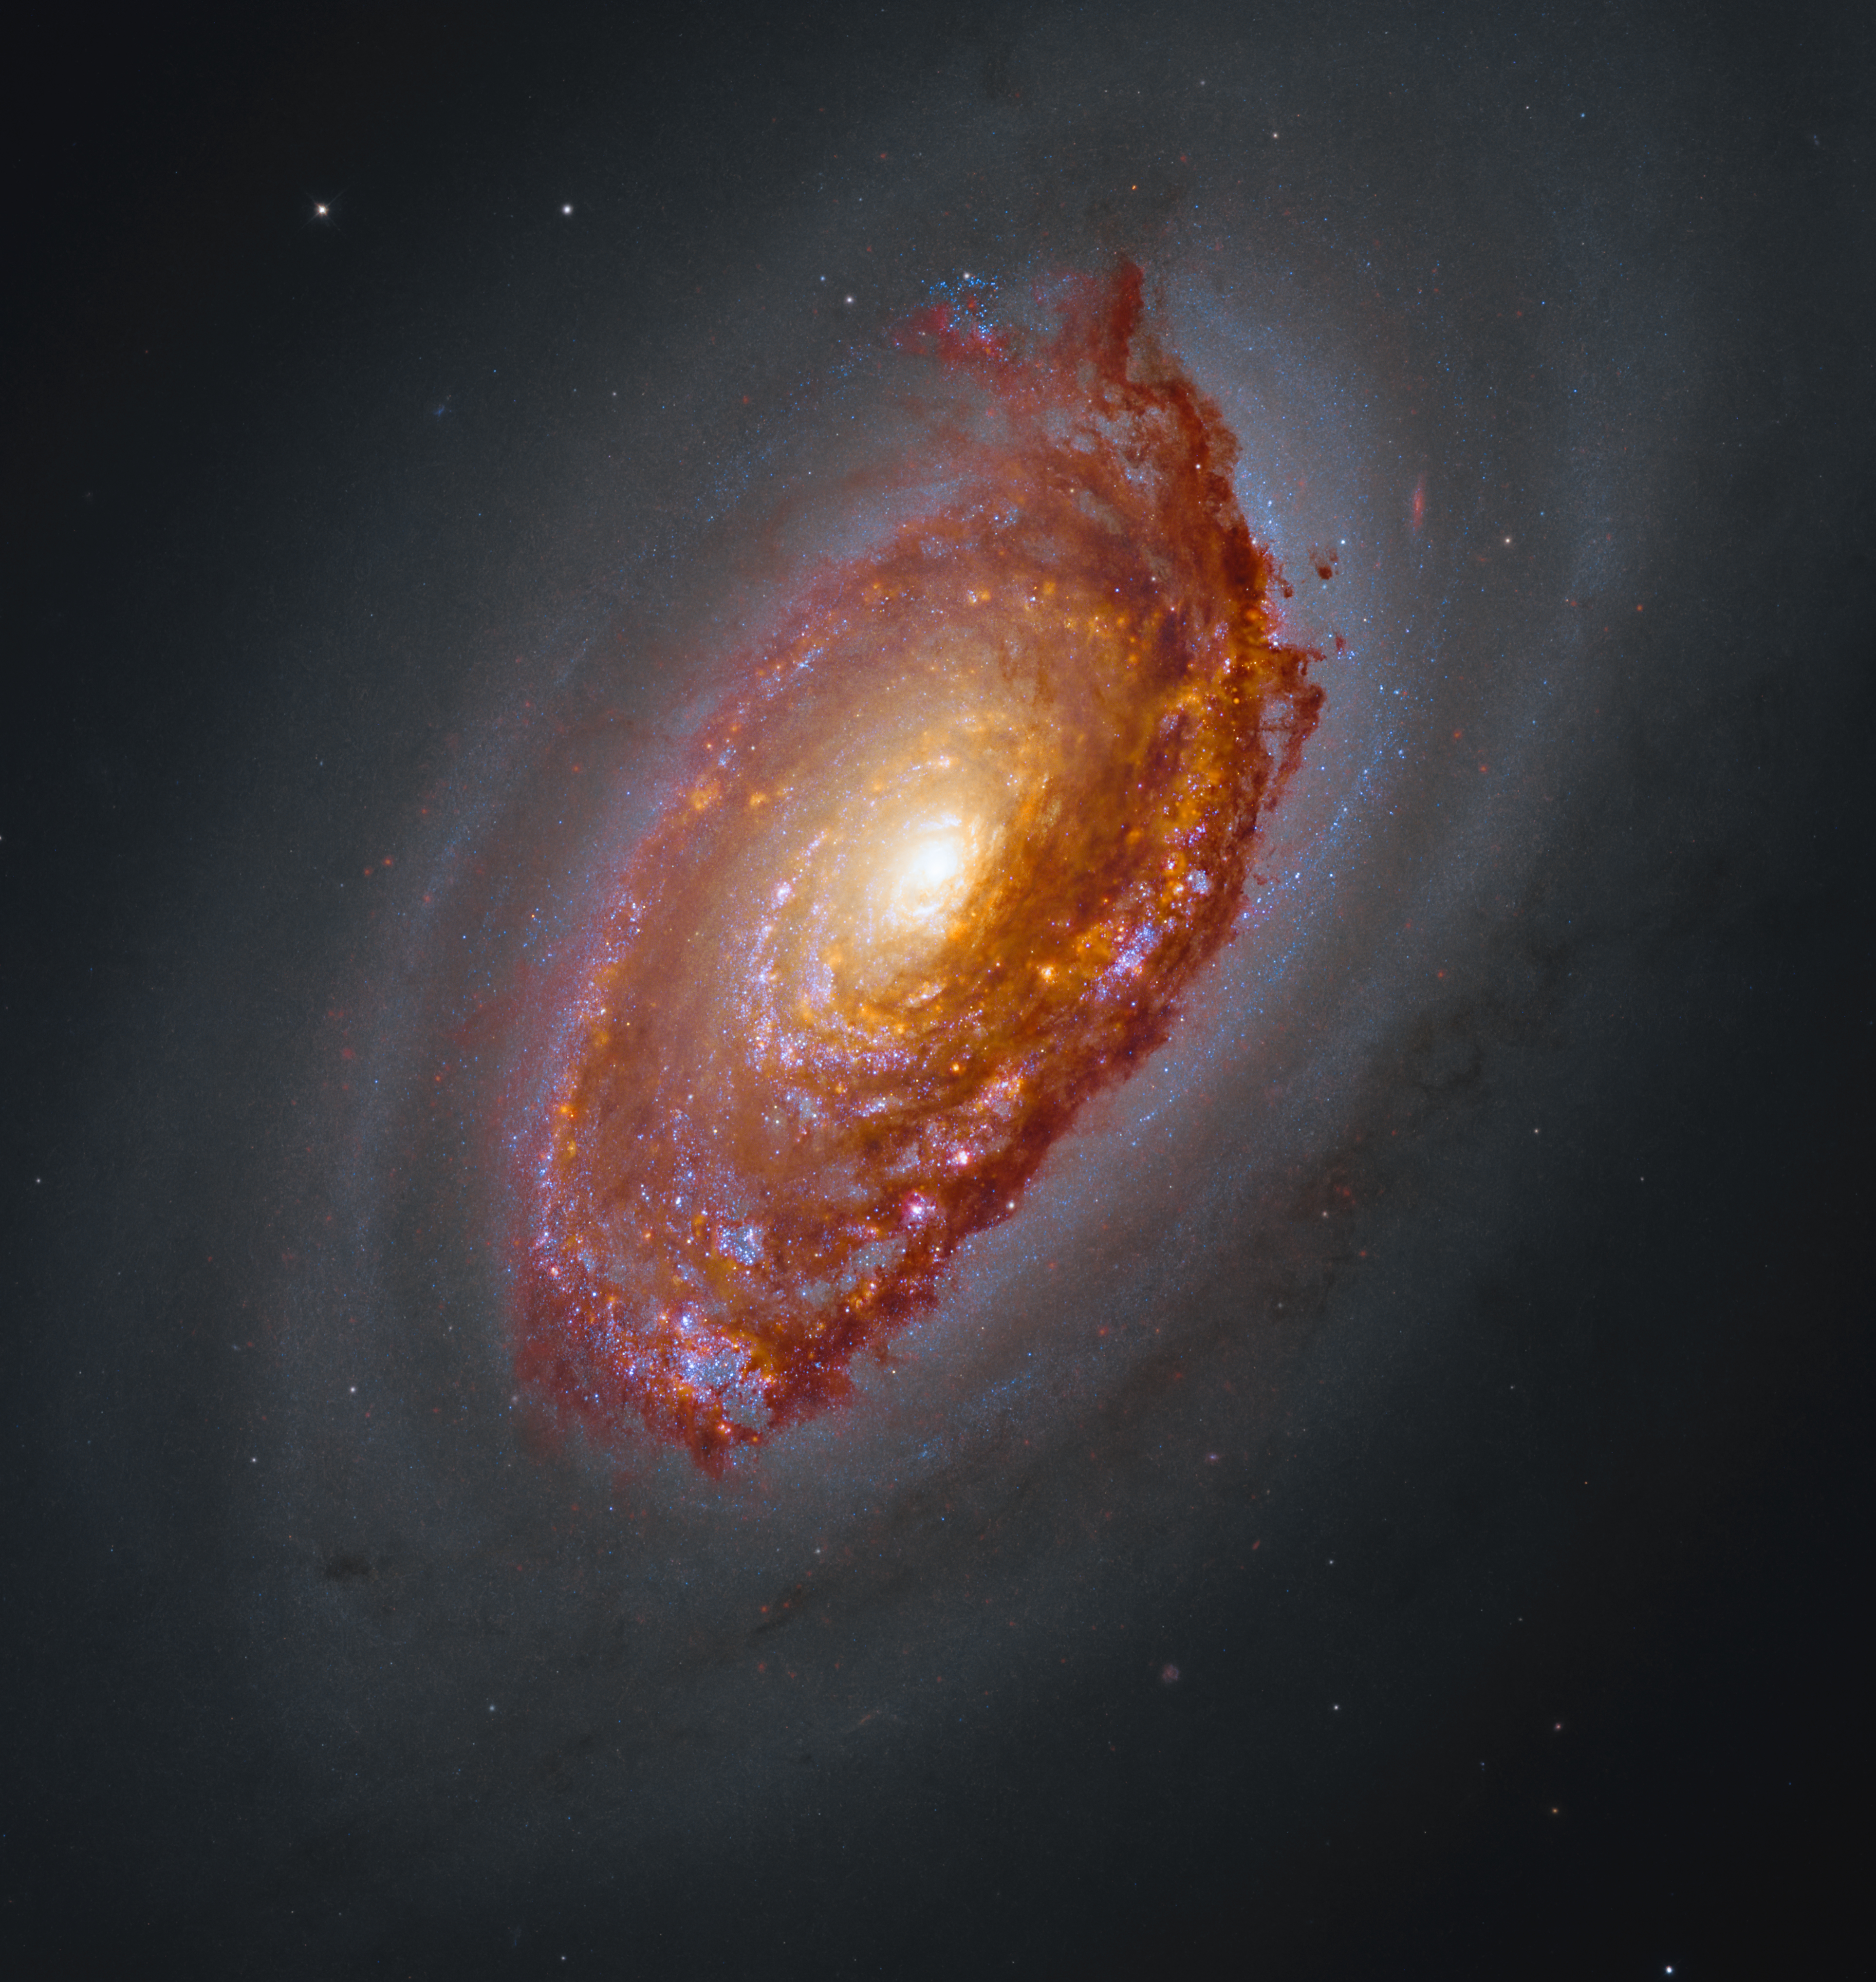
Hubble and Webb image of M64. A massive spiral galaxy glows with a yellow core, surrounded by arms full of orange-brown dust and pink and blue patches of star formation. Framed by a haze of dark dust, the galaxy shines against black space dotted with a few stars.
Easily identified by the spectacular band of dark dust that partially obscures its bright core, Messier 64, or the Black Eye Galaxy, is characterized by its bizarre internal motion.
NASA, CSA, ESA, F. Belfiore (European Southern Observatory – Germany), J. Lee (Space Telescope Science Institute), A. Leroy (The Ohio State University), and D. Thilker (The Johns Hopkins University); Processing: Gladys Kober (NASA/Catholic University of America)

This March 20, 2026, image of Messier 64, or the Black Eye Galaxy, is a composite view from NASA’s Hubble Space Telescope and James Webb Space Telescope. It shows Messier 64 captured at near- and mid-infrared wavelengths by Webb, while Hubble’s image shows the galaxy in ultraviolet, visible, and near-infrared light.

Messier 64 is characterized by its bizarre internal motion. The gas in the outer regions of this spiral galaxy is rotating in the opposite direction from the gas and stars in its inner regions. This strange behavior may be the result of a merger between M64 and a satellite galaxy over a billion years ago.

Image credit: NASA, CSA, ESA, F. Belfiore (European Southern Observatory – Germany), J. Lee (Space Telescope Science Institute), A. Leroy (The Ohio State University), and D. Thilker (The Johns Hopkins University); Processing: Gladys Kober (NASA/Catholic University of America)

The post Black Eye Galaxy appeared first on NASA Science.

Black Eye Galaxy

12 June 2026 at 14:59
Hubble and Webb image of M64. A massive spiral galaxy glows with a yellow core, surrounded by arms full of orange-brown dust and pink and blue patches of star formation. Framed by a haze of dark dust, the galaxy shines against black space dotted with a few stars.
Easily identified by the spectacular band of dark dust that partially obscures its bright core, Messier 64, or the Black Eye Galaxy, is characterized by its bizarre internal motion.
NASA, CSA, ESA, F. Belfiore (European Southern Observatory – Germany), J. Lee (Space Telescope Science Institute), A. Leroy (The Ohio State University), and D. Thilker (The Johns Hopkins University); Processing: Gladys Kober (NASA/Catholic University of America)

This March 20, 2026, image of Messier 64, or the Black Eye Galaxy, is a composite view from NASA’s Hubble Space Telescope and James Webb Space Telescope. It shows Messier 64 captured at near- and mid-infrared wavelengths by Webb, while Hubble’s image shows the galaxy in ultraviolet, visible, and near-infrared light.

Messier 64 is characterized by its bizarre internal motion. The gas in the outer regions of this spiral galaxy is rotating in the opposite direction from the gas and stars in its inner regions. This strange behavior may be the result of a merger between M64 and a satellite galaxy over a billion years ago.

Image credit: NASA, CSA, ESA, F. Belfiore (European Southern Observatory – Germany), J. Lee (Space Telescope Science Institute), A. Leroy (The Ohio State University), and D. Thilker (The Johns Hopkins University); Processing: Gladys Kober (NASA/Catholic University of America)

Hubble Sees Swarm of Galaxies

12 June 2026 at 12:34

2 min read

Hubble Sees Swarm of Galaxies

Numerous galaxies dot the scene and appear to cluster around the image center. The view includes large elliptical galaxies along with spiral and lenticular galaxies. Faint arcs of distant galaxies gravitationally lensed by the cluster appear in the upper-right quadrant of the image. A couple of foreground stars are also visible and easily distinguished by their diffraction spikes.
This NASA Hubble Space Telescope image features the galaxy cluster MACS0329-0211.
NASA, ESA, M. Postman (STScI); Image Processing: G. Kober (NASA/Catholic University of America)

Looking somewhat like a swarm of bees returning to their hive, this NASA Hubble Space Telescope image features the galaxy cluster MACS0329-0211. Galaxy clusters like MACS0329-0211 are important signposts in the story of how the structure of the universe evolved, and are the ultimate telescopic lenses, placing gravitationally lensed galaxies from the earliest stages of the universe into our view.

Zoom into this galaxy swarm and you will find large, oval-shaped elliptical galaxies, and thin spiral and lenticular galaxies viewed from the edge. We can also see the full, face-on view of spiral galaxies and their curving spiral arms. The image’s upper-right quadrant holds faint arcs of distant galaxies gravitationally lensed by the cluster’s massive gravity. The largest of these arcs appears above the bright oval shape of a giant elliptical galaxy. Closer inspection of the image’s center reveals several bright-white intersecting curves that appear as a distorted figure eight. This may be another distant galaxy whose light was magnified and distorted by this massive cluster’s gravity.

Hubble looked at MACS0329-0211 as part of an observing program of X-ray bright galaxy clusters. Researchers used Hubble’s two main cameras, the Advanced Camera for Surveys and its Wide Field Camera 3, to gather data visible and infrared light from the cluster. Hubble’s ability to see such a broad spectrum of light makes it a valuable tool in understanding the very nature of these galaxy clusters.

Media Contact:

Claire Andreoli
NASA’s Goddard Space Flight Center, Greenbelt, MD
claire.andreoli@nasa.gov

Hubble Sees Swarm of Galaxies

12 June 2026 at 12:34

2 min read

Hubble Sees Swarm of Galaxies

Numerous galaxies dot the scene and appear to cluster around the image center. The view includes large elliptical galaxies along with spiral and lenticular galaxies. Faint arcs of distant galaxies gravitationally lensed by the cluster appear in the upper-right quadrant of the image. A couple of foreground stars are also visible and easily distinguished by their diffraction spikes.
This NASA Hubble Space Telescope image features the galaxy cluster MACS0329-0211.
NASA, ESA, M. Postman (STScI); Image Processing: G. Kober (NASA/Catholic University of America)

Looking somewhat like a swarm of bees returning to their hive, this NASA Hubble Space Telescope image features the galaxy cluster MACS0329-0211. Galaxy clusters like MACS0329-0211 are important signposts in the story of how the structure of the universe evolved, and are the ultimate telescopic lenses, placing gravitationally lensed galaxies from the earliest stages of the universe into our view.

Zoom into this galaxy swarm and you will find large, oval-shaped elliptical galaxies, and thin spiral and lenticular galaxies viewed from the edge. We can also see the full, face-on view of spiral galaxies and their curving spiral arms. The image’s upper-right quadrant holds faint arcs of distant galaxies gravitationally lensed by the cluster’s massive gravity. The largest of these arcs appears above the bright oval shape of a giant elliptical galaxy. Closer inspection of the image’s center reveals several bright-white intersecting curves that appear as a distorted figure eight. This may be another distant galaxy whose light was magnified and distorted by this massive cluster’s gravity.

Hubble looked at MACS0329-0211 as part of an observing program of X-ray bright galaxy clusters. Researchers used Hubble’s two main cameras, the Advanced Camera for Surveys and its Wide Field Camera 3, to gather data visible and infrared light from the cluster. Hubble’s ability to see such a broad spectrum of light makes it a valuable tool in understanding the very nature of these galaxy clusters.

Media Contact:

Claire Andreoli
NASA’s Goddard Space Flight Center, Greenbelt, MD
claire.andreoli@nasa.gov

The post Hubble Sees Swarm of Galaxies appeared first on NASA Science.

Astronomers discover massive star-making fuel supply in one of the universe’s earliest galaxies

12 June 2026 at 12:07

Astronomers have discovered a huge reservoir of cold gas in one of the earliest known galaxies, providing new clues about how some galaxies grew so quickly after the Big Bang. The galaxy, known as REBELS-25, is so far away that astronomers see it as it appeared about 700 million years after the birth of the […]

The post Astronomers discover massive star-making fuel supply in one of the universe’s earliest galaxies appeared first on Knowridge Science Report.

L'énigme des vents cosmiques soufflés par le trou noir géant de notre Voie lactée est enfin résolue !

7 June 2026 at 16:07
Nous avons bien progressé en ce qui concerne les observations et la théorie des trous noirs supermassifs au cœur des galaxies. Mais celui de notre Voie lactée déroutait les astrophysiciens depuis presque 50 ans en ce qui concerne une énigme avec des vents de matière. L'énigme semble résolue...

Hints for Massive Galaxy Evolution from Dusty Star-Forming Galaxies

15 May 2026 at 17:00

NGC 972

How do massive galaxies form and evolve? A recent study traces the stellar and dust distributions across evolutionary phases of massive galaxies to better understand how massive dusty star-forming galaxies fit into the picture.

Dusty Massive Galaxies

Massive galaxies, like the Milky Way or even larger, undergo phases of active star formation and quiescent phases of inactivity, but exactly how these galaxies evolve through these stages is not yet fully understood. Dusty star-forming galaxies, which are undergoing a period of intense star formation and shrouded in dust, might be the missing evolutionary step between star-forming and quiescent phases of massive galaxy evolution. 

Currently, the leading explanation for massive galaxy formation and evolution is inside-out growth — star formation and quenching start in the inner regions of a galaxy and progress outward. However, it’s not clear whether dusty star-forming galaxies also follow the favored inside-out pathway, or if they instead proceed outside-in, first growing their disks and then assembling a central bulge.

JWST NIRCam images

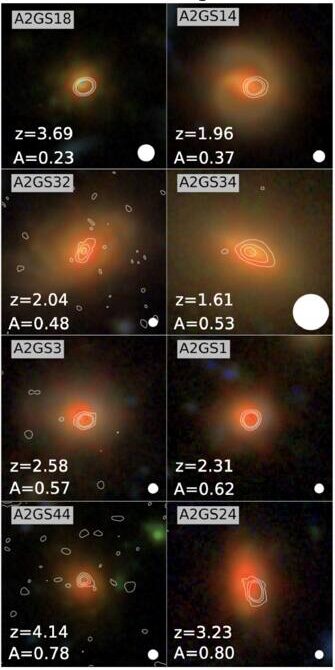
Example of JWST NIRCam images with ALMA contour lines overlaid for select dusty star-forming galaxies in the sample. [Modified from Bodansky et al 2026]

The spatial distribution (or morphology) of the stars and dust within dusty massive galaxies can help us trace their evolution. Thanks to high-resolution observations from JWST and the Atacama Large Millimeter/submillimeter Array (ALMA), researchers can now directly compare the morphologies of distant star-forming, quiescent, and dusty galaxies during the height of our universe’s star formation. Filling this gap will reveal how dusty star-forming galaxies may connect star-forming and quiescent galaxies in massive galaxy evolution.

Multiwavelength Morphological Comparisons

To directly compare the star and dust morphologies across massive galaxies, Sarah Bodansky (University of Massachusetts, Amherst) and collaborators selected a sample of 33 dusty star-forming galaxies from the GOODS-ALMA 2.0 survey that searched the sky for 1.1-mm dust emission as well as star-forming and quiescent comparison samples drawn from JWST observations. Combining the ALMA survey data with JWST imaging, the authors studied the rest-frame optical (stars) and rest-frame near-infrared (dust) morphologies of dusty, star-forming, and quiescent galaxies at redshifts around cosmic noon (a few billion years after the Big Bang).

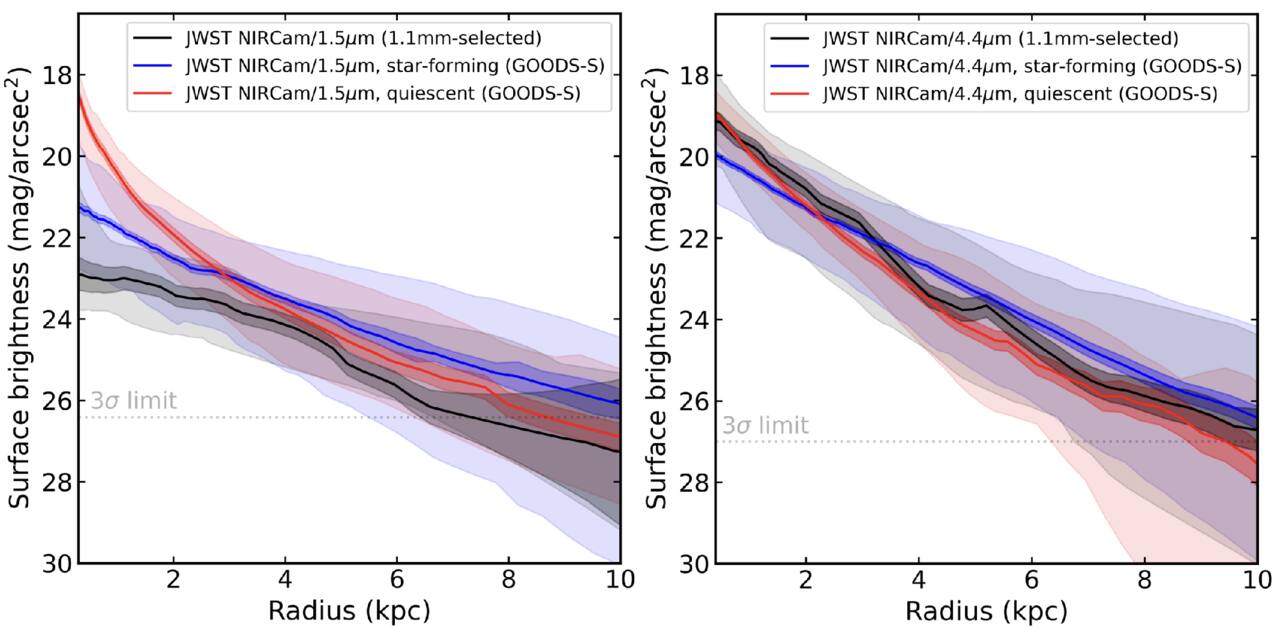
When comparing optical morphologies, the authors found that dusty star-forming galaxies and typical star-forming galaxies had similar distributions, but their near-infrared morphologies showed clear differences. Dusty galaxies tended to show more compact near-infrared emission, with dust tracing their stellar populations and more concentrated in the galaxies’ central regions. Though clearly different from star-forming galaxies, the authors noted striking similarities between the near-infrared morphologies of the dusty star-forming and quiescent galaxies, especially within their centers.

Surface brightness profiles

Average surface brightness profiles for the rest-optical (left) and rest-near-infrared (right) for the dusty (black), star-forming (blue), and quiescent (red) galaxies. In the near-infrared, the dusty star-forming galaxy profile appears very similar to the quiescent galaxy profile. [Bodansky et al 2026]

All of these properties suggest that dusty star-forming galaxies have built up stellar mass and dust in their cores, potentially forming a central bulge first and supporting an inside-out model of massive galaxy growth. This points to dusty star-forming galaxies as possible direct progenitors of early massive quiescent galaxies, hanging onto their last bit of star formation before becoming quiet as well. While this study morphologically distinguishes dusty galaxies from their star-forming and quiescent counterparts, future spectroscopic studies comparing the kinematics of these populations and investigations of molecular gas distributions are necessary to better pin down the evolutionary connection between star-forming, dusty, and quiescent massive galaxies.

Citation

“JWST+ALMA Reveal the Buildup of Stellar Mass in the Cores of Dusty Star-forming Galaxies at Cosmic Noon,” Sarah Bodansky et al 2026 ApJ 1001 235. doi:10.3847/1538-4357/ae4f64

The post Hints for Massive Galaxy Evolution from Dusty Star-Forming Galaxies appeared first on AAS Nova.

Into the Void: Investigating the Heart of a Giant Elliptical Galaxy

11 May 2026 at 17:00

giant elliptical galaxy

The core of the brightest galaxy in the cluster Abell 402 contains a curious void. New observations suggest that an ultra-massive black hole could have excavated this feature.

At the Center of the Center of a Cluster

JWST and Hubble observations of A402-BCG

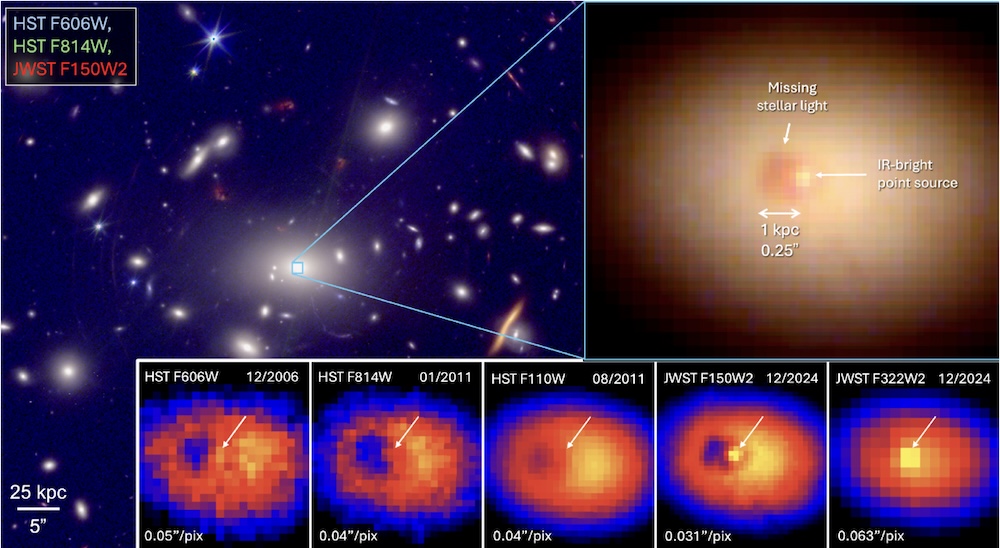
JWST and Hubble observations of A402-BCG. In addition to the dark cavity previously seen by Hubble, the galaxy’s center hosts an infrared-bright source. Click to enlarge. [McDonald et al. 2026]

Abell 402 is a galaxy cluster located roughly 4 billion light-years away, and at its center is a giant elliptical galaxy called A402-BCG. Zooming in on the heart of this galaxy, astronomers using the Hubble Space Telescope discovered a dark region that they suspected was due to a cloud of dust blocking the starlight from the galaxy’s center.

In a recent research article, a team led by Michael McDonald (Massachusetts Institute of Technology) investigated this dark region to test the dust-cloud hypothesis and explore other explanations.

McDonald’s team compiled new JWST Near-Infrared Camera data, archival Hubble imaging, and spectroscopy from the Multi Unit Spectroscopic Explorer (MUSE) on the Very Large Telescope. The new JWST images show a prominent dark feature at the center of A402-BCG, plus a bright source directly beside it.

comparison of A402-BCG to Abell 1060

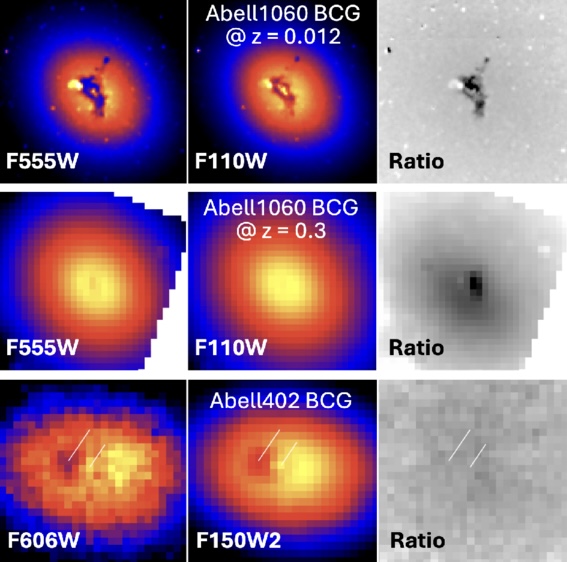
Comparison of the cavity in A402-BCG (bottom row) to the dust ring in Abell 1060’s central galaxy (top row). In the middle row, simulated observations show Abell 1060’s central galaxy at A402-BCG’s redshift. The appearance of the dust ring is wavelength dependent, but the appearance of A402-BCG’s cavity is not. [Adapted from McDonald et al. 2026]

Not Hidden, but Missing

If the dark feature at the center of A402-BCG is a dust cloud, the cloud would be less obscuring at the near-infrared wavelengths captured by JWST than at the optical wavelengths sampled by Hubble. However, the feature was equally dark in the JWST images, leading the team to rule out the dust-cloud hypothesis.

Instead, they favor a scenario in which the dark feature is due to an absence of stars rather than the presence of obscuring dust. The team estimated that 2 billion solar masses of stars are missing — equivalent to 1% of the stellar mass of the galaxy. What’s more, the cavity is situated in a larger region of constant surface brightness called a core, in which there are fewer stars than expected.

The Dynamical History of A402-BCG

McDonald and coauthors suggested that the missing stars in A402-BCG’s core and cavity were ejected by at least one supermassive black hole binary. They estimated that the core region, which is roughly 6,500 light-years across, was excavated by a 50 billion solar mass black hole. This epic black hole may be the result of a past merger and is likely located at the infrared-bright spot on the border of the cavity, as this source’s spectral energy distribution resembles that of an actively accreting black hole.

MUSE observations showing ionized gas within A402-BCG

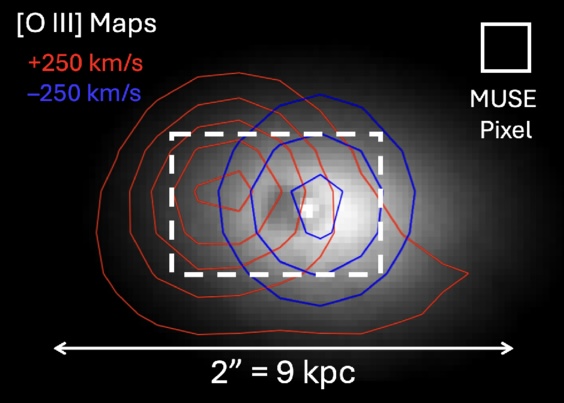
MUSE observations of highly ionized gas in A402-BCG. The blueshifted source on the right coincides with the infrared-bright source, while the redshifted source on the left appears to be embedded within a larger ionized envelope. [Adapted from McDonald et al. 2026]

MUSE spectroscopy provided evidence for a second black hole. These data revealed two pockets of ionized gas — one coincident with the infrared-bright source, the other on the opposite side of the cavity — as well as two distinct sets of emission lines consistent with a black hole binary totaling 60 ± 20 billion solar masses. (The team noted that alternate explanations for the second source, like a compact starburst, were less likely but couldn’t be ruled out.)

The team favors a scenario in which these black holes are slowly spiraling toward one another, ejecting stars from the galaxy’s center as they move and carving out a deep deficit of stars. This stellar cavity sits within a larger region of stellar scarcity that was scooped out by a past supermassive black hole merger that created the ultra-massive black hole present in the galaxy today. Simulations suggest that only about 0.5% of massive galaxies are in this phase of evolution at a time, so we may have caught A402-BCG in a fascinating moment — one that provides new clues about how to search for ongoing black hole mergers in other galaxies.

Citation

“A Kiloparsec-Scale Stellar Cavity in the Center of A402-BCG May Be Caused by Dynamic Interactions with an Ultramassive Black Hole,” Michael McDonald et al 2026 ApJL 1002 L19. doi:10.3847/2041-8213/ae5bbe

The post Into the Void: Investigating the Heart of a Giant Elliptical Galaxy appeared first on AAS Nova.

Feed the Fire, Fade the Metals

5 May 2026 at 17:00

galaxy cluster MACS J1149.5+2223

Editor’s Note: Astrobites is a graduate-student-run organization that digests astrophysical literature for undergraduate students. As part of the partnership between the AAS and astrobites, we occasionally repost astrobites content here at AAS Nova. We hope you enjoy this post from astrobites; the original can be viewed at astrobites.org.

Title: Metal-Poor Star-Forming Clumps in Cosmic Noon Galaxies: Evidence for Gas Inflow and Chemical Dilution Using JWST NIRISS
Authors: Vicente Estrada-Carpenter et al.
First Author’s Institution: Arizona State University
Status: Published in ApJ

If you want to reconstruct a galaxy’s life story, one of the best “fossil records” is its metallicity. In astronomy this refers to the abundance of elements heavier than helium, which are made in stars and returned to a galaxy’s gas through winds and supernovae. Over time, more star formation usually means more metals mixed into the gas.

Now zoom to Cosmic Noon (roughly when the universe was most actively forming stars). Many galaxies in this epoch look “clumpy”; their star formation is concentrated in several bright knots scattered across the disk. The big question is where those clumps come from. Do they form from the galaxy’s own gas via internal disk instabilities, or do they light up when fresh, metal-poor gas flows in and both fuels star formation and dilutes the local metallicity?

The authors try to answer that question with JWST by measuring the metallicity of each clump relative to its immediate surroundings, rather than comparing clumps to a single galaxy-wide number (which can be misleading if the galaxy has a metallicity gradient).

They use JWST/Near Infrared Imager and Slitless Spectrograph (NIRISS) slitless grism spectroscopy from the CAnadian NIRISS Unbiased Cluster Survey (CANUCS) to study 20 lensed galaxies at redshift 0.6 < z < 1.35. (Lensing effectively acts like a zoom lens, helping to resolve smaller structures.) They focus on emission lines that trace star-forming gas, especially Hα (a star formation tracer) and sulfur lines [SII] and [SIII] (needed for their metallicity method).

Slitless spectra come with a headache: because there is no slit, different parts of a galaxy can overlap in the dispersed image. To make reliable emission-line maps from slitless data, the authors use a forward-modeling code called Sleuth, which allows the continuum to vary across the galaxy.

The authors identify clumps using the Hα map together with rest-frame ultraviolet imaging because these tracers are sensitive to star formation on different timescales: Hα highlights gas ionized by the youngest massive stars, while ultraviolet light traces young stellar light over longer periods. As a result a clump can be bright in one and not the other, especially if dust is involved.

To estimate gas-phase metallicity, they use the “strong-line” method, which infers metallicity from ratios of bright emission lines calibrated using models and empirical samples. Their main diagnostic is S23 = ([SIII] + [SII]) / Hα. Because some line ratios also depend on the ionization state (how strongly the gas is being ionized by young stars), they also use the sulfur ratio S32 = [SIII]/[SII] as a check and iterate to a self-consistent solution.

So, Are Clumps Really Chemically Different from Their Surroundings?

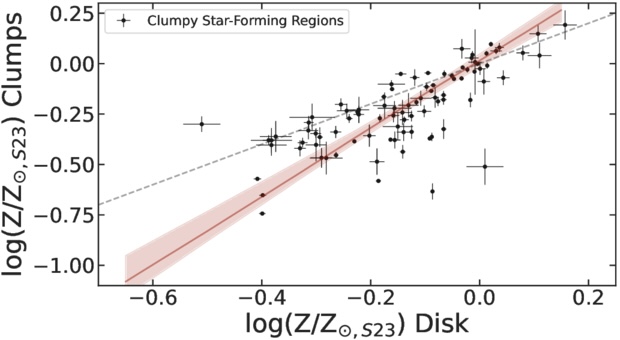
For each clump, the authors measure the metallicity inside the clump and compare it to an annulus just outside the clump (masking neighboring clumps to avoid mixing). When they plot “clump metallicity” versus “local disk metallicity,” most points fall below the 1-to-1 line, meaning the clumps are more metal poor than their surroundings (Figure 1). The mean offset is about 0.1 dex, which corresponds to roughly 20% dilution in the clump gas.

plot of gas-phase metallicity in star-forming clumps compared against metallicity of nearby disk regions

Figure 1: Each point compares a star-forming clump’s gas-phase metallicity to the metallicity of the nearby disk region immediately surrounding it. If clumps and disks had the same metallicity, they would lie on the dashed 1-to-1 line. Instead, most clumps sit below it, showing a typical ∼0.1 dex metallicity deficit, consistent with local chemical dilution. (The solid red line shows a best-fit linear trend to the clump measurement.) [Adapted from Estrada-Carpenter et al. 2025]

An extra wrinkle is that the galaxy medians hint at two populations: some galaxies have clumps with small offsets (near the 1-to-1 line), while others show larger offsets. The authors suggest this could mean two formation pathways, one dominated by internal gas reservoirs (smaller offsets) and another where inflow of metal-poor gas plays a bigger role (larger offsets). They are careful, though, as the sample is still small.

If inflow is really the driver, you should expect a link: the more strongly a clump is forming stars relative to its surroundings, the more diluted its metallicity should be. That is exactly what the authors find. The clumps that are most boosted in star formation are also the most metal diluted.

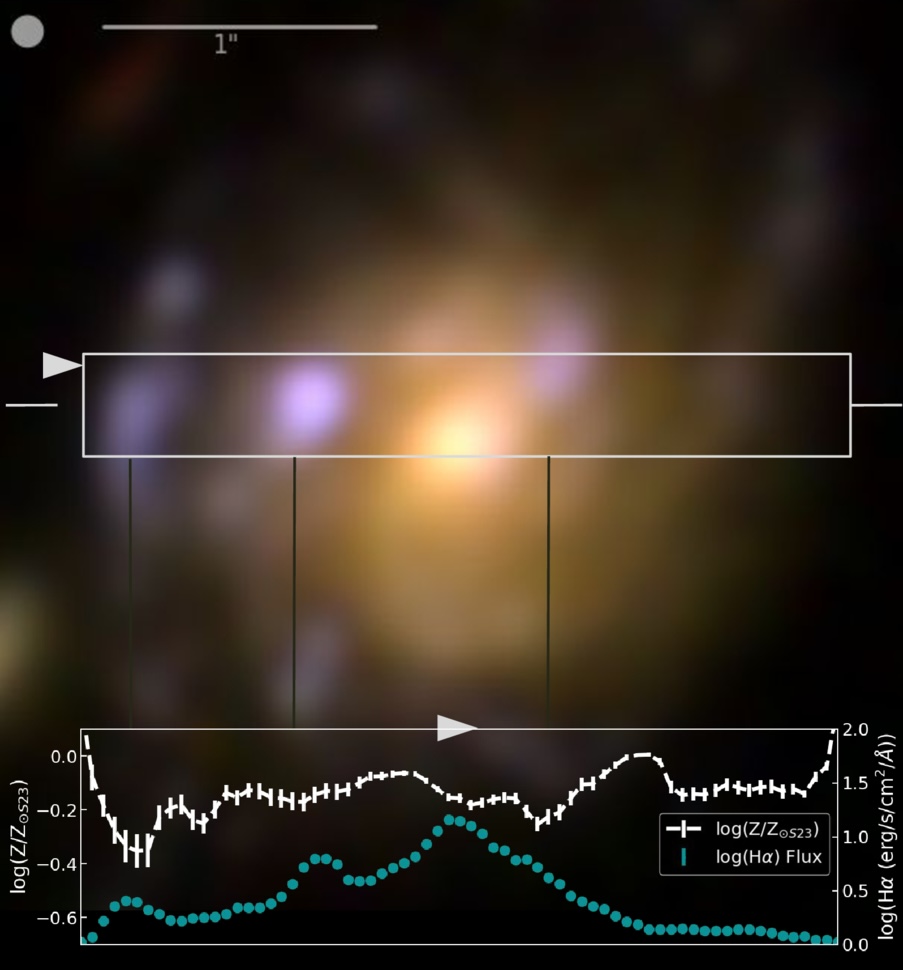
The article also emphasizes that clumps are not chemically uniform blobs. In at least one detailed example, the peaks in Hα (highest star formation) coincide with local minima in metallicity along a cut through the galaxy (Figure 2), suggesting internal star formation rate and metallicity gradients that reinforce the same story, intense star formation goes hand in hand with lower metallicity in the clump regions.

galaxy image showing spatial variation of H alpha and metallicity

Figure 2: Example galaxy from this study illustrating the clump-scale link between star formation and metallicity. The color image shows the galaxy with a rectangular strip marking the region used for a 1D cut. In the bottom panel, the turquoise line shows the Hα flux (a tracer of recent star formation), while the white line shows the metallicity along the same cut. Peaks in Hα flux line up with local dips in metallicity, showing that the brightest star-forming clumps are also the most chemically diluted compared to nearby regions. [Adapted from Estrada-Carpenter et al. 2025]

Are These Clumps Really “In Situ,” or Could They Be Small Satellites?

A reasonable alternative is that some clumps are actually small companion galaxies projected onto the disk. These could also look metal poor, because low-mass galaxies tend to be low metallicity. The authors look for evidence using face-on systems and find that more massive clumps tend to sit closer to galaxy centers, which is consistent with in-situ clumps that form in the disk and migrate inward, though it does not rule out satellites. They argue that kinematics from JWST/NIRSpec IFU will be needed for a definitive separation.

Why This Matters

Gas inflow, star formation, and feedback, together known as the baryon cycle, are key drivers of how galaxies grow. What this article adds is a spatially resolved view that compares each clump to its local environment, showing that regions of elevated star formation also tend to be locally metal poor. That pairing is hard to explain as a simple metallicity gradient or a galaxy-wide averaging effect, and it is exactly what you would expect if at least some clumps are being fueled by relatively metal-poor inflows. In short, these clumps may be snapshots of galaxies refueling in real time.

Original astrobite edited by Ryan White.

About the author, Niloofar Sharei:

I’m an astronomy PhD candidate at UC Riverside studying how galaxies grow through star-forming clumps. I track how these clumps emerge, evolve, and sometimes survive long enough to reshape their galaxies. When I’m not thinking about cosmic blobs, I’m reading, hiking, or listening to Bach.

The post Feed the Fire, Fade the Metals appeared first on AAS Nova.

Featured Image: Galaxies Caught in Transition

4 May 2026 at 17:00

images of six galaxies

How does environment shape a galaxy’s growth and evolution? This is the question explored in a recent study led by Gissel Montaguth (University of São Paulo). Montaguth’s team examined nearly 4,000 galaxies in low-mass, high-mass, and compact galaxy groups, as well as galaxies adrift in the field without belonging to a group. The sampled galaxies were classified as early-type, late-type, transition (generally disk galaxies with quenched star formation), or other (generally elliptical but with lingering star formation). The image above shows six transition galaxies from the sample, three of which show signs of past disturbances (top row). The team found that early-type and “other” galaxies were resilient to changes in environment, but late-type and transition galaxies could be affected by life in close groups. Late-type galaxies in compact groups tended to be somewhat smaller than their loosely grouped or field galaxy counterparts, while transition galaxies showed a significantly steeper stellar mass–size relation in group environments and smaller sizes in groups than in the field. This suggests that transition galaxies are strongly influenced by interactions, mergers, and processes like disk truncation. To learn more about the impact of environment on galaxy properties, be sure to check out the full article linked below.

Citation

“Galaxies Caught in Transition: The Role of Group Environment in Shaping the Mass–Size Relation in the Local Universe,” Gissel P. Montaguth et al 2026 ApJ 999 160. doi:10.3847/1538-4357/ae42ca

The post Featured Image: Galaxies Caught in Transition appeared first on AAS Nova.

How Galaxies Grow Up

24 April 2026 at 17:00

JWST unfolded against a black background.

How do galaxies grow? A massive survey from JWST can help astronomers answer that fundamental question about galaxy evolution.

Time Machines

A photograph of thousands of galaxiesin one frame.

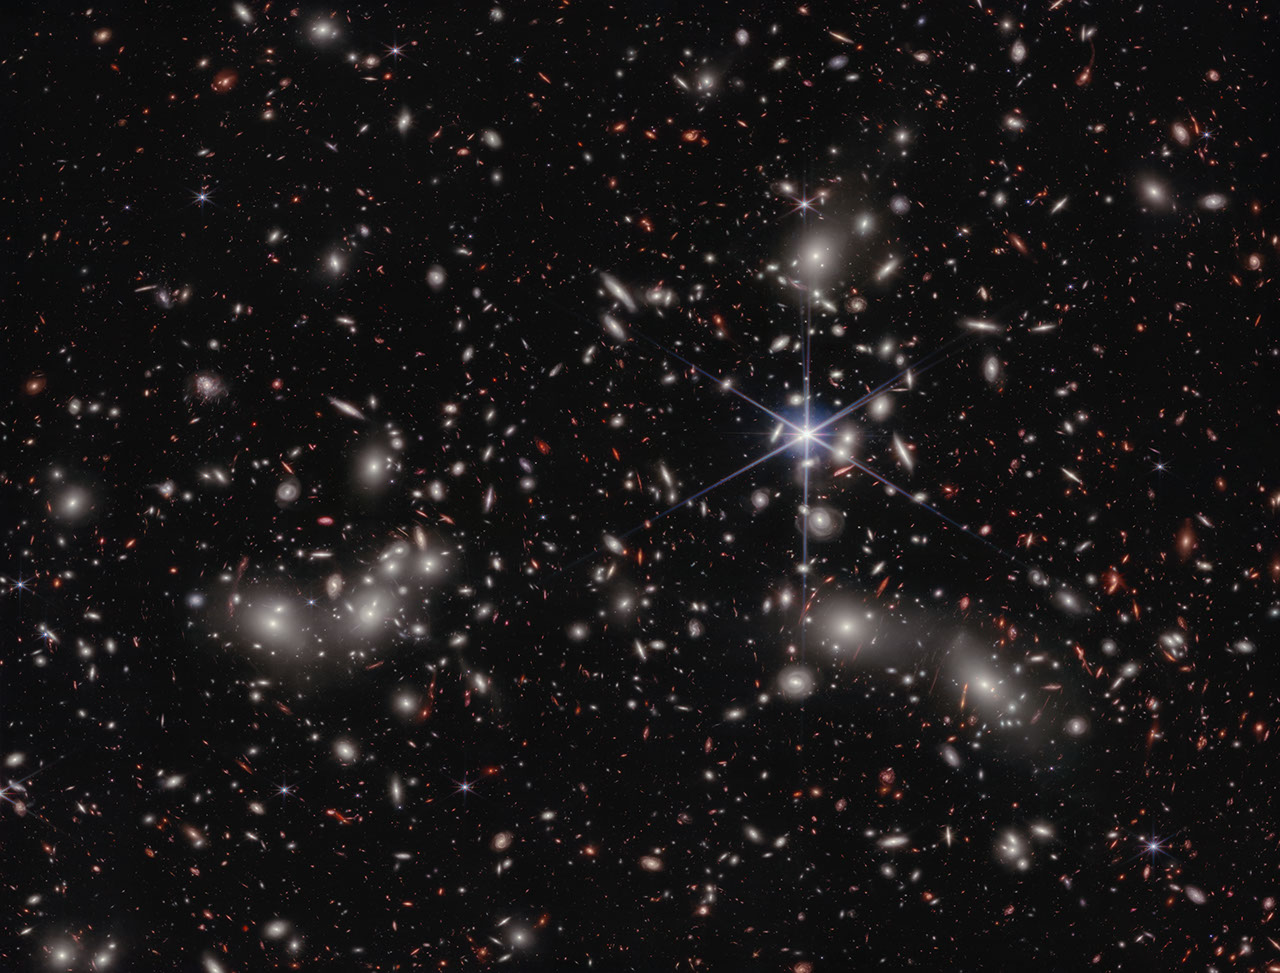
An image taken by JWST’s NIRCam instrument, the primary instrument behind the COSMOS-Web survey, of Pandora’s Cluster. Click to enlarge. [NASA, ESA, CSA, Ivo Labbe (Swinburne), Rachel Bezanson (University of Pittsburgh); Image Processing: Alyssa Pagan (STScI)]

When astronomers look into the night, they are greeted by a sky full to bursting with galaxies. But immediately after the Big Bang, none of these grand structures could have existed in our universe: all of the matter was too hot and dense to collapse into the whirlpools and ellipses we see today. We know that it took time for dark matter to collapse into halos, for gas to cool and fall into those halos, and even more time for those halos to merge together and galaxies to form. However, quantifying that story is tricky. How long did it take for the gas to cool and collapse? How often did small galaxies merge? How did the birth and death of stars play into all of this?

One way astronomers could go about answering these deep, fundamental questions in galaxy evolution would be to look at many galaxies spread across different distances. Famously, since the speed of light is fairly slow (cosmically speaking), we can only see distant objects as they appeared in the past. (This is why any aliens looking toward Earth from 65 million light-years away — from within the Virgo Cluster, perhaps — would see our planet as it was when dinosaurs roamed free.) In principle, then, by looking at a progression of galaxies farther and farther away, astronomers could convert these still images into a sort of movie of how typical galaxies look moving further and further back in time.

Seeing Red

There is a complication to this strategy, however. The farther away an object is, the more the light it emits is stretched towards redder wavelengths. As a consequence, any telescope designed to detect visible light won’t see anything; to take pictures of these galaxies, we need to build detectors that are specifically sensitive to stretched-out, near-infrared light.

This is one of the primary reasons that JWST was designed, constructed, and flung into space. It was purpose-built to collect and analyze near-infrared light from distant galaxies, and now after several years of observations and data crunching, astronomers are finally getting some answers to those fundamental questions.

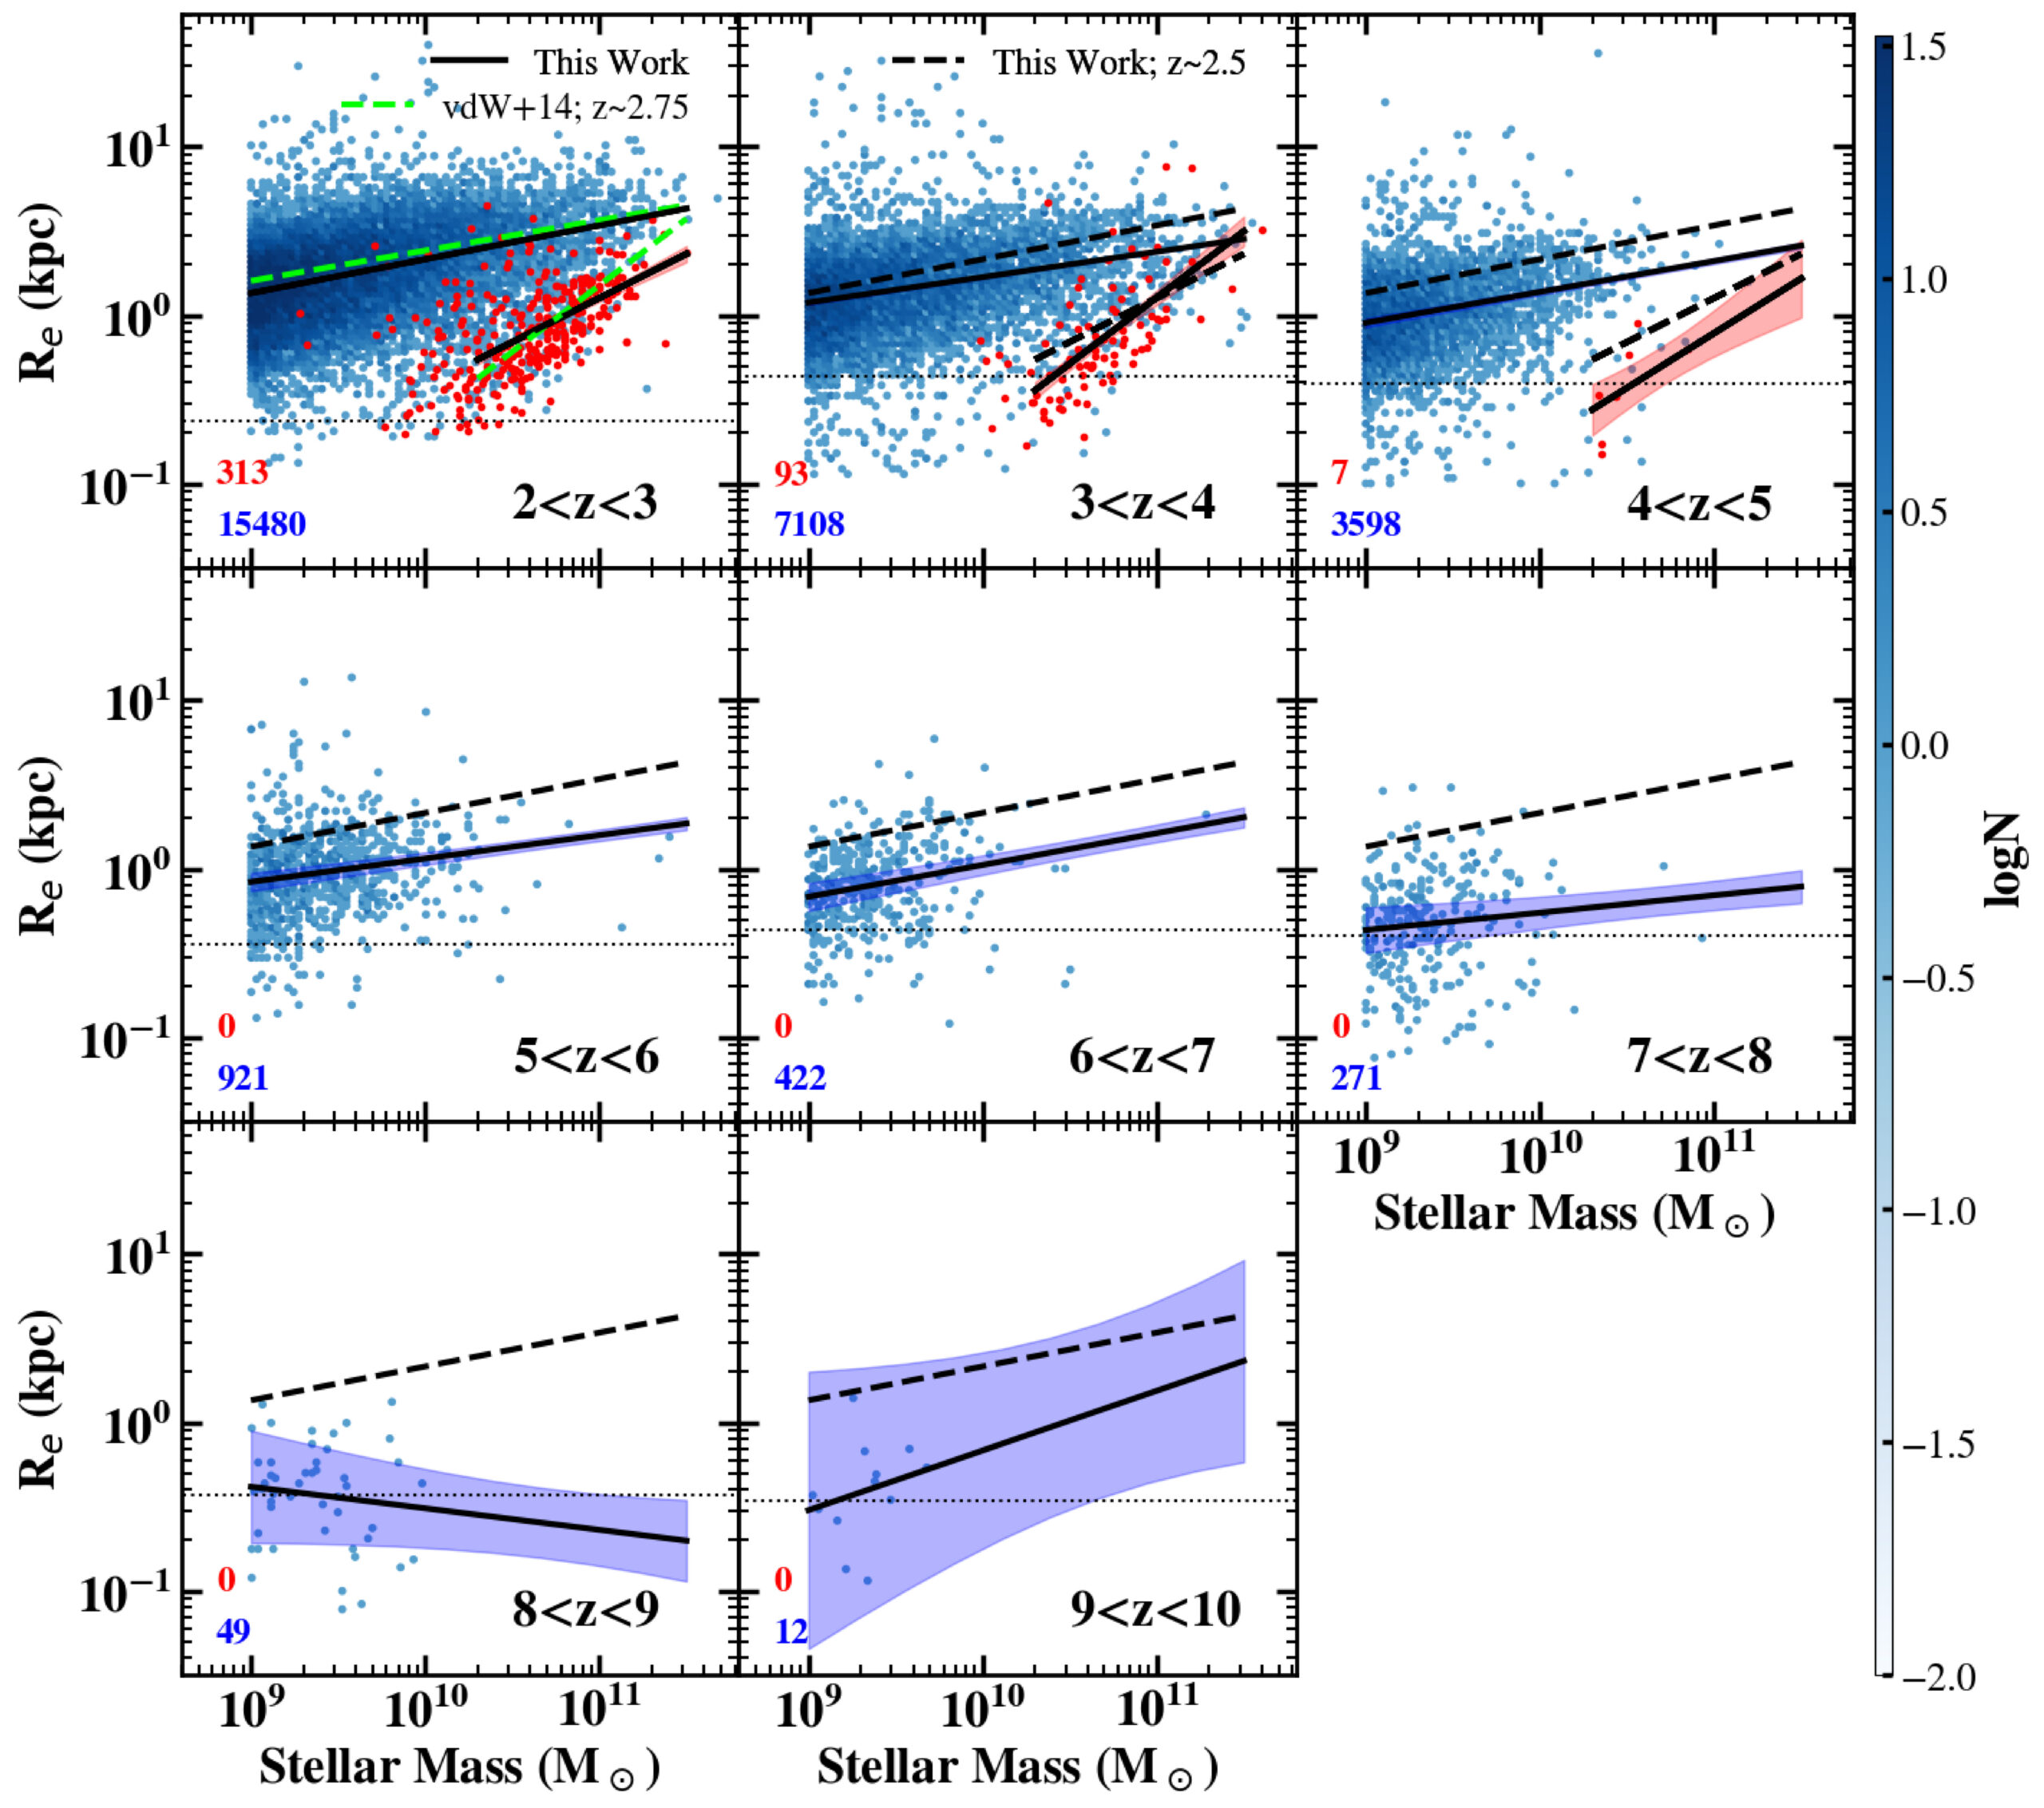
The results of how galaxies’ masses relate to their total size in different redshift bins. Click to enlarge. [Yang et al. 2025]

A Massive Survey

Recently, a team led by Lilan Yang, Rochester Institute of Technology, released their analysis of one of the earliest and largest surveys JWST has undertaken, a program called COSMOS-Web. The researchers mined a patch of sky about the size of the full Moon and extracted more than 30,000 distant galaxies, most of which had never before been seen by human eyes. They measured the brightness and size of each one and grouped them according to their redshift (a proxy for their distance) and whether they were actively forming stars or not.

The team found that, unsurprisingly, galaxies tend to grow over time. Excitingly, however, they also found that for star-forming galaxies, the relationship between a galaxy’s mass and its size is fairly constant for redshifts of z = 2–8. The scaling law between them also nicely matches up with measurements taken by the Hubble Space Telescope at smaller redshifts. Beyond that, though, for redshifts of z = 8–10, it’s possible that the scaling changes, though the authors emphasize that their sample is much smaller in these distant bins.

While more data are needed to confirm whether the youngest of these galaxies grow at a different pace than their later counterparts, we can be comforted that studies like this represent just our very first peek into a whole new era of galactic evolution, and that many more insights are sure to come as JWST keeps snapping images.

Editor’s Note: This article previously contained an error relating to the distance at which aliens would see Earth as it was when inhabited by dinosaurs. This error was corrected on 4 May 2026.

Citation

“COSMOS-Web: Unraveling the Evolution of Galaxy Size and Related Properties at 2 < z < 10,” Lilan Yang et al 2025 ApJS 281 68. doi:10.3847/1538-4365/ae0e1b

The post How Galaxies Grow Up appeared first on AAS Nova.

A Possible GLIMPSE of the Universe’s First Stars

21 April 2026 at 17:00

Population III stars

Editor’s Note: Astrobites is a graduate-student-run organization that digests astrophysical literature for undergraduate students. As part of the partnership between the AAS and astrobites, we occasionally repost astrobites content here at AAS Nova. We hope you enjoy this post from astrobites; the original can be viewed at astrobites.org.

Title: GLIMPSE: An Ultrafaint ≃105 M⊙ Pop III Galaxy Candidate and First Constraints on the Pop III UV Luminosity Function at z ≃ 6–7
Authors: Seiji Fujimoto et al.
First Author’s Institution: University of Toronto; The University of Texas at Austin
Status: Published in ApJ

You, me, your laptop, my $8 matcha, and just about everything else on Earth was forged in the fiery bellies of dying stars. Generations of stars had to live and die before the universe became enriched with any elements heavier than helium (what astronomers call “metals”). The first stars to undergo this cosmic cycle are known as Population III (Pop III) stars. Though their existence has been hypothesized since the 1960s, astronomers have failed to observe these distant metal-free stars or the faint, low-mass galaxies that host them.

The first Pop III stars likely formed around 100 million years after the Big Bang in pristine pockets of hydrogen gas. Although these are too distant for us to observe, we expect that as the universe started to become metal enriched, there were still existing pockets of gas introverted enough to survive unpolluted and form metal-free Pop III stars up to a redshift of z ~ 6–7 (when the universe was around 900 million years old)!

JWST is the perfect instrument to search for these systems. You can read other astrobites on the search for possible Pop III systems with JWST here and here. The authors of today’s article seek to develop the most efficient way of using JWST’s Near-Infrared Camera (NIRCam) to find the galaxies hosting Pop III stars. Using their selection method on existing NIRCam data, the authors identified one promising Pop III galaxy candidate.

I’m Not Like Other Galaxies

In order to find a Pop III galaxy, we need to take a look at galaxies’ spectral energy distributions (SEDs). These are graphs that show the energy emitted by a galaxy at different wavelengths of light. Pop III galaxies are expected to have SEDs that differ from your everyday, metal-enriched galaxy. NIRCam will be especially sensitive to three key spectral features that show up in the SEDs of Pop III galaxies: an absent [O III] line (light emitted by doubly ionized oxygen atoms), a strong H-alpha line (light emitted when a hydrogen atom transitions from its third to its second energy level), and a significant Balmer jump (light absorbed to ionize electrons in the second energy level of a hydrogen atom). To identify these key SED characteristics, the authors use SED fitting and color–color diagrams to execute an efficient Pop III search with NIRCam.

The first selection method involves SED fitting. Astronomers create template SEDs that represent different types of galaxies and then compare these templates to the observed SEDs to see which one matches best. In this work, the authors use metal-rich galaxy templates and Pop III templates to fit the galaxies observed with NIRCam. They then calculate the chi-squared χ2 (a statistical measure of best fit) between the data and all the SED templates. A galaxy is selected as a Pop III candidate if the Pop III model provides a good fit (χ2 < 10) to the photometry and is significantly better than any metal-rich model. It’s kind of like looking for Cinderella by making every woman in the kingdom try on the glass slipper.

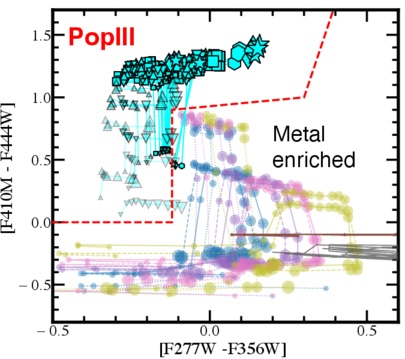
A color-color diagram showing how Pop III models lie in a different parameter space than metal-rich galaxies.

Figure 1: Color–color diagram for selecting Pop III galaxies where the x and y-axes show the different NIRCam filters being subtracted. The cyan symbols are different Pop III models while the other colored dots are different metal-rich galaxy models. [Adapted from Fujimoto et al. 2025]

A color–color diagram plots the difference in magnitude between two filters on each axis. NIRCam filters are specially chosen to emphasize the SED characteristics above. When these filters are chosen, Pop III galaxies occupy a distinct region of this diagram as compared to metal-rich galaxies. For example, subtracting the F356W filter from the F277W filter is sensitive to the presence of the [O III] line and the Balmer jump. Figure 1 demonstrates how this color selection separates Pop III galaxies from typical galaxies.

O Pop III, Pop III, Wherefore Art Thou?

The authors apply their fresh new selection criteria to publicly available NIRCam data from large surveys. And (drum roll please) the slipper fits! The Pop III galaxy candidate GLIMPSE-16043 is an ultra-faint galaxy at z = 6.5. It was imaged in the GLIMPSE survey, which uses the technique of gravitational lensing to observe faint and distant galaxies.

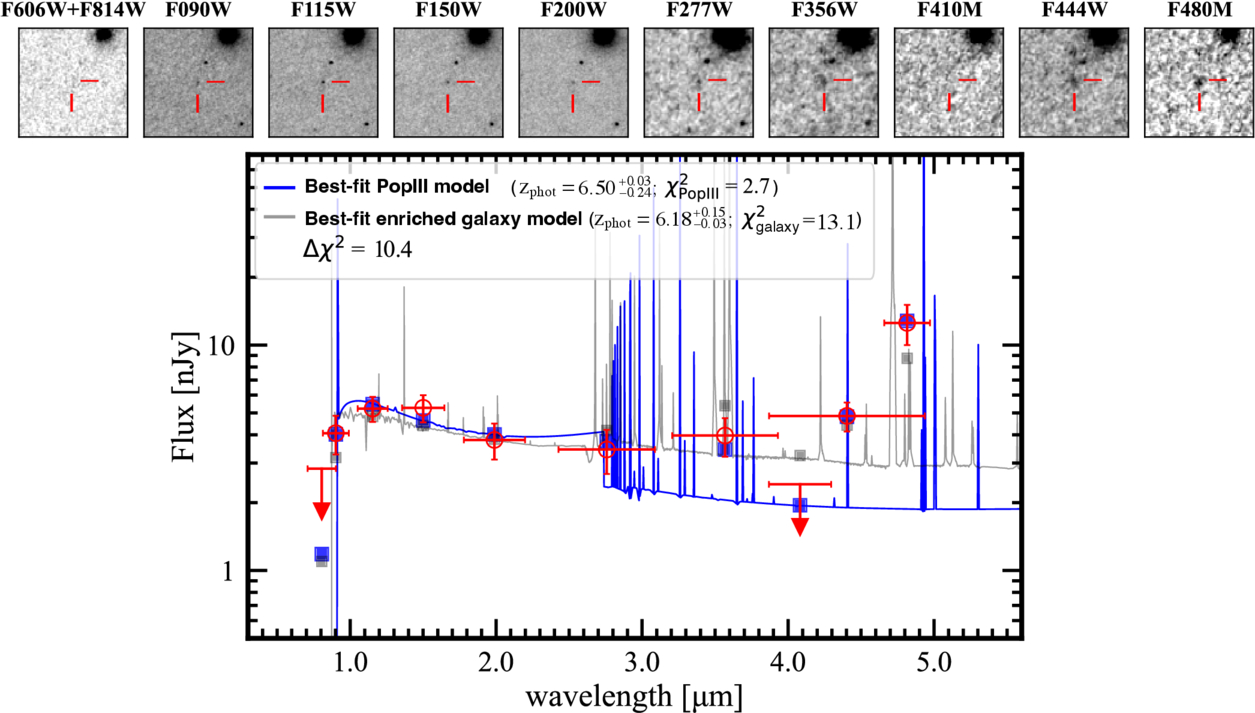
The GLIMPSE survey targeted a massive galaxy cluster, Abell S1063. The cluster bends the light from distant galaxies and, like a giant lens, magnifies faraway objects, providing some of the deepest JWST imaging to date. The Pop III candidate passes both tests: it resides in the Pop III region of the color–color diagram, and its SED is best fit by a Pop III model, not a metal-rich galaxy model (see Figure 2). Next, spectroscopic follow-up is needed to ensure that this galaxy is truly metal free and not just extremely metal poor.

The spectral energy distribution of a Pop III galaxy candidate. This plot shows that the JWST data is best fit by a Pop III model rather than a metal-rich galaxy.

Figure 2: SED of GLIMPSE-16043 with the best-fit Pop III template (blue) and best-fit metal-enriched template (gray). The top panel is the galaxy imaged in different filters from NIRCam and the Hubble Space Telescope. [Fujimoto et al. 2025]

The authors conclude that our best shot at identifying additional Pop III galaxy candidates is using NIRCam to image large numbers of gravitationally lensed clusters. Without magnification from gravitational lensing, it may be impossible to see these ultra-faint Pop III galaxies. Once candidates have been identified, they can be followed up with deep spectroscopy to confirm their redshift and their lack of metals. Who knows? With these new methods, we may soon get a glimpse of the universe’s very first stars.

Original astrobite edited by Chris Layden and Margaret Verrico.

About the author, Madison VanWyngarden:

I am a first-year PhD student in astronomy and NSF Graduate Research Fellow at the University of Arizona. I study galaxy formation and evolution in the distant universe and am particularly interested in dusty star-forming galaxies. In my free time, I love reading, hiking, and baking bread!

The post A Possible GLIMPSE of the Universe’s First Stars appeared first on AAS Nova.

Featured Image: Disequilibrium on Display

20 April 2026 at 17:00

eight images from the Hubble Arp Galaxy Survey

Notice anything unusual about these galaxies? Each of the scenes above is crafted from observations from the Hubble Arp Galaxy Survey, which turned the talents of the Hubble Space Telescope toward 216 targets in the Arp and Arp–Madore catalogs. These catalogs contain galaxies that are visibly out of equilibrium, either caught in the middle of an interaction with another galaxy, sporting strange structures, or illuminated by brilliant starbursts. Julianne Dalcanton (Flatiron Institute; University of Washington), Meredith Durbin (University of Washington; University of California, Berkeley), and Benjamin Williams (University of Washington) designed the survey to create an archive of previously unobserved sources in these catalogs of peculiar galaxies. In addition to providing a new high-resolution view of these sources, the team hopes that the survey will serve as a launchpad for new investigations and complementary observations from facilities like JWST and the Atacama Large Millimeter/submillimeter Array. To learn more about the Hubble Arp Galaxy Survey and see more of the new images, be sure to check out the full article linked below.

Citation

“The Hubble Arp Galaxy Survey,” Julianne J. Dalcanton et al 2026 ApJS 283 25. doi:10.3847/1538-4365/adfc67

The post Featured Image: Disequilibrium on Display appeared first on AAS Nova.

Observing the End of Star Formation in Galaxies

14 April 2026 at 17:00

galaxy transitioning from star forming to quiescent

Editor’s Note: Astrobites is a graduate-student-run organization that digests astrophysical literature for undergraduate students. As part of the partnership between the AAS and astrobites, we occasionally repost astrobites content here at AAS Nova. We hope you enjoy this post from astrobites; the original can be viewed at astrobites.org.

Title: Searching Within Galaxies for the Earliest Signs of Quenching With Spatially Resolved Star Formation Histories in UVCANDELS
Authors: Charlotte Olsen et al.
First Author’s Institution: New York City College of Technology
Status: Published in ApJ

How and Why Do Galaxies Stop Forming Stars?

Galaxies serve as important laboratories for many subfields of astrophysics. As such, astrophysicists are interested in the full galactic life cycle, from how galaxies are born to the end of their formation. Whereas young galaxies in the distant universe are actively forming stars, many nearby galaxies are much quieter, with little or no ongoing star formation. Astronomers like to describe these galaxies as “red and dead” because their stars are older and therefore appear redder in color. The process by which galaxies shut down their star formation is known as quenching, and it causes galaxies to become quiescent. Understanding the origin of quiescent galaxies is a fundamental question in galaxy evolution. Studying this process is challenging, however, because star formation is intertwined with many other factors that shape galaxies, including their environments and supermassive black holes.

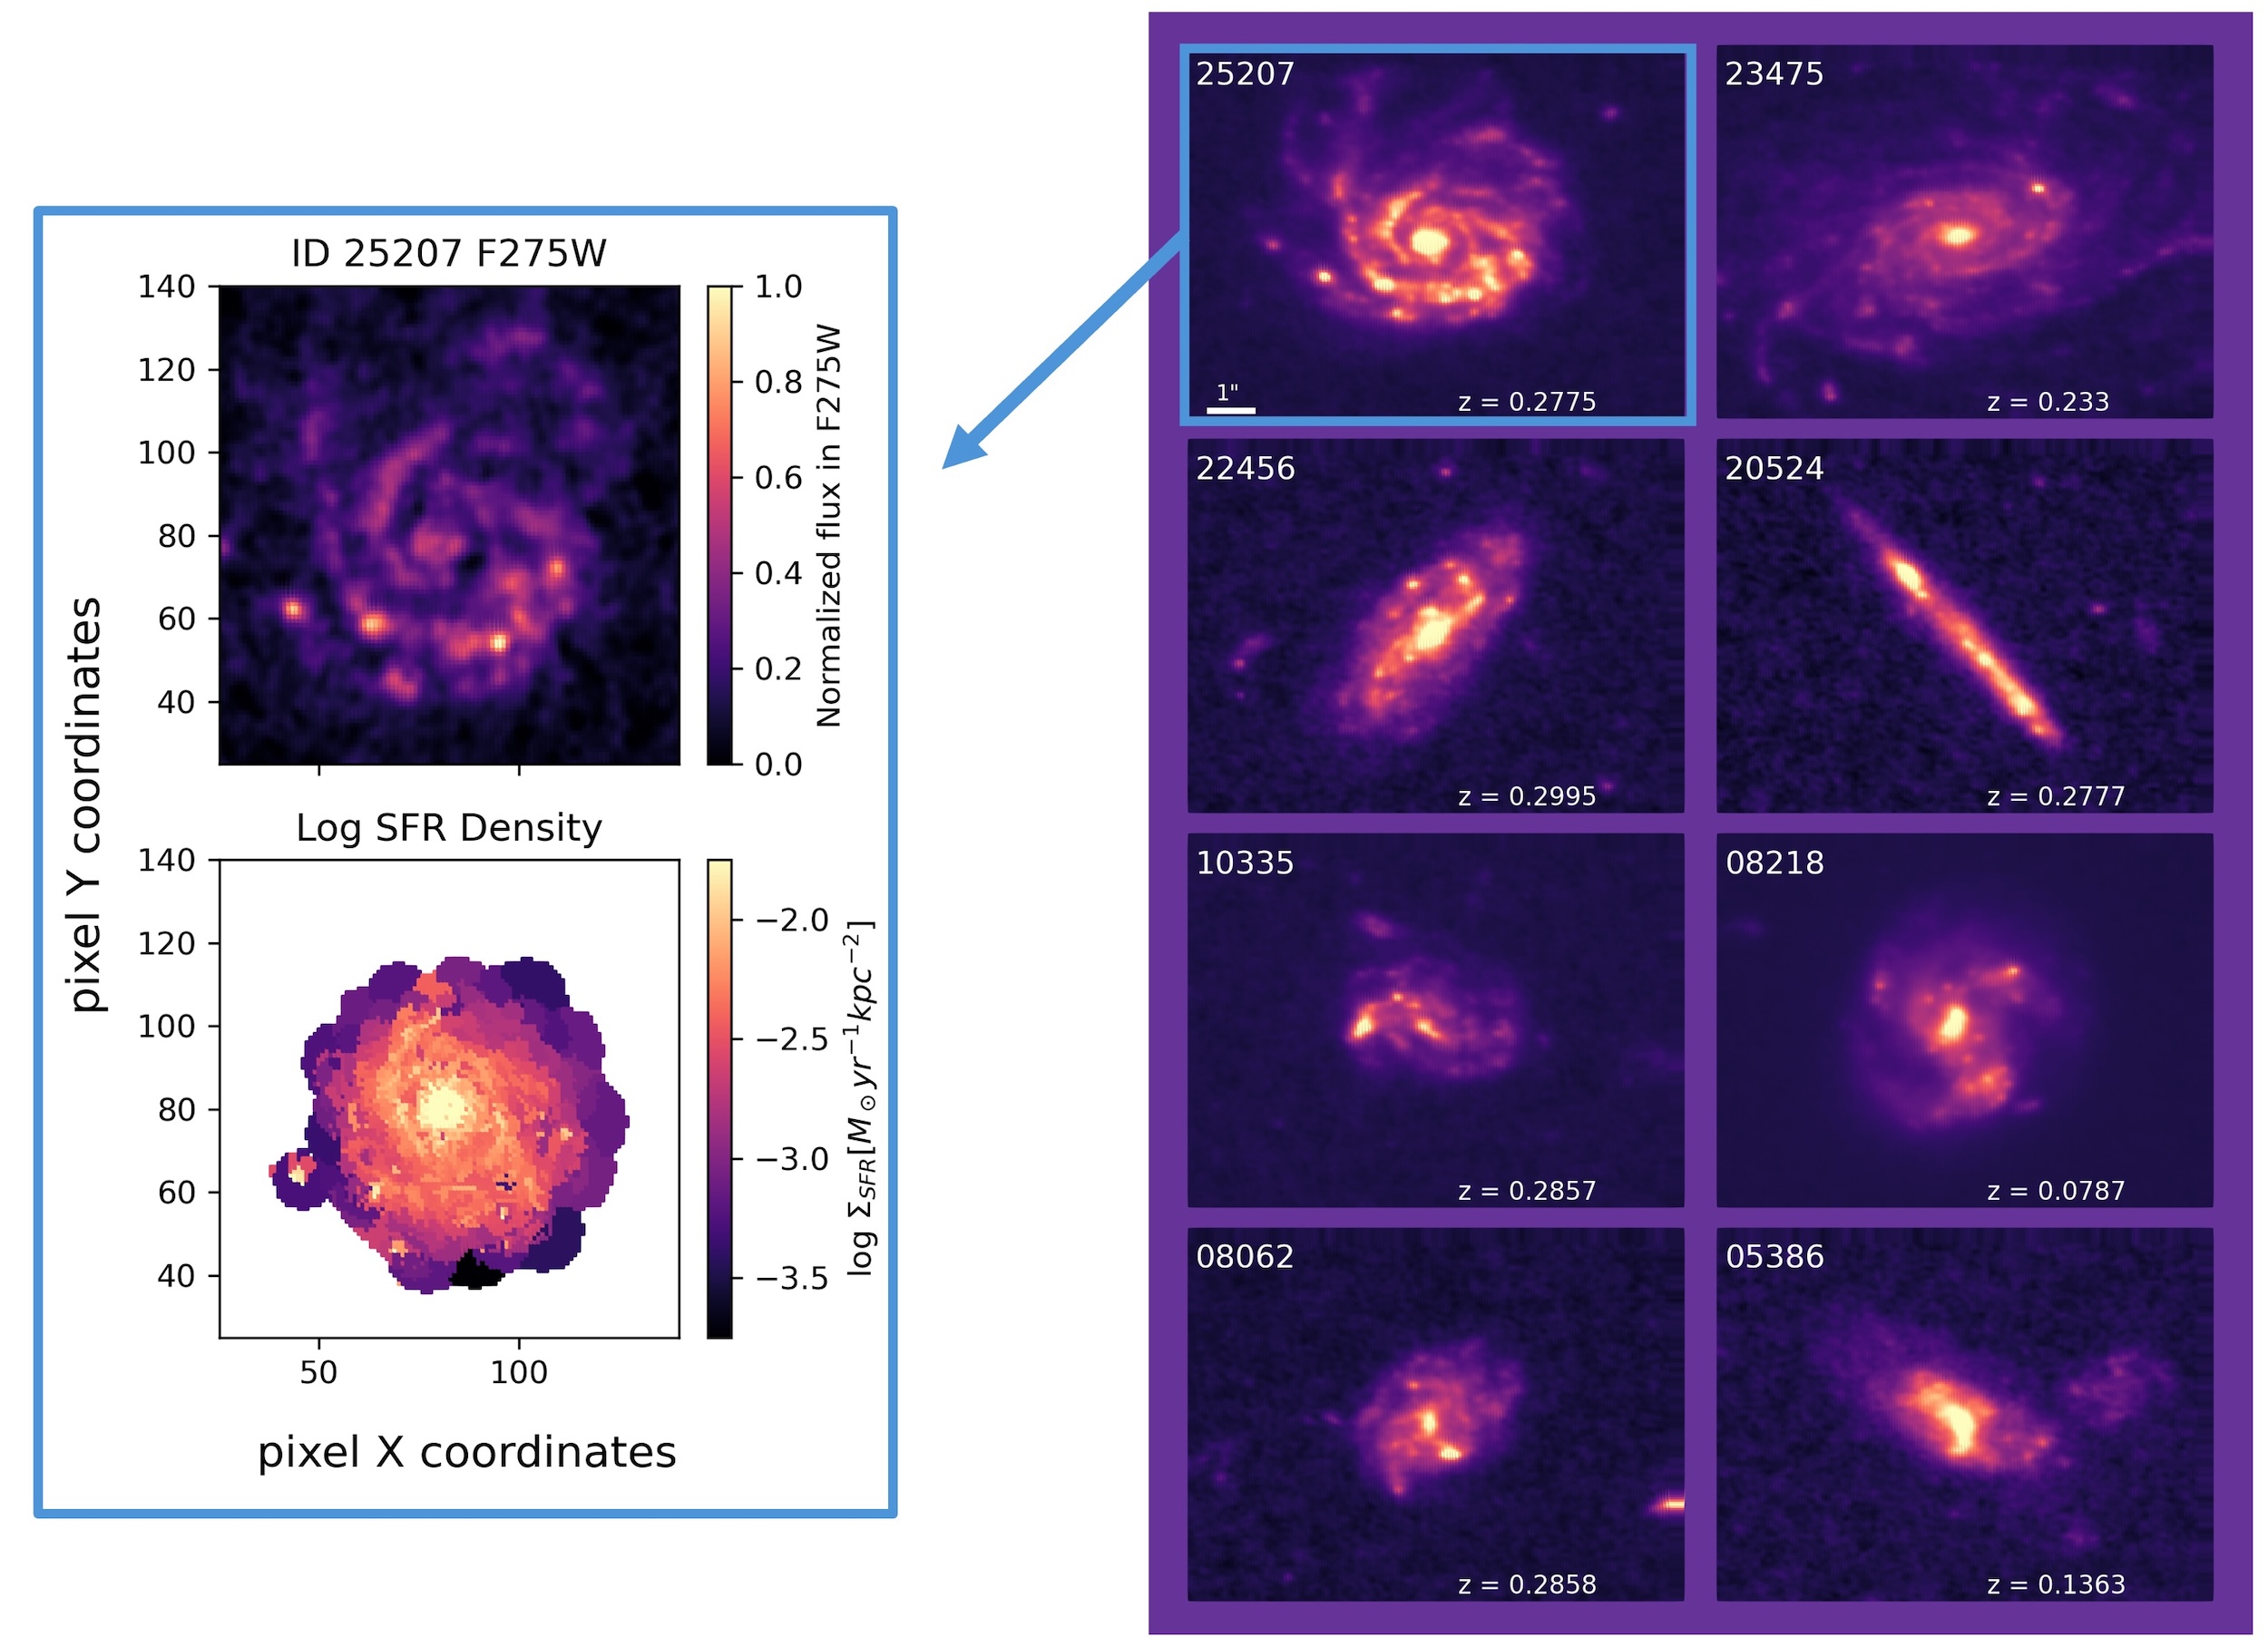
Star formation occurs on scales that are much smaller and over timescales much shorter than the global properties and overall lifetime of a galaxy. By observing star formation on these smaller scales over time, astronomers can gain a clearer picture of how star formation ceases in a galaxy, and they can determine whether this process is driven from the inside out — starting with the supermassive black hole in the galactic center — or from the outside in, influenced by environmental effects. In today’s article, the authors use the Cosmic Assembly Near-Infrared Deep Extragalactic Legacy Survey with high-resolution ultraviolet coverage (UVCANDELS) to examine eight “golden” galaxies, shown in Figure 1. They then reconstruct the star formation histories within small regions of each galaxy to detect the “earliest signs of quenching.”

galaxy sample from Olsen et al.

Figure 1: Images of the eight galaxies in the “Golden Sample” of galaxies studied in this work (right). These galaxies were chosen because of their clear detection, and they show a range of edge-on to face-on views as well as shapes. The authors divided each galaxy into small, resolved regions in which they measured the star formation (example shown on left). [Adapted from Olsen et al. 2026]

Characterizing the Star Formation Histories

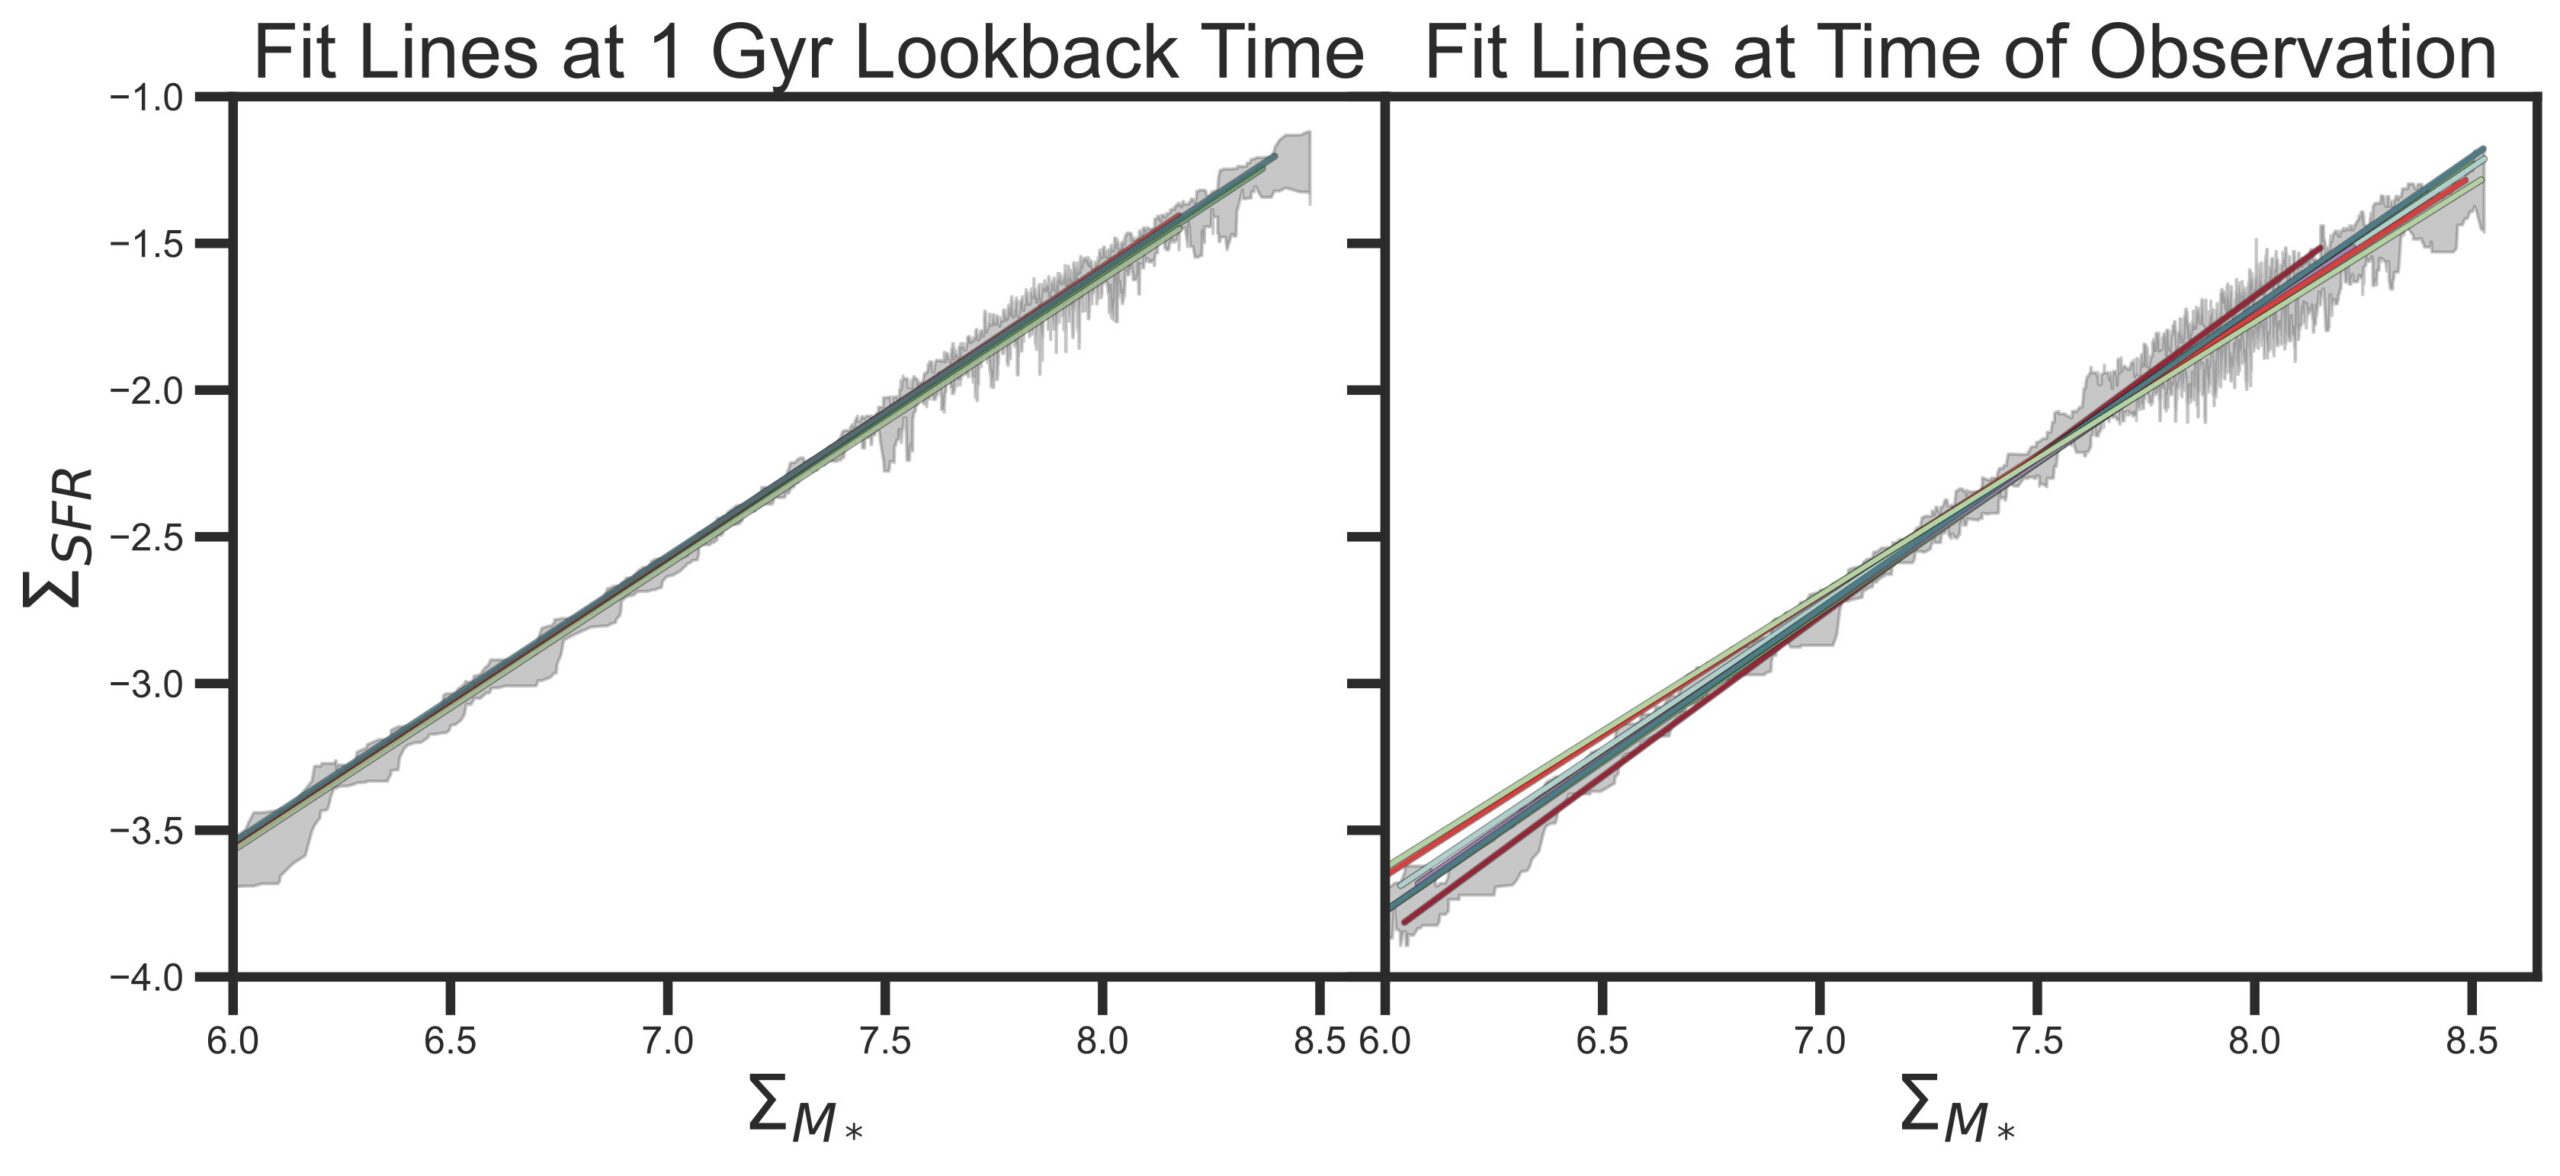
To trace a galaxy’s star formation over cosmic time, today’s authors model its integrated light — which encodes the many episodes of past star formation — using spectral energy distribution (SED) fitting. By comparing a galaxy’s light across many wavelengths to computer models, SED fitting can estimate the ages of its stars and when they formed. This approach allows astronomers to study how a galaxy’s star formation rate evolves as a function of its stellar mass, known as the SFR – Mstellar relation. Note that the article considers the star formation rate and stellar mass in individual regions of each galaxy, so it analyzes these properties as surface densities, ΣSFR and ΣMstellar, instead of the total values.

Using SED fitting, the authors determine the expected star formation rate and stellar mass of the regions from 250 million to 1 billion years before the time of observation. Figure 2 shows the line of best fit for the SFR – Mstellar relation of the regions for each galaxy, before and at the time of observation. The SFR – Mstellar relations are very similar across the sample 1 billion years before the observations; however, by the time of observation, the overall star formation rates have decreased slightly, indicating that the galaxies are beginning to quench. They also exhibit increased variation suggesting that each galaxy is quenching in a different way.

best-fit SFR – M stellar relation

Figure 2: The best-fit SFR – Mstellar relation of the regions for each galaxy, represented by the different colored lines, 1 billion years (1 Gyr) before and at the time of observation (left and right panels, respectively). At 1 billion years before the observation, the galaxies appear to have the same relation, but their variation at the time of observation suggests that the galaxies have begun quenching in different ways. [Olsen et al. 2026]

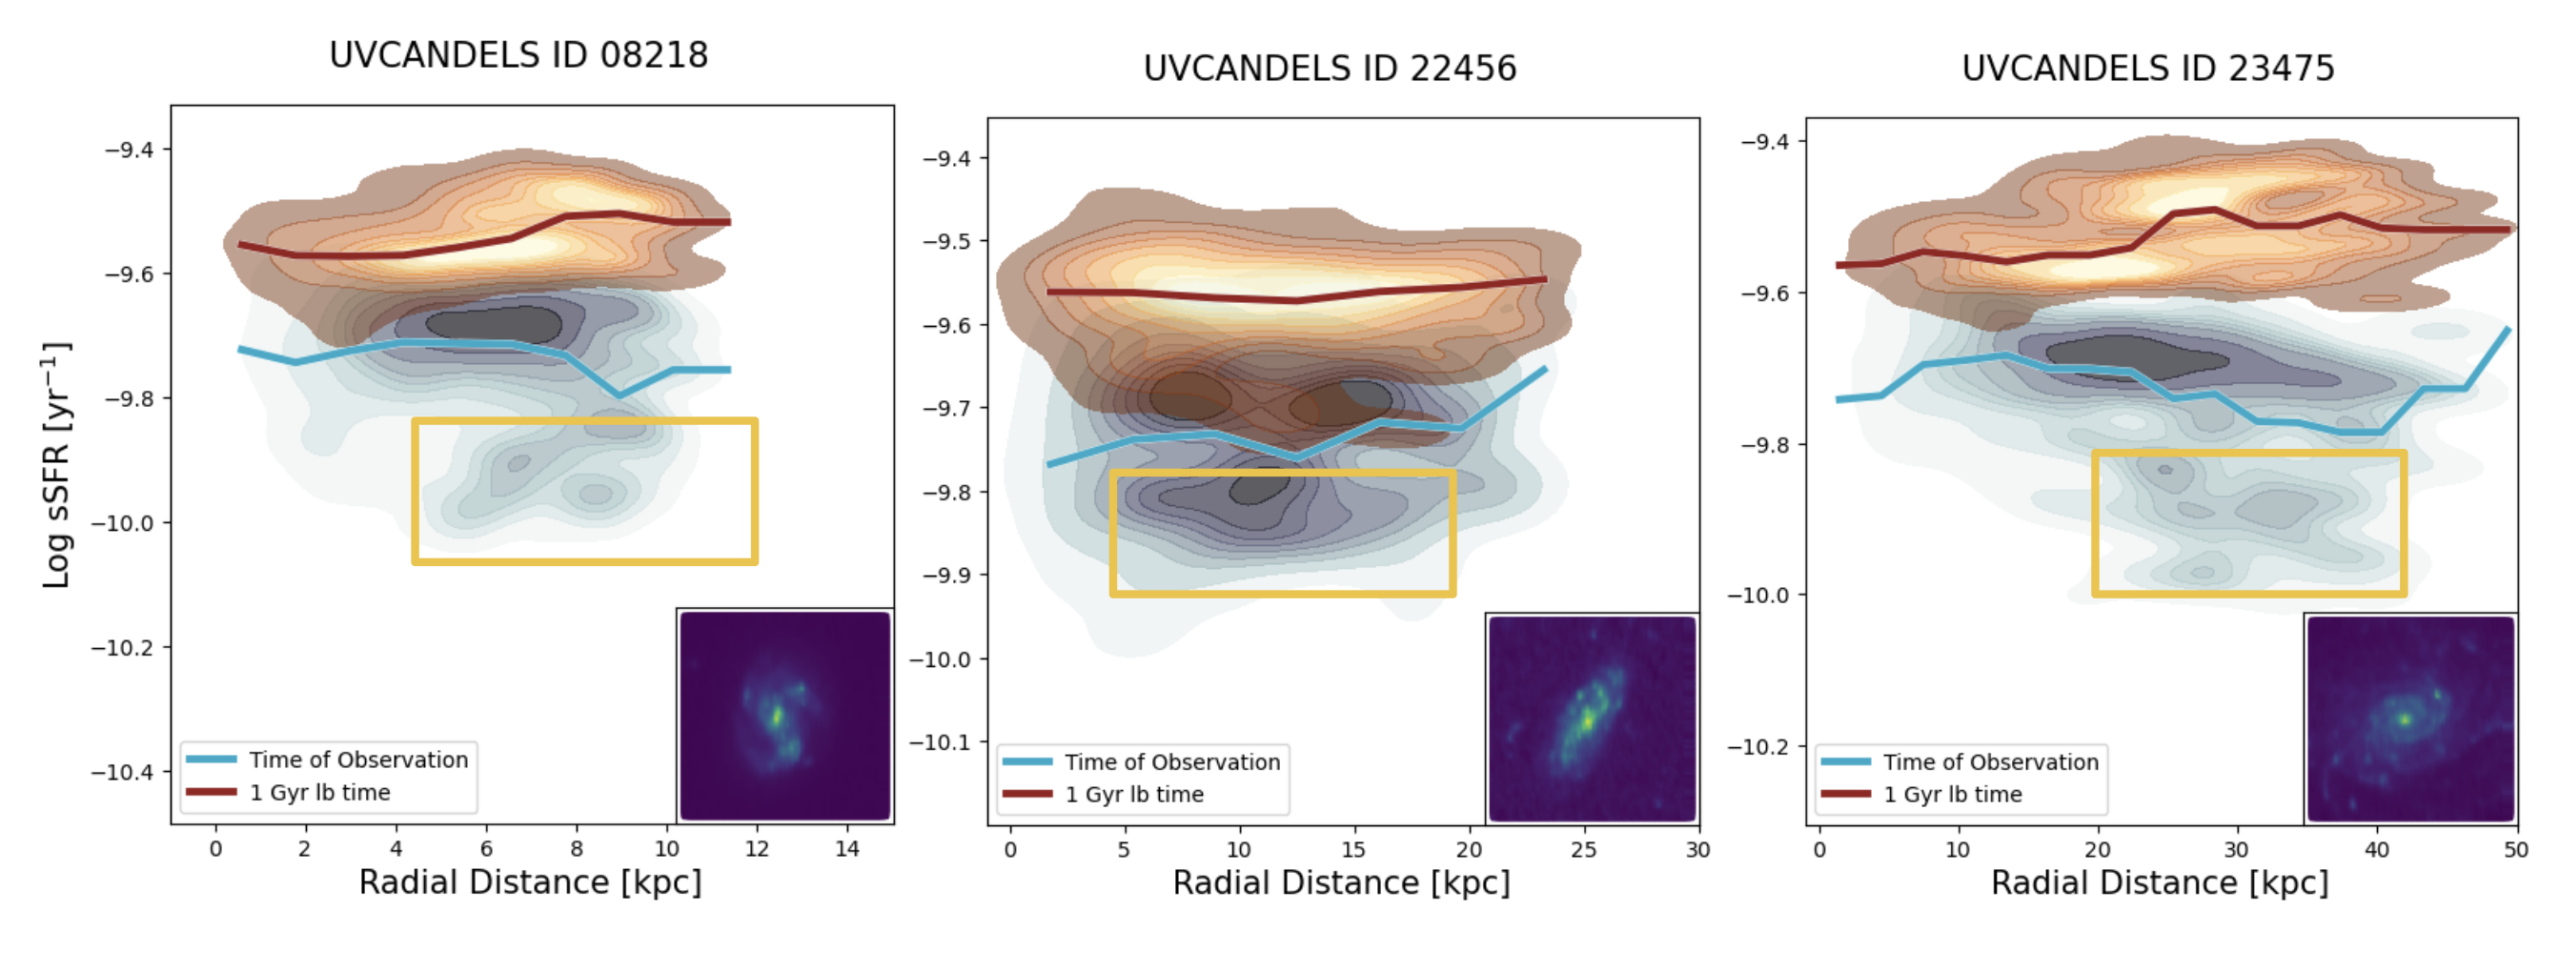
To further probe how these galaxies are starting to quench, the authors also measure the specific star formation rate (sSFR) of the regions as a function of their distance from the center of the galaxy. The sSFR can be thought of as the rate of new star formation relative to the amount of existing stellar mass: SFR /Mstellar. Figure 3 shows three examples from the galaxies studied in this work. Once again, the star formation rates of the regions decrease over the course of 1 billion years. However, the regions where the star formation rate has declined most rapidly differ from galaxy to galaxy — ranging from the central regions to the mid-disk to the outskirts — as each galaxy is undergoing a different quenching mechanism.
specific star formation rate of the regions as a function of their distance from the center of the galaxy

Figure 3: The specific star formation rate of the regions as a function of their distance from the center for three of the galaxies in the sample. Overall, the star formation rate decreases from 1 billion years before the observation (red) to the time of observation (blue). However, the regions where the star formation decreases most significantly (indicated with the yellow boxes) vary from galaxy to galaxy. [Olsen et al. 2026]

Detecting the Earliest Signs of Quenching

It should be noted that all of the galaxies in this study are still forming stars. However, they are on the verge of having their star formation suppressed, offering valuable insight into how quenching begins and how diverse the process can be. New telescopes are pushing the boundaries of what we can observe. On one hand, JWST can capture galaxies at exceptionally high resolution; on the other, the Vera C. Rubin Observatory and the Nancy Grace Roman Space Telescope will deliver vast datasets containing billions of galaxies. Future investigations leveraging these facilities could reveal more about the physical processes that quench galaxies on small scales, shedding light on the mechanisms that drive galaxy evolution.

Original astrobite edited by Catherine Slaughter.

About the author, Shalini Kurinchi-Vendhan:

After studying astrophysics and literature at Caltech, I moved onto a Fulbright Fellowship in Heidelberg, Germany. I’m passionate about using computer simulations to explore supermassive black holes and galaxy evolution — but I also love poetry and traveling.

The post Observing the End of Star Formation in Galaxies appeared first on AAS Nova.

Starring in the Early Universe: Black Hole Stars and Little Red Dots

25 March 2026 at 16:10

NIRCam JADES image

JWST has uncovered a peculiar population of very distant objects known as “little red dots.” The mechanisms powering these objects’ peculiar properties — high luminosities, compact radii, and “V”-shaped spectra — remain uncertain. Could little red dots be the result of supermassive stars, galaxy mergers, or, as a recent study explores, black hole stars?

Direct-Collapse Black Holes and Little Red Dots

Since their discovery, little red dots have been the subject of many studies, but a complete explanation for their unique combination of properties remains elusive. Multiple studies have explored the growing population of peculiar dots, with some postulating that they are the result of stars thousands of times the mass of the Sun, supermassive stars entrenched in gas from a galaxy merger, or black holes embedded in dense accretion disks. 

Even more recently, studies have proposed that little red dots may be the remnants of direct-collapse black holes. In this scenario, a large cloud of gas in the early universe directly collapses into a stellar-mass black hole, and the remaining gas envelops the black hole, forming what is known as a quasi-star (or black hole star). Researchers have suggested that little red dots may be the late stage of this process when the black hole has accreted at least 10% of the total mass of the system. Direct comparisons between quasi-star evolutionary models and JWST observations of little red dots have yet to be explored but are necessary to confirm the potential of quasi-star origins.

Evolutionary Models of Quasi-Stars

Quasi-star HR diagram

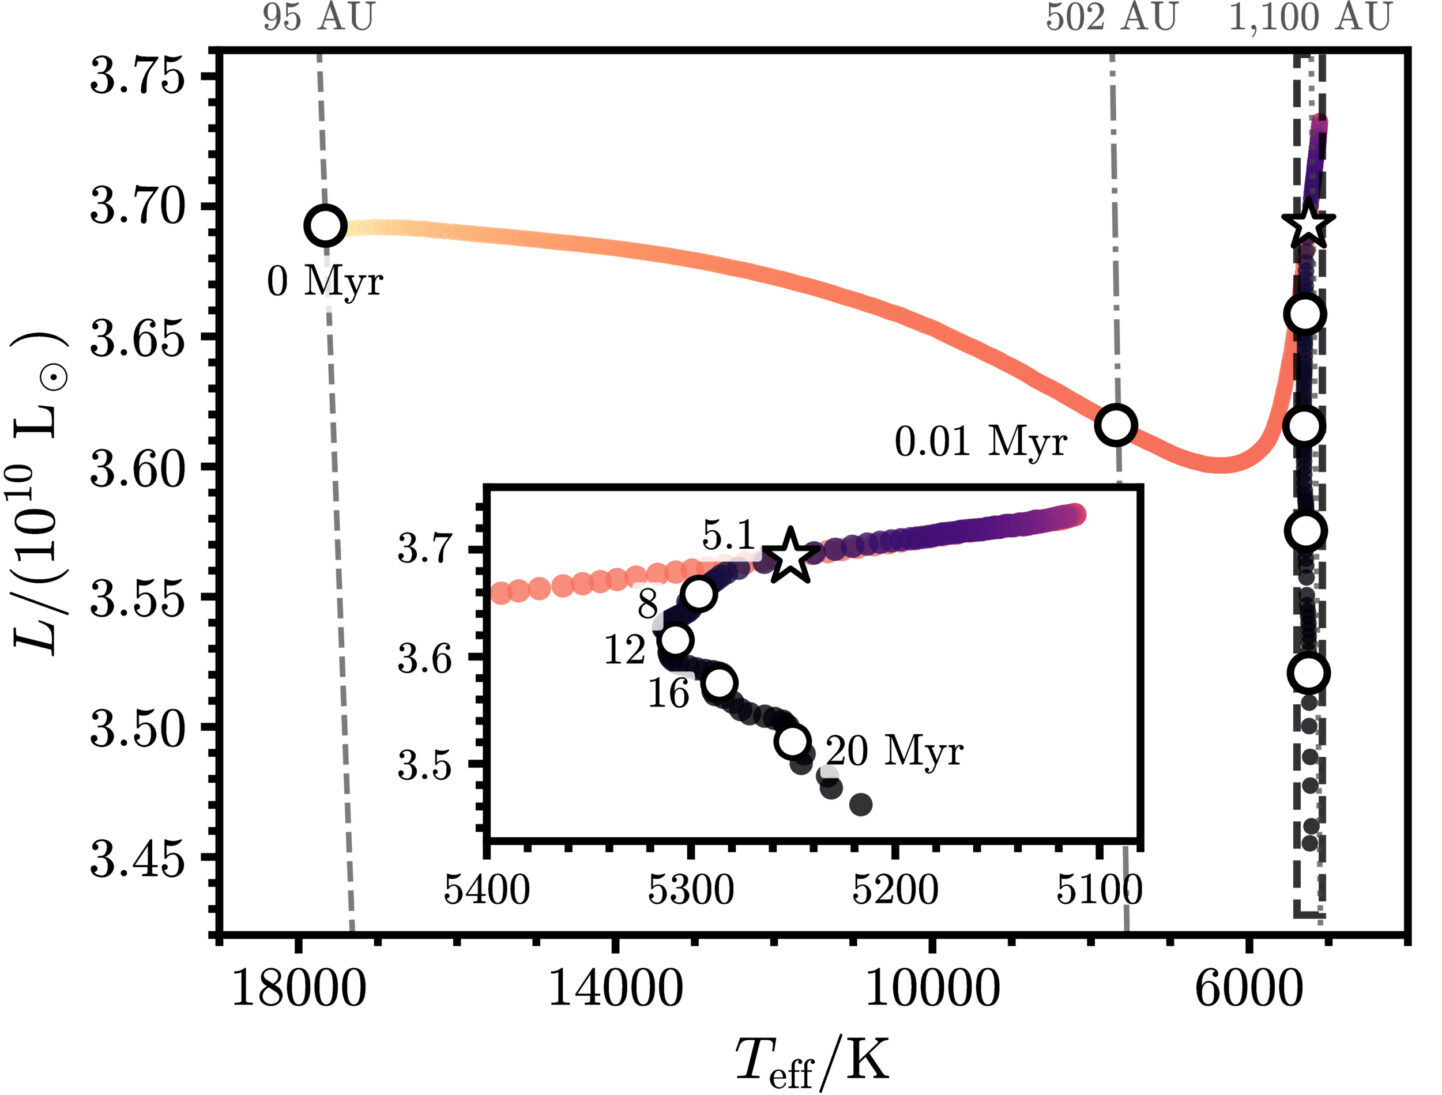
Evolution of a theoretical quasi-star model on a Hertzsprung–Russell diagram. [Modified from Santarelli et al 2026]

Seeking to compare quasi-star evolutionary models to JWST observations of little red dots, Andrew D. Santarelli (Yale University) and collaborators developed a modeling framework to simulate quasi-star evolution. In this framework, a quasi-star is modeled as a black hole at the core of a massive star that accretes material from the stellar envelope over its lifetime. The authors computed models for a range of initial masses and tracked the evolution of the quasi-stars, predicting luminosities, temperatures, surface gravities, and lifetimes of these objects.

After a short initial phase of contraction lasting around 10,000 years, the quasi-star spends the rest of its approximately 20–40-million-year lifetime in the “late stage” as the central black hole continues to eat up the surrounding envelope. In the end, the quasi-star becomes a supermassive black hole a million times the mass of the Sun.

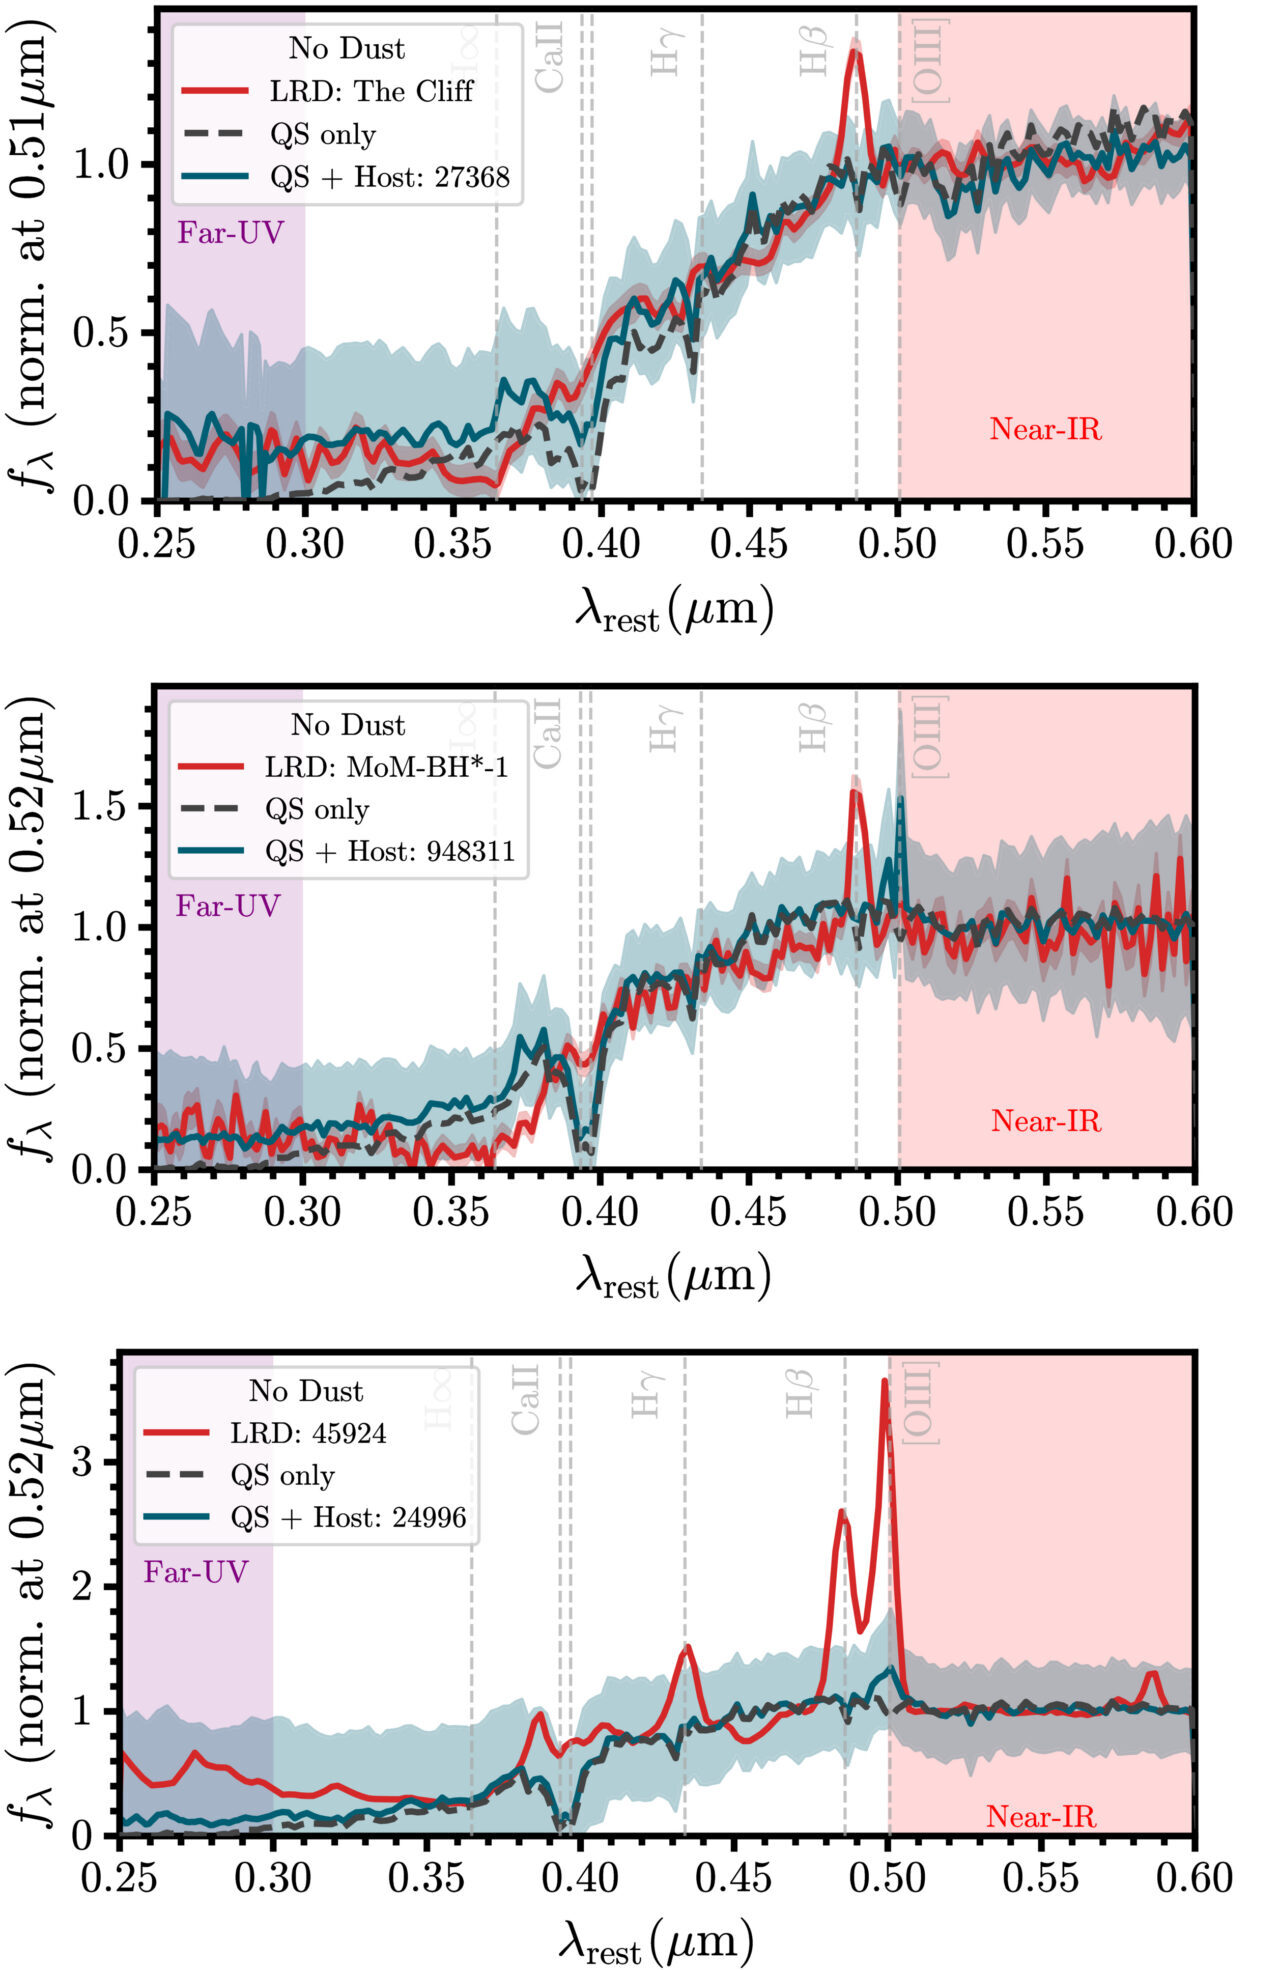
SED comparison of quasi-star + LRDs

Predicted spectral energy distributions of 1 million solar mass, late-stage quasi-stars both alone (black dashed line) and embedded in a host galaxy (solid blue line). Each panel compares the quasi-star to a little red dot observed by JWST. [Modified from Santarelli 2026]

From these models, the authors extracted synthetic spectral energy distributions for late-stage quasi-stars. In comparing the simulated quasi-star spectra to those of three observed little red dots, the authors found that the synthetic quasi-star spectra generally reproduce the main continuum features seen in all three of the little red dots. While the models do not account for specific emission lines, the continuum slopes of the ultraviolet and near-infrared parts of the spectral energy distributions that form the signature “V” shape generally agree with those seen in the three comparison little red dots.
Plausible Progenitors

The results of this study indicate that late-stage quasi-stars can naturally produce the defining continuum features of little red dot spectra. While further modeling is required to trace specific emission line features, the initial modeling presented in this study establishes quasi-stars as plausible progenitors of not only little red dots but also the universe’s first supermassive black holes. 

As the authors noted, the short lifetimes of quasi-stars shown in their models in conjunction with the observed number density of little red dots implies that a significant fraction of supermassive black holes formed through this mechanism. Continued observations of little red dots and advanced modeling of direct-collapse black holes will aid in determining if these peculiar dots are showing off the birth of supermassive black holes in the universe.

Citation

“Evolutionary Tracks and Spectral Properties of Quasi-stars and Their Correlation with Little Red Dots,” Andrew D. Santarelli et al 2026 ApJL 998 L4. doi:10.3847/2041-8213/ae3713

The post Starring in the Early Universe: Black Hole Stars and Little Red Dots appeared first on AAS Nova.

❌