❌

Normal view

New weather model may finally offer a reliable six-week forecast

14 October 2026 at 16:00

Even after decades of meteorological advances, weather forecasting remains infamously difficult. Today’s most trusted models are rarely accurate beyond a two-week window due to a constant cascade of atmospheric and climatic variables. These unpredictable meteorological interactions are the foundations of chaos theory. The interdisciplinary field studies how even the world’s most predictable systems can still produce completely unpredictable results, and was first developed by MIT mathematician Edward Lorenz during the 1970s.

“He came up with this theoretical two-week limit where beyond that, we just can’t predict weather because the noise in the system grows so much that it overwhelms any signal you start with,” Judah Cohen, a climatologist also at MIT, explained.

According to Cohen, many climate researchers continue to view Lorenz’s two-week hurdle as insurmountable. And that assumption has largely proven true for nearly 50 years. Even today’s dynamical simulations and artificial intelligence models begin to break down when attempting to predict conditions two-to-six weeks in the future—a window known as subseasonal forecasting. Nicknamed the “predictability desert,” this range runs into slow-moving, highly variable forces like this year’s super El Niño event. Once those factors enter the equation, forecasting becomes more of a roll of the dice l than anything concrete. However, Cohen has had his suspicions about chaos theory’s limitations.

“I never really believed that completely,” he said. “In theory, the atmosphere can create an infinite number of patterns, but it likes to fall into these favorite patterns over and over again.”

To try and break this forecasting barrier, Cohen and his colleague Lester Mackey have spent years developing an AI system that not only minimizes forecasting errors, but learns from its inevitable mistakes through a method called postprocessing. With postprocessing, the AI improves by comparing the inaccuracies with existing historical data, and then adjusts from there.

Cohen’s team recently submitted three versions of their model featuring the postprocessing system the European Center for Medium-Range Weather Forecasts (ECMWF). Widely known as the world’s best forecasting hub, the ECMWF also hosts seasonal competitions that pit the latest prediction models against one another. Most of these systems have relied on historic climate averages to reach their conclusions, but this was the first time a group submitted a program with postprocessing capabilities.

Cohen and his colleagues reported their results in a study published today in the journal Nature. Their AI postprocessing integration blew the existing forecasting models out of the water. For the two-to-six-week subseasonal window, researchers doubled overall prediction accuracy. Such massive improvements could soon help the farmers and energy providers who already rely on subseasonal forecasts, but the benefits may even save lives.

“It also improves predictions of extreme weather events, whether it’s flooding or cold spells or something else,” said Cohen. “It’s really important to predict both, but extreme events might be the most impactful part of this for society.” 

Many researchers have long presumed subseasonal forecasting to be a dead end, but the latest leap may clear the way to even bigger advances in the field.

“People have questioned if it’s even worth investing in models at all for this time range,” said Cohen. “[But] we consistently beat climatology averages with our models.”

The post New weather model may finally offer a reliable six-week forecast appeared first on Popular Science.

Wavy-shaped homes could limit damage from hurricane winds

9 October 2026 at 20:45

As residents on the northern Gulf Coast brace for quickly strengthening Hurricane Isaias (a Category 3 storm as of Friday afternoon), many are likely eyeing their roofs and walls with nervous anticipation. The Congressional Budget Office estimates hurricane force winds and storm-related flooding collectively cost households in the United States some $34 billion every year. And while rounded corners, sloped walls and reinforced construction can help mitigate some wind damage, these additions are often expensive or impractical for developers looking to cut costs. Engineers at Florida A&M University and Florida State University think they’ve found a resourceful alternative, and it involves embracing the ocean’s own wavy aesthetic.  

For  a study recently published  in the journal Engineering Structures, the team built 3D-printed models of several low-rise buildings with wave shaped walls and roofs and tested them in a wind tunnel. The designs with the deepest waves, (in this case 10 percent of the building’s overall height) cut peak wind pressure near roof and wall corner by up to 60 percent. Those corners and edges are where damaging forces typically concentrate. Surprisingly simple designs like these could become increasingly attractive to develop in the coming years, as more and more communities brace themselves to endure stronger and more frequently occurring storms. 

“These nonconventional building shapes reduce the damage from worst-case severe weather scenarios,” Pedro Fernández-Cabán, a study co-author and Florida State University civil engineer, said in a statement. “It’s another tool for engineers and designers to protect against wind damage.” 

Bigger waves means better protection 

To test their idea, Fernández-Cabán and his colleagues started by 3D printing various models of low-rise buildings. Some of the buildings had wavy walls and roofs, while others were built with a more conventional baseline model with flat, straight surfaces. They made three wavy versions, with wave amplitudes of 5 percent, 7.5 percent, and 10 percent. The amplitude  measures the wave’s size in proportion to the building’s overall height in feet. So, for a 20-foot-tall building, a 10 percent amplitude would mean waves that extend about 2 feet.​​​​​​​​​​​​​​​​

Once the models were printed, the team then put them into a wind tunnel at the university. They measured wind pressure data on their surfaces as wind pelted the modelers from various directions. All of the wave-roofed models experienced reduced wind load compared to the flat version. The deepest wave model performed the best, reducing peak wind pressure near roof and wall corners by between 40 and 60 percent compared to the flat version. At least in theory, that means a building with that design could see significantly less damage when exposed to hurricane-force winds.

The diagram shows how curving structures can help prevent more destructing vortices from forming. Image: Pedro Fernández-Cabán.

The paper includes a useful diagram (above) that breaks down why this wavy design works. When wind flows over a flat surface like a roof, it separates at the leading edge and from a single large, swirling vortex. That creates a zone of low pressure, while higher pressure underneath the building pushes out against the surface. That leads to a suction like effect that, in extreme scenarios, can peel roofs off of a building. Over a wavy surface, the wind skips along like a stone across a lake, forming a series of smaller swirls instead of one big one. That disruption to the wind can prevent high-suction picks from forming. The result is a building that with less exposure to the strongest, points many damaging wind forces than a flat one. 

“Changing a building’s shape can significantly reduce the intensity of wind forces it has to withstand,” Fernández-Cabán said. 

The researchers caution that this study focused specifically on wind pressure on the model’s surfaces. They’re now running additional experiments to better understand how wind flows around the wavy structures and plan to use computer modeling to fine-tune the wave patterns and test other shapes. If that work bears out similar to  the early results, it could make wavy walls and rooms all the more attractive to architects and engineers looking for simple solutions to protect buildings in storm prone areas.

The post Wavy-shaped homes could limit damage from hurricane winds appeared first on Popular Science.

Disaster Survivors Sticking Together

15 September 2026 at 19:19
We found grace, humanity and friendship in the stories of disparate Americans hit by climate chaos.

© Philip Cheung for The New York Times

Debris from a home destroyed in the Eaton fire in Altadena, Calif., in 2025.

3 myths about the weather

12 September 2026 at 20:04

Everyone complains about the weather, the old line goes, but nobody ever does anything about it. But it’s not exactly true, is it? People have always done something about the weather—mostly by trying to predict it, then arranging our lives around the forecast.

It makes sense, then, that we’ve picked up a few ideas about outside conditions that don’t quite hold up. From cold weather making you sick to red skies in the morning, here are some common beliefs about the weather that aren’t entirely true. 

Cold weather doesn’t cause colds

You’ve heard someone say it, or maybe you’ve said it yourself: “Put on a jacket—you’ll catch a cold.” The problem is that cold weather doesn’t cause colds—at least, not directly. 

Manal Mohammed, a Senior Lecturer in Medical Microbiology at the University of Westminster, wrote about this for The Conversation. “Cold temperatures do not cause infections by themselves,” she concludes. “Instead, they shape the biological, environmental and social conditions that allow respiratory viruses to thrive.”

For example: People spend more time inside during cold weather, which can help viruses spread. These indoor spaces tend to be heated, meaning the humidity is low, meaning nasal passages are dry. This makes it more likely that you’ll catch a virus. And, according to Johns Hopkins Medicine, the fact that school is in session during the winter is also a factor. 

There are physiological factors as well, according to Mohammed. “Breathing in cold air lowers the temperature inside the nose and airways, which can trigger vasoconstriction,” she writes. She adds that this can weaken the local immune defenses in the lining of your nose and airways. But that’s not the same as a direct causal link. 

So, while it’s true that you’re more likely to catch a cold or the flu during the winter, that isn’t directly caused by your failure to wear a jacket. It’s the viruses, not the temperature, that make you sick. 

Lightning can strike the same place twice

“Lightning hitting the same place twice” is a cultural shorthand for something unlikely happening. But is it accurate? Kind of. It’s true that, all things being equal, it’s unlikely for lightning to strike the same place twice. But all things aren’t equal. 

Lightning tends to hit the highest nearby object, which is why it’s a bad idea to go under a tree during a lightning storm. In big cities this means the largest buildings are hit frequently. New York City’s Empire State Building is hit, on average, 25 times per year, according to New York City Emergency Management. The CN Tower, north of the border in Toronto, is hit three times as often—75 times per year according to the tower’s website. This isn’t to say these buildings are unsafe—both have lightning rods, which give the current a safe path to the ground. It’s just that they’re hit multiple times a year. 

Lightning over New York City
Lightning over New York City. Image: Getty Images BradNYC

So lightning not only can hit the same place twice, but does so pretty often. Although, according to NOAA, it doesn’t always hit the highest point—so there’s truth to the idea that lightning is hard to predict. 

Red skies really can predict the weather

You’ve heard it: “Red sky at night, sailor’s delight; red sky in the morning, sailors take warning.” The idea that the color of the sky can predict the weather is really old—it’s referred to in the Bible (Matthew 16:2-3, if you want to look it up). But is there any science behind this? 

Yes, it turns out, but it doesn’t work everywhere. To understand why, we need to explain a few things. First: What causes red skies? “A red sky appears when dust and small particles are trapped in the atmosphere by high pressure,” according to the UK Met Office. “This scatters blue light leaving only red light to give the sky its notable appearance.” 

A red sky means there’s high pressure between you and the direction of the sun. The sun sets in the west and rises in the east. So, a red sky at night generally means there’s high pressure to your west; a red sky in the morning means there’s high pressure to the east of you. 

red skies in the morning
Red skies can predict the weather…in some places. Image: Getty Images Richard Newstead

But why does that predict the weather? Because, in the mid-latitudes, the wind generally blows from the west—this is called the prevailing westerlies. High pressure means stable, dry weather. A red sky at night means the high pressure is to your west, which the westerlies will bring to you; a red sky in the morning means the high pressure is to your east, and the wind will blow it away from you. 

But, again, that only works in the mid-latitudes, where the prevailing westerlies are the norm. This region is between 30 and 60 degrees in both the southern and northern hemispheres, a region that includes most of Europe, the continental United States, southern Australia, and Japan, among other places. So, if you’re in one of those places, a red sky in the morning actually does point to a change in the weather. If you’re in the tropics, though, the weather tends to build up locally rather than arriving from somewhere upwind, meaning the colors at sunrise and sunset aren’t as useful for predicting it. 

So this isn’t entirely a myth—there’s truth to the saying. It just doesn’t work everywhere on Earth. 

The post 3 myths about the weather appeared first on Popular Science.

Extreme weather reshapes how soils store and release carbon

11 September 2026 at 11:17

Beneath every step we take, soils hold one of the planet’s largest reservoirs of carbon, a vast, slow-moving bank of organic matter that quietly regulates how much of the world’s carbon stays locked away and how much escapes into the atmosphere as greenhouse gas. Now a sweeping new review warns that climate-driven extremes, droughts, floods, and wildfires, are rewriting the rules of that subterranean economy in ways that conventional models and land-management practices have not yet caught up with. The analysis, led by environmental scientist Nanthi Bolan of the University of Western Australia and colleagues, including a corresponding authorship by Bolan himself, synthesizes a substantial body of global evidence on how extreme weather reshapes carbon inputs to soil, microbial processing, erosion, and the sequestration of carbon that underpins soil health, water retention, nutrient cycling, and agricultural productivity.

The work, published in the journal Carbon Research, is notable for the scale of its underlying evidence base. On 14 January 2026, the authors searched Google Scholar, PubMed, and Web of Science using terms spanning climate change, extreme weather, soil carbon, microbial activity, decomposition, erosion, dissolved organic matter, and leaching. The initial sweep returned 14,218 records; after removing duplicates and screening for eligibility, 3,754 articles remained for bibliometric and qualitative analysis. From those, 187 publications were selected for detailed synthesis based on relevance, methodological rigor, and the substantive quality of their findings. Keyword co-occurrence patterns were mapped with VOSviewer, a bibliometric tool that reveals the intellectual architecture of a research field. The result is a critical review grounded in structured literature screening rather than new experimental data, but its synthesis offers one of the most comprehensive maps yet of how extremes rearrange the soil carbon cycle.

The review’s central finding is that no two extremes act alike. Drought, the most widespread disturbance, operates largely through the plant side of the equation. When rainfall fails, photosynthesis slows, plant biomass production falls, and the total flux of carbon entering soils through roots, residues, and litter declines. There is a nuance here: under moderate water stress, plants may temporarily shift a greater proportion of their fixed carbon belowground, investing in roots to chase moisture. But prolonged drought overwhelms that compensatory response. Microbial biomass shrinks, litter decomposition stalls, and the living engine of the soil carbon cycle idles. Then comes the deceptive twist: when rain finally returns, rewetting triggers a rapid pulse of carbon dioxide as starved soil microbes seize upon the accumulated substrates left behind by months of suspended activity. That post-drought CO₂ flush, the review emphasizes, can erase much of the apparent “savings” that accumulated during the dry period. Across the assembled evidence, repeated and multi-year drought was consistently associated with declining soil organic carbon, with grasslands and arable croplands showing particularly pronounced losses, ecosystems that happen to anchor much of the world’s food production.

Flooding tells the opposite story, but it ends in many of the same places. Water saturation chokes off oxygen diffusion through soil pores, forcing microbial metabolism into anaerobic pathways. That shift changes everything downstream. Prolonged waterlogging can drive the chemical reduction of iron oxyhydroxides, minerals that in oxygenated conditions act as microscopic glues binding organic carbon to soil particles. When those minerals dissolve, the carbon they held is released as dissolved organic carbon, which can then be stripped away by erosion and leaching and exported to rivers, lakes, and ultimately the ocean. The review stresses, however, that flooding is not unambiguously a carbon loss story. Wetlands and other periodically inundated ecosystems can accumulate and retain enormous carbon stocks precisely because water constrains decomposition. Whether a flood event releases carbon or banks it depends on the interplay between plant inputs, oxygen availability, and hydrological transport, a delicate balance that shifting rainfall regimes are actively destabilizing.

Wildfire is the most dramatic and immediately visible of the three forces, and its effects cascade on multiple timescales. Combustion directly strips vegetation, litter, and soil organic matter, transferring carbon to the atmosphere in hours. But fire also rearranges the physical and biological landscape of the soil in subtler ways: it can increase erosion by removing protective ground cover, alter soil wettability in ways that change hydrological behavior, restructure microbial communities, and expose previously protected carbon, once shielded inside aggregates or mineral associations, to fresh decomposition. There is a paradoxical bright spot. Pyrogenic carbon, the charcoal-like residue of incomplete combustion, is chemically recalcitrant and can persist in soils for centuries or millennia, functioning as a long-term carbon sink. Whether a fire leaves a landscape as a net carbon source or stabilizes some of its carbon in pyrogenic form depends on fire severity, soil moisture, fuel load, ecosystem type, and the trajectory of post-fire recovery. The review is clear that this balance cannot be predicted from fire alone; it is contingent, site by site, on conditions that vary widely across the globe.

Perhaps the most consequential theme running through the synthesis is that carbon responses cannot be inferred from the type of extreme event alone. Land use, soil mineralogy, hydrology, salinity, vegetation composition, microbial community makeup, and the timing of events within a season all determine whether carbon ends up stored, mobilized, or released. Iron and aluminum oxyhydroxides and clay minerals, for instance, provide mineral protection that can shield organic matter even under stress, while sandy or low-clay soils offer little such refuge. Managed croplands respond differently from native grasslands; saline coastal soils behave differently from acidic forest soils. And compound events, drought followed by wildfire, or alternating drought and flooding in rapid succession, may produce effects that are qualitatively different from those of isolated disturbances, as when a dried landscape burns more intensely, or when post-fire soils, stripped of vegetation, wash away in the first heavy rain. The review argues that the climate science and soil science communities have largely studied these disturbances one at a time, while the real world increasingly delivers them in combination.

The implications for climate mitigation and adaptation are substantial. Soil organic carbon is frequently invoked in national climate pledges and voluntary carbon markets as a bankable sink, yet the review suggests that the security of that bank depends heavily on how often and how severely extremes strike. If multi-year droughts steadily drain carbon from grasslands and croplands, or if fires repeatedly reset accumulation cycles, the effective permanence of soil carbon storage becomes far more fragile than many accounting frameworks assume. Conversely, protecting and rebuilding soil carbon delivers benefits well beyond climate: it improves water retention in drought-prone regions, supports nutrient cycling, stabilizes soil structure against erosion, and sustains the microbial diversity on which fertility depends. Carbon stewardship, in other words, is not separable from food security or ecosystem resilience; it is the same problem viewed from different angles.

The authors are candid about the limits of the current evidence base. The article does not report newly generated datasets and does not present a dedicated limitations section, and its conclusions rest on a qualitative synthesis of selected publications. Consequently, they call for improved and more consistent evidence across soil types, land uses, and both terrestrial and aquatic environments, and across multiple temporal scales, from the instantaneous CO₂ pulse after rewetting to the multi-decadal trajectory of carbon storage. Standardizing measurements of carbon pools, microbial functions, and event intensity, they argue, would make results comparable across ecosystems and enable more confident generalization, something the field currently struggles to achieve given heterogeneous methods and site-specific reporting.

Looking forward, the review sketches a research agenda that is as technologically ambitious as it is mechanistically focused. The authors recommend integrating high-resolution remote sensing with ground observations, advanced spectroscopy, molecular analyses, and integrated modeling to track carbon as it moves through soils and into waterways. They single out several priorities: characterizing microbial genomic and functional diversity as it responds to stress, quantifying carbon stoichiometry, probing the interactions between organic matter and iron and aluminum oxyhydroxides, understanding clay-mineral protection mechanisms, tracking long-term storage outcomes, and systematically studying the sequencing of compound extreme events. Each of these threads addresses a gap in the mechanistic chain that links a weather event in the atmosphere to a molecule of carbon, stabilized or released, in the soil.

What emerges from the review is a picture of the soil carbon cycle not as a stable background process but as a dynamic, contested system whose behavior under climate extremes is far less predictable than once assumed. The same storm that floods a rice paddy and exports carbon to a river delta may, a few hundred kilometers away, end a drought and briefly green a grassland, with opposite consequences for the atmosphere. As extremes grow more frequent and more compound, the review makes the case that understanding, and safeguarding, the carbon held beneath our feet will require science that is as interconnected and as restless as the weather itself.

Keywords

soil organic carbon, extreme weather, drought, flooding, wildfire, carbon sequestration, microbial activity, dissolved organic carbon, erosion, pyrogenic carbon, climate change, soil health

Subject of Research: Impacts of climate change-induced extreme weather events (drought, flooding, wildfire) on carbon dynamics in soil

Article Title: Impacts of climate change-induced extreme weather events on carbon dynamics in soil

Article References: Bolan, N., Messiga, A. J., Sharma, S., Mukherjee, S., Bolan, S., Salehin, S. M. U., Rupngam, T., Rajan, N., Zhang, T., Yang, Y., Jagadesh, M., & Siddique, K. H. M. (2026). Impacts of climate change-induced extreme weather events on carbon dynamics in soil. Carbon Research, 5(1), Article 58. https://doi.org/10.1007/s44246-026-00300-5

Image Credits: AI Generated

DOI: 10.1007/s44246-026-00300-5

Keywords: adaptation of land management practices to climate extremes, challenges to conventional soil carbon models, Climate change impacts on soil carbon storage, effects of droughts and floods on soil microbial activity, global evidence on soil carbon dynamics, implications for greenhouse gas emissions, influence of extreme weather on nutrient cycling and water retention, resilience of soil carbon reservoirs to climate, review of climate-driven soil carbon processes, soil erosion and carbon loss due to extreme weather, soil health and agricultural productivity under climate stress, wildfire influence on soil organic matter

One of Earth’s Driest Deserts Just Turned White

11 September 2026 at 11:16
Atacama Desert SnowIn August 2026, a series of powerful winter storms transformed parts of northern Chile’s Atacama Desert, covering the famously dry landscape in an unusual layer of snow. Snow is not unheard of in the Atacama. Significant falls occurred in 2025 and, before that, in 2011. But one of the August 2026 storms stood out because [...]

Puerto Rico Went From No Drought to Extreme Drought in Just Months

11 September 2026 at 00:17
Puerto Rico Drought 2026Puerto Rico went from no drought to widespread extreme drought in just months as rainfall collapsed and water shortages spread. Puerto Rico usually enters its wet season in May. In 2026, however, the expected rains largely failed to arrive through late August, leaving much of the U.S. territory in drought. The prolonged dry spell has [...]

New Mexico’s Largest Reservoir Was Nearly Full. Now It’s at 1.4%

10 September 2026 at 02:28
Elephant Butte Reservoir Runs LowNew Mexico’s largest reservoir plunged to just 1.4 percent capacity in July 2026, revealing the dramatic impact of prolonged drought and record early snowmelt. NASA is using satellite data to help water managers understand the shrinking supply and prepare for future shortages. When astronaut John Glenn remarked on the landscape below him while orbiting Earth [...]

Record-breaking rain in California was caused by abnormally high temperatures on the other side of the world, study finds

Abnormally high temperatures on the Tibetan Plateau triggered two catastrophic rainfall events halfway around the world in California and nearby states in early 2017 and 2023, a new study reports.

This is the first time that researchers have identified this link, known as a climate teleconnection. The results could improve forecasts of extreme weather in the western U.S., which, in turn, could improve warnings for coastal communities and potentially save lives as well as billions of dollars in property damage, the study's authors say.

In December 2016 and February 2023, the Tibetan Plateau was warmer than usual for these times of the year. Roughly one month after each of these hotspots appeared, parts of California, Nevada, Oregon, Utah and Arizona received record-breaking precipitation, causing a total of around $6.6 billion in damage, according to the study, and killing at least nine people.

State-of-the-art forecast systems, which rely heavily on ocean conditions like El Niño, failed to predict this extreme rainfall, said study first author Yongkang Xue, a distinguished professor of atmospheric and oceanic sciences at UCLA. The record precipitation occurred during La Niña years, which are typically associated with dry conditions in California and neighboring regions, further complicating the picture.

"This study provides the first evidence from observational data analysis and model simulations that abnormally high early-winter temperatures on the Tibetan Plateau led to stronger atmospheric rivers along the U.S. Pacific Coast, driving heavy regional precipitation," Xue told Live Science in an email.

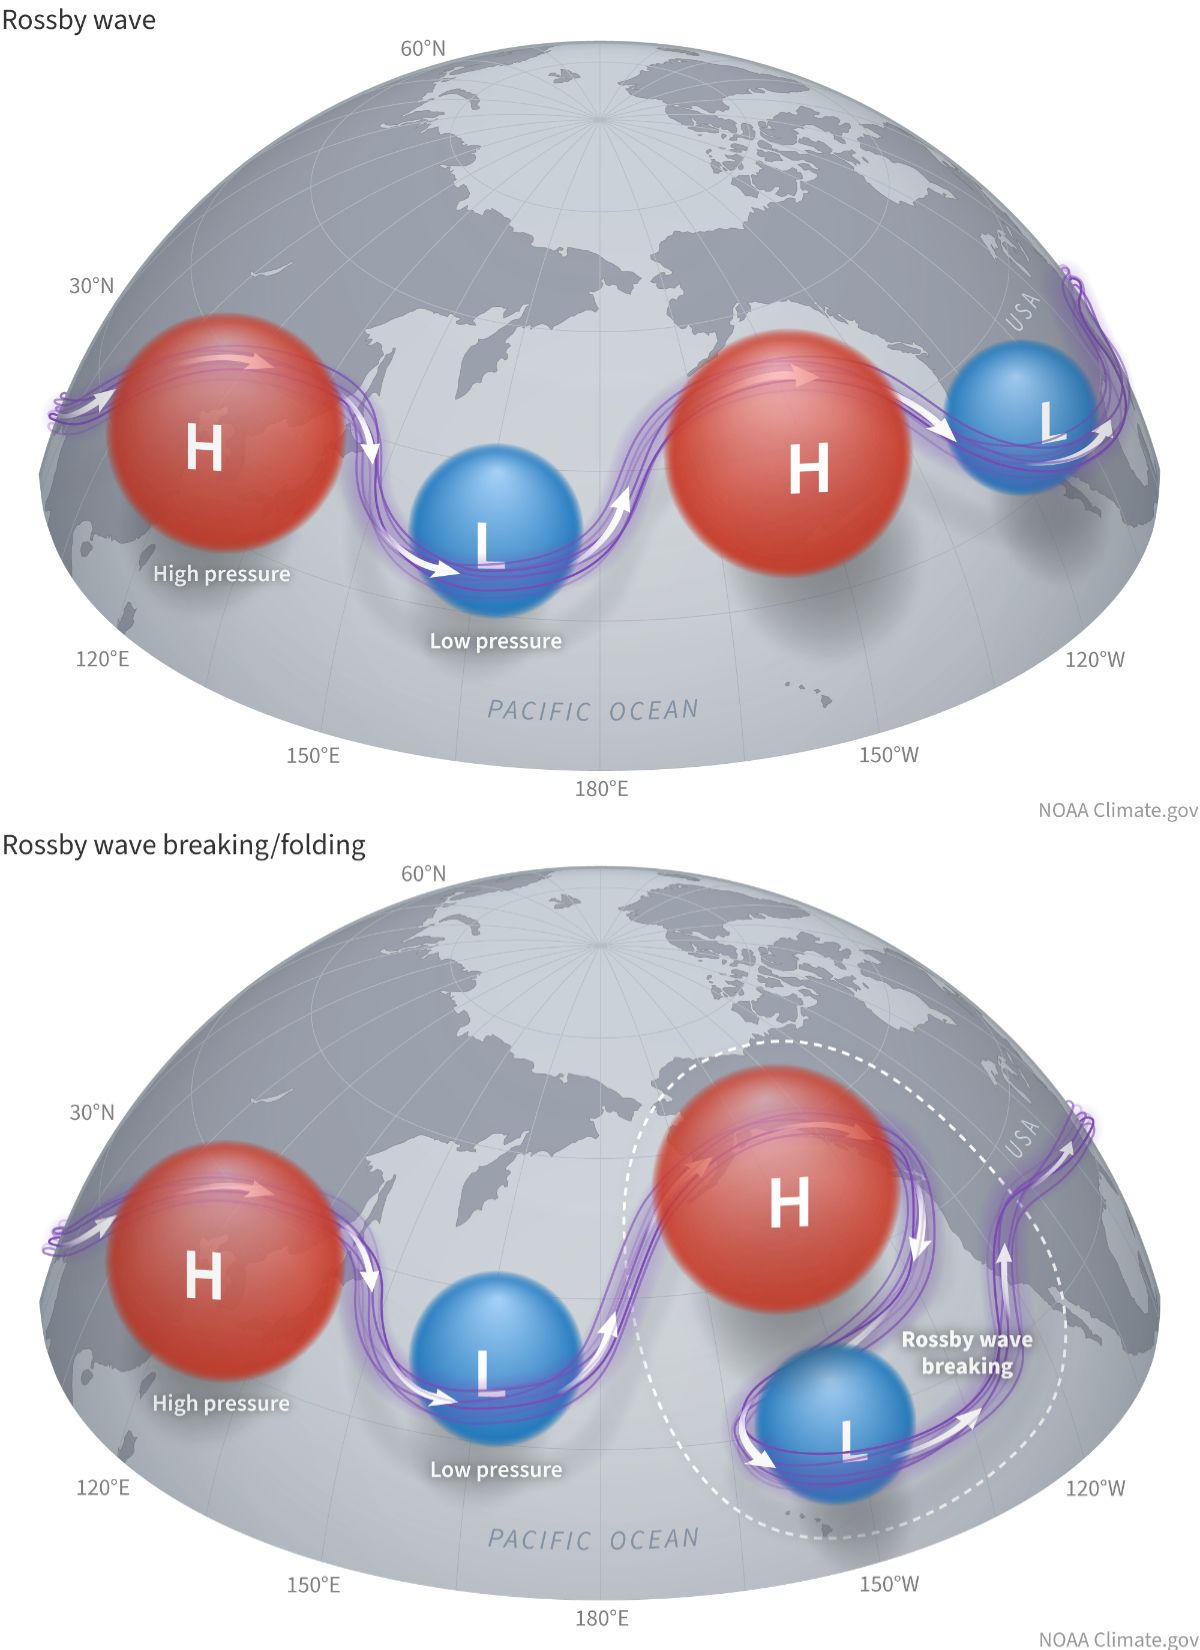
Atmospheric rivers are narrow, elongated corridors of intense water vapor transport. They are key drivers of precipitation and floods in the western U.S., and in this case, they interacted with giant waves in Earth's atmosphere, called Rossby waves, to produce devastating rainfall in the winters of 2017 and 2023.

As temperatures increased over the Tibetan Plateau in late 2016 and early 2023, a strong gradient formed with the regions north and south of the plateau. This generated an atmospheric disturbance that propagated eastward along the jet stream via Rossby waves, triggering what is known as a Rossby wave train between the Tibetan Plateau and the Rocky Mountains, Xue said.

Diagram of a Rossby wave and a Rossby wave breaking over the Northeast Pacific Ocean.

Rossby waves are waves in Earth's atmosphere that wrap around high- and low-pressure systems. When there is an atmospheric disturbance, it can propagate in what is known as a Rossby wave train. (Image credit: NOAA Climate)

A Rossby wave train is a series of waves traveling in the same direction and at regular intervals around alternating high- and low-pressure systems. As the wave trains initiated over the Tibetan Plateau reached the northeastern Pacific Ocean, they suddenly broke, and this supercharged the weather above California and adjacent states, Xue explained.

"Over the eastern Pacific, the wave breaks — much like a towering ocean wave crashing near the shore," he said. "This wave-breaking mechanism reduces static stability and significantly intensifies atmospheric rivers, ultimately driving extraordinary, heavy precipitation along the West Coast."

The findings, published Wednesday (Sept. 9) in the journal Science Advances, are based on complex modeling and analyses of precipitation and surface temperature data, among other observations. The results are part of a new body of research examining the influence of land temperatures on weather patterns, and this is the first study of a winter season, Xue said.

The analysis is a "very specific and impactful case study," said Matthew Huber, a professor in the Department of Earth, Atmospheric, and Planetary Sciences at Purdue University in Indiana, who was not involved in the research. The results build on the well-established idea that extra heat on a mountaintop affects Rossby waves almost as if the mountain had suddenly grown, Huber told Live Science in an email.

Large mountains and plateaus generate waves in the jet stream that are thousands of miles long — "so long that we also call them planetary waves," Huber said. An increase or drop in temperature so high up above sea level adds or subtracts from the atmospheric disturbance that already exists due to the elevation.

"You can imagine the waves in the jet are kind of like a motorcycle rider going off a jump," Huber said. "How far and how high they jump depends on how fast they are going and how big a ramp they are going over."

The models replicated the extreme weather with surprising accuracy, raising hopes that the Tibetan Plateau could be integrated into early warning systems for the western U.S., Xue said. "As similar, though less severe, events become more [frequent] and extreme weather escalates globally, understanding this teleconnection allows forecasting agencies to better warn coastal communities of impending extreme conditions," he said.

Huber agreed that the results could help to better prepare for weather hazards. "This study shows that accurate predictions of weather events in the U.S. West are very sensitive to tiny changes very far 'upstream' and these upstream features are identifiable and traceable," he said.

Blackout risk rises as heatwave stresses largest US electric grids

2 September 2026 at 13:16

US energy department warns of potential for outages in PJM Interconnection, serving 67 million from DC to Chicago

The risk ⁠of power outages ⁠is expected to ​escalate across a broad swath of the United States on Wednesday as intense heat will test the capacity of electricity supplies ⁠serving millions of homes and businesses from the midwest through the mid-Atlantic.

The US Department of Energy warned of the potential for heightened blackout risks in ⁠the PJM Interconnection, the largest US electric grid, which serves 67 million people in ​a territory stretching from Washington DC to ‌Chicago.

Continue reading...

© Photograph: Nam Y Huh/AP

© Photograph: Nam Y Huh/AP

© Photograph: Nam Y Huh/AP

New fabric stays cooler than white cotton—and it’s purple

31 August 2026 at 18:08

With the dog days of summer nearing an end, many are counting down the days until they can give the darker clothes in their wardrobe a bit more love. Though plenty of people flout seasonal rules and wear all-black year-round, light-colored fabrics are typically the better choice during  hotter months because they reflect sunlight and can help keep us cool. This heat-reflecting logic is also partly responsible for the old decree, “don’t wear white after Labor Day!” But what if fashion choices weren’t dictated by the weather? A team of researchers from China and Australia believes they may have cracked that code, and it starts with a rich purple fabric.

The researchers, hailing from Zhengzhou University and Adelaide University, set out to create a dark-colored material that was also effective at keeping people cool. They created an entirely new fabric made of a purple metal-organic framework and zinc oxide nanoparticles. The metal-organic framework which absorbs green light from the sun and gives the purple color, while the zinc oxide nanoparticles which reflect sunlight and radiate heat away. 

The material performed exceptionally well during testing. It reflected an average of nearly 88 percent of sunlight and stayed up to 11 degrees Fahrenheit cooler than conventional purple cotton outdoors. It was notably even 7.6 degrees cooler than white cotton. In a world where deadly hot summers are becoming more common, research suggests materials like this could provide outdoor workers with some much-needed relief. 

“We have traditionally had to make a choice between cooling performance and appearance,” Adelaide University materials engineer Jun Ma and study co-author said in a statement. “Our research shows that we can have both. We can make a fabric that looks purple, but at the same time reflects most of the sun’s energy and releases heat very efficiently.”

The team published their findings in the journal Small. 

Why do light colors feel cool?

Generally speaking, lighter colors are better bets for staying cool because they reflect more sunlight. White or unpigmented materials are the best at beating heat, whereas dark black material will feel the hottest.  This same idea applies to building and construction materials as well. Purple, while obviously dark, is also a unique choice for the research because it strongly absorbs green light, which is one of the strongest parts of the solar spectrum. 

Caveats are in order, though. Color isn’t the only factor in staying cool. Clothing material and fit are just as important, if not more so. Loose, breathable garments like cotton or linen allow far more airflow than tighter clothing. That’s why Bedouin nomads in the North African desert can wear mostly all black without collapsing from heat exhaustion. Still, all else being equal, lighter colors make for a cooler experience.

Making a cooling, purple fabric 

To create the fabric, the team combined a purple ZIF-67 metal-organic framework with zinc oxide nanoparticles. Using electrospinning, they spun the mixture into purple thermoplastic polyurethane fibers, which were then woven into fabric. They then cut the material into two-inch squares and exposed them to direct sunlight on a sunny day in Zhengzhou, China, alongside control squares of standard white and purple cotton.

The revised material reflected an average of 87.6 percent of solar radiation. In terms of overall cooling, at least in these tests, it was a resounding success. After a full day baking in the sun, the fabric remained 7.6 degrees cooler than white cotton and 11.2 degrees cooler than traditional purple cotton. The fabric also  achieved these thermal gains without sacrificing practical performance, and  was flexible, stretch-resistant, and highly breathable, allowing moisture to evaporate effectively rather than trapping sweat. It also maintained both its rich color and cooling properties after 50 wash cycles. Furthermore, UV accelerated-aging tests (simulating roughly 108 days of intense sunlight exposure) showed that the  cooling performance did not degrade over time.

Using science to stay cool in a warming world 

It’s still early in the process, but the team believes their new approach could make darker-colored materials less off-putting during warmer weather. While that’s potentially great news for all the goths out there, the researchers emphasize far more practical applications as well. These refined fabrics could be used to make workwear for construction workers, farmers, and others who endure long hours baking in the sun. For outdoor laborers, even modest cooling relief can make a life-saving difference.

“The long-term opportunity is to move beyond the idea that cooling fabrics have to be white,” Adelaide University Chemical Engineer PhD candidate and paper co-author Yangzhe Hou said in a statement.

This summer’s heat has moved from unpleasantly hot to deadly in many parts of the world, and it’s likely a sign of more to come. Both the fashion industry and the general public are already adapting to this brutal new reality. A 2022 New York Times report noted a marked rise in sales of shorts and sandals alongside a sharp decline in fleece and heavy outerwear in recent years, a shift attributed in part to rising global temperatures. Similarly, recent efforts to normalize wearing shorts in office settings and the gradual removal of neckties reflect a workplace culture adjusting to a hotter climate.

The new purple fabric research also joins a now lengthy list of other attempts to apply science and technology to make clothing cooler. An assortment of (often more expensive) cool-tech clothing brands with names Coolcore and Iso-Chill have gained popularity, promising to beat the heat. Kontoor Brands, which owns blue-jean giant Wrangler, even made an Insta-Cool shirt that used phase-change material initially used by NASA astronauts to stay cool. 

The post New fabric stays cooler than white cotton—and it’s purple appeared first on Popular Science.

Never-Before-Seen Vortices Are Swirling Across the Sun

Tiny Vortices on the SunThe world’s largest solar telescope and advanced computer simulations revealed vortices that are reshaping our understanding of the Sun. Across the Sun’s visible surface, hot plasma is constantly rising, cooling, and sinking. At the edges of these churning regions, researchers have now resolved tiny swirling structures that may help explain how the Sun twists, stores, [...]

NASA’s PUNCH Mission Cut Solar-Storm Arrival Uncertainty to 30 Minutes

10 August 2026 at 20:00

Forecasting a solar storm is a little like watching a wave leave a distant coast and trying to guess when it will reach the beach. Scientists can see a coronal mass ejection (CME) leave the Sun, but its speed and shape can change as it crosses space. By the time it reaches Earth, the warning […]

The post NASA’s PUNCH Mission Cut Solar-Storm Arrival Uncertainty to 30 Minutes appeared first on Curiosmos.

Starlink Satellites Reveal a Hidden Atmosphere 300 Miles Above Earth

9 August 2026 at 19:38
Modern Space Telecommunications Satellite Orbiting EarthSatellites designed to provide internet service are now serving an unexpected second purpose: helping scientists map the nearly invisible atmosphere at the edge of space. Researchers at Kyoto University have used orbital changes from about 1,200 Starlink satellites to map Earth’s thermosphere, a thin and difficult-to-observe region of the upper atmosphere. Their analysis produced the [...]
❌