Glowy oils, tinted creams, misty sprays, chalky sticks, lightweight gels. Like many people, my pool bag is filled with many types of sunscreen. But all use the same sun-shielding chemicals. In fact, the allowed ingredient list for U.S. sunscreens hasn’t changed in 20 years — until now.
“I think we should all be super excited,” says Tanya Hathaway. She’s a dermatologist who specializes in treating high-risk skin-cancer patients. Hathaway works at the Fred Hutchinson Cancer Center in Seattle, Wash.
Bemotrizinol has many benefits. It lasts longer than other sunscreen ingredients. It won’t get quickly absorbed into the bloodstream. And it’s very good at blocking those rays of the sun that age skin.
Sunscreens in Europe have used the chemical for more than 25 years, Hathaway notes. More recently, it’s been approved in Japan, Canada, Australia and many other places.
There are some sunscreen ingredients used elsewhere that still are not allowed in U.S. products. Bemotrizinol’s approval could open U.S. doors for some of these. It’s “a great first step,” Hathaway says.
A new chemical sunscreen
Sunscreens use a few tricks to protect our skin from the sun’s rays. Physical sunscreens rely on minerals such as titanium dioxide and zinc oxide. These create a coating that reflects sunlight, like a mirror. But they can leave a white sheen on the skin. Just think of a lifeguard’s nose, says Jennifer Stein. She’s a dermatologist at NYU Langone Health in New York City.
Those zinc and titanium products also “don’t rub in so well,” she notes. “And if people don’t like the way their sunscreen smells or feels, they’re not going to use it.”
Non-mineral sunscreens often rub in a bit better. They often use chemicals such as avobenzone (Ay-vah-BEN-zoan) and oxybenzone to absorb the sun’s rays. But these molecules are not very stable. They start to break down when hit by sunlight, Stein says. That’s not ideal for something that’s designed for use in the sun.
Because bemotrizinol is more stable, people may not need to apply sunscreens with it as often. This new ingredient also is good at blocking ultraviolet A1 (UVA1) radiation. That’s a type that gets deep into the skin. Over time, UVA1 can make skin wrinkly, loose and spotted, Hathaway says.
Current U.S. sunscreens do a good job of blocking UVB, which causes sunburns. But U.S. sunscreens had fewer options for blocking UVA, she says. Bemotrizinol “really expands that UVA spectrum of coverage.”
You might have seen influencers on TikTok or Instagram making DIY sunscreens. Often, they will call the ingredients in commercial brands “toxic.” Sunscreen skepticism on social media is nothing new, Stein says. Patients who avoid sunscreen often worry about chemicals passing through the skin.
That can happen with things like avobenzone and oxybenzone. They may even get into your blood, Stein says — but only if “you apply them to large areas of the body repeatedly throughout the day.” Even so, people shouldn’t fear them. Hathaway says no studies have shown that U.S. sunscreen ingredients are unsafe when used at current levels.
Bemotrizinol, which is a big molecule, is less likely to pass through skin than these other chemicals. It’s “too big to squeeze through the skin cells to get down into your bloodstream,” Stein says.
FDA classifies bemotrizinol as GRASE (short for generally recognized as safe and effective). Titanium dioxide and zinc oxide are the only other U.S. sunscreen ingredients with this rating.
Bemotrizinol’s U.S. approval goes into effect on August 9. So sunscreens using it could hit shelves later this summer. But a new sunscreen is not the only way to stay safe from the sun. There are plenty of low-tech options, too: long sleeves, hats, sunglasses and staying in the shade. “The more clothing you’re wearing,” Stein emphasizes, “the less you have to depend on sunscreen.”
Objective: To investigate how, in the field of forensic science, the size of blood spatter correlates to the distance from which the blood fell.
Areas of Science: Physics
Difficulty: Intermediate medium
Time required: Very Short (≤ 1 day)
Prerequisites: None
Material availability: Readily available.
Cost: Low ($20 – $50)
Safety: This topic can be a little scary. If you are squeamish, you may want to choose another topic. Adult supervision is required when doing background research, especially online, on this topic.
Credits: Michelle Maranowski, Ph.D., and Teisha Rowland, Ph.D., Science Buddies
The word forensic comes from the Latin word forensis, which means of or before the forum. “During the time of the Romans, a criminal charge meant presenting the case before a group of public individuals in the forum. Both the person accused of the crime and the accuser would give speeches based on their side of the story. The individual with the best argument and delivery would determine the outcome of the case. Basically, the person with the sharpest forensic skills would win. This origin is the source of the two modern usages of the word ‘forensic’ — as a form of legal evidence and as a category of public presentation.” (Wikipedia, 2008)
Today, the use of scientific evidence is so prevalent in the courtroom that the term forensics has become associated with forensic science.Forensic science is any science that is used in the courts or judicial system and it is extremely vital. The goal of a forensic scientist is to remain impartial and to appraise all of the available evidence in order to determine the truth.
Forensic science includes many areas of study, such as criminalistics, engineering science, pathology and biology. If a sports player were to die suddenly while playing a game, a forensic scientist with a specialty in pathology and biology would be called in to find out the cause. The scientist might have to perform an autopsy and examine the body to determine if the death had a natural cause — such as a health problem — or not. (To find out more about a related career, you can check out the Science Buddies career profile on pathologists.)
On the other hand, a forensic engineer may need to apply engineering principles to the purposes of law investigations. For example, a forensic scientist with specialty training as a civil engineer may study failure analysis and evaluate the quality of construction and manufacturing of structures involved in a crime or catastrophic event. They may look into why a particular car rolled over or why a building or bridge collapsed.
In general, to become a forensic scientist, you may need to study math, science and engineering. To find out more about being a forensic scientist, you can check out the Science Buddies career profile on forensic science technicians.
In this forensics science project, you will investigate how the size of blood spatter changes depending on the height that the blood was dropped from, but you will be using fake blood instead of real blood. In crime scenes where people are wounded, investigators apply principles of blood spatter analysis by taking measurements, such as of the diameter of the blood spatter, to figure out what happened. How do you think the diameter of the spatter changes as blood is dropped from different heights? Find out by trying your hand at collecting evidence in this science project and remember that solving mysteries is serious work!
Terms and concepts
Forensic science
Evidence
Blood spatter analysis
Questions
What is forensics?
What are the different areas of study in forensic science?
What kinds of projects do forensic scientists work on?
How do you think the height from which something falls, such as a drop of blood, affects how it lands on the surface below?
Objective
To investigate how, in the field of forensic science, the size of blood spatter correlates to the distance from which the blood fell.
Resources
The following sources will help you learn more about forensic science:
Graduated cylinder, 50 mL or 100 mL size (or you can use measuring spoons)
Cornstarch (17 g or about 2 tbsp)
Corn syrup (60 mL or about 4 tbsp)
Red food coloring (5 mL or 1 tsp)
Bowl
Water
Fork or spoon for mixing
Optional: Plastic wrap
Cardboard. You will want enough cardboard to create seven pieces that are each about 30 cm by 30 cm (12 in by 12 in). The pieces should be able to lay flat and should not have many folds or creases in them.
Scissors
Pencil or pen
Medicine dropper
Measuring tape
A chair or stepping stool
Metric ruler or measuring tape that has millimeter marks
A location to do your experiment where the ground can be easily cleaned (in case of spilling the simulated blood). For example, concrete or linoleum may work well.
Optional: Butcher paper or newspaper
Helper
Lab notebook
Experimental procedure
Making the simulated blood
Using the digital scale, weigh 17 grams (g) of cornstarch and place it into the bowl. (Or measure two tablespoons [tbsp] of cornstarch and add it to the bowl.)
Thoroughly mix 30 milliliters (mL; 2 tbsp) of water into the cornstarch with a fork or spoon. The mixture must be smooth, as shown in Figure 1 below.
Figure 1. Mix the water into the cornstarch until the mixture is smooth.S. Zielinski
3. Add 60 mL (4 tbsp) of corn syrup to the bowl and mix thoroughly. The mixture should be smooth, as shown in Figure 2 below.
Figure 2. Mix the corn syrup into the mixture until it is smooth.S. Zielinski
4. Mix in 5 mL (1 tsp) of red food coloring. Stir until the mixture is a consistent color, as shown in Figure 3 below.
Figure 3. A bowl of simulated blood (cornstarch, corn syrup, water and red food coloring).S. Zielinski
You should now have a small bowl of simulated blood. If you will not be using it right away, cover the bowl with plastic wrap and set it aside.
Note: Be careful not to spill the simulated blood on furniture or carpeting, as it can stain! If it does spill, be sure to clean up the simulated blood immediately.
Blood spattering
Carefully cut up the cardboard into seven pieces of similar sizes. Each piece will be used for testing a different height.
Each piece should be about 30 centimeters (cm) by 30 cm (12 inches [in] by 12 in). This will give you a good amount of space for dropping 10 drops of simulated blood onto each piece.
Make sure the pieces can lay flat.
Avoid using pieces with many folds or creases in them.
Use a pencil or pen to label each piece of cardboard with the height you will be testing on it.
The heights you will be testing are 30 cm (12 in), 60 cm (24 in), 90 cm (36 in), 120 cm (48 in), 150 cm (60 in), 180 cm (72 in) and 210 cm (84 in).
Lay the cardboard piece you labeled for testing a height of 30 cm (12 in) flat on the ground where you will do your experiment.
Because the simulated blood can stain, you should only do this experiment on a surface that can be easily cleaned, such as linoleum or concrete.
You may also want to cover the surface (under the cardboard) with butcher paper or lots of newspaper to prevent stains.
Fill the medicine dropper with some simulated blood and hold the dropper completely vertically above the cardboard piece, as shown in Figure 4 below. Have a helper use the measuring tape to make sure the tip of the dropper is 30 cm (12 in) above the cardboard.
Figure 4. Hold the medicine dropper 30 cm or 12 in above the cardboard piece, holding the dropper in a vertical position.S. Zielinski
Drop a single drop of simulated blood onto the cardboard piece.
Repeat steps 4–5 nine more times so that you have dropped a total of 10 drops onto the cardboard piece. Then let the cardboard piece dry, being careful not to disturb the drops while they dry.
If any of the drops landed on another drop or landed in a crease or fold on the cardboard, do not count these drops for your total of 10.
Repeat steps 3–6 with all of your other cardboard pieces, being sure to test each from the correct height.
You and your helper will need to stand on chairs or stepstools to reach the highest heights. Be careful when doing this.
When all of the drops on the cardboard pieces have dried, measure the diameter of each drop — or spatter — in millimeters (mm) or inches (in) and record the measurements in your notebook in a data table like Table 1 below. Be sure to measure very carefully, because there may be very small, but measurable, differences between the drops. Tip: The drops may look glossy and wet even after they have dried. You may want to make an extra drop on one of the cardboard pieces that you can test (by touching it) to see when the drops have completely dried.
Drop height (cm) or (in)
Drop
Drop diameter (mm) or (in)
Average drop diameter (mm) or (in)
30
1
2
3
…
10
60
1
2
3
…
10
90
1
2
3
…
10
etc.
etc.
Table 1. In your lab notebook, make a data table like this one and fill it in with your measurements. Measure the diameter of all 10 drops (in mm) on each of the 7 cardboard pieces.
Calculate the average diameter of the drops for each height. Add your answers to your data table.
For example, if the 10 drops you measured at a height of 90 cm (36 in) had diameters of 12.5 mm (0.49 in), 12.0 mm (0.47 in), 12.5 mm (0.49 in), 13 mm (0.51 in), 12.5 mm (0.49 in), 13 mm (0.51 in), 12.5 mm (0.49 in), 12.0 mm (0.47 in), 13.5 mm (0.53 in), and 12.0 mm (0.47 in), the average drop diameter from a height of 90 cm (36 in) would be 12.6 mm (since the sum of all 10 drops is 125.5, and this number divided by 10 rounds to 12.6 mm (0.50 in).
Make a graph of your results. On the x-axis, put the drop height (cm or in), and on the y-axis, put the average drop diameter (mm or in).
Look at your graph and try to draw some conclusions based on your results.
How did the diameter of the spatter change as the simulated blood was dropped from different heights?
How do you think your results could help a forensic scientist figure out what happened at a crime scene?
In the sea, soft-bodied sea slugs crawl around without shells to protect them. Instead, they sport dazzling colors and flashy patterns to warn would-be predators that they’re toxic. Now, researchers have learned that many of these vibrant hues come from structures under the slugs’ skin.
These slugs, called nudibranchs (NU-dih-branks), are sometimes dubbed the “butterflies of the sea.” Their colors are “exceptionally bright,” says materials scientist and physicist Samuel Humphrey. He works at the Max Planck Institute of Colloids and Interfaces in Potsdam, Germany. Nudibranchs’ range of colors and patterns exceeds those of other ocean dwellers and is only like that of butterflies and birds, he says.
Not much was known about nudibranch colors, Humphrey says. But in nature, some of these colors — such as white, blue and purple — are hard to get from pigments. (Those are molecules that provide color.) That made Humphrey’s team suspect the slugs’ colors instead arise from light waves bouncing off structures on their bodies. Such structural color can create hues as intense as those seen on the sea slugs.
Two sea slugs — a Barbie-pink Hypselodoris bullockii (left) and a golden-speckled Hypselodoris tryoni (right) — use the same technique to wear wildly different hues.Left: Reinhard Dirscherl/Getty Images; Right: ifish/iStock/Getty Images Plus
Humphrey collected one species of nudibranchs off the coast of France. Others, he and his colleagues bought from aquarium shops. The researchers looked at the creatures under the microscope and saw tiny dots of colors that combined to create a shade. For instance, a nudibranch might look purple, but zoom in, and you may find specks of red and blue. “It’s a bit like mixing paints until you get the color you want,” Humphrey says.
Actually, he adds, “it’s better than that.” Sea slugs’ hues arise from specific wavelengths, or colors, of light bouncing off them and reaching our eyes. And the team found that, for a given color, nudibranchs reflect up to 80 percent of light that hits them. That makes their hues more vivid than those produced by pigments, which create colors by absorbing light. Losing light means losing brightness, Humphrey explains.
The researchers shared their results in the March issue of the Proceedings of the National Academy of Sciences.
With a powerful microscope, the team saw stacks of tiny plates under nudibranchs’ skin. The plates were crystals made of guanine. The thickness of the plates and the distance between them in a stack determined the colors that they reflected. That allows sea slugs to wear a rainbow of colors made of just one material.
The many tiny dots of color on sea slugs’ skin creates an effect akin to how TVs make images with many spots of only a few colors. This is called pixelation. “It feels like a thing that humans have invented,” Humphrey says. “But actually, evolution had invented it millions of years ago.”
Sea slugs’ style is spot on
Humphrey et al/PNAS 2026 (CC BY 4.0)
Microscope images revealed close-ups of nudibranchs’ skin (Figures A–F). These images show the many dots of different hues that make up a single area of color on the animals. Researchers also measured how these areas interact with light (Figures I–N). The graph in Figure I goes with the image in Figure A, Figure J goes with Figure B and so on. The graphs show the reflectance, or how much light reflects off differently colored spots to reach our eyes. Most colors have a specific wavelength at which the most light is reflected. For example, Figure C shows the pink region of Hypselodoris bullockii, which has some violet colored dots (Figure C). These dots reflect the most light at a wavelength of around 400 nanometers (Figure K).
Data Dive:
How many types of colored light make up the violet hue of Hypselodoris tryoni (Figure A)?
How many types of colored light make up the beige or white region of the same slug (Figure B)? Which color of light has the highest reflectance? What is that color’s peak wavelength?
Which sea slug here has the color with the highest reflectance? (Hint: Not all the y-axes are exactly the same.) What is that color and what is the peak wavelength?
How many different colors of light are in the region of Chromodoris annae (Figures E and M)? Based on those colors, how do you think this area of the slug looks to the eye?
Fjords are long, narrow arms of the sea that often reach far inland. They are typically flanked by tall, steep cliffs on either side. Below water, their trenches often plunge much deeper than the open sea to which they connect.
Fjords are usually formed by glaciers. This sets them apart from other types of narrow valleys, or gorges. As glaciers slowly make their way to the ocean, they can carve deep channels through the terrain. These channels remain even after the glaciers have melted and filled with water, creating fjords.
Fjords are long, narrow arms of the sea that often stretch far inland. Joern Siegroth/Getty Images
These dramatic landscapes offer sweeping vistas of craggy cliffs and majestic mountains that inspire awe. Some scenes in TheLord of the Rings movies were filmed in the fjords of New Zealand. For instance, aerial shots showing the fictional River Anduin get their steep, forested terrains from Fiordland National Park.
However, Norway holds the record for most fjords. It has more than 1,200. The largest is Sognefjord. This fjord stretches 205 kilometers (127 miles) inland. Steep mountains and cliffs rise up to two kilometers (1.2 miles) above the water below. This water hides a deep underwater trench that plunges up to 1.3 kilometers (0.8 mile) below sea level.
A common houseplant hides a splendid geometric pattern.
This design, called a Voronoi diagram, appears on the leaves of the Chinese money plant. The layout may arise as waves of a plant hormone spread across a leaf during its development. A similar process may shape the vein patterns in leaves of other plants, too.
Researchers shared these findings May 12 in Nature Communications.
This is a “beautiful” showcase of how plant veins develop to move water across leaves most efficiently, says Lawren Sack. He did not take part in the research. But he does study plant biology at the University of California, Los Angeles. Veins of leaves “have so much to tell us” about how to get resources where they need to go, he says.
Lurking in leaves
Leaves of the Chinese money plant (Pilea peperomioides) are speckled with pores. Called hydathodes, these pores release water. Each one is fenced in by veins to form a mosaic.
While in high school, Elijah Blum discovered a curious pattern in those leaf veins. He noticed it while plant-sitting for his sister. At the time, Blum was an intern at Cold Spring Harbor Laboratory in New York. (He’s now in college at New York University.) He shared what he’d found with his internship supervisor, computer scientist Saket Navlakha.
“He showed the plant to me, and he said, ‘Look, the veins look kind of interesting here,’” Navlakha says. “We sort of held it up to the light — and we saw that … Voronoi diagram.”
The layout of veins and pores on a Chinese money plant leaf (left, in false color) closely matches a computer model of a Voronoi diagram (right). Scientists made the computer model using the leaf’s pore positions as an array of dots. Colors show the regions on the actual leaf that correspond to regions in the computer model.Navlakha lab/CSHL
In a Voronoi diagram, a surface is split up into zones. Each zone contains a designated point. And every spot within a zone must be closer to that zone’s point than any other.
Urban planners use the same idea to decide which fire department a house should be assigned to. This helps each house in a city or town be closer to the fire station in its zone than any other station.
Patterns that look similar to Voronoi diagrams appear elsewhere in nature. The tiles on giraffe fur look like this type of design. So do the scales of dragonfly wings. But in a true Voronoi diagram, the mosaic must form around a set of points. In the Chinese money plant, the water-oozing pores serve as those points.
Making the mosaic
Blum and the others were curious how this pattern might develop.
Similar leaf veins are thought to form through canalization. In this process, a hormone involved in plant development — auxin — branches out across leaves. As it does, it creates a treelike network of channels that become veins.
But that wouldn’t produce a Voronoi diagram around a leaf’s pores, the team found. Computer models instead showed that as Pilea leaves develop, waves of auxin spread out from each pore. Those waves collide to form ridges. Eventually, they become a leaf’s major veins.
More research is needed to find out why Pilea leaves follow this pattern, says team member CiCi Zheng. She studies the math of living things at the Allen Institute in Seattle, Wash.
The Voronoi diagram layout might be useful for plants, she says. This pattern keeps a leaf’s major veins — which transport water — as far as possible from its water-leaking pores. “You might want to place the veins not directly close to any of those locations where water evaporates super-fast,” Zheng says.
Sack at UCLA is excited about what new tech this finding might inspire. Past studies of leaf veins, he says, have helped engineers reimagine how to distribute resources such as water and energy. Such insights have improved solar panels, electronic circuits and irrigation systems.
“The more we know about leaf veins,” Sack says, “the more we can build functional and beautiful systems around us.”
For a long time, scientists considered Ötzi the Iceman a messenger from the Copper Age. But new research shows this frozen mummy wasn’t alone. He hosts small companions — dormant, cold-adapted yeasts. In other words, his remains might not be as frozen in time as researchers once thought.
Since Ötzi’s discovery in the Italian Alps in 1991, his body has been housed in a specialized facility in Bolzano, Italy. Scientists there held his remains at –6° Celsius (21.2° Fahrenheit). This has been to keep his body from degrading. It’s a temp close to that of the glacier in which he’d been found.
Four ancient species of yeast have now been found in his remains. And they’re still able to grow in the lab, reports Albert Zink. His team isolated “ancient DNA from these species,” he notes. An anthropologist, until recently, he worked at the Eurac research center in Bolzano, Italy. (He’s now at Ludwig Maximilian University of Munich, in Germany.)
Those DNA show the yeast “accompanied [Ötzi] over thousands of years while he was preserved in the ice,” Zink says.
Scientists suspect Ötzi thawed and refroze several times — especially in the first 1,500 years after his death. That could help explain why his remains still host microbes.
Zink’s team shared its results on June 3 in Microbiome.
Researchers thawed Ötzi’s body to 4 °C (39.2 °F) for five hours. Then, they collected the liquid that melted off his remains. They also swabbed parts of Ötzi’s body and took samples of his skin and other tissues.
Four colonies of yeast grew from these samples. Scientists compared these yeasts to those in soil near the glacier where Ötzi was found. They also checked air and the water that the museum had used to keep the mummy’s chamber humid.
These tests showed those four yeast species really came from the mummy. They were effectively time capsules of Ötzi’s time in the ice after his death. Bacteria were also extracted from internal tissues. None of these grew in the lab.
The new findings suggest the iceman’s remains seem to still be interacting with the environment.
Scientists grew colonies (shown) from four species of yeast found on the mummy’s body.Eurac Research/Andrea De Giovanni
Risks to the mummy
Those microbes could pose a problem. If they don’t stay dormant, they could end up decomposing the mummy.
This conclusion is “right on the mark,” says Patrick Hunt. He’s an alpine archaeologist at Stanford University in California who did not take part in the new study.
Ötzi is “the most important archaeological-science finding of the 20th century,” Hunt says.
Ötzi’s mummy has offered an incredible window into the man’s former life. From many studies, scientists know he wore leather clothes, had multiple tattoos and would have likely gone bald. Past work even shows he ate a high-fat meal before he died and carried an ax made of copper derived from far away.
More such discoveries may emerge only if Ötzi’s body remains preserved. That requires getting to know the cold-loving and potentially damaging microbes on his body. It also makes the new findings essential, Hunt says. They’ll help scientists preserve this iceman for the ages.
Climate scientists are warning us to buckle up for a bumpy ride. An El Niño has begun. By year’s end, this periodic climate event might become the strongest El Niño on record.
An El Niño Southern Oscillation, or ENSO, is a recurring two- to seven-year ocean-climate pattern. On June 11, the U.S. National Oceanic and Atmospheric Administration confirmed Earth has officially entered the El Niño phase of this cycle.
El Niño events emerge in the Eastern Pacific. Eventually, the changes in climate they spawn will affect weather globally. And the stronger an El Niño, the more costly it can be to human health, farming, buildings and our wallets.
Forecasters currently predict a 63 percent chance that, by winter, the new El Niño will prove very strong — as in a “super El Niño.”
Here are four things to know as this climate pattern takes hold.
What’s an El Niño?
An ENSO’s several-years-long cycle has three phases.
The first, known as El Niño, involves months of warmer than normal sea-surface temperatures in the eastern equatorial Pacific. Back in the 1600s, fishers in Peru noticed this warming tended to show up around Christmas. So they dubbed it “El Niño,” which is Spanish for “little boy.” It’s also the name given to “the Christ child.”
A second phase — La Niña (or little girl) — swings to cooler than normal temps in those eastern Pacific waters near the equator.
The last is a neutral, in-between phase. It brings average temperatures back to the Pacific’s equatorial sea surface.
The “Southern Oscillation” part of ENSO’s name refers to another seesawing pattern. Here the swings are between areas of high and low atmospheric pressure over the eastern versus western Pacific Ocean. That up-and-down pressure pattern triggers global-scale changes in winds, air temps and precipitation.
Scientists track ENSO air-pressure changes at two main stations. One is in the West Pacific at Darwin, Australia. The other is in the East Pacific at Tahiti (part of French Polynesia).
During neutral periods and La Niña phases, the high-pressure zone is in the east. That sends prevailing winds westward across the Pacific around the equator. These winds push the warming surface waters of the Pacific to the west. This keeps them away from the coast of the Americas.
In so doing, it allows cold, nutrient-rich water to well up from the deep ocean. That keeps the eastern equatorial Pacific waters cold.
But every few years, conditions flip. Now high pressure prevails over the western Pacific, and lower pressure over the eastern Pacific.
This weakens or even reverses the direction of the prevailing winds. It also allows warm surface waters to stay in place. This suppresses the upwelling of cold water. Now sea-surface temps warm rapidly in the eastern Pacific. This also serves as a telltale sign an El Niño is back.
No two El Niño events are exactly alike, says Tom Di Liberto. He’s a climate scientist and meteorologist now working for the nonprofit news group Climate Central. It’s based in Washington, D.C.
But each El Niño transfers huge amounts of heat from tropical Pacific waters into the air. That bonus heat can temporarily — and dramatically — boost air temperatures around the globe.
An El Niño officially starts when sea-surface temperatures in the eastern equatorial Pacific Ocean steadily remain at least 0.5 degree Celsius (0.9 degree Fahrenheit) above average for several months. The warmer the waters, the stronger an El Niño’s likely global impacts.
Waters warmer than 2 degrees C (3.6 degrees F) above average signal the emergence of a very strong — or “super” — El Niño.
This Philippine farmer was trying to salvage any surviving water-pond plants during the super El Niño in April 1998. He hoped to feed local people and livestock. Seven Philippine corn and rice growing provinces were declared a state of calamity after their crops were totally destroyed by this El Niño’s long, severe drought.Romeo Gacad/AFP/Getty Images Plus
Since April, temps over the eastern equatorial Pacific Ocean have remained well above average. Dozens of forecasters around the world concluded an El Niño was on its way. By June, as the ocean warmed even more, their forecasts began to warn that this could prove a really powerful event.
Recently, climate change has made detecting an El Niño’s onset and strength more difficult. Why? Global temperatures have been warming steadily over the last decade, which can mask an emerging El Niño. So in May, NOAA’s Climate Prediction Center adopted a new tool for its El Niño forecasts. This now adjusts for that climate change–related warming.
Using this new tool, NOAA predicts that this winter, sea-surface temps in the eastern tropical Pacific are 63 percent likely to be more than 2 degrees Celsius higher than average. That’s what suggests a super El Niño is developing.
In fact, computer models are now forecasting “shockingly high” global temperatures for November and December, Di Liberto says.
Such heat can have deadly consequences. A rise in heat-related illnesses is one. Another is upticks in diseases (such as cholera, typhoid and malaria) carried by mosquitoes and other pests that like it hot.
El Niños also alter the track of the Pacific jet stream. The result: Some areas will become drier than normal. Others will get wetter.
For the United States, one of the most significant impacts will likely be more numerous and intense Pacific cyclones. At the same time, changing wind patterns can make it harder for Atlantic hurricanes to form.
Fortunately, the life of any one El Niño is relatively short: Events typically form in the summer, strengthen into the winter, then die out the next spring.
People in Locotal, Bolivia, check out a major road after torrential rains washed out a large section of it on January 9, 1998. Meteorologists attributed the flooding rains and mudslides here to a powerful El Niño, which had been triggering extreme weather events around the globe.STR/AFP/Getty Images Plus
How will this year compare to past major El Niños?
The most recent strong El Niños happened in 2015–16, 1997–98 and 1982–83.
The 1997–98 event was the strongest on record. It temporarily raised average global temps by 1.5 degrees Celsius (2.7 degrees Fahrenheit) and triggered devastating weather events.
These included torrential rains and floods in Peru and East Africa. Those, in turn, triggered an outbreak of Rift Valley Fever in Africa. Droughts in Southeast Asia kicked off deadly wildfires. California saw powerful storms that brought major flooding and landslides. Soaring ocean temperatures led to the bleaching of about one-sixth of the world’s coral reefs.
Such strong El Niños are costly, too. The 1982–83 one cost the world an estimated $4.1 billion. The 1997–98 event was estimated to cost about $5.7 trillion.
How bad this year’s event will be is still unclear. But it’s occurring on top of strong global warming from human activities. And even if this year’s turns out to be only moderately strong, Di Liberto says, its impacts could still be very big. “It would not take a very strong El Niño to see records broken this year.”
Here a BBC meteorologist offers a snapshot of why weather forecasters are worried about the developing El Niño and how its impacts could play out across the globe.
To work, these aerosols would have to be targeted over a particular patch of the Pacific Ocean. This should increase and brighten clouds there, a new computer model finds. And that would reflect more of the sun’s warming light back into space, cooling the climate.
The idea for this was sparked by the 2019–20 Australian wildfires, says Jessica Wan. She’s a climate scientist at the University of Chicago in Illinois. Those fires spewed huge billows of particles into the air. Plumes of them wafted over the southeastern subtropical Pacific Ocean. This brightened clouds there — and helped trigger a multiyear La Niña.
This natural “experiment” hinted at how altering clouds in the proper region can change large climate patterns, says Wan. Her team’s computer model has now calculated what would happen if people injected a huge quantity of aerosols into the atmosphere (as the wildfires had). This should weaken an El Niño. But how much weaker it got would depend on when the injection took place, the model finds. The strategy seemed to work best when done early in an El Niño.
This idea “is really interesting and very new,” says Daniele Visioni. He’s a climate scientist at Cornell University in Ithaca, N.Y. who did not take part in this new study. To him, “the fact that it looks like this could work is a really good indication that it is something worth thinking about.”
But it’s not a strategy that could work for this year’s El Niño. There are too many big questions to answer first, Wan says. For one thing, the technology to inject particles is years from being ready. Plus, there needs to be more study about the possible negative consequences of injecting aerosol particles.
Dikansh S. Parmar rescued a snake for the first time in middle school. It happened at his karate class in Surat, India. Someone spotted a baby cobra among a nearby pile of construction materials and wanted to kill it. But Parmar stopped them. His dad had rescued snakes, and he had a rough idea what to do. He took a rod from the construction site and used it to coax the baby snake inside a water bottle.
Parmar was lucky. The snake didn’t harm him. And people without proper training shouldn’t approach snakes. But this encounter inspired him to become a trained snake rescuer as a teen. Parmar is now also a herpetologist who studies snakes. He works at the Leibniz Institute for the Analysis of Biodiversity Change in Bonn, Germany. Recently, Parmar combined his snake rescue and science knowledge to discover something curious about his favorite snakes: king cobras.
Western Ghats King Cobras (Ophiophagus kaalinga), his team found, might ride trains across the Indian state of Goa. Parmar and his colleagues shared their evidence for this January 26 in Biotropica.
In the animated movie Up, a yellow, tail-wagging dog shows up wearing an electronic collar. The main character, a curious and cheerful 8-year-old boy named Russell, tells the dog to sit. The dog sits. Russell tells the dog to shake. The dog extends a paw. Russell then tells the dog to speak.
“Hi there,” says the dog.
To Russell’s amazement, the dog’s collar translates his doggy thoughts into actual human words. “My master made me this collar,” Dug the dog tells his new acquaintances. “He is a good and smart master, and he made me this collar so I may talk — SQUIRREL!”
This is a common piece of technology in stories — a translator that can decode animals’ barks, squeaks, meows, clicks and such, into human language.
Back here in the nonfiction world, anyone with a pet has probably wondered at some point what’s going on in that cute little animal head. Scientists can’t say. But there are reasons to think that an animal-human translator won’t stay a work of science fiction forever. “I think these things may be one day doable,” says Erich Jarvis. He’s a neurogeneticist at The Rockefeller University in New York City.
One day, pets may wear little devices like Dug’s collar. Or an app on a phone might translate pet sounds into words. This neat trick could finally let you learn the answer to why your cat is staring at that empty corner of the living room.
Learning languages
Advances in computing power, artificial intelligence (AI) and fancy tools that measure sounds promise to bring people closer to conversing with other animals. These advances could turn animal chatter into bits of information that can be decoded by humans.
Of course, some animals can already talk to us — in our preferred languages, too. Jarvis tells the story of a parrot that left its California home. It returned years later speaking Spanish, he says.
Such language skills are rare. Thinking up a message and making intricate vocal sounds to convey it take special mental skills and a great flexibility of body systems. These traits are present in fewer than 1 percent of vertebrate species, says Michael Long. He’s a neuroscientist at New York University in New York City.
Not all animals may be good conversationalists. Take vervet monkeys. “Their cognitive abilities are huge,” Long says. But they flounder when it comes to producing complex sounds. “So they have one of those requirements, but they need to get the other one,” Long says.
And with rare exceptions, none really speak our language. But that gap can be overcome. It may just take a slight shift in what we consider talking. “Animals are speaking, often — to use speaking in a very loose way — more vibrantly than we had ever given them credit for,” Long says.
In the Pixar movie Up, a golden retriever named Dug wears a collar that translates his thoughts to speech. Dug’s collar translates all of his thoughts, even mid-sentence distractions like “SQUIRREL!”ALBUM/ALAMY
Another group of researchers has since discovered that whale language shares statistical properties with those spoken by humans. With these sorts of advances, perhaps we’ll soon be swapping krill recipes.
Some of Jarvis’ research includes mice that have been genetically changed to produce more complex sounds. He is part of a team that’s closely examining key genes that are active in good vocal learners. Mice with a human version of a protein called NOVA1, for instance, made more complex vocalizations. To be clear, this is not yet a talking mouse. But the research is moving fast.
Some animal messages are clear even without a fancy sci-fi gadget. “Animals are broadly expressive,” Long points out. Anguished yowls of a cat sitting by her unfilled food dish are no great mystery.
Messages don’t even require a vocal tract. Mongolian gerbils, for instance, beat out messages by thumping the ground percussively. Dances, posture, color and even objects can all carry messages. Just think about it: You can probably figure out the message when a dog holds his leash in his mouth and sits by the front door.
So while we wait for a gizmo that translates our pets’ thoughts into words, consider the wildly variable ways animals already communicate. Long’s formerly stray Brooklyn cats, for instance, have plenty to say. Their needs and wants are “very, very transparent,” he says.
Should a cat-human translator ever exist, Long’s message to one of his cats would be short, sweet and practical: “I would tell him not to sit too close to the stove when I’m cooking. I think that’s it.”
Subsidence happens when land sinks because water, soil, rock or other underground materials are removed. It can happen quickly, with the sudden appearance of a sinkhole or abrupt shift during an earthquake. It can also happen gradually as people remove groundwater from aquifers. Over time, the overlying land sinks down to fill the open space.
Most subsidence occurs in areas where people pump groundwater out of aquifers. These natural storage areas are not underground lakes. Rather, they are porous rocks that hold water like vast sponges. Water that soaks into the ground after a good rain or snowmelt fills the spaces in the rock.
When we dig wells, we tap into these groundwater sources. But the more water we remove, the more air pockets we leave behind. Overlying rock and soil collapse into the porous rock, causing the surface to sink. Aquifers can take thousands of years to refill with water. So subsidence is an ongoing issue in many places.
This spot in California’s Central Valley dropped almost 2 meters (more than 6 feet) between 1988 and 2016. Subsidence is happening here as farmers use groundwater for their crops.Justin Brandt/California Water Science Center/USGS
Sometimes subsidence happens because people remove other substances from the ground. This includes mining for minerals or drilling for oil or natural gas. When those materials are removed, land settles into the gaps, leading to subsidence.
Subsidence happens around the world, but it is more common in areas with large cities and lots of agriculture. Human activity in these places can lead to overuse of groundwater. Cities face an additional problem if they are built on fine sediments left behind by rivers. These types of sediments can sink under the heavy weight of buildings and other structures. New York City and Shanghai, China, have both experienced subsidence due to the weight of their buildings.
Archaeologists have discovered the remains of at least 37 people, some likely dating from more than 1,000 years ago. A large stone “jar” in northern Laos became their last resting place. Part of the mysterious “Plain of Jars,” it’s one of thousands of similar ancient stone vessels. A local legend says giants used the jars to make rice wine. Researchers now think the newfound jar was a multigenerational burial site for ancestor worship.
That would make the Plain of Jars a vast ancient burial complex. Researchers describe this in the August issue of Antiquity.
The newfound stone jar spans more than two meters (6.6 feet) across. It sits in a forest about 70 kilometers (40 miles) northeast of Phonsavan, Laos, in Southeast Asia. Part of the Xieng Khouang Plateau, this region is dotted with thousands of the stone jars.
The remains of at least 37 people who died between the 9th and 13th centuries were found in this stone vessel in northeastern Laos. These remains provided key evidence to how the vessels in this Plain of Jars had been used. N. Skopal
The most well-studied groups are around Phonsavan itself. However, the entire plateau is now considered the Plain of Jars.
People had noticed a few of the jars contained bones or some ashes. But it seemed unlikely that so many large stone vessels would have been carved for burial ceremonies. So the jars’ original purpose had been a mystery.
“The big jar we’ve found is unique, and I’ve seen a lot of jars,” says Nicholas Skopal. He’s an archaeologist at James Cook University in the Queensland city of Townsville. This vessel finally confirms that the jars were part of ancient burial ceremonies, he says. But their precise use at different places may have varied.
These beads were found in the burial “jar” along with ancient human bones.N. Skopal
Many sets of bones inside the newfound jar are separate. They are not part of a full skeleton. That suggests this jar is a “secondary burial” — a spot chosen for bodies that had partially decomposed elsewhere (such as in smaller jars). There are several smaller jars a short distance away.
“Maybe they used those [smaller] stone jars to ‘distill’ the bodies,” Skopal suggests. Remains might have been put in those smaller jars until “all the flesh comes off,” he says. “Then they take the bones and they put them … in this big jar. So it’s like a big crypt, almost.”
French archaeologist Madeleine Colani investigated the stone jars near Phonsavan in the 1930s. Most are just over a meter high (a bit more than 3 feet). Some weigh several tons. Some are lying on their side. A few had stone lids.
Early French explorers had assumed these jars once stored food and water. Colani rejected that. She instead suggested the jars had a burial role.
Scientists largely overlooked this remote region after Colani’s survey. Newer expeditions were hampered by the large number of explosives from the Vietnam War left in this area. Lao officials have been working to clear out the explosives.
Archaeological studies since the mid-1990s found burial pits filled with ancient human remains next to the jars. The remains might have been left there to decompose while awaiting later placement in the jars.
Colani had estimated that the oldest jars could have been made in the 5th century B.C. That would be up to 2,500 years ago. More recent radiocarbon dating indicates the remains are less than half that old — about 1,000 years old. Some jars contained ashes and burned bone fragments, a sign of cremations. This practice is a later, Buddhist tradition. Perhaps the jars were reused for burials after Buddhism took hold in this region, Skopal suggests.
“This is a collective mortuary assemblage,” says Miriam Stark, who did not take part in the new work. “I find that very interesting.” An anthropologist and archaeologist, Stark works at the University of Hawaii at Manoa. She says she had been hoping a jar like the newly studied one would be found.
No sign yet exists of which people might have used the jars for burials, she notes. “I do wonder, where did these people live?”
Professional surfer and scientist Cliff Kapono gets his best ideas when he’s in the ocean. “The thinking turns off, but the ideas start to pour in,” he says. To him, the connection makes complete sense because the native Hawaiian word for “idea” is the same as “wave” — nalu.
Kapono is a native Hawaiian; these are the Indigenous people of Hawaii. He grew up in Hilo, Hawaii, where he is based today, blending his lifelong passions for surfing and science daily. “I want to understand how waves move across our planet, so I can be better at catching these waves,” he says.
As a kid, all he wanted to do was surf every day, all day long. He practiced until he could surf at a professional level. “That’s the same thing that I did in science. It started off where I just wanted to take science classes and get A’s. With surfing, the equivalent is catching nice waves,” Kapono says.
Kapono is now a professional free surfer. These athletes chase the best swells around the world to earn sponsorships and media exposure. He also has time to do scientific research. For Arizona State University’s Center for Global Discovery and Conservation Science in Hilo, he studies how humans and ocean environments interact, from molecular to macro scales, through the lens of a surfer. In this interview, he shares his experience and advice with Science News Explores. (This interview has been edited for content and readability.)
How do you balance professional careers in surfing and science?
When I was younger, I didn’t think I could put the two together. But if I were to pursue a full-time career in either, I would be unhappy. So I figured out a path where I could spend just as much time inside the science lab as I am in the ocean. The Western world defines your job based upon what you get paid to do, not about what you invest your time into. I totally departed from that idea. My job is to be the best version of me. The best version of me is surfing good waves every day and understanding about the natural world through a scientific lens.
“The best version of me is surfing good waves every day,” Kapono says, “and understanding about the natural world through a scientific lens.”Nani Welch Keliʻihoʻomalu
What does surfing mean to the Native Hawaiian community?
The clearest example of a productive society is the amount of leisure time they have. If you have a highly functioning system, you have surplus time. Our society was able to invest that time into the cultural arts, such as surfing.
Surfing has been documented within our histories for close to 2,000 years. It’s not just recreation. Surfing is so deeply embedded into the Hawaiian culture. It’s in the stories, the chants and the songs. It was celebrated tremendously by all peoples — from folks who were fisher people, farmers, basket weavers, cooks, to the royalty. In the late 1800s, it began being sort of exported outside of Hawaii and demonstrated at different locations around the world. By the 1950s, it reached global fame.
What would you consider one of your biggest successes?
A success for me is elevating scientific literacy within the surf community. As a scientist, I represent an identity in the surf community that I didn’t see growing up. I can play that role for the next surfer scientist — or maybe it’s a surfer chef or surfer lawyer — to show that you can still contribute on a professional level to multiple communities within society at the same time.
Describe a research breakthrough moment you’ve had.
I’m currently trying to identify the structural complexity of reefs at some of the best, most iconic waves around the world. It’s known as bathymetry, the study of the seafloor. I’m looking specifically at where certain famous waves break. Over the last five years, I’ve been traveling around mapping the characteristics of these different reefs. I’m seeing similarities between these waves based upon their reef structure. A personal interest and curiosity is now supported by research — that keeps me excited. Finding out that, by learning more about the reef, I can be a better surfer is a breakthrough for me.
Kapono studies the structural complexity of reefs at some of the best, most iconic wave spots around the world.Sarah Lee
What’s one of your biggest failures, and how did you get past that?
I have gotten a lot of F’s in my academic career, but I’ve never felt like getting an F was a failure. My dad would always tell me that failure is an event, not a person. It’s just a moment that passes, so it’s not going to stay with you very long. So, I’ve actually embraced a lot of failures. I failed at many science experiments. I failed at catching a wave. I fail to ride the wave all the way to the shore. Sometimes I fail to even stand up. I fail in obtaining resources to do my science. I fail in knowing what the right answer is. I fail daily. But failing is not a bad thing if it helps you to find the successes. I don’t feel embarrassed or ashamed to fail anymore. I just tell myself that it’s all going to work out in the end if I don’t let the failure stop me.
I always looked up to elders in the Hawaiian community that maybe aren’t super famous but, within our communities, really treated me kindly and shared knowledge with me. Whether they were teachers, family members or professional surfers, I always looked up to people who were willing to share what knowledge they had with me. Anybody who helped me to navigate the difficulties of being on an island in a small community and feeling like there’s a bigger world out there. Anybody who helped me to get to a higher level of thinking and develop my intelligence, from my academic intelligence to my emotional intelligence. The people who helped me understand more about the world and myself.
As a professional surfer and professor, Kapono has always pushed himself to succeed in both fields. “The better I got in science, I wanted to make sure I got better at surfing,” he says.
What do you do in your spare time?
I volunteer for a scientific group called Mega Lab that is trying to develop technology to protect the ocean and give it to communities who need it the most. The biggest project we have going on right now is mapping a million reefs by 2030. We’re teaching 10,000 citizen scientists how to map the reef with their GoPro, cell phone or camera. The program is called Map to Adapt. Anyone can join the Mega Lab — artists, skaters, ballerinas or firefighters. There are no requirements, you just come by and start doing science together. We just want to have a good time and party for the planet.
Why do science and surfing fit together so well?
Having an interest in science really has helped me to be a better surfer. And my interest in surfing has helped me to become a better scientist. Science is like a superpower for me. It’s really fun to be able to jump from a community that is so focused on riding a wave into one that wonders about how that wave moves. To me, that’s a pretty epic way to live.
Steel rusts over time. Copper turns green. But gold stays shiny, seemingly forever. Scientists have now discovered a property that explains why gold stays spotless.
Oxidation is a type of chemical reaction that can cause a metal to rust or tarnish when it meets oxygen. Atoms on gold’s surface, new data show, rearrange into a geometry that hinders that oxidation. If they didn’t, gold would begin to oxidize in seconds.
Santu Biswas and Matthew Montemore shared their new finding May 21 in Physical Review Letters. These researchers work at Tulane University in New Orleans, La.
In air, oxygen is bundled into molecules, each consisting of two oxygen atoms. For a metal to oxidize, it first has to split those oxygen pairings. Then the single oxygen atoms can form compounds that stick to the surface of a metal. The researchers calculated how well gold’s surfaces could split oxygen. They found that it depends on what happens on gold’s surface.
Imagine cutting a piece of gold in two. That would create a new surface that was once in the center of the gold hunk. Atoms on the newly exposed surface then shift from their original locations in the metal.
There are a few different possible arrangements those atoms can take. The researchers studied two common ones. In both, atoms that had been laid out in squares rearranged into hexagons.
The researchers did calculations to understand the effect of such shapeshifting. The hexagonal arrangement, they found, was much worse at splitting oxygen than the square one. To split oxygen, the hexagonal structure would first need to distort back into the original square shape. That’s a hurdle that stalls oxidation. (A third common surface structure of gold was already known to be bad at oxidizing. It’s hexagonal from the start.)
But there’s more to the story. Under certain conditions, gold can react with oxygen. When it does, it forms gold oxide. That’s unstable. So even if gold were able to split oxygen, the material would form only a thin layer of oxide, notes Montemore, a chemical engineer. His team’s new findings, he says, could help scientists understand how to design better catalysts. Those are materials that speed up chemical reactions.
Just how much slower the rearranged gold atoms oxidize was “definitely a surprise,” Montemore says. The tiny position shifts made a huge difference. “It’s something like a billion to a trillion times slower oxidation once you rearrange.”
Cows belch a lot of methane, a potent greenhouse gas. But it’s not their fault. Scientists have identified a new trigger for the process. It resides in some microbes that live in the cows’ guts.
Notoriously, cows burps are rather potent — a single cow can burp out as much as 220 pounds of methane a year. And scientists just identified the special structure inside microbes in their gut that is responsible for all that methane. It’s called a hydrogenobody. Read more at the in our bio. : Jackie Flynn Mogensen : Kelso Harper : Marta Hill : Getty Images, Chuanqi Jiang/Jinying He/Che Hu/Institute of Hydrobiology, Chinese Academy of Sciences Fei Xie et al.,Rumen ciliates modulate methane emissions in ruminants.Science392,eadv4244(2026).DOI:10.1126/science.adv4244 #cows#methane#science#climate#greenhousegases
For an overview of the study described by this story, check out this brief video.
Some 30 percent of methane produced by farming comes from cud-chewing animals, or ruminants. These include cattle, sheep, goats and deer.
Like organs in the body, a cell’s organelles perform specific roles. The new organelle was found in fuzzy, single-celled ciliates (SIL-ee-ets). These microbes belong to a group known as protozoa.
Ciliates get their name from the hairlike structures — cilia — that help these cells move and sense their environment. These tiny furballs make up about one-fourth of all microbes living in the rumen. That’s the first stomach of cud-chewing animals. There, these microbes help break down grass and other plants.
The new organelle makes hydrogen gas. So its discoverers are calling it a hydrogenobody (Hy-droh-GEN-uh-BAH-dee). The hydrogen it spews causes still other microbes in the rumen to produce methane.
To date, ciliates haven’t been studied much, says Ivan Čepička. He works at Charles University in Prague in the Czech Republic. He did not take part in the new research, but does study microbes, including protozoa.
Researchers in China have now cataloged DNA from ciliates found in ruminants. They’ve turned up 65 species, 45 never before identified.
These new species fell into three major groups. One type, Vestibuliferida, look like microscopic Koosh balls. Entodiniomorphida’s cilia develop appear like a shock of hair coming out of just one part of their cell. The third type of these microbes remains an unclassified family.
Tiny microbes, big impact
Some organisms that make hydrogen can prompt other microbes — archaea (Ar-KEE-uh) — to make methane. But those hydrogen-makers usually have organelles called hydrogenosomes (Hy-droh-GEN-uh-soams). They’re related to another organelle that makes energy.
But hydrogenosomes had not shown up in ciliates. So how rumen ciliates made hydrogen had been a mystery, Čepička says. The new study seems to have solved it: That gas comes from the hydrogenobodies. They’re located at the base of the structures that make ciliates look so fuzzy.
Researchers at the Chinese Academy of Sciences in Wuhan and several Chinese universities reported the surprising finding April 30 in Science.
The group had studied 100 dairy cows. The more ciliates these cattle had, the more methane-producing archaea they had. And the more methane-making archaea present, the more methane the cows belched.
Among ciliates, the Vestibuliferida are especially furry and have more hydrogenobodies. They also spew more methane than Entodiniomorphida.
Hydrogenobodies appear red in this 3-D reconstruction of a slice of a protozoa cell in cud-chewing animals. Hydrogenobodies cluster at the base of hairlike cilia (green) just under the cell membrane (yellow). The more cilia protozoa have, the more hydrogen they make — and the more methane other gut microbes will spew. Chuanqi Jiang, Jinying He, and Che Hu/Institute of Hydrobiology/Chinese Academy of Sciences, adapted by B. Price
What’s next?
One way to cut the methane in cow burps might be to remove Vestibuliferida from their rumen, the team suggests. It might also be possible to just curb the microbes’ growth.
People have tried to wipe out ciliates from the rumen, notes Todd Callaway. When they did, he adds, they saw a drop in how much methane cows make. But there was a downside, he adds: Cows with fewer ciliates produced less milk and meat. Callaway is a microbiologist and ruminant nutritionist. He works at the University of Georgia in Athens.
Keeping protozoa out of the rumen is hard, Callaway says. Cattle must be isolated in sealed barns. Their feed must be microbe-free. And they need to be kept at least 200 meters (660 feet) from other cattle. At that distance, the ciliates would no longer spread between cattle through the air.
Learning more about ciliates might lead to techniques that cut a cow’s methane burps while keeping her milk and muscle (meat) levels high.
Any such treatments are still a long way off, Callaway says. “This is step one of probably 25. But it’s a good step.”
An event horizon is a boundary surrounding a black hole. Beyond this boundary, nothing — not matter, energy or any kind of information — can escape.
A black hole is an ultradense object with extremely strong gravity, which draws in matter and energy around it. The speed that something needs to escape an object’s gravity is called the escape velocity. (Something has to blast off Earth at about 11 kilometers per second or 7 miles per second, for instance, to escape into space.) But at a certain point around a black hole, matter or energy would have to travel faster than the speed of light to escape. And this is impossible. That point of no return is the event horizon.
An event horizon would never be directly visible to us. That’s because light would have to leave it in order to reach our eyes or be captured by a telescope. But the shadowy outline of this boundary has been captured in images.
An image of a black hole looks like a black sphere encircled by a ring of light. The ring of light is the bright disk of gas orbiting the black hole. The black, pupil-like center shows the region where light is trapped and cannot escape. This region is called the “black hole shadow.” The event horizon lies within that shadow. Light bends around the black hole in such a way that the dark region appears at least twice the size of the actual event horizon.
In a sentence
In 2019, the first image of a black hole revealed a shadowy region, within which lies the mysterious event horizon.
When it comes to making a mess, not even the world’s crumbliest cookie would compare to a photon.
Photons are fundamental particles of light. As fundamental particles, they cannot really be broken down into smaller bits. But physicists have now shown what would happen — in theory — if you tried to crack a photon in half.
You wouldn’t just end up with a second photon, their calculations show. Rather, up to an infinite number of new light particles would sprinkle out of thin air.
The researchers shared their findings in a paper that will be published in Physical Review Letters.
Daniele Faccio’s first reaction to the study was: nonsense. “Then you read it, and I enjoyed it,” he says. Faccio is a physicist at the University of Glasgow in Scotland who did not take part in the work. “The technique is legit,” he says. “The results look absolutely reasonable.”
Photon interrupted
The key to the analysis is that photons don’t just act as pointlike particles. They also behave like extended waves. That got Johannes Skaar wondering: What would happen if you had a device fast enough to snip the wave of a single photon in half?
Skaar is a physicist at the University of Oslo in Norway. His team modeled a scenario where a photon is traveling toward a mirror. The front half of the light wave hits the mirror first. It gets bounced back in the direction it came from. But then, the mirror is suddenly removed. The back half of the light wave is then free to pass through.
This, the math shows, would spew out a complex mix — or superposition — of different possible numbers of photons.
Removing the mirror infinitely fast would conjure an infinity of new light particles. Infinite speed is, of course, impossible. But even pulling the mirror away more slowly has striking effects. “You end up with a possibility of several photons, or a bunch of photons,” Skaar says. You’re just much more likely to create small numbers of them than huge swarms.
“This is a bit strange,” allows Skaar. But in the quantum realm, he adds, it’s not actually that weird.
Quantum physics is the science that describes how the very smallest things, such as photons, behave. And it has already shown that supposedly “empty” space is not truly empty. There is some structure to the fabric of “empty” space, and disturbing it is known to knock new photons loose.
In this case, the mirror’s motion could provide the energy to spawn new light particles.
To Skaar, a possible cascade of new light particles isn’t the oddest outcome of the model. To him, the weirdest part is the math that describes what you’d see if you observed the system from different perspectives.
If you could view both sides of the mirror at once, you’d witness the messy eruption of up to bajillions of photons. But if you could only see one side of the mirror, you’d observe just one — or empty space.
“That is really crazy,” says Skaar. He hopes to probe what’s going on more deeply in future work. He also wants to explore what would happen if you tried to sever other types of fundamental particles. In quantum physics, particles such as electrons also act like waves. Attempting to snip them in half might lead to similarly bizarre results.
It’s not super clear what uses this research might have. “I’m going to speculate wildly here,” Faccio says. But “it might matter because there are funky things that people do with [photons] for sensing and measuring.” Gravitational-wave catchers, for example, play with light waves to detect ripples in the fabric of our universe.
Probing the nature of photons, Faccio says, may be helpful in fields that use such quantum sensors.
Disney’s Cinderella is not the only place you can hear mice “sing.” Some real-world rodents also serenade each other. And now, scientists know how. The mice inflate tiny, balloon-like sacs in their airways. This creates whistling tunes.
Making music this way may be unique in the animal kingdom.
The critters are known as Alston’s singing mice. Found in the forests of Mexico and Central America, they truly live up to their name. Both males and females communicate with trains of high-pitched notes. Remarkably, their songs are more complex than those of any other rodent.
In just a 10-second song, an Alston’s singing mouse belts out around 100 individual breaths and notes. The melody attracts mates and warns rival males to stay away, says Samantha Smith. The song’s speed and length make it far more “extreme” than other rodents’ calls, she adds. Smith is a biologist at the University of Lausanne. That’s in Switzerland.
Smith is part of a team that wanted to know how the vocal systems of Alston’s singing mice evolved to create melodies. They started by dissecting the larynges of deceased animals. This “voice box” is a part of their bodies that helps mice (and us) breathe, swallow and make sound.
Watch one Alston’s singing mouse serenade the sky with its complex song.
The researchers hooked each excised mouse voice box to a tube. Then, they pointed a microphone and camera toward its top. “A [voice box] is basically just a tube with a valve in it that can open and close,” explains Smith. To see how the voice box moved and produced sound, the team blew air through the tube.
Sometimes, the voice box produced sounds that ranged in the mouse’s natural pitch. But this happened only when a pouch on the inside of the voice box was inflated. When the researchers blocked this balloon with bits of wax or small metal balls, the voice box went silent. Cutting the sac had the same effect. The air sac, it seemed, is key to making the songs.
Other rodents have air sacs, but they don’t appear to use them to sing.
Smith and her teammates shared their findings May 6 in Proceedings of the Royal Society B.
A unique musical talent
Raffaela Lesch is impressed by the team’s experiment and its choice of species. She works at the University of Arkansas at Little Rock. As a bioacoustician, she studies how animals use sound to communicate.
“Working with [voice boxes] this small is not an easy task,” she says. But for Lesch, learning more about how rodents produce sound is exciting. They’re “such a diverse group with such fascinating social, behavioral and ecological adaptions,” she says.
It’s not yet clear how the sac generates its whistle. The sound could come from air vibrating at the sac’s entrance. That would be similar to the way opening a car’s sunroof can make noise as air rushes past the opening.
Another possibility is a bit like how flutes and organ pipes work. A sharp cartilage rim at the sac’s entrance may be deflecting air, producing the tone.
Inflatable sacs in airways have evolved multiple times. Primates, birds, reptiles, frogs and other animals have them. But in those cases, air sacs alter or amplify sound produced elsewhere in the respiratory tract. (That’s the system of organs that are involved in breathing.) The songs of the singing mice, on the other hand, are made by the sacs themselves.
“Our study expands our understanding of the ways in which [air sacs] can shape vocal communication,” Smith says. Studying different features of rodent air sacs may help reveal how these songs first evolved — no Disney magic needed.
Sometimes, pieces of Earth’s outer layer pull apart like taffy. Right now, part of Africa is being stretched to nearly the breaking point.
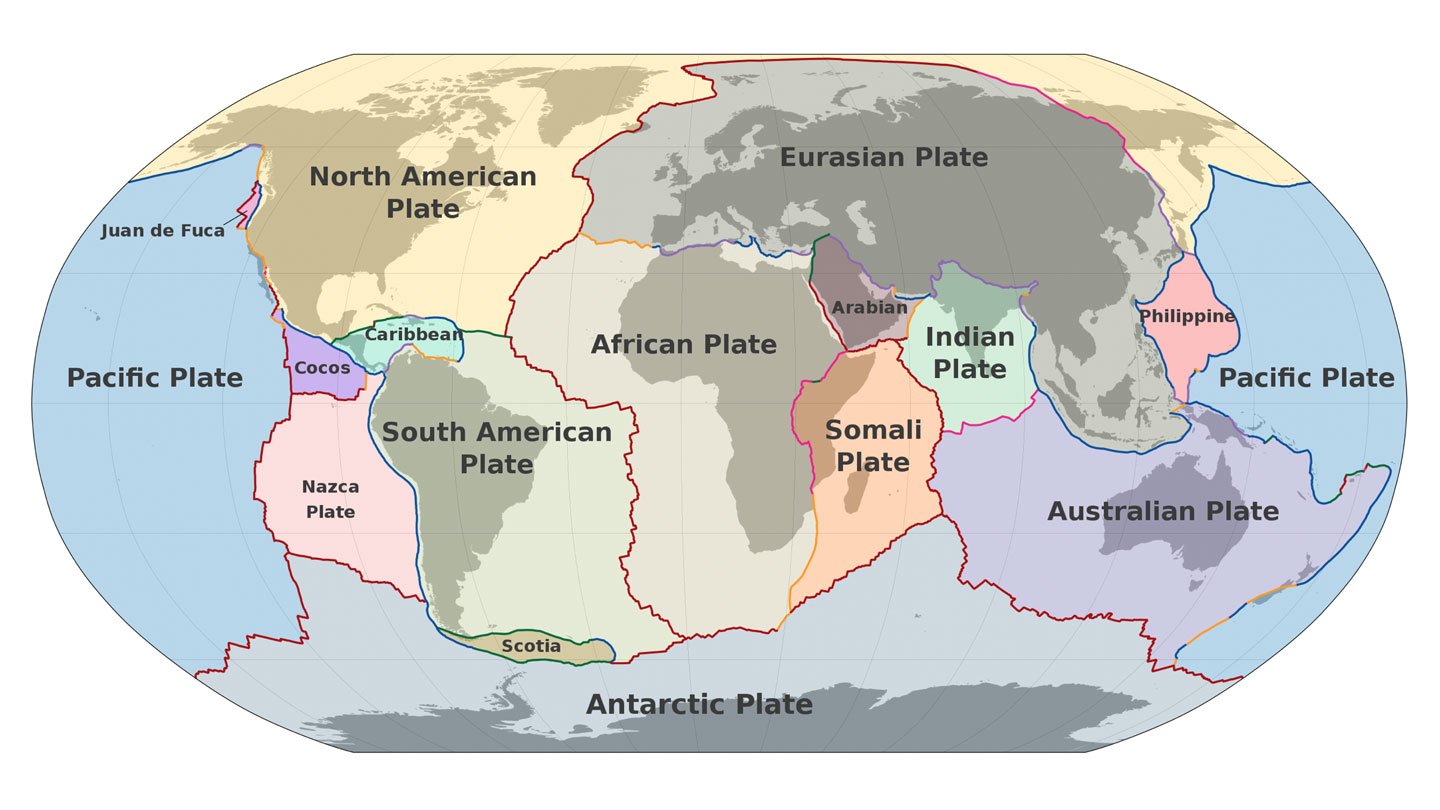
The giant jigsaw pieces of Earth’s outer layer are called tectonic plates. Scientists knew that the plates beneath eastern Africa are being tugged apart. The crust there is already thin and weak in places. But new data show that one region — the Turkana Rift Zone — is undergoing “necking.” It’s a key part in the process of a continent breaking up and has never been seen before.
The new observations hint that this part of East Africa may be closer to splitting — and doing so more rapidly — than previously thought. Researchers shared their discovery April 23 in Nature Communications.
Our planet’s tectonic plates are constantly in motion. This research focuses on the pulling apart of the African and Somali plates.M. Bitton (CC BY-SA 3.0)
The Turkana Rift Zone straddles the countries of Kenya and Ethiopia on Africa’s eastern edge. The region is best known for its wealth of fossils of our human ancestors. But rocks beneath this rift zone hold their own secrets.
Christian Rowan studies Earth science at Columbia University in New York City. He and his teammates looked at past data on the Turkana Rift Zone. They included sound-based measurements that had been taken to search for oil and gas. Sending sound waves into the planet and watching how they bounce around can create images of what’s below, Rowan explains. “It’s almost like an ultrasound of the upper crust.”
The point of no return
The team focused on a layer of metamorphic rocks beneath the planet’s surface. Those old, hard rocks form the crust under Earth’s continents. Rowan’s group traced those crustal rocks down to Earth’s mantle. They found one region where the crust was just under 13 kilometers (8 miles) thick.
That was a big surprise, Rowan says. The crust is usually about 30 kilometers thick. (That’s almost 19 miles.)
Earth’s crust had clearly been stretched a lot in the Turkana Rift Zone. That matched what scientists would expect in the necking stage of continental breakup.
“It’s kind of the point of no return,” says Sascha Brune. He works at the GFZ Helmholtz Centre for Geosciences in Potsdam, Germany, and did not take part in the research. He does, however, study how Earth’s interior and surface evolve over time.
Scientists have seen the aftermath of necking between tectonic plates elsewhere on Earth. But this process has never been observed in action. That’s what makes the Turkana Rift Zone so special, Brune says. “This is the place to go.”
See what’s causing East Africa to slowly split off from the rest of the continent, how that has affected the area’s climate and fossil record — and when a completely new island continent may emerge.
Past and future stretching
Rowan’s group wondered how long the Turkana Rift Zone has been in this breakup stage. To find out, they looked at a layer of volcanic rock that had once been at Earth’s surface. Over time, it has since been pulled down as the crust here has stretched apart and sunk in the middle. It shows the rift has been necking for roughly 4 million years.
The Turkana Rift Zone’s trove of fossils may exist due to that stretching and dipping. Sediments, some containing fossils, naturally build up in low-lying regions.
If the Turkana Rift Zone continues necking, it could enter the final phase of continental breakup. It’s a stage known as oceanization.
At that point, Earth’s crust tears, and the mantle beneath punches through. Magma from the mantle then oozes across Earth’s surface. Eventually, it cools and forms new oceanic crust.
Oceanic crust is denser than continental crust. So it tends to sink and collect water. (Hence why this dense crust is found beneath Earth’s oceans.) Water will now flow into the lower-lying parts. Over millions of years, an ocean could develop that would formally split off part of eastern Africa, creating a distinct landmass, Rowan says. “Eventually, eastern Africa will break apart.”
In X-Men, Warren Worthington III sprouts huge white wings from his back and shoots into the sky. Scientists have yet to fully turn that comic-book trick from fiction to fact. But virtual reality, or VR, is offering hints of what it’s like to fly.
Yanchao Bi is a cognitive neuroscientist at Peking University in Beijing, China. She long had dreamed of flying. “It would be amazing,” she says. “Your whole world would become different.”
In spring 2023, Bi shared this wish over coffee with Kunlin Wei. Wei leads the university’s motor-control lab. There, researchers use VR to study how people perceive movement. The conversation sparked questions: Could people learn to fly with wings in VR? And how would their brains change?
To answer those questions, Bi and Wei teamed up with neuroscientist Yiyang Cai. In a new experiment, the Beijing team coached 25 people via VR on how to move virtual wings.
This study shows how adaptable the brain is, says Jane Aspell. It’s interesting that the brain can adjust to “something as unhuman as a wing,” she says.
It also suggests, she adds, that the brain may adapt to other kinds of limb features. A cognitive neuroscientist at Anglia Ruskin University in Cambridge, England, Aspell did not take part in the new work.
Learning to wing it
Cai designed a weeklong training program for the human recruits. It was based on bird flight.
Participants wore VR headsets and motion-tracking gear as they looked into a virtual mirror. In it, they saw themselves as birdlike figures with huge, rust-colored, feathered wings. When they rotated their wrists and flapped their arms, the wings moved too.
Across a series of tasks, the 25 recruits learned to move their virtual wings. They flapped away from falling airballs. They stayed airborne over steep cliffs. They even steered themselves through rings in the air.
Some participants learned to fly on the first try. Others needed a few sessions to get it right. “You could clearly see them improving,” says Ziyi Xiong. One of the study’s authors, he’s a neuroscientist at Beijing Normal University.
Bi’s team also scanned the participants’ visual cortex. Some parts of this brain region are especially sensitive to images of our limbs. After training, those parts responded more strongly to pictures of wings. And their response to wings began to resemble their response to the upper limbs.
“Participants began to see the wings as part of their own bodies,” Bi concludes. This discovery could mean the brain adapts in response to change more readily than once thought.
The training did more than reshape the brain. It transformed how these people understood flight in ways that abstract knowledge cannot, Wei says. This might apply to other technologies and artificial senses, too. People might experience “reality” in ever more varied ways.
“In the future, we may spend a great deal of time in VR,” Wei says. “We are very interested in what that could mean for the human brain.”
Corn sweat is moisture released by cornfields during summer heat, particularly in the central United States. The scientific term for corn sweat is evapotranspiration. This process combines evaporation and transpiration. Those are both ways that water moves from the land into the air during Earth’s water cycle.
Evaporation happens when liquid water turns into water vapor and rises into the air. In the case of corn sweat, water evaporates from the surface of the soil in farm fields.
Transpiration is the movement of water from a plant’s roots to its surfaces. There, water vapor escapes through tiny holes on the stems and leaves. These tiny holes are known as stomata. Releasing water vapor through transpiration is an essential function for plants.
This animation shows how water is released into the atmosphere two ways. One is evaporation from soil. The other is transpiration from plants. Together, these two processes make up evapotranspiration. Mike Brophy/NASA

 Login