For thousands of years, farmers have prepared their fields for planting by overturning the soil. It helps them the manage the moisture, nutrients and flow of air underfoot. But modern farming’s deep plowing and heavy machinery often do more harm than good, researchers report.
All that soil turnover disrupts the natural paths that water takes to percolate into the root zone. And this is not a problem just for growing crops. Breaking down the network of pores that water wants to move through also makes the soil less resilient to flooding and drought. So concludes a team of scientists in the April 16 Science.
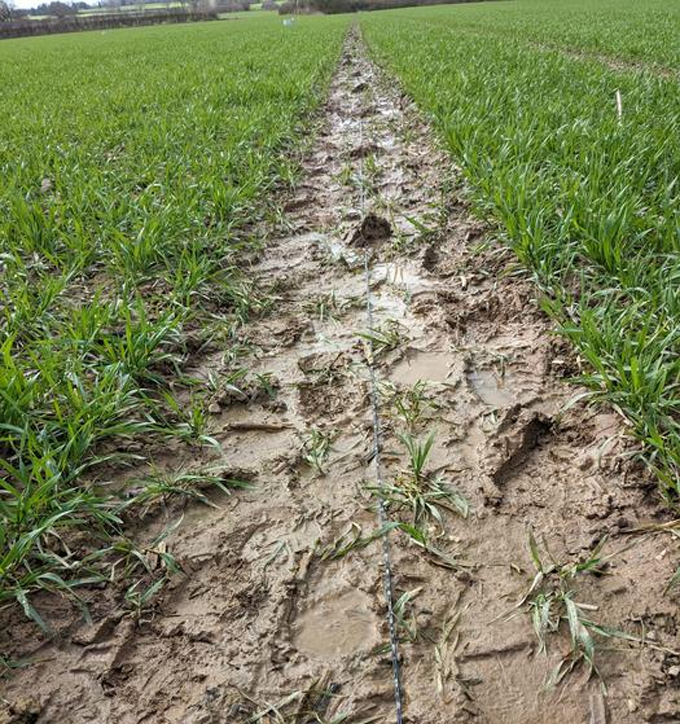
A fiber-optic cable, here laid along the relatively bare soil, was able to pick up tiny seismic signals. They’d been triggered by the movement of rainwater in the soil below.Marine Denolle
Qibin Shi is a geophysicist with the Chinese Academy of Sciences in Beijing. He was part of a team that fashioned a dense array of sensors out of fiber-optic cables. Such cables find use in more than just high-speed internet. They also can become powerful tools for seismology — and not just for earthquakes. They’re proving sensitive enough to detect even the tiny vibrations triggered as water moves through soil.
Shi’s group installed these cables along the edges of 27 plots of land at a university test farm in Newport, England. The plots were treated one of three ways. Nine went unplowed. Another nine were tilled to a depth of 10 centimeters (4 inches). The last nine were turned over to a depth of 25 centimeters (almost 10 inches). Within each group, plowing machinery of different weights were used. Why? The heavier they are, they more they can compact the soil.
For three days in March 2023, the team used its seismic-sensing system to track how the plots responded to rain. Rainwater didn’t seep down much on plots with the most compacted and deeply plowed soil. Instead, it tended to pool near the surface. Here, it could evaporate swiftly once the sun came out.
Water moved down and around more easily in the plots that were less compacted and less deeply plowed.
To understand what was happening, Shi’s team created a computer program that modeled the water’s movements. Rain, they found, moves through porous soil in a way that sort of mimics what happens to blood in capillaries — the body’s tiniest blood vessels. This process is known as capillary action.
Scientists used fiber-optic cables to study how turning over the soil in spring will affect rainwater’s ability to infiltrate the soil at this research site in Newport, England.Marine Denolle/University of Washington
Like our capillaries, the tiny, tunnel-like airways between specks of soil are very thin. Gravity does not drive water’s flow through these holes. Instead, as water tries to alternately adhere to soil particles and bind to other water molecules, it gets caught in a push-pull action. And that moves it. When those narrow pathways get disturbed or crushed, however, the suction forces strengthen, impairing the water’s flow.
Fiber-optic sensing could offer farmers a quick and inexpensive way to monitor soil moisture on a large scale, Shi’s team says. Such monitoring also could provide real-time warnings of natural hazards, such as flooding and soil liquefaction during an earthquake (when saturated ground can suddenly turn unstable due to shaking).
A parrot missing half his beak has become top bird at New Zealand’s Willowbank Wildlife Reserve. Named Bruce, he wins every fight with other kea parrots. He also gets priority access to food.
This observation has made scientists question their ideas about disabilities in animal social groups. Bruce showed that a physical disadvantage doesn’t have to hold an animal back. Sometimes the right moves and a little creativity can make all the difference.
Researchers shared this finding April 20 in Current Biology.
Willowbank’s kea live in a large aviary with trees and a stream. Visitors who stop by often fail to notice the parrots snoozing among the leaves. But when they spot Bruce, they always make the same comment, says behavioral ecologist Alex Grabham: “Look at that poor bird.”
That pity is misguided, says Grabham. He’s part of a team studying kea at the University of Canterbury in Christchurch, New Zealand. That team tracked how Bruce interacted with his flock. (A group of kea is called a circus, reflecting the birds’ playful nature.) Like other parrots, kea have a social hierarchy. This is a ranking system where some birds are in charge; others follow the leader. Birds compete for the top spot by fighting, squawking or puffing up feathers.
Meet Bruce, the disabled kea parrot that managed to become the alpha male of his flock.
Grabham’s team spent four weeks recording 162 physical confrontations between the nine males in Bruce’s circus. Bruce won all 36 of his. Without a doubt, he was the top kea.
What’s more, he’s the first disabled animal to be recorded achieving top status within a group, at least without support from an able-bodied ally. (Faben was a dominant, or “alpha,” male chimpanzee living at Gombe National Park in Tanzania. He lost his top rank after polio paralyzed his arm. Faben’s brother took over his alpha status, but also became his ally. Faben then worked his way back to second place after perfecting a charging technique to bat away rivals.)
Parrot jousting
Also key to Bruce’s success: an unusual combat technique. Other kea tend to rely solely on kicking to repel other birds. Bruce supplemented his kicks with a unique jousting technique. He jabbed at rivals with his exposed lower beak.
Grabham’s team filmed 109 more confrontations between Bruce and the other birds. During these, Bruce kicked slightly more than he jousted. But jousting proved much more effective. Jousting drove off his opponent 73 percent of the time. When Bruce kicked, he drove them off just 48 percent of the time.
As another kea approaches, Bruce (seen here on the right) jabs with his half a beak. This fighting style has helped the disabled parrot win alpha status among his circus in New Zealand.Ximena Nelson
Bruce’s top spot comes with perks. Other male kea will preen Bruce, helping to clean parts of his beak that he cannot reach. This is highly unusual among kea. Normally, they only preen their mates. The lower another male’s rank, the more likely he was to preen Bruce. This behavior mimics hierarchical grooming seen in chimps.
Lower-ranked birds also gave Bruce first dibs on food. The birds’ food was spread mostly between four central feeders. Over the four weeks that Grabham’s team analyzed Bruce, he was the first to dine at those feeders 83 percent of the time. On four days, the other birds gave Bruce 15 minutes of alone time with all four feeders. Later, they ate his leftovers.
Another kea preens Bruce (left). This helps remove food that gets stuck in Bruce’s beak. Alex Grabham
In many animal societies, top status comes at a cost. “An animal that is high up in the dominance hierarchy has to defend that position constantly,” says Amalia Bastos. She’s a comparative psychologist at the University of St Andrews in Scotland who used to study Bruce. Alpha male baboons, for instance, show higher levels of stress hormones called glucocorticoids (Glu-ko-KOR-ti-koids).
Grabham’s team measured those hormones in the birds’ droppings. Bruce, it turns out, was the most chill kea in his circus. It isn’t yet clear why. But Grabham thinks that Bruce is so dominant that other kea don’t mount any serious challenges to his throne. “He isn’t going to be followed around and beaten up or bullied or chased,” Grabham says. And Bruce “knows that.”
It’s unclear whether Bruce would have thrived as well in a wild circus as he has at Willowbank. Bastos points out that with his damaged beak, Bruce might struggle with tougher foods during the winter. In the wild, most kea circuses don’t have a fixed hierarchy. Birds join and depart groups throughout the year, constantly changing the rankings. For now, in Willowbank’s strict hierarchy, Bruce is boss.
This isn’t the first study to show Bruce is capable of innovation. In 2021, researchers reported his self-preening technique. He uses pebbles to clean his feathers. “Bruce has now shown twice that being different is not necessarily disadvantageous,” Bastos says.
Bruce gained renown a few years ago for showing tool use. To groom himself, the parrot would select a pebble and hold it just so. This pebble “tool” overcame the lack of a part of his upper beak.
A warming climate has been helping drive a global rise in sea levels. A new analysis now finds that hundreds of major studies missed just how much sea levels have risen. Past estimates were too low, the new study shows. On average, true sea levels are 20 to 30 centimeters (8 to 12 inches) higher than what past studies reported.
This means that the toll of future sea level rise is even greater than expected.
Katharina Seeger and Philip Minderhoud did the research. They work at Wageningen University in the Netherlands. These physical geographers evaluated data from 385 global and regional studies. All had been published between 2009 and 2025.
Knowing the rate of ocean rise is crucial for coastal planners around the world. It helps them predict when sea water will start to flood — and permanently cover — large swaths of land. The errors in past studies, the researchers say, mean that coastal land may disappear faster than expected. In some places, it could vanish as much as a century sooner than thought.
The team shared its findings in the April 16 Nature.
A one-meter (39-inch) rise in sea level — which could happen within a century — could submerge an area more than 30 percent bigger than scientists thought. That would take away land from 77 to 132 million people. That’s 48 to 68 percent more people than previous estimates.
Sea level rise is slow. But it’s also dangerous if you ignore it, says Anders Levermann. “That’s basically what we’ve done, unknowingly,” he says. “These estimates now tell us that we are much further in the future than we thought we were.” A climate scientist, Levermann works at the Potsdam Institute for Climate Research in Germany.
One problem: geoids
Some of the analyzed studies had focused on sea level rise. Others had focused on storm surges, tsunamis or other coastal hazards. And a common mistake emerged in nine out of every 10 of the studies, the researchers say.
It had to do with the type of data used.
Researchers usually gauge coastal flood hazards by comparing a site’s land elevation to sea levels. Ideally, those sea levels come from actual measurements. Those can come from satellites. Or they could be from tidal gauges, ocean buoys or other tools.
But few of the studies Seeger and Minderhoud reviewed had included such direct sea-level measurements. Instead, the studies had relied on wonky, digital shapes called geoids (GEE-oids).
Geoids are imaginary shapes. They’re meant to approximate Earth’s sea level. They don’t show big ice sheets or giant mountain peaks. Instead, they show Earth as a sort of irregular ball of water with an undulating surface.
This image shows how two average global surface models can vary from Earth’s actual land elevations and sea level. The geoid model (green hashed line) appears lower than the ocean height and far lower than an alternative ellipsoid model (red hashed line).USGS; adapted by L. Steenblik Hwang
But there are two key problems to using geoids to gauge sea level, Seeger and Minderhoud say. First, geoids can be off by several meters. Gravity data are key for making geoids. So geoids are less accurate where gravity data are poor. Those areas include the Global South.
Second, geoids do not account for many other things that can affect sea level. These include ocean circulation and currents. Winds, tides and water temperatures also play roles.
It’s possible to correct for these geoid problems, Minderhoud said at a March 3 news briefing. But the new research shows that few scientists studying coastal hazards make those fixes.
Geoid assumptions led to errors in 90 percent of the reviewed studies. Another 9 percent did not align measurements of sea level and land elevation properly. Fewer than one percent of the studies properly aligned such data, Seeger said.
A drone view of these homes in Summer Haven, Fla., show they are already so close to sea level — and at times partially below it — that they can easily be washed away as sea levels continue to climb. Aerial_Views/E+/Getty Images Plus
Average errors varied by region
To see how far off sea-level numbers had been in most studies, Seeger and Minderhoud turned to satellite data. These data measured sea-surface heights globally. Compared to these, geoid-based studies had underestimated coastal sea level by an average of 24 to 27 centimeters (about 10 inches).
Errors were more than three times that size for some places. Among these were parts of Southeast Asia and the Indo-Pacific.
For a few places, estimates of sea levels had actually been too high. These regions included the northern Mediterranean and Antarctica. That was also true for some islands in the Atlantic and Pacific.
Study estimates were closest for eastern North America and northern and western Europe. Overall, though, most measured sea levels were higher than what past studies had published.
This means the advance of the oceans “is even worse than what’s been reported,” says Patrick Barnard. A coastal geologist, he works at the University of California, Santa Cruz. The new work, he says, is important for planners. It suggests they should be cautious when using findings from big-picture studies to guide local efforts to adapt to sea level rise.
To help future studies, Seeger and Minderhoud have publicly shared coastal sea-level data. These include the most recent actual measurements.
Topology is a field of math that focuses on how molding or stretching a shape alters the space it takes up.
In a way, topology is similar to geometry. Both fields study shapes. However, geometry focuses on rigid measurements, such as the length of lines in a triangle. It answers questions like: If I change the length of this line, how will the other lines change? In geometry, the new triangle is considered a different triangle altogether.
The shape of a mug can stretch and morph into the shape of a donut without cutting or adding any pieces. For that reason, a mug and a donut can be members of the same topological family. Lucas Vieira/Wikimedia Commons (Public Domain)
But topology does not focus on such rigid measurements. Instead, topology treats the study of shapes like a game. As in a game, a topologist sets out certain rules. Then, they explore what shapes are possible within those rules.
For instance, a rule might be that all the shapes in a certain family can morph into one another without tearing or gluing parts together. You could explore this yourself by squeezing a water balloon. As you watch the balloon warp, you see continuous changes to its shape. Squeezing the middle causes the outsides to bulge. But the balloon doesn’t break or form new connections. So, all the shapes the balloon takes still obey the rule.
A mathematician might say that all the shapes of this balloon belong to the same topological group.
Another rule might be that all the shapes in a group must have one hole. A donut is an obvious member of this group. But so is a mug. If you made both of these shapes out of clay, you could remold one into the other without tearing the clay or attaching any new pieces. Under the one-hole rule, they are in the same topological family.
A particularly mind-twisty rule might be that all shapes in a family have “non-orientable surfaces.” That means the shape doesn’t have a clear outside and inside. A loop with a twist in it, called a Möbius strip, is a famous example.
A Möbius strip is a curious shape with no set inside or outside. A ball would be able to roll over the entire surface of the strip without having to jump from one side to the other. This is one example of a famous shape in topology.PeterHermesFurian/iStock/Getty Images Plus
Topology can be represented in many ways. Computer models can render and play with shapes. The math of algebra can describe concepts in topology, too.
Setting up rules for shapes and playing around with them is more useful than you might think. It helps scientists understand what is physically possible and impossible. Engineers can use these insights to imagine new technologies. Cosmologists use topology to describe the shape of our universe. And physicists who study string theory use it to probe the nature of matter.
A small member of our solar system out beyond Pluto may be shrouded in a thin layer of gas. If so, it would be the first object of its size — and the most remote rock in our solar system — known to host even a wispy atmosphere.
“This discovery suggests that small icy worlds beyond Neptune may not be as inactive or unchanging as we often assumed,” says Ko Arimatsu. “Until now, Pluto was the only [object beyond Neptune] with a confirmed atmosphere.”
Arimatsu is an astronomer at the National Astronomical Observatory of Japan. It’s in Mitaka. His group shared the new finding May 4 in Nature Astronomy.
Arimatsu’s group tracked the object — known as 2002 XV93 — with a network of telescopes in Japan. On January 10, 2024, those telescopes saw it move in front of a distant star. Such tiny eclipses are called occultations (Ah-kul-TAY-shuns). They can reveal whether some object in our solar system hosts an atmosphere.
If 2002 XV93 were bare, the star behind it would have seemed to blink out and reappear sharply. But Arimatsu and his teammates saw the star’s light gradually fade and reappear over about 1.5 seconds. That smooth dimming is best explained by starlight passing through a layer of gas. Those data suggest this thin atmosphere has a pressure about one ten-millionth that of Earth’s.
“I was genuinely surprised,” Arimatsu says. The object is about 470 kilometers (290 miles) wide. The Grand Canyon is about that long. At such a small size, 2002 XV93’s gravity should be too weak to hold on to a gas for long. So its atmosphere should have vanished long ago, unless something has added new gas to it.
Perhaps an icy body like a comet recently smashed into 2002 XV93. That could have released a plume of gas around the object. Or maybe 2002 XV93 releases gas regularly from icy volcanoes on its surface.
The astronomers can’t be certain what’s going on just from viewing 2002 XV93 pass in front of one star. The data couldn’t show what the atmosphere is made of. So the small body might even be swaddled in dust, not gas, Arimatsu notes. Nor could they show how high above the body’s surface any atmosphere extends.
“Future observations will be important,” he says. Say its atmosphere fades over the next few years. That could mean he had detected a plume kicked up by an impact. If it sticks around or varies over time, that might make a case for surface volcanoes.
PHOENIX, Ariz. — When someone says they’re “addicted to caffeine,” it might not seem that alarming. After all, many people rely on a morning coffee or an afternoon energy drink to get through the day. But Sophia Zeng, 16, says we might need to reconsider our attitudes about one of the most common drugs in the world.
Her research hints that caffeine might impact genes involved in brain development. And it may affect kids and adults in different ways.
After noticing that she and her mother responded differently to caffeine, Sophia Zeng did a series of experiments to explore the effects of this common drug on developing brains.K.G. Carpenter
The American Academy of Pediatrics advises that kids avoid caffeine. Yet many kids and teens consume caffeine in some form every day. Sophia is one of those caffeine drinkers. She first got curious about the effects of this drug when she noticed differences in how she and her mom reacted to caffeinated tea.
Sophia’s mom is “really a tea lover,” she says. “After drinking tea, she would feel more focused.” But drinking tea didn’t always leave Sophia feeling good. “If I stopped drinking it, I’d receive headaches,” she says. To get rid of those headaches, she needed more caffeine. That got Sophia wondering: Why does caffeine make some people feel happy and helpful, while leaving others with increased stress and headaches?
Sophia’s work earned this sophomore from Tsinghua International School in Beijing, China, a spot at the 2026 Regeneron International Science & Engineering Fair, or ISEF. This is a program run by the Society for Science (which also publishes this magazine). Sophia was among 1,725 students from 65 nations or territories who competed in 2026. Participants shared nearly $7 million in prizes.
A three-stage approach
Dye-ing for caffeine
These images show a decrease in rat neuron complexity with increasing caffeine exposure. The “control” group was exposed to no caffeine. “NGF” neurons were exposed to nerve growth factor, which is expected to promote neuron growth. Other neurons were exposed to low, medium and high levels of caffeine. MAP2 is a protein on the surfaces of cells. Red fluorescent dye binds to those proteins to reveal neurons’ shapes and growth. DAPI is a fluorescent dye that highlights the nuclei of cells. Together, these colorful tags reveal that with increasing levels of caffeine, fewer neurons grow and fewer connections form between neurons. S. Zeng
The first thing Sophia did was look at past data on caffeine. She analyzed published studies with the goal of identifying new patterns. This approach is called bioinformatics.
Sophia focused on studies that had looked at how caffeine affected the brains of adult mice. Her analysis suggested that caffeine could alter which genes in a mouse’s DNA were active, or expressed.
Next, Sophia took her work to a lab. She grew rat brain cells in petri dishes for six days, then exposed the cells to different levels of caffeine. Two days later, she compared the neurons under a microscope.
To make the neurons show up clearly, Sophia used fluorescent dyes that bind to the cells. Dyes can highlight important features, such as how the cells are forming connections with one another. Those neuron-to-neuron connections are called synapses.
Dishes exposed to more caffeine contained fewer neurons, Sophia found. What’s more, those neurons showed fewer connections. Caffeine seemed to make neuronal networks simpler and scarcer.
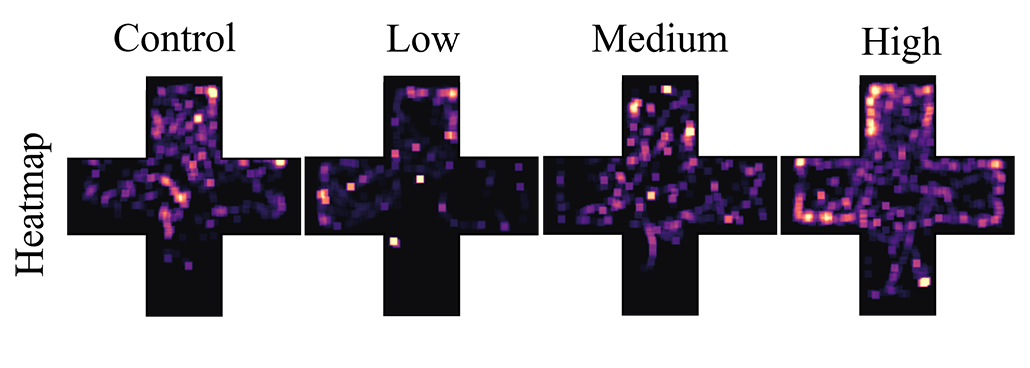
In another set of experiments, Sophia studied young zebrafish that had been exposed to different levels of caffeine. She looked at how far the fish swam and where. More caffeinated fish swam more, she says. They also made erratic choices, spending time in regions of their tank that calm fish typically avoided. Both of these findings hinted that the fish that got more caffeine were more anxious.
But Sophia didn’t stop there. She looked at what changes in the fishes’ brains might have led to this behavior. Sophia measured the activity of four genes involved in brain development. All four were less active in the caffeine-exposed fish, she found.
Takeaways for caffeine drinkers
Interestingly, some genes in the young zebrafish were turned down, or less active, in a way not seen in the neurons from adult rats. So, caffeine may affect the brain differently at different ages, Sophia says. But together, the mouse brain data, the rat neuron experiment and the fish studies all point to the same pattern. Caffeine seems to affect gene activity in neurons. And that in turn may impair brain development and behavior.
Past caffeine exposure changed the movement patterns of zebrafish. As caffeine exposure increased, fish moved more erratically throughout the four zones of their aquarium. (The bright dots on the heatmaps show where the fish swam.) This evidence points to behavior changes and increased anxiety linked to caffeine.S. Zeng
“I feel that we really don’t talk about caffeine, even though we drink it,” Sophia says. It’s in so many everyday drinks, she adds. Between soda, tea and other beverages, young people may be consuming a lot more of it than they realize.
Sophia suggests greater skepticism about using this drug. People tend to think about caffeine as a helpful tool for focus, she notes, and dismiss potential downsides. But her findings highlight that caffeine comes with trade-offs — and those trade-offs may harm young brains more than we know.
When Victoria Glynn was a teen living in Honduras, she enjoyed making art. But that wasn’t her only interest. “Growing up in Central America, I was just surrounded by all of this amazing biodiversity,” she says. So, when it came to college, Glynn opted to study environmental science.
For undergrad studies, Glynn moved to the United States to attend the University of California, Berkeley. While there, she worked in a lab that genetically engineered yeast to produce biofuel. But she had a problem: Glynn was struggling to find diagrams to accompany talks about her research. Her mom suggested that she use her skills in art and make her own. “At the time, I wasn’t seeing other people doing that,” Glynn says. “It felt like science was in one corner, and all the arts and humanities were in the other.”
Glynn soon found other ways to bridge science and art. As an undergrad, she taught refugees and children who had recently arrived in the United States. She sometimes worked in classrooms where the students spoke many different languages. Art became a “common language for all of us to be on the same page,” she says.
Now as a visiting researcher at the University of Connecticut, Avery Point, Glynn studies how plankton are adapting to high temperatures. In this interview, she shares her experiences and advice with Science News Explores. (This interview has been edited for content and readability.)
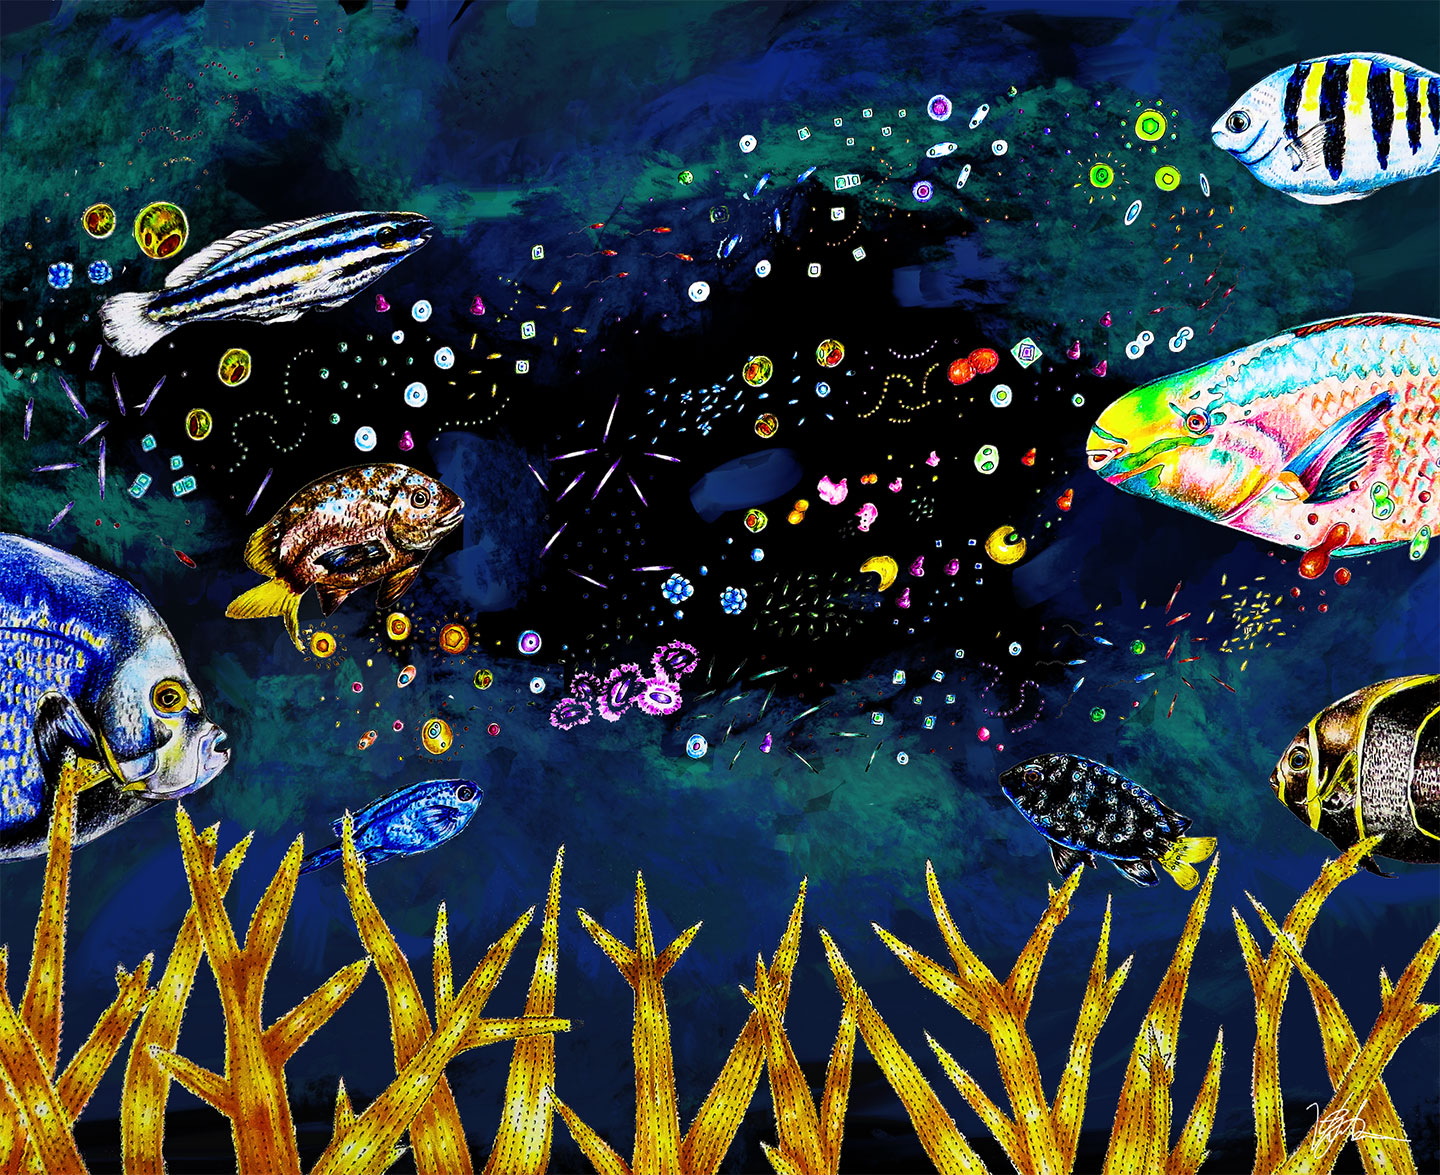
Glynn uses traditional media such as colored pencils and watercolor to create scientific illustrations.V. Glynn
What inspired your career?
I think what really inspired me was an undergrad class at Berkeley. One of my best friends recommended that I take this particular genetics course. I was unsure since the course wasn’t a requirement for my degree. The class seemed very removed from my interests at the time, but I still decided to enroll. I felt college was a time to explore and learn from various fields.
I remember something just clicking in my brain during one of the first lectures. Genetics and DNA felt so powerful. All organisms have DNA, which means you can track it and directly measure how it’s changing over time. Essentially, how it is evolving and mutating. After this class, I really wanted to dive into this topic more deeply.
How did you get to where you are today?
I didn’t do a lot of marine biology work until I was in my PhD. The lab I joined for my PhD at McGill University in Montreal, Canada, was looking for someone who did genetics work, preferably in marine invertebrates. I happened to fit the bill and was interested in the project. We would take corals from their home environment and bring them onto a boat to conduct temperature stress experiments. We were interested in seeing how they build up resistance to bleaching.
Corals are beautiful animals, but they’re very hard to rear in the lab. They’re very delicate animals that do not like being in tanks. They even struggle out on the reef. That unpredictability makes experiments very difficult.
For my post-doc, I switched to studying plankton to better understand how marine organisms are being affected by warming oceans. I needed an animal that could evolve quickly over multiple generations. Plankton are much easier to grow. In as little as 11 days, you can have adult plankton that lay eggs. Compare that to corals. Some species are so long-lived that they will not reproduce within our lifetime.
How did you decide to study science education?
I loved being an environmental science major, but I often missed that human connection when spending time in the lab. I also felt that sometimes the best researchers were not always the best at communicating their work with the general public. I wanted to share what I was learning with those who are the most affected.
Improved science communication leads to better science. In turn, embracing different backgrounds improves science education. It allows more people who are taking these courses to feel empowered and actually pursue STEM degrees. [STEM stands for science, technology, engineering and math.]
As an evolutionary biologist, Victoria Glynn has conducted field work underwater, such as sampling corals in Panama’s Las Perlas Archipelago.Michael Connelly
Scuba diving is both a hobby and part of your work. When did you pursue that?
Both of my parents are divers. When I was younger, they would always talk about it. Honduras is also one of the most affordable places to get dive certified. So when I turned 12, I decided to go for it.
As I was applying for my PhD, my mother suggested that I add diving onto my CV. [A CV, or curriculum vitae, is the academic version of a resume.] I doubted whether people were going to care but added it anyway. That was the one line out of my entire CV that my future PhD advisor picked out during our interview. He was looking for someone who could handle both diving in the field and doing molecular work in the lab.
That taught me that the experiences you may not see as valuable in professional settings may be what sets you apart. You don’t know where these experiences are going to lead.
What advice would you give those pursuing careers in STEM?
Oftentimes, you find the most unlikely mentors outside of your direct field of study. I think those can be the most important. Sometimes, those people gave me more powerful personal advice than my formal supervisors did. STEM degrees are difficult. But with a good support system, anything is possible.
Many bees have a shimmery exoskeleton. So this reversible mood-ring–like effect might be quite common, scientists now say. The day-to-day color of other bees and insects might similarly change with humidity.
Jorge De La Cruz is a college student at the University of California, Santa Barbara. There, he’s training as an evolutionary biologist. He first noticed the color-change effect while preparing bee specimens for preservation and study. This was at the Cheadle Center for Biodiversity and Ecological Restoration.
Museum scientists often place insect specimens in a moist chamber. It makes them more flexible for mounting and imaging. And under moist conditions, some bees appeared to starkly shift their color. This caught De La Cruz’s attention.
“It can be a bit alarming when you’re not expecting it,” says Madeleine Ostwald. This ecologist works at Queen Mary University of London in England.
De La Cruz and Ostwald teamed up with two other researchers to look into this further. They shared what they learned April 22 in Biology Letters.
This sweat bee was photographed in Seattle, Wash. Its exoskeleton changes color with the humidity. Other iridescent insects may pull a similar color-change trick.Mike Davidson/iNaturalist
Humidity changes hue
The team studied two dozen museum bee specimens. All were fine-striped sweat bees (Agapostemon subtilior). The bees were exposed to high and low humidity for 55 hours each. After each exposure, the team took photos.
The researchers also reviewed more than 1,000 photos of living sweat bees. These came from the citizen-science app iNaturalist. Here, too, they noted the humidity present when an image had been taken.
In dry conditions (less than 10 percent humidity), the bees were blue-green. But at 95 percent humidity, they turned a light, coppery green.
Humidity may cause layers in the bees’ exoskeletons to swell. That may change how those layers reflect light, creating an iridescence. That layering appears to scatter light at different wavelengths, creating colors. If the layers swelled, the space between them would increase. The extra space would reflect longer, redder light.
“Because we saw redder bees in more humid conditions, this fits with that [scientific explanation],” Ostwald says.
Future work with high-powered microscopes might confirm this. Lots of insects produce color with tiny structures rather than pigments, Ostwald says. So, the phenomenon might be widespread.
Color can be really changeable as something responds to the environment, she says — and “in ways we didn’t expect.” It’s important to study the color of the living organism in its natural environment to know its true hue.
When you imagine a waterfall, what comes to mind? Maybe a misty cascade into a blue pool surrounded by trees. Perhaps the roar of water splashing down, as well. It’s a big mystery how brain activity differs when imagining a waterfall versus seeing or hearing one in real life. Brain scans now suggest some activity when you imagine something is similar to what happens when you see or hear the real thing.
But that overlap did not appear in brain areas that deal with single senses. Instead, it showed up in high-level brain networks. These are ones that handle inputs from multiple types of senses.
Researchers shared these findings March 31 in Neuron.
Imagining a scene such as this one activates various areas of the brain, a new study shows. sara_winter/iStock/Getty Images Plus
Neuroscientist Rodrigo Braga led the research. “When I was a teenager,” he says, “I remember the first time realizing that there’s like a voice I can hear in my head.” This “internal monologue” narrates one’s own thoughts.
“That’s really strange,” Braga recalls thinking. “Why is it that we experience those thoughts and sensations almost as if we’re perceiving them?”
He’s spent years trying to answer that question. He now works at Northwestern University’s Feinberg School of Medicine. It’s in Chicago, Ill. In a new study, his team asked eight people to imagine scenes, faces, someone else speaking, their own internal monologues and other sounds. All the while, an MRI machine scanned their brains.
Having hours of MRI data on all eight people allowed the team to create individualized brain maps for each. These showed how each person’s brain activity changed during imagination.
The imagination prompts that people got were open-ended. One was: “Imagine a castle on a hill.” Another: “Imagine a rock song playing on the radio.” After each prompt, the scientists asked people what they saw and heard in their heads. The questions probed how vivid each imagined experience had been — how clear and realistic it felt.
After completing the brain scans, Braga’s team asked follow-up questions. These explored what made some mental images more vivid than others.
Under the hood of imagination
The researchers grouped their data into two buckets. In one, they put the data on imagined locations and events. In the other, they grouped the data on imagined speech and language.
When people were thinking about locations or events, they reported highly vivid sights in their mind’s eye. Activity also went up in their brains’ “default network A.” This is a system of nerve cells in the brain — neurons — known to process real spatial information.
When people thought about speech or language, they reported hearing highly vivid sounds in their heads. Activity also spiked in their brains’ language network. This system of neurons is usually involved when someone reads or listens to speech.
In short, imaginary sights and sounds both enlisted parts of the brain used to process real experiences.
But imagined sensations did not activate sight- and sound-specific parts of the brain. Rather, the default network A and language network respond to new information — no matter what sense it had entered through.
Other studies have found that when someone imagines a certain object they’ve just seen, vision-specific brain regions light up. In this study, prompts to imagine more general scenes did not do that.
That might be because the basic visual areas of the brain respond to details like edges, colors and lines, says Nathan Anderson. Those fine details might matter when someone is asked to picture a real object they saw. But, he notes, “people don’t necessarily imagine fine details when they are imagining a [general] scene.” So the neurons that handle specific visual details aren’t needed. Anderson is a neuroscientist who took part in the study. He works at Brigham Young University in Provo, Utah.
These findings don’t surprise Stephen Kosslyn. Since the prompts didn’t ask people to imagine detailed sights or sounds, he says it makes sense that the brain regions linked to those tasks didn’t light up. Kosslyn is a neuroscientist at Harvard University in Cambridge, Mass. He did not take part in the new work.
Open-ended prompts are a strength of the study, says Alfredo Spagna. A psychologist, he works at John Cabot University in Rome, Italy, and did not take part in the study. Everyday mental imagery is likely closer to imagining a castle on a hill than it is to picturing the tiny details of something you just saw, he says. So the open-ended prompts used here probably closely mimic what’s happening in our brains day-to-day.
But there’s still much to learn about how the brain conjures sights and sounds that feel so real. “This is one of the many papers that will come out in the next years that try to break down this obscure concept of vividness,” says Spagna.
Synesthesia is a trait that some people have in which one kind of sensory input triggers other senses. To someone with synesthesia, different colors may have different tastes. Or hearing certain sounds may cause them to see certain shapes.
This phenomenon is not a mental illness. Rather, it is considered a form of neurodiversity. Up to 4 percent of people may have some form of synesthesia.
This trait takes many forms. Grapheme-color is one type. This means that a person sees letters or numbers in different colors. For instance, when a person sees the number 7, it may always appear yellow. About 1 percent of people share this trait.
Another type is called chromesthesia. That’s when hearing a sound causes a person to see colors or shapes around them. Historians think that Vincent van Gogh, a 19th-century painter, may have had this trait. He described seeing colors around him when he played the keys of a piano.
Other famous artists, such as singer and songwriter Billie Eilish, have described this experience, too. “Everything that I make I’m already thinking of what color it is, and what texture it is, and what day of the week it is, and what number it is, and what shape,” the musician told iHeart Radio.
Scientists are not sure exactly what causes synesthesia. But they believe it is at least partly linked to a person’s genes.
Soon after the crash, it was clear that DART had knocked its asteroid closer to Didymos, an even bigger rock that it orbits. Now, NASA reports that the smashup had an even bigger impact. It changed the asteroid duo’s speed as they orbit the sun together.
DART’s crash landing slowed the asteroid pair by 10 micrometers per second. That might not sound like much. But tweaking the motions of space rocks millions of kilometers (miles) from Earth is a huge deal. It could inform plans for shielding our planet from future asteroid strikes.
Researchers shared the findings March 6 in Science Advances.
DART is short for Double Asteroid Redirection Test. The initial goal had been to simply nudge Dimorphos into a tighter orbit around Didymos. Mission leaders aimed to cut 73 seconds off Dimorphos’ nearly 12-hour path around its partner. In reality, the crash shortened Dimorphos’ orbit around Didymos by 32 minutes.
Most of that change came from the impact itself. Like giving the asteroid a big shove, the spacecraft pushed Dimorphos closer to Didymos. The crash also blasted rocks off Dimorphos’ surface. The motion of that flying debris gave the asteroid an extra kick.
But some of the debris knocked off Dimorphos didn’t just leave that space rock. It escaped the gravity of the two-asteroid system altogether. That escaping debris took some momentum away from the duo. As a result, their joint motion around the sun changed, reports Rahil Makadia. He studies planetary defense at the University of Illinois in Urbana–Champaign.
Clues in tiny eclipses
To figure out how much the asteroids’ motion changed, astronomers watched the rocks pass in front of distant stars. As the asteroids passed by, they dimmed some of the stars’ light — like tiny eclipses. These blinks can be seen only from specific locations, which can fall anywhere on Earth.
Astronomers could predict when Dimorphos and Didymos should pass in front of stars, based on their old path around the sun. By comparing those predictions to observations, they could see how much the asteroids’ path changed after DART’s hit.
Between October 2022 and March 2025, Makadia and the team gathered 22 such measurements. Amateur astronomers provided a lot of these data, Makadia says. “There was an observer who drove two days each way into the Australian outback to get these measurements.”
The asteroids’ orbit around the sun was about 150 milliseconds longer than before the DART impact, the new data show.
The European Space Agency’s Hera spacecraft will reach Didymos and Dimorphos later this year. When it does, the spacecraft could confirm the asteroids’ new orbit.
Didymos and Dimorphos were not a threat to Earth before DART. They aren’t now, either. But knowing how an impact changes one asteroid’s orbit can help figure out how to defend Earth from a dangerously big incoming space rock. That’s crucial, Makadia says, “in case we need to [deflect an asteroid] for real.”
Take a plunge into Australia’s Great Barrier Reef, and you’ll come face to face with a what looks like a gorgeous rocky garden. This dazzling array of corals is the largest living structure on Earth. Some, like staghorn coral, look like leafless bushes sprouting from the ocean floor. Others, such as honeycomb coral, resemble rocks dotted with tiny holes. Then there’s brain coral, which, you guessed it, look like brains. And that’s just a small sample of the brilliant diversity to be found in a reef.
Despite their appearance, corals are animals. These invertebrates are close relatives of jellyfish and sea anemones. Most corals live in colonies of thousands of tiny individuals called polyps growing together. Each polyp sports a cylindrical body topped with a ring of tentacles surrounding its mouth.
“You can think of them as upside-down jellyfish,” says Peter Cowman. At Queensland Museum Tropics in Townsville, Australia, this marine biologist studies the evolutionary history of corals.
A coral looks somewhat like an upside-down jellyfish, one that is attached to a skeleton made of calcium carbonate. In the coral’s tentacles are stinging nematocysts that help it catch prey and zooxanthellae that make energy from sunlight.ttsz/iStock/Getty Images Plus
Like their jellyfish cousins, coral polyps use tentacles to feed and defend themselves. These appendages are packed with specialized stinging cells called nematocysts. Each contains a coiled, barbed thread. When touched, the cell “fires” this thread to inject venom into its target. Most corals hunt at night, snagging tiny zooplankton, floating eggs and small fish.
Many corals have a more laid-back way of feeding, too. Inside their tissues, they house algae called zooxanthellae (Zoh-uh-ZAN-thuh-lay). (This is an example of symbiosis, where two creatures benefit by associating together.) These single-celled organisms are photosynthetic. They use light and carbon dioxide to make sugars and proteins. Most of these nutrients are offered to the coral. “In return, the coral gives them a safe apartment to live in,” says Cowman. “They’re the solar-powered roommates.”
Corals that rely on light-powered algae live in shallow, warm waters. It’s here where you find coral reefs. These structures are made by a type of coral called hard or stony corals. “They are the engineers of the reef system,” says Cowman.
Stony corals produce hard skeletons of aragonite, a mineral made of calcium carbonate. Over hundreds to thousands of years, generations of polyps can build up massive reef systems.
Soft corals, like their name implies, don’t make these stony skeletons. Instead, they have bendy structures that move with ocean currents. They can often be found living among reefs, though. “The soft corals are like the decorators,” says Cowman. “They look like underwater swaying trees and fans.”
Some corals — both soft and hard — can live in deep water, up to 6,000 meters (20,000 feet) below the water surface. Stony corals found at these depths are often smaller than their shallow-water counterparts. Most tend to live as single polyps. Some species do create reefs, but they’re less of a team effort. Called “mounds,” these deep reefs grow over the skeletons of old or dead corals on the ocean floor.
Reefs at risk
The first true corals appeared about 500 million years ago. But many of today’s reef-building corals can be traced back to the end of the Cretaceous Period some 66 million years ago. That’s when an asteroid impact wiped out about 80 percent of all animals (including the nonbird dinosaurs).
“The mass extinction had an effect in the oceans as well,” says Cowman. Existing reef-builders died out. Their extinction allowed stony corals to take their place. Today, corals are found in all of the world’s oceans.
But many are at risk from human activities. These dangers include pollution and destructive or heavy fishing. One of the biggest threats is climate change. High water temperatures and too much sunlight can stress corals, leading to a phenomenon called coral bleaching.
When coral is stressed, such as when water temperatures are high, it can lose its algae — and its color. If the stress goes away, the algae may return. If not, the coral remain pale and vulnerable.NOAA
At higher temperatures, the algae produce toxic compounds. “When the water gets too hot, the coral gets stressed and they evict their zooxanthellae,” says Cowman. These microbes are also responsible for a coral’s bright colors. In their absence, the coral’s tissues turn transparent. All that remains visible is the coral’s white skeleton.
Bleaching doesn’t kill the coral immediately. If conditions improve, the coral may recover and even take the algae back in. But if coral go too long without their algal partners, they may get sick or die. “If they can’t get the zooxanthellae back in again, they [will] actually starve to death,” says Cowman.
This bleaching affects coral worldwide. Since 2023, the world’s corals have been experiencing the largest bleaching event on record.
Coral reefs, such as this one off Florida, face many risks, including climate change, pollution and overfishing. DurdenImages/iStock/Getty Images Plus
Rainforests of the sea
Many scientists and conservationists are concerned about corals’ future. Coral reefs are among Earth’s most diverse ecosystems. Though they cover less than one percent of the seafloor, coral reefs support at least one-fourth of all marine species. “On land, you think of rainforests as having all that diversity,” says Cowman. “The rainforests of the sea are the coral reefs.”
Corals are important for people, too. Humans rely on many reef-dwelling species for food. Reefs can also buffer coasts against damage from strong waves or storms, says Cowman. Chemical compounds from reef animals have been found to help fight pain and treat cancer. And reefs support tourism around the globe. The food, products, jobs and coastal protection provided by corals are estimated to be worth $2.7 trillion per year.
Says Cowman, “as humans, we rely on reefs a lot in our daily lives, even if we don’t think of it.”
Meteorites that are billions of years old. Alienlike worms. A blue whale’s massive jaw bones. These are just some of the millions of marvels at the Smithsonian Institution.
Most are part of the Smithsonian’s National Museum of Natural History collection, a trove of nearly 150 million objects. It includes a spectacular array of preserved life forms, rocks and cultural artifacts from around the world.
Few people have ever seen this vast collection of astonishing objects. The museum in Washington, D.C., only displays a small share of the items. Most sit tucked away in huge storage pods at the Smithsonian’s Museum Support Center (MSC). This site in Suitland, Md., is not open to the public.
But Science News was able to get a behind-the-scenes peek.
Lining MSC’s hushed halls are rows of cream-colored cabinets and kilometers (miles) of shelving. Scientists led us through long corridors, pointing out prime treasures along the way. We saw and touched an abundance of specimens that captivate the mind and eyes. Some items even had odors — like a freeze-dried crabeater seal. It smelled like burnt soy sauce.
But MSC is not just a giant storage unit. It’s a place scientists visit to do research and answer big questions about our planet. Forget the idea that museums are old and dusty, says Kirk Johnson. He’s the director of the National Museum of Natural History. Museums, he argues, are “vastly more vibrant and more important” than most people realize.
A protected collection
MSC opened in 1983 when the Smithsonian needed more space for items in its already overcrowded natural history museum. Each of the center’s five storage pods is about the size of a football field. And they’re nearly three stories tall. A sixth pod is in the works.
Their key goal: Protect the specimens.
MSC carefully controls the temperature and humidity inside each pod. It also shields these storage areas against pests.
A vast collection
148 million Items in the museum’s collection
11,945 Items on display at the museum
95,287 New items acquired in 2025
34.5 million + Items in the entomology collection
Security guards patrol the premises 24/7. Along the way, they watch for power outages, floods, flames and explosions. Huge freezers need power to keep tissues and DNA samples ultracold. Dried specimens can be damaged by fire and water. And wet items in alcohol-filled jars are at risk of drying out — or blowing up.
MSC’s stash is part of a “forever” collection. They’re available to study today and in the future. Scientists are now, for instance, analyzing African elephant DNA stored here. The elephant that this genetic material comes from is thought to belong to a population that has long evaded humans.
Past work on bird eggs collected decades ago helped reveal that the insecticide DDT had built up in their shells and thinned them. This nearly drove some species — including the bald eagle — to extinction. Evidence of DDT’s harm to wildlife helped lead the United States to ban the chemical in 1972.
“There’s a cloud of knowledge about the planet that exists only because we have collections in museums,” Johnson says.
Scientists who work here are passionate about the knowledge stored in MSC’s pods. As we moved from one area to another, staff members would race to show us “just one more thing!” A coil of feathered money, for instance, that was once used on the Santa Cruz Islands in the South Pacific.
Items stowed at the MSC or on display at the museum represent everything that we know about the planet, says Rebecca Johnson. She’s the museum’s chief scientist (and unrelated to Kirk). “This is the record of the world,” she says.
In an age of AI, it can be difficult to tell truth from fiction. But MSC’s treasures let us see and touch and smell and study our planet’s reality. “People still want to know what is real,” Rebecca Johnson says. “This is the place where we have the real thing.”
Let’s go on a field trip
Our private MSC tour introduced us to a colossal cache of objects. We saw items that dazzled and brought chills. We wanted to photograph everything. In a place that’s home to millions of objects, how do you pick what to feature?
We chose items with an eye to what stood out in size or peculiarity. We also focused on those with intriguing backstories. We could fill entire books with photos and the histories of these items. Instead, we’ll highlight our favorites.
Most likely to haunt your dreams
The Antarctic scale worm
Stephen Voss
This giant worm (Eulagisca gigantea, center) has true horror-movie potential. It has mouth parts that can extend out and retract in, as well as a toothed jaw. But don’t worry. These worms typically live on the sea floor. So you’ll likely never encounter a live one. This specimen is part of MSC’s wet collection — stuff preserved in fluid.
Most likely to make you feel very small
The jaw bones of a blue whale
Here, Michael McGowen stands inside the massive lower jaw bones of a blue whale (Balaenoptera musculus). McGowen cares for MSC’s marine mammal specimens. The whale whose jaws he’s posing with was an adult female that once lived off the coast of Antarctica.
Stephen Voss
Weighing 2 metric tons and measuring nearly 7 meters (23 feet) long, the jaws are the largest bones in the collection. Blue whale jaws, in fact, are the largest bones of any animal ever. McGowen studies the evolution and genetics of whales and other cetaceans. He loves coming to this Whale Bone Repository — a building big enough to house airplanes. “I’m always in awe,” he says.
Most likely to keep calm and carry on
A North Atlantic right whale
This bizarre-looking backbone belongs to a North Atlantic right whale (Eubalaena glacialis). Named Tips, this 14-meter (46-foot) brute appears to have survived a collision with a ship. Squiggles of bone protrude from one section of his vertebrae — a sign of injured tissue that didn’t heal cleanly.
Stephen Voss
Tips died in 2010, possibly from being caught in fishing gear. Getting tangled in gear or struck by ships are two major threats to right whales. Fewer than 400 individuals of this endangered species remain.
Biggest buzzkill
The world’s largest mosquito collection
There are some 2 million mosquitoes in MSC’s collection. It’s the most diverse bunch of these bloodsuckers in the world.
Stephen Voss
The Uranotaenia sapphirina mosquitoes seen here may not be much of a nuisance — to humans, at least. They’re among just a handful of modern mosquito species that feed on cold-blooded creatures. Their victims include earthworms and leeches, says Yvonne-Marie Linton. She cares for MSC’s insect specimens.
Best dressed
The pink fairy armadillo
In life, this pink fairy armadillo (Chlamyphorus truncatus, left) would have been a fashion designer’s dream. It boasts both a lovely pale pink shell and whitish fur. The shell gets its hue from blood vessels and may help the smallest armadillo species control its body temperature.
Stephen Voss
Check out those oversized claws, used for burrowing. They grow even bigger in the greater fairy armadillo (Calyptophractus retusus, middle). And they get bigger still in the giant armadillo (Priodontes maximus, claws shown on right).
Biggest stinker
The tongue orchid
Stephen Voss
This massive plant is part of the Smithsonian Gardens Orchid Collection. It’s one of the largest orchid species on Earth. Bulbophyllum fletcherianum has leaves that can stretch nearly 2 meters (6.5 feet). But it’s known for more than epic leafage.
Its blooms give off the foul stench of rotting flesh. That scent attracts insects, such as blow flies or carrion beetles. Those insects are looking to lay eggs in dead and decaying animals. But when the tongue orchid’s smell draws them in, they help the plant by pollinating it.
Most likely to be mistaken for a mushroom
A Dracula orchid
Stephen Voss
The Dracula orchid gets its name from its blood-red coloring and long, pointy structures. The plant (Draculachimaera ‘Pacifica’) grows in Ecuador and Colombia. To fungus gnats, the orchid’s blooms have the alluring odor of mushrooms. Those flowers kind of look like mushrooms, too. Fine ribs decorate their central, pouchlike petals. This feature mimics the gills on a mushroom.
Most likely to make you take a closer look
The wet collection
Stephen Voss
Resting in row upon row of jars, some 25 million MSC specimens sit preserved in fluid. Included among them are sand dollars, shrimp, coral, slipper lobsters and octopuses. Together, they take up roughly 72 kilometers (45 miles) of shelving. That’s more than four times as long as trails to the bottom of the Grand Canyon.
Most of these jars are filled with ethanol, nearly 2 million liters (530,000 gallons) in total. This alcohol evaporates over time. So all of the jars need to be topped off to keep their specimens from drying out.
Most likely to strip the flesh from your bones
The hide beetle
Flesh-eating beetles might sound terrifying. But they feast on the dead, not the living. And it’s the baby beetles — or larvae — that do most of the meat-eating, anyway, explains Inger Toraason. So this hide beetle (Dermestes maculatus) on his hand poses no danger of chowing down. In fact, this insect — and thousands of its buddies — are closer to Toraason’s coworkers than specimens.
Toraason takes care of bone specimens at MSC. Flesh-eating beetles help clean animal bones for him. They eat tissue off specimens being prepped for the museum’s collections. It’s a big job. The beetles cleaned 429 skeletons in 2025 alone. They can strip a hummingbird’s bones in less than a day. A whale skull might take months.
Stephen Voss
Beetle-cleaned bones then go through several more steps to be preserved. Toraason picks off any remaining flesh by hand. Then he soaks the bones in a cleaning solution. You can see an example of this with the skeleton of a little owl (Athene noctua, inset).
If Toraason and his coworkers didn’t have beetles on their side, they could simply let flesh rot away in water. But that’s a long process. And it leaves behind just a pile of bones. With the hide beetles, the team gets an intact skeleton at the end. The beetles are “our little unsung heroes of the museum,” he says.
Finest feathers
Bird-of-paradise headdress ornaments
Stephen Voss
These vibrant ornaments were once used in headdresses by people in what is now Papua New Guinea. Made from Raggiana birds-of-paradise (Paradisaea raggiana), they’re meant to move, says Joshua Bell. At MSC, he curates cultural artifacts from around the world.
Men and sometimes women wore these ornaments while dancing in ritual performances, Bell says. Glinting light and rapid motion would have blurred the red feathers. It would appear almost as if the dancers were transforming into birds themselves.
Most likely to ghost you
Henry the elephant
Stephen Voss
Every year, some 4 million people walk past Henry, a towering stuffed elephant in the natural history museum in Washington, D.C. Few realize the elephant’s skull (shown) is stored at MSC.
This African bush elephant (Loxodonta africana) was roughly 4 meters tall (13 feet) and weighed 11 metric tons. He’s the largest elephant in any museum. He may have belonged to a group of “ghost” elephants in Angola that gained renown for avoiding humans.
When it comes to rockets, bell-shaped engines are the norm. But they’re not the most efficient shape. Engineers have relied on this design only because it avoids a known overheating risk faced by a more efficient engine. Now, though, three 17-year-olds have redesigned the nozzle of the more efficient aerospike engine to better manage heat.
They’re hoping that one day their new tech might literally shoot for the stars.
Devin Wanchoo, Michael Obeng and Mazon Ben Chouikha attend Governor’s School at Innovation Park in Manassas, Va. Their new work began as a way to satisfy a class assignment. “We wanted to do something in aerospace. We wanted to do something involving biomimicry. And then we wanted to do something that no one has done before,” says Michael.
Those motivations led them to refine a better rocket system.
Michael Obeng (left), Mazon Ben Chouikha (middle) and Devin Wanchoo (right) hold a model of their new aerospike nozzle. They’ve improved the heat tolerance of the aerospike design using a novel machine-learning algorithm and some inspiration from Mother Nature. K.G. Carpenter
During their research, the young engineers learned that bell-shaped rocket engines become less powerful the higher they ascend. For decades, engineers have experimented with an alternative that would avoid this limitation: the aerospike engine.
Unfortunately, this design has its own big limitation: It shoots super-hot exhaust gases from the engine right up against its spike structure. Eventually, that heat can “cause the spike body to melt and crack under thermal stress,” Devin says.
Their work won these teens a spot here at the 2026 Regeneron International Science and Engineering Fair, or ISEF. The event is a program of the Society for Science (which also publishes this magazine). The young aerospike researchers were among 1,725 students — from 65 nations or territories — who competed at the 76th annual ISEF. These participants shared nearly $7 million in prizes.
A guiding spike
Imagine a rocket launch. Flames burst downward from the engines and propel the rocket upward. Initially, the flames form a column.
If you were to fly alongside the rocket as it ascends, you’d eventually see the shape of that exhaust change. The column of gases would start to balloon outward.
This 60-second video illustrates why aerospike engines would be so much more efficient than today’s bell-shaped alternatives — if you could get aerospikes to manage the heat of the exhaust gases moving through them.
During liftoff, high atmospheric pressure initially forces the gases into that column shape. But as the rocket climbs, the air pressure weakens — and so does control of the exhaust gases. Now they spread out, reducing lift.
The thrust must go down for the rocket to go up. But higher up, as the gases balloon out, bell-shaped engines “can lose up to 30 percent of their efficiency,” says Devin.
Engineers have been looking to overcome that. And the aerospike engine is one possible solution.
“Unlike a bell nozzle — which needs that giant encasing structure — the aerospike just has its central spike,” Devin explains. It will deliver a strong, reliable upward thrust as long as you have some way “to force gases [down] along the spike wall.”
Those gases flow along the spike’s surface. The spike acts as a guide to direct the gases down so they can’t spread out. But that guiding spike introduces its own problem.
Coming from the engine, exhaust gases “are extremely hot,” notes Michael. The spike’s tip takes a pummeling from those gases. Their heat is “essentially attacking it, attacking it, attacking it,” he says.
What’s more, those gases tend to recirculate along the spike. This helps counter the air pressure’s attempt to weaken the downward flow of the gases, Michael says. Unfortunately, he adds, it also increases the heat.
So what makes this engine so good at maintaining a strong downward flow of exhaust gases, Devin points out, “is the same thing that causes that very aggressive heating of the spike body.”
Typical cooling methods just haven’t been good enough to spare the spike.
To counter that, the trio looked for inspiration in nature. Living things have evolved different ways to cool themselves. The team considered plant veins, insect exoskeletons, shark tissues and more. Then the trio created ICARUS, a machine-learning algorithm, and used it to test bio-based cooling strategies.
ICARUS, says Devin, is “probably the most novel part” of their project. It’s a simpler, heat-driven version of tools used by the aerospace industry. And it does more than just test ideas. “We built it on a machine-learning layer that was able to suggest [spike shapes] to try,” Devin says.
The young engineers started with shapes suggested by nature. Then they used ICARUS to optimize those designs. For instance, says Mazon, his team might suggest a certain surface pattern or feature. Then ICARUS “might change the width of it [or] the depth of it” to optimize the spike’s heat resistance.
The approach worked. Heat flux refers to how fast heat moves through a material. “We were able to reduce temperatures and heat flux by up to 40 percent,” Devin says.
Human skin inspired their most successful design, Devin says. Pores in our skin release sweat. As it evaporates, it wicks away heat. Mimicking this trick helped “bleed propellant to fight back against that heat creep,” says Devin.
Validating ICARUS
Using what they learned from ICARUS, the team members 3-D printed models of the six most promising designs. Then they put the models under a heat gun and measured how long each took to reach 90° and 110° Celsius (194° and 230° Fahrenheit), says Devin. They also tracked at what temps the models began to warp.
Then they built a copper prototype of their best-performing model. In the final stage of testing, Michael says, they became the first high school students to ever do a cold-flow test on such an engine. A cold-flow test, explains Devin, is “just testing that your engine can pressurize properly and that propellants are flowing.”
This test was “pretty cool,” he says. “We got to verify our ICARUS predictions.”
Devin Wanchoo and Michael Obeng prepare to conduct a cold-flow test of their new engine nozzle. They believe they are the first high schoolers to do so with a linear nitrogen oxide/ethanol aerospike system.M. Obeng, M.B. Chouikha and D. Wanchoo
ICARUS can also offer design tips beyond rocketry, Mazon says. For instance, the surface patterns designed to manage heat could even be applied to homes. “If you were to put [these patterns] on wood and you built the house, then it’s very likely to be safer” in terms of withstanding wildfires, he says.
For their work, Devin, Michael and Mazon took home fourth place — and $600 — in ISEF’s Engineering Technology: Statics and Dynamics division.
Many blind people navigate the world using a cane, guide dog or wearable GPS. But some have something more in their toolkit: echolocation. That’s the ability to sense nearby objects using sound. A new study shows just how master echolocators use this technique to get around.
Researchers shared these findings April 6 in eNeuro.
Clicking and listening for echoes can provide information about the location of nearby objects. Or their size. Maybe even their texture. (Bats use this same process to find their way as they flap through the night sky.)
Many studies have shown that in people, echolocation turns on parts of the brain that have to do with sight. They’ve also shown that echolocation improves a lot with practice.
But scientists still don’t know “how this happens,” says Santani Teng. “How the information builds in real time” beyond what can be learned from each individual echo. He and co-author Haydée García-Lázaro work at the Smith-Kettlewell Eye Research Institute. It’s in San Francisco, Calif. As cognitive neuroscientists, the two study how our brains think, learn and process information.
Mental mapping
To better understand human echolocation, they recorded clicks and echoes. They designed these echoes to act as if they were bouncing off a nearby object. Then, the scientists compared how two groups of volunteers responded to these recordings.
The four blind people in one group were all experts in echolocation. The other group of 21 people could see well. They also had no experience with echolocation.
Each volunteer listened to the recorded clicks followed by their echoes. The sounds were played in sets of two, five, eight or 11. After each set, these people were asked to decide whether an object had been to their right or left. As they listened, electrode caps on their heads recorded their brain activity.
The blind echolocators excelled at figuring out an object’s direction. They scored far better than those who could see. In fact, one echolocator figured out an object’s direction after hearing only two sets of clicks and echoes.
The brain data showed that each click-echo pair gives new details about the surroundings. Echolocators combine these additional details over time, “rather than through a single optimal snapshot,” says Monica Gori. She’s a neuroscientist who did not take part in this study. She works at the Italian Institute of Technology in Genoa. She also works with the Institute for Human & Machine Cognition in Pensacola, Fla.
García-Lázaro says she and Teng want to learn more about “what exactly makes better echolocators.” She’s especially curious about how experts learn to ignore the click and focus only on its echo.
This “is not magic,” says Teng. “Echolocators have a truly remarkable skill, with real-life benefits.”
Ancient cultures across the globe have been playing games of chance — using dice — far, far longer than historians had ever realized, a new study finds. Researchers turned up these gaming pieces from as far back as 12,000 years ago. That makes them the oldest known dice.
These came from western North America. Until their discovery, the oldest known dice were from Mesopotamia, an ancient region in what is now Iraq. The oldest of those were only about 5,500 years old.
Many Native American cultures have a rich history of dice games and still play them today.
Such games could have helped foster social connection, says archaeologist Robert Weiner, who was not part of the new study. If you meet strangers, “how are you going to interact?” he asks. Dice games could have offered one way for strangers to bond. Weiner works at Dartmouth College in Hanover, N.H.
But until now, the roots of early American dice games had been fuzzy. Robert Madden hoped to track down those origins. In the April 2 American Antiquity, he describes the search for the earliest dice in what is now the mainland United States.
Dice defined
Madden, too, is an archaeologist. He works at Colorado State University in Fort Collins. He started his search by sifting through records of Native American artifacts. He was scouting for objects that might be dice.
He set rules for sorting out possible dice. Most Native American dice are two-sided with at least one side marked. So that’s what Madden looked for. He rejected objects with holes. These might have been part of jewelry. Any die candidates also had to be small enough to fit in one’s hand.
In all, 565 objects met all those criteria. An additional 94 objects were probably dice but would need more details to be sure.
The items came from 57 archaeological sites across 12 U.S. states in the Great Plains and American West. Most of the promising objects were 450 to 2,000 years old. About 31 were 2,000 to 8,000 years old. And at least 14 artifacts dated as far back as 12,000 years ago. Those oldest ones came from Wyoming, Colorado and New Mexico.
Holding deep history
Madden then traveled to examine the oldest of these artifacts in person. He found some objects that had not yet been described or linked to gaming.
“It was amazing to hold these pieces of deep history in my hand,” Madden says. In-person inspections confirmed to him that these ancient objects were in fact dice. Each was made of bone, worn smooth by use and time. Lines had been carefully etched on one side. Some had faint traces of red pigment to mark the different sides.
Especially notable: They looked much like more modern Native American dice.
“If you took dice from 2,000 years ago and the prehistoric ones and put them in a bag and shook it up, it would be really hard to tell the difference between them,” Madden says. “They look very similar.”
Weiner agrees. “I don’t think there’s a compelling alternative explanation for many of these objects,” he says.
The new study likely understates the true diversity, in space and time, of dice in Native American cultures. After colonial contact, settlers documented 18 tribes in the eastern U.S. that played dice games. Yet Madden’s search turned up no dice from there. Future research should explore that region, he says.
Finding the oldest dice also pushes back when people first seem to have been experimenting with the concept of probability. It highlights Native American contributions to early intellectual developments, Madden says. That Native Americans used dice to generate randomness this long ago, he says, “is a very exciting connection to make.”
Superblooms are massive blooms of desert wildflowers. There isn’t an exact number of flowers required to make something a superbloom. But the word usually describes an above-average number of blossoms. These flowers create colorful carpets that blanket usually barren desert landscapes. They can even be seen from space!
In 2026, after a particularly rainy season, California’s Death Valley was overrun by a superbloom. Even after the bloom’s peak, yellow Desert Gold flowers could still be seen all over Death Valley National Park. Sofia Caetano Avritzer and James Lee
The few flowering plants that do grow in deserts live very short lives. They spring up after rainfalls and race through their life cycles in a few days or weeks before heat and drought wipe them out. Before they die, these plants produce lots of seeds. Those seeds can lie dormant in the soil for years or even decades, waiting for the right conditions to sprout.
This creates a buildup of seeds in the ground. So when deserts have an unusually wet year after many dry ones, the seeds sprout into a superbloom. This happens as long as it’s not too hot or windy for the flowers to grow.
For animals that eat wildflowers, such as desert tortoises and sphinx moth caterpillars, superblooms are quite a feast. For humans, the blooms make a beautiful spectacle. But it’s important for visitors to not step on the blossoms or pluck them from the ground. That way, they can seed the next flower extravaganza.
In a sentence
Because of climate change bringing record-breaking droughts and heatwaves, superblooms could become even rarer.
In Hawaii, ocean trash — including old fishing nets — is being recycled to cover roads. The process is experimental, but it shows promise as a way to deal with a growing pollutant: plastic.
Paving with plastic is being done elsewhere, such as Missouri and Texas. But Hawaii is the first state to try adding marine debris. Its islands currently face a unique exposure to trashed plastic. It comes from discarded fishing gear, but also tourist wastes. There’s even some plastic released from the Great Pacific Garbage Patch.
So far, people have pulled 90 metric tons (roughly 200,000 pounds) of plastic trash from the Pacific Ocean. More than one metric ton (2,200 pounds) of fishing nets alone have been used in paving Hawaiian roads.
One key question is whether the pavement’s wear and tear might shed microplastics — tiny bits of this embedded trash.
“We’re extremely concerned about the shedding of plastics or other chemicals into the environment,” says Jennifer Lynch. This can expose people and animals to toxic plastic additives. Lynch is a chemist. She heads the Center for Marine Debris Research at Hawaii Pacific University in Honolulu.
Her team shared its findings March 22 at the American Chemical Society (ACS) meeting in Atlanta, Ga.
Plastic for pavement
Lynch’s center runs a Nets-to-Roads program. Researchers collect and sort plastic and other marine debris gathered from beaches. Then they pick out waste made with polyethylene (Pah-lee-ETH-ih-leen). It’s a durable plastic found in such things as milk jugs, yogurt containers and fishing nets.
The Hawaii team sends the waste and nets to the U.S. mainland. There they get shredded and ground up. Then the materials come back to Hawaii. At a facility on the island of Oahu, they’re mixed with other ingredients to make asphalt. That’s the black, gooey stuff made from petroleum that’s often used to pave roads.
Once loaded onto trucks, this hot mix was used to cover stretches of road on the southwestern side of the island, Lynch says.
Three experimental strips went down in 2022. One had a section of traditional asphalt mixed with a rubber called styrene-butadiene-styrene. That rubber adds durability and flexibility. Ground marine waste and the rubber were added to a second batch. A third contained the marine waste and asphalt but no rubber.
A paving crew works on a section of road along Ewa Beach on the island of Oahu. Here, they will compare different plastic-asphalt mixtures.Courtesy of the Center for Marine Debris Research
Eleven months later, researchers collected road samples. They wanted to test it for escaping microplastics before taking the project to more roads, Lynch explains. They exposed the samples to conditions that mimic what might release microplastics. For example, they modeled stormwater running off a road or gravelly dust being swept from the road by traffic.
Water and dust from pavement with ocean trash contained amounts of microplastics similar to what was seen from samples of the asphalt with no plastic, says Jeremy Axworthy. He’s a marine biologist who worked on the program. He presented the team’s results at the ACS meeting.
Phase two of this program launched in 2024. It tested five types of pavement, including combos with and without rubber and plastic. Some contained ground-up fishing nets. Others contained other plastic trash. Data on which performed best should be available soon.
Bill Buttlar directs the Mizzou Asphalt Pavement and Innovation Lab. It’s at the University of Missouri in Columbia. He’s impressed with the program. Still, he notes that Hawaii’s roads face different challenges than those on the U.S. mainland. Hawaii’s tropical climate brings heavy rains. And volcanic activity there causes the ground to constantly shift, which can crack roads. “The main challenge to scaling this is getting the recipe right,” Buttlar says. “What works in Hawaii may be a little different than what works in the [U.S.] Midwest.”
Even now, we live in an “ice age.” Though the term may bring to mind saber-toothed cats and woolly mammoths, such ages are defined by ice caps at the poles. And for most of its 4.6-billion-year history, our planet was too warm — sometimes far too warm — for polar ice.
For more eons than not, Earth has ranged from steamy to downright hellish.
A look back at Earth’s history shows us how fragile and fleeting our current moment is. Between its fiery infancy and its (for now) chilly present, Earth’s climate has taken many forms.
Learning why Earth’s climate changed in the past — and what happened to life when it did — can help us understand where we are today. We know our speciesevolved in the cold. Yet human-caused warming has set our planet onto a hot new path.
What can the past teach us about where we might be headed?
During the Hadean Eon, Earth was so hot that the surface was covered in an ocean of magma.Andy Lovell
Hadean Eon: Hell on Earth
Earth’s turbulent infancy began some 4.6 billion years ago. Clumps of material formed out of the disk of hot dust and gas that swirled around the young sun.
About 100 million years later, a Mars-sized rock called Theia smacked into the young Earth. That run-in released the energy equivalent of trillions of hydrogen bombs. It was enough “to pretty much vaporize most of Theia and melt what becomes the Earth,” says Norman Sleep. He’s a planetary scientist at Stanford University in California.
That collision left the planet a hellish ocean of magma beneath a sky of rock vapor. Weak sunlight beat down on a cracked crust of black-gray basalt. In the sky hung a second ball of glowing magma: the moon. This orb had formed from the impact debris, maybe in just a few hours.
This was the Hadean Eon — the hottest Earth has ever been. Over the next 1,000 years, Earth cooled somewhat. Rock vapor in the atmosphere would have condensed and fallen — think showers of lava or perhaps flakes of rocky snow.
The magma ocean solidified more slowly. The young moon heated Earth via the force of its gravity. This kneaded Earth’s interior and kept the planet molten for perhaps tens of millions of years.
Finally, that magma ocean crystallized into rock.
This marked a turning point for our planet, Sleep says. The sun became its most important source of energy. Ever since, Earth’s climate has been driven by how much solar energy it gets, reflects and retains.
Archean Eon: Earth’s thermostat turns on
The Archean Eon stretched from 4 billion to 2.5 billion years ago. It began when Earth’s surface cooled enough to form solid rock. Back then, the young sun was only about 70 to 80 percent as bright as it is today. Its energy alone would not have been enough to keep the planet as warm as it was.
In theory, Earth should have cooled enough to ice over. But it didn’t. Why?
As the Earth cooled, it produced a thick, steamy atmosphere. Water vapor fell as rain. A lot of rain. It poured until Earth’s surface drowned beneath a global ocean once more — this time, of water.
The cooling planet also released greenhouse gases such as carbon dioxide (CO2) and methane. These acted like a blanket to trap heat around Earth. “There was a bigger greenhouse effect” than today, says David Catling. A planetary scientist, he works at the University of Washington in Seattle.
At around the same time, another major change kicked in: the carbon cycle. This acts as the planet’s natural thermostat.
Here’s how it works. Through the greenhouse effect, CO2 in the atmosphere warms Earth’s surface. A process called chemical weathering traps some of that CO2 in minerals called carbonates. They can stay trapped in rocks for a long time. Over hundreds of thousands of years, however, the movements of Earth’s tectonic plates recycle Earth’s surface into its interior.
In Earth’s mantle, the carbonates break down. Their carbon then gets belched back up by volcanoes as CO2. Back in the air, it once again warms the planet.
This cycle is sensitive to temperature: Chemical weathering speeds up in warm climates and slows in cold ones. The overall effect helps keep temps fairly stable.
By the early Archean, the carbon cycle had locked away enough CO2 to bring temps into a range habitable for life. Modeling studies suggest the planet ranged between a frosty zero degrees and a toasty 40° Celsius (32° to 104° Fahrenheit). In fact, the earliest signs of life date to this period.
During periods known as Snowball Earth, nearly the whole planet was encased in ice.Andy Lovell
Snowball Earth: A deep freeze
Between 2.4 billion and 2.1 billion years ago, Earth froze over. Thick sheets of ice encased the planet from pole to equator. Temperatures may have plummeted to as low as -50 °C (-58 °F) and stayed low for tens of millions of years.
This deep freeze was one of several icy episodes called Snowball Earths. They bookend the otherwise toasty Proterozoic (PRO-tur-eh-ZOH-ik) Eon. It stretched from 2.5 billion to 541 million years ago.
The ice sheets grew through a runaway feedback loop. Sparkling white ice reflects more sunlight than does land or water. That lowers temperatures, which encourages even more ice to form. Once polar ice creeps past a latitude of about 30° North or South, the planet will become a snowball.
“Once you reach that tipping point in the area of sea ice, then it takes on the order of 200 or 300 years to reach the fully [iced-over] state,” says field geologist Paul Hoffman of the University of Victoria in Canada. “That’s pretty quick on a geological time scale.”
Glacial rock deposits that formed at the equator are evidence that the Snowballs happened. But how they started remains a mystery. One theory blames biology.
Clues from ancient rocks suggest the Proterozoic oceans bloomed with photosynthetic organisms. They would have released lots of oxygen into the air. Oxygen breaks down methane. So it ate away the methane blanket that had kept Earth warm for 1.5 billion years.
The carbon cycle wouldn’t have been able to keep up, Catling says. Eventually, “you could grow ice sheets and make a Snowball Earth.”
Earth’s thermostat won’t let a Snowball go on forever. As the land freezes over, chemical weathering shuts down. But volcanoes don’t. They keep pumping CO2 into the atmosphere. Eventually, the greenhouse effect will thaw out the planet. As that ice melts, the planet will reflect less sunlight. The bonus energy will warm the planet even more. Suddenly, the ice retreats.
Today, ice persists at Earth’s poles. These “icehouse” periods are few and far between in Earth’s history.
The last one was in the early Permian Period. This was about 300 million years ago. The average temperature was probably 15 degrees C (27 degrees F) cooler than today. Earth might have looked a bit like it did 20,000 years ago. That’s when woolly mammoths roamed Europe.
This cold spell lasted for 105 million years. Then climate change transformed the land into a scorched — and possibly toxic — wasteland.
Over some 20 million years, things started getting less friendly to life, says Neil Tabor. He’s a geologist at Southern Methodist University in Dallas, Texas. Why? In part this was thanks to the assembly of the supercontinent Pangaea. As more land crammed together, coastlines shrunk and sea levels dropped. Coastal areas dried out, and throughout the parched continental interior, temperatures swung wildly.
485 million years of temperature swings
Earth has experienced both hot and cold periods over time, though warm times have been more common. That’s true of the last 485 million years, as seen in this timeline reported in 2024. Our genus, Homo, evolved nearly 3 million years ago during a rare cold spell.
E.J. Judd et al/Science 2024, adapted by C. Chang
Then huge volcanoes in what’s now Siberia started erupting. They didn’t stop for 1 million years.
Over that time, they spewed enough lava to bury an area as large as the continental United States under 50 meters (160 feet) of molten rock! With all that lava came lots and lots more CO2. And that made surface temperatures soar.
In a geologic blink — perhaps as quickly as 60,000 years — average temps jumped as much as 10 degrees C (18 degrees F), reaching around 30 °C (90 °F). Oceans sweltered and grew too sluggish to circulate oxygen. Much marine life suffocated.
Bacteria that thrived in the oxygen-deprived depths poisoned the water with hydrogen sulfide. That deadly gas might have bubbled up to poison the land, too. Volcanic gas mixed with water to rain acid on the barren, dusty wastes.
On land, there were “toxic, salty, shallow acid lakes,” says Kathleen Benison. “And lots of windblown, red dust.” A geologist, Benison studies the Permian climate. She works at West Virginia University in Morgantown.
Near the end of the Permian, some 252 million years ago, Pangaea was a sunbaked, dusty wasteland. Daytime air temperatures in the tropics hovered around 50 °C (122 °F). On the hottest days, they climbed to 73 °C (163 °F) — hot enough to destroy proteins. Any living thing that couldn’t flee to the poles would have been cooked alive.
The resulting mass extinction was the worst our planet has ever seen. In a few hundred thousand years, 70 percent of species on land disappeared. The seas were hit even harder: 95 percent of marine species died out.
The Permian offers a cautionary tale for our current moment.
“We’re still technically in an icehouse, but we’re rapidly going towards a greenhouse,” Benison says. “Looking back at the [end of the Permian] is a good way to try to say what happens with these big changes. And not just what happens with climate, but what happens to life.”
During the Cretaceous Period, Earth was so warm that the poles were essentially ice-free.Andy Lovell
Cretaceous Period: Gradual heat
A greenhouse doesn’t always lead to mass extinctions, though. By 90 million years ago in the Cretaceous Period, the planet was a lush jungle world. Vast swaths of the continents were flooded by shallow seas. In some areas, carnivorous dinosaurs like Spinosaurus prowled the shores. At 36 °C (97 °F), Earth’s average surface temps hovered around human body temperature. Even polar seawater was a soupy 27 °C (81 °F).
Despite that, this period saw “no mass extinction,” says Brian Huber. He’s a geologist at the Smithsonian National Museum of Natural History in Washington, D.C.
Huber was part of a team that charted Earth’s surface temps for the last 485 million years. This timeline revealed a super-hot greenhouse environment. In fact, it was the hottest Earth has ever been since the evolution of any life more complex than a microbe.
Scientists aren’t sure what drove temperatures so high. But it’s clear that the rise was fairly gradual.
There was no 10-degree jump like the one that rocked the Permian. Instead, Earth had been hot for a long time. In fact, it never really cooled down after the Permian extinction. Average surface temps worldwide mostly stayed above 20 °C (68 °F). (For comparison, that’s just 5 degrees C [9 degrees F] hotter than it was in 2024.) And the poles were largely ice-free throughout the dinosaurs’ nearly 180-million-year reign.
So perhaps the Permian extinction was so massive because of the swing from icehouse to greenhouse. An abrupt change may have put ecosystems under additional stress. That would be bad news, considering what’s happening today.
What’s next for Earth’s climate?
Following a 50-million-year cooling, we’re now in an icehouse period.
The time 55 million years ago was known as the Paleocene-Eocene Thermal Maximum, or PETM. It was the hottest period in the history of our Earth — that planet with the continents and ecosystems we know today.
Atmospheric CO2 levels were high, and temps reached an average of up to 34 °C (93 °F). Unlike us, creatures that lived back then were used to an iceless planet. There was no mass extinction, but ecosystems shifted. And many species died out in parts of their ranges. Some disappeared completely.
Since the PETM, Earth has been cooling down. This could be due in large part to the rise of the Himalayan mountain range in Asia. Chemical weathering of all that fresh rock could have driven steady drops in atmospheric CO2. By 34 million years ago, Antarctica was cold enough for year-round ice. And by 800,000 years ago, CO2 levels fell below about 300 parts per million (ppm).
But in just the past 200 years, human activities have driven airborne CO2 levels back up. Emissions — such as from coal-fired power plants and gas-fueled cars — have nearly doubled CO2 levels, from 280 ppm to 426 ppm. Average temperatures have ticked up by 1.47 degrees C (2.65 degrees F).
If human-caused climate change continues unchecked, Earth’s ice sheets could collapse and sea levels could rise.Andy Lovell
If nothing major changes in our approach to climate change, this will be just the beginning. By 2100, CO2 levels could reach 600 ppm. Some climate models show it could soar above 1,000 ppm. That could result in average temperatures 4 degrees C (7 degrees F) warmer than in preindustrial times.
If we’d been around in the PETM, we’d have had to migrate to the poles to survive. That’s bad news for today’s humans. Cities can’t exactly get up and move. By the end of this century, billions of people will routinely face heat and humidity extremes beyond the limits of human survival.
This glimpse of a likely future is informed by our past. And it gives us the chance to choose a different path. Cutting carbon emissions can still slow warming and its impacts.
If extreme warming occurs, it would end the world as we know it. But it would not be the end of the world.
Even if we trigger a climate catastrophe on the scale of the Permian mass extinction, Earth’s history shows that the planet will recover and life will eventually thrive again. The carbon thermostat will correct our error — but it is very slow. We can’t wait millions of years for it to fix climate change for us.
Some clouds are flat. Others are puffy. Some are pretty and turn orange or red at sunrise or sunset. Others signal stormy weather and can produce precipitation, such as rain, hail or snow.
Meteorologists, or weather forecasters, spend lots of time predicting clouds. That’s because clouds are behind all storm systems — from tornadoes and hurricanes to rain and snowstorms.
Technically speaking, a cloud is nothing more than a clump of aerosols — small solid or liquid particles suspended in the air. In some clouds, those aerosols can be bits of wildfire smoke or even desert dust.
But most clouds are made of water. A typical cloud droplet is only 20 micrometers (0.00008 inch) in diameter. That’s less than a thousandth the size of an average raindrop. Since cloud droplets are so tiny, they are very light. And that’s part of why clouds float.
These water droplets start to form through evaporation. Evaporation occurs when liquid water molecules become energized and change phase into a gas. Energy from the sun heats Earth’s surface — including water molecules in the ground as well as in oceans, lakes and rivers. Some water molecules become warmer, and more energized, than others. The most energized ones become a gas, known as water vapor.
Most air is made of N2 — or two nitrogen atoms clumped together. A molecule of water vapor weighs less than this nitrogen molecule. That’s also partly why clouds float.
Why can we see clouds?
We can’t see water vapor on its own. Clouds become visible when water vapor condenses, or transforms back into a liquid. That happens when water vapor rises high enough in the atmosphere that it cools.
Gravity pulls those droplets toward the ground. But they’re so tiny that warm rising air keeps them suspended aloft. And even if a single cloud weighs tens of millions of kilograms (pounds), the air outside the cloud is a bit heavier still. So the cloud floats.
Sometimes, water vapor rises extra high. At 12,200 meters (40,000 feet) above the ground, the average temperature is –57° Celsius (–71° Fahrenheit). Here, it’s too cold for water droplets to form. Any water turns into tiny ice crystals.
That’s why clouds at high altitudes aren’t puffy. They aren’t made of liquid droplets. Made of ice crystals, they’re wispy-looking.
Different types of clouds
Some clouds form near the ground. Fog is a cloud that forms on the ground.
“When we see fog, that is simply a cloud at the surface,” wrote Brandon Richards, a meteorologist for Spectrum News Texas in Austin, in a text message. “Fog happens when the air is saturated.” That means the air is holding as much water as it can. The extra water condenses, forming a cloud.
Fog is one type of stratuscloud. The word stratus comes from the Latin word for “layer.” Other stratus clouds may form a few thousand meters (feet) above the ground. They’re usually pretty flat.
This chart can help you identify basic cloud types and their relative altitudes. Click here for the full poster.NWS/NOAA
In summer, the sky might host puffy clouds. It can be fun to look for shapes in these cumulusclouds. Such clouds usually form a couple kilometers (miles) above the ground. They come together when pockets of warm air rise.
The highest types of common clouds are cirrus. They form 9,100 meters (30,000 feet) or more above the ground. At that height, they’re made of ice crystals, which gives them a wispy, hairlike appearance.
Different types of clouds can be present at the same time. And some clouds are actually a combination of different cloud types. Cirrostratusclouds are wispy like cirrus clouds, but flat and layered like stratus clouds. Stratocumulus clouds are layered but a bit puffy.
The wispy clouds in this image, seen over the Baltic Sea from Laboe, Germany, on June 21, 2019, are noctilucent clouds. Such clouds get their start when water freezes around particles of meteor smoke. They occur at extremely high altitudes in the upper atmosphere.Matthias Süßen/Wikimedia Commons (CC BY-SA 4.0)
Rare clouds
Some clouds form in weird ways. Consider noctilucent clouds. The term noctilucent comes from Latin words that mean “light at night.” Earth’s highest clouds, these form at heights of 76 to 85 kilometers (47 to 53 miles).
There’s little water vapor at such altitudes. So how can clouds form there? Meteor smoke!
Meteors burn up in this part of the atmosphere, leaving behind smoke particles. Water droplets can glom onto these particles and turn into ice crystals. And being so high, these clouds can catch sunlight even after the sun has set (at ground level). These clouds shimmer, like blue, glow-in-the-dark curtains.
Another type of strange cloud is the pyrocumulonimbus (PY-roh-KEW-mew-lo-NIM-bus), or smoke cloud. Wildfires can release lots of smoke. As smoke and hot gases rise, they can form a thundercloud. From these clouds, wildfires sometimes produce their own thunderstorms, windstorms — or even fire tornadoes.
Precipitation happens when a cloud can’t hold any more water. Tiny, light cloud droplets coalesce, or merge, into bigger droplets. Those that become heavy enough will fall out as rain.
Something similar happens when it’s cold. Tiny, chilly water droplets merge to form ice crystals. That’s what makes snowflakes in the wintertime. Snow falls more slowly than raindrops. While raindrops plummet as fast as 10 meters per second (22.4 miles per hour), snowflakes tend to glide down at a pokey 0.4 to 1.8 meters per second (0.9 to 4 miles per hour).
Thunderstorms can produce dangerous precipitation. These storms come from cumulonimbus clouds. That’s the technical name for thunderclouds.
Thunderclouds start as cumulus clouds — puffy clouds fairly close to the ground. Warm, wet air helps them grow taller. Some thunderclouds can rise into towers 16 kilometers (10 miles) tall. While the tops of these clouds are made of ice, their bottoms consist of water droplets.
Cumulonimbus clouds can produce thunder and lighting. Because they’re tall, they can lift water droplets very high before they finally fall. That’s how hail forms. High-up water droplets can cool and freeze into an ice pellet. As more droplets freeze onto the pellet, the hailstone grows. Some thunderclouds can produce chunks of ice the size of baseballs or bigger.
The most extreme thunderclouds become supercells. That’s a thundercloud that rotates. Changing winds blow different layers of the cloud in different directions. That causes the entire cloud to spin. Supercells occasionally spawn tornadoes.
A rotating storm cloud produces a tornado near Matador, Texas, on April 24, 2025.M. Cappucci
But there’s a catch. Sometimes, clouds can limit the intensity of storms. Why? “Clouds, even light wispy ones, can affect how much [sunshine] reaches the ground,” explains Joey Krastel. He’s a meteorologist for the Maryland Department of Emergency Management in Hanover.
If you look out from a plane window, you can sometimes see shadows on the ground cast by individual clouds. That’s one sign of how much sunlight clouds can keep from reaching the ground. With less sunlight, the Earth’s surface cools. Now there’s less energy to evaporate water. With less warm and wet air, storms can’t form as easily.
“During storm outbreaks, thick cloud cover can limit surface heating and reduce storm energy and potential,” Krastel wrote via text message.
That’s why the stormiest days often begin with sunshine. It seems strange to think that sunshine actually helps storms, but it’s true. The more the air is heated by sunlight, the more it can rise — and the bigger storms will grow!

 Login