❌

Normal view

Mercury may have shrunk much more than we thought, new study hints

10 September 2026 at 14:00

Mercury, which is about one-third the size of Earth, may have shrunk more in its evolution than scientists originally thought.

A new study suggests that the tiny planet may have contracted 10% to 30% more than previous models suggested β€” meaning the planet’s total diameter shrunk almost 12 miles (19 km) since Mercury was formed. (Mercury’s diameter today is roughly 3,032 miles (4,880 km).

Previous missions overlooked the extent of the shrinkage because impact-crater debris on Mercury's surface hid the evidence, according to a study published Thursday (Sept. 10) in the journal Geophysical Research Letters. That size difference is important when researchers consider the planet's history, said Gaku Nishiyama, a planetary scientist at the German Aerospace Center Institute of Space Research and an author of the study.

"Because Mercury's evolution is driven by its cooling, the amount of contraction β€” an indicator of the extent of cooling β€” is one of the most important observables that can be compared to models for estimating its evolution scenario," Nishiyama told Live Science in an email.

There could also be implications for the planet's composition. For example, more shrinkage at Mercury could mean the planet would have a larger metal core and fewer light elements, such as silicon, inside that core, according to an American Geophysical Union statement.

"The interior of Mercury would reflect its formation," Nishiyama said, and possibly hint at the innermost part of our solar system. "Therefore, to understand how our solar system has evolved up to now, information that can be extracted from this estimation β€” such as core composition and initial temperature condition β€” is critical."

A violent history

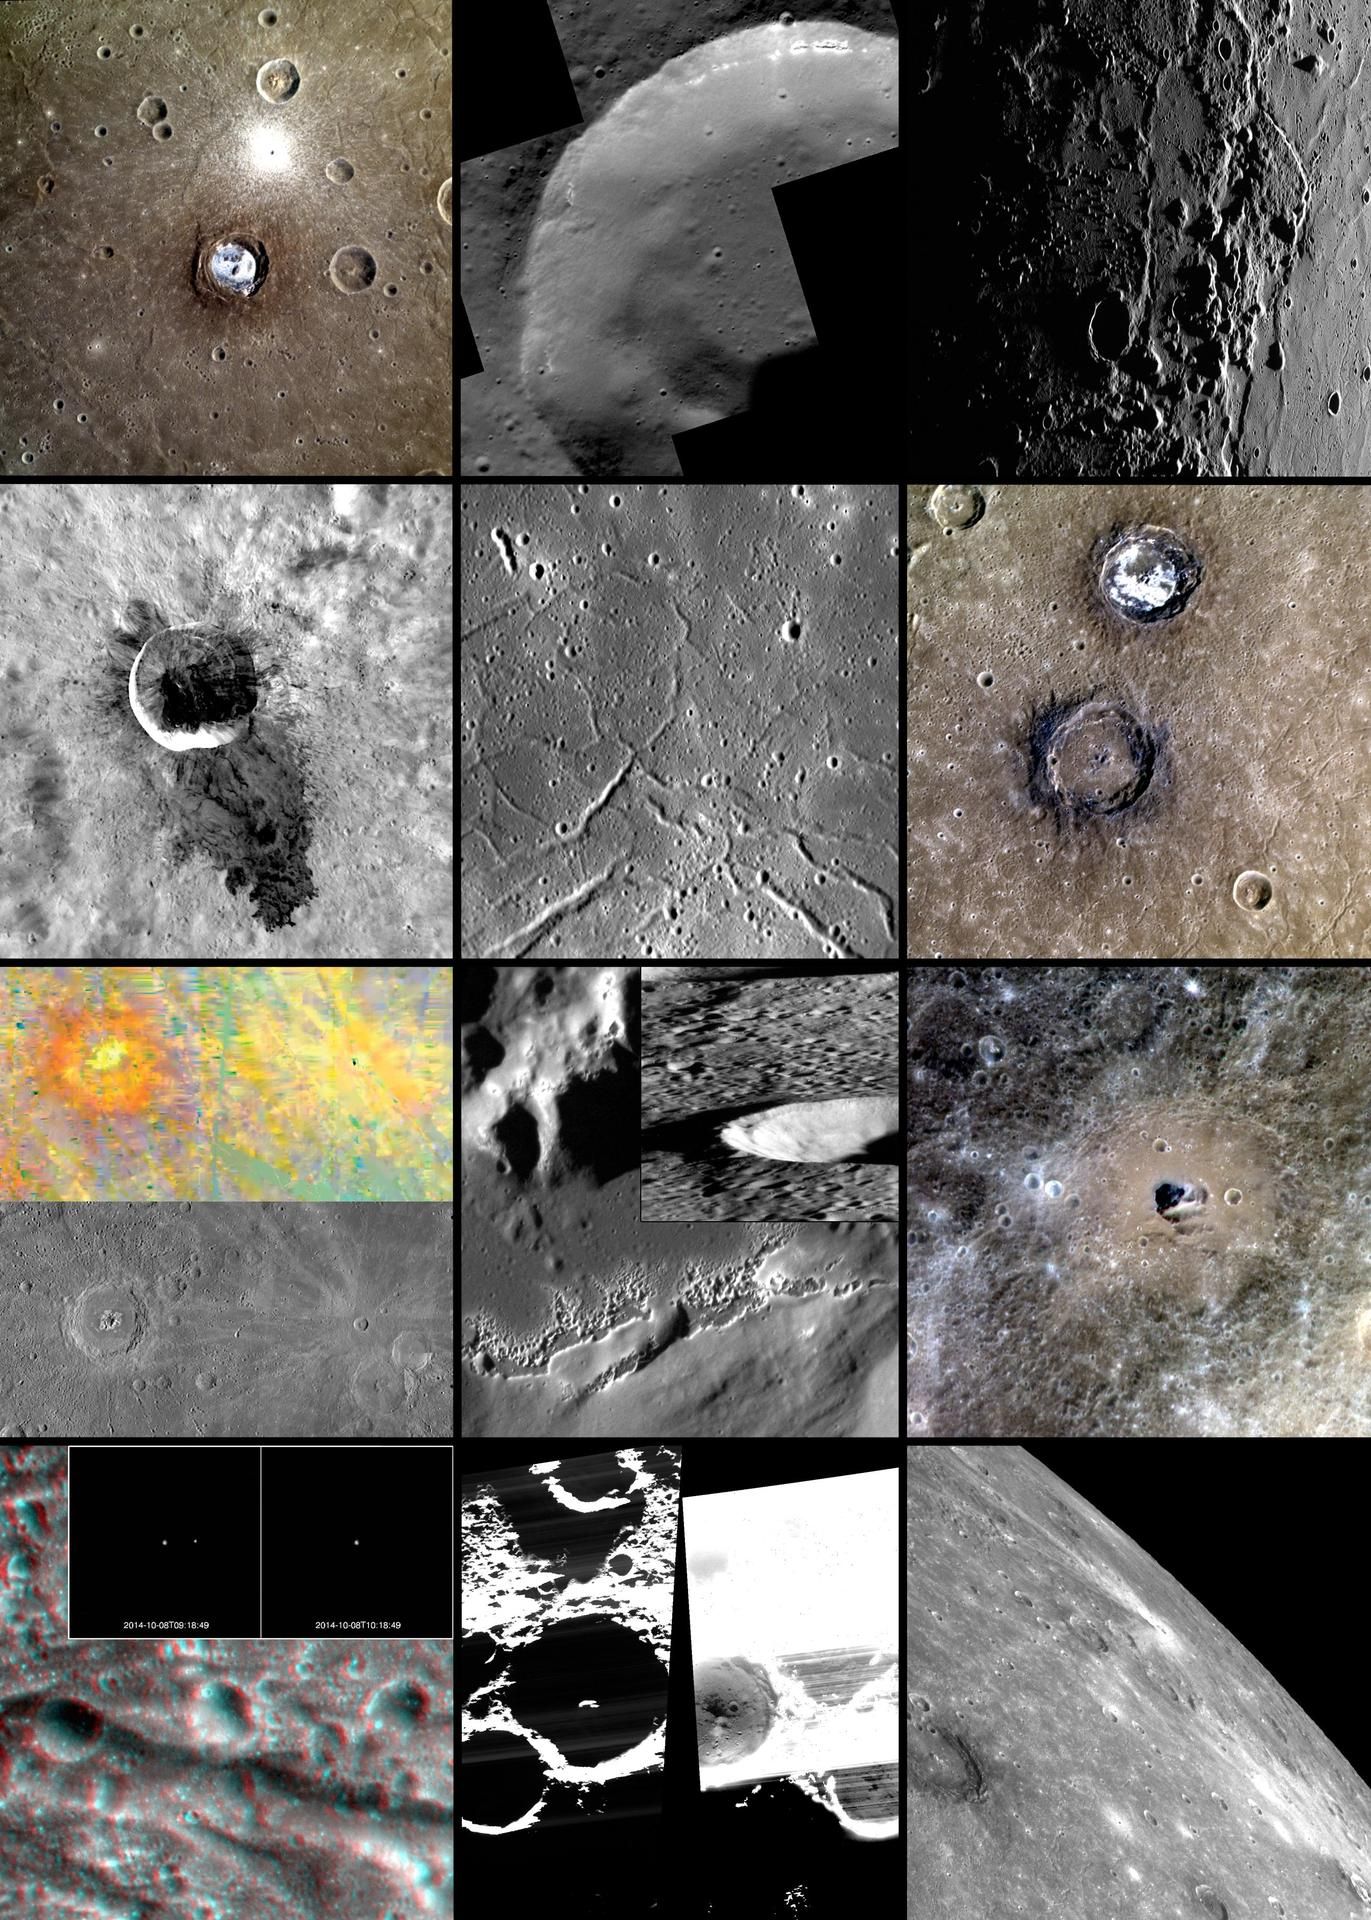
A series of images of the surface of Mercury from space.

Observations from NASA's MESSENGER spacecraft (examples shown here) helped the team build new maps of the planet's shrinkage. (Image credit: NASA/Johns Hopkins University Applied Physics Laboratory/Carnegie Institution of Washington)

Mercury and the rest of the solar system planets formed due to the gradual collisions and aggregations of rock and gas upon asteroids and comets. Some of those impacts that created the planets also released a lot of heat. Mercury has been slowly cooling from those ancient impacts, and its interior has been shrinking along the way.

While this kind of cooling affects the entire planet's landscape, impact craters can mask the effects because each crash into the surface generates its own surface changes, including debris and new divots. The craters build up over time, making it difficult to spot more ancient geology underneath.

Nishiyama's team compared two sets of maps from Mercury, using data from NASA's MESSENGER mission, which orbited Mercury between 2011 and 2015. One set of maps charted geological features showing contraction, and the other set estimated the roughness of the planet's surface. Their work covered the entire surface and demonstrated that the most rugged spots on the planet have fewer wrinkles from shrinking. In other words, according to Nishiyama, the debris from more recent impacts is covering up the evidence of shrinking.

Nishiyama said more information will help to confirm the estimate. Such data could come from the European Space Agency's BepiColombo spacecraft, which began its arrival sequence at Mercury earlier this month after nearly eight years of space travel. Once the mission settles in, the spacecraft will take higher-resolution imagery of the surface than MESSENGER did. Nishiyama's team expects BepiColombo to pick up smaller impact craters, as well as scarps and ridges, that could further refine the measurements.

"Stay tuned for future topography measurements by BepiColombo," Nishiyama said. "Future data from laser altimetry on BepiColombo will collect more information on planetary contraction by measuring topography more precisely."

See the highest-resolution footage of a black hole jet ever taken, thanks to AI and 27 years of observations

9 September 2026 at 18:34

Astronomers just dropped a video 27 years in the making: the highest-definition animation of a gargantuan black hole jet blasting out of a distant galaxy and twisting off into space.

The video, made from 116 images taken between 1995 and 2022, captured a blazar known as 3C 345, in the constellation Hercules. A blazar is a sort of quasar β€” a bright, feeding supermassive black hole embedded in the center of a faraway galaxy β€” that emits huge jets of gas into its environment. The jets blaze at nearly the speed of light and are charged with highly concentrated X-rays and gamma rays.

As described in an Aug. 26 study in the journal Nature, scientists gathered the images of 3C 345 using decades of observations by the Very Long Baseline Array (VLBA), a network of 10 telescopes spread across the U.S. (VLBA had two programs that caught views of the jet, called BEAM-ME and MOJAVE, which collectively followed hundreds of blazar sources.)

To turn those hundred-or-so images into an animated movie, the team used an AI neural network named Kine, achieving a resolution four times higher than that of any individual image. By doing so, the researchers mapped the speed of the black hole jet to the highest precision yet. (Several study co-authors had previous experience boosting the resolution of distant black hole images while working at the Event Horizon Telescope Collaboration, the team behind the first image of a black hole.)

"The higher quality of our video reconstruction enabled a detailed measurement of the plasma velocity in the jet," study first author Marianna Foschi, a postdoctoral researcher at Caltech, told Live Science in an email.

A big, bright surprise

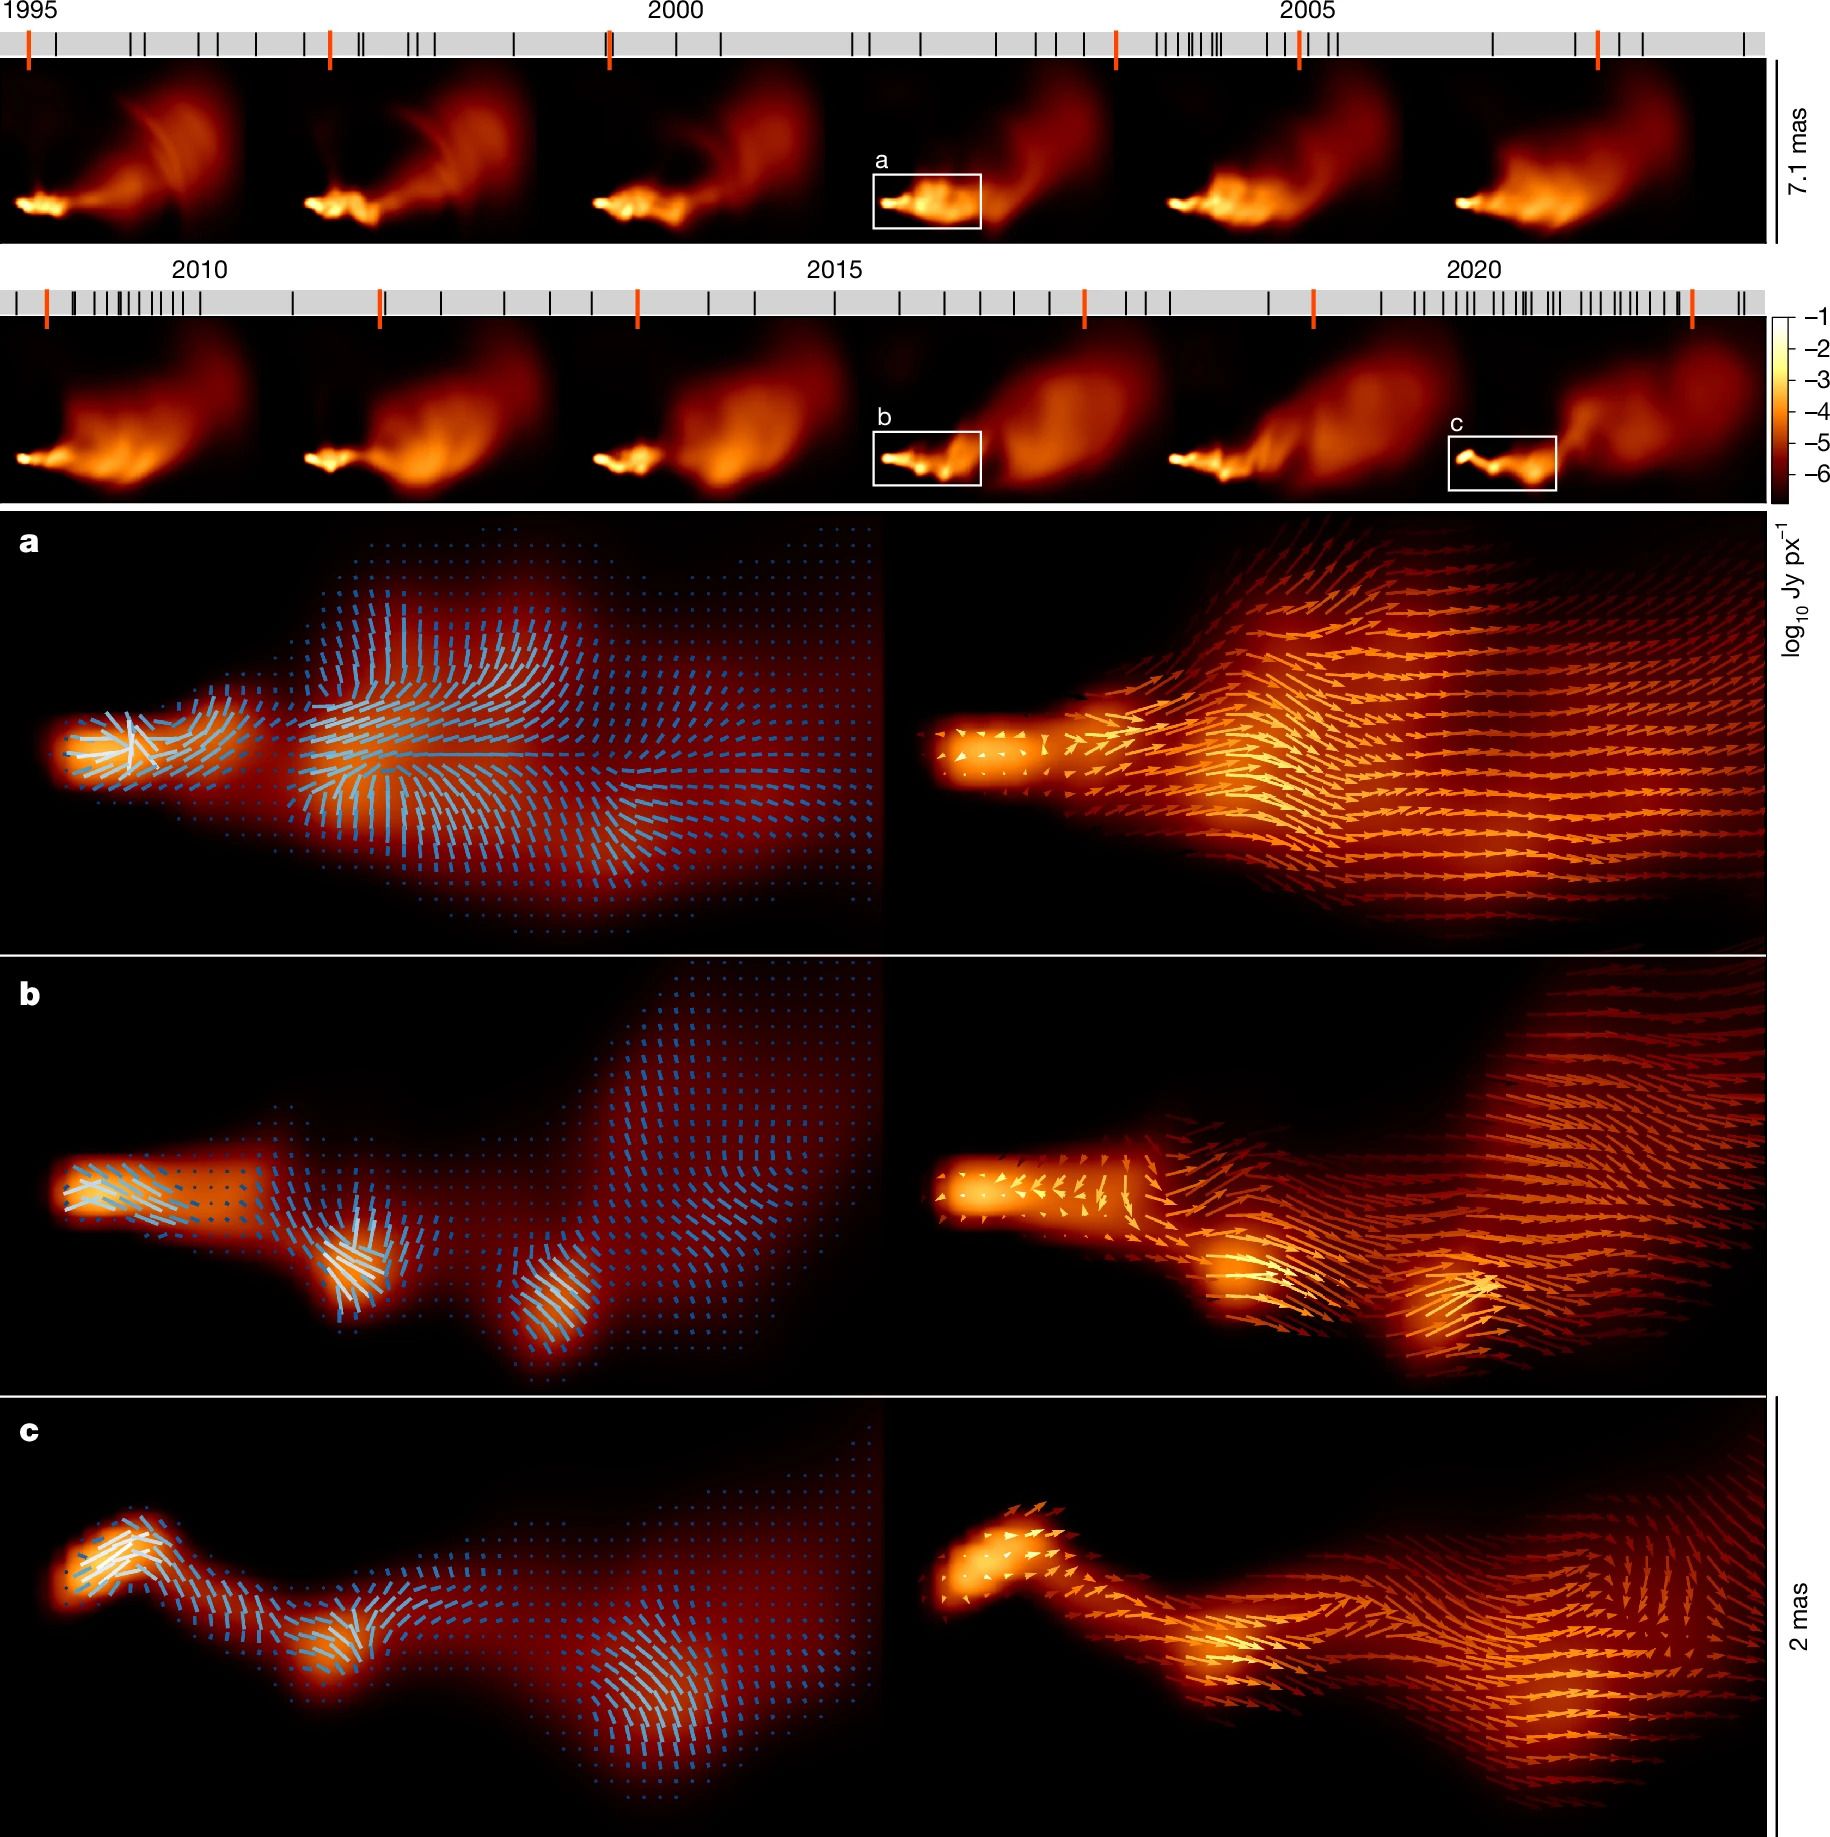
The researchers were surprised to see that the mighty jet's brightest components were flying at 10 to 13 times the speed of light while the gas surrounding it was zooming at about nine to 12 times the speed of light.

A series of orange plumes against a dark background

Still images of the black hole jet taken over 27 years. The bottom images (a-c) show the direction of polarization in the plasma jet. (Image credit: Foschi et al / Nature)

"This is unexpected because the general consensus is that these bright components are shock perturbations moving through the plasma, and as such they should have a higher velocity compared to the surrounding fluid," Foschi said. "Our work does not invalidate the shock model in general, but it puts it into question, at least in the case of this specific source."

VLBA uses radio antennae across the continental U.S. to map the sky, providing a wide view of the universe. But while VLBA has a comprehensive view of the sky, it lacks very fine details. The array is designed to generate a two-dimensional image with elements based on a measurement between two of the array's telescopes. Because the array has only 10 telescopes to do those measurements, however, its pixel resolution is limited.

That's where the Kine AI model makes a difference. The goal of Kine's work, Foschi said, is to develop an imaging algorithm that can create videos of observations at different times, focused on astronomical sources with variable brightness.

Kine is a neural network β€” a type of machine learning model that uses layers of "neurons" (computing nodes) to learn from a dataset, similar to the way a human brain learns. Kine can "process observations at different times, while learning and leveraging the spatio-temporal correlations present in the data," the research team wrote in the paper, referring to time and the three dimensions of space.

Foschi said the team is eager to apply Kine to other astronomical observations. "We believe this method will drastically change the way jet dynamics is studied from observations," she said. "In fact, our method enables a precise measurement of the projected velocity at any point in the jet."

See how much you know about black holes with our black hole quiz!

❌