❌

Normal view

James Webb telescope pinpoints the most distant 'fast radio burst' ever seen

8 October 2026 at 19:00

Astronomers have detected the most distant burst of radio signals ever seen: an explosion that's emitting waves of energy from more than 10 billion light-years away.

The event, named FRB 20240304B, is known as a fast radio burst (FRB). Astronomers have detected thousands of FRBs before this. But because these events last only milliseconds, they are extremely difficult to study and their origin stories remain unclear.

In this case, however, astronomers managed to use a radio telescope array and the James Webb Space Telescope (JWST) to chart the event, with JWST narrowing down the precise host galaxy that FRB 20240304B came from. The study, published Thursday (Oct. 8) in the journal Science , sheds more light on a time when the universe was only about 3 billion years old, showing that FRBs arose early in our cosmos' history. The detection more than doubles the previous distance record for FRBs.

The JWST played an instrumental role in the discovery, study co-author Themiya Nanayakkara, a senior lecturer at the Sydney Institute for Astronomy, told Live Science in an email. The email was written in collaboration with study first author Manisha Caleb, a senior lecturer in astrophysics at the same university.

For example, JWST's observations showed that the host galaxy was smaller than expected, was "metal-poor" (had few elements besides hydrogen and helium), and was forming a lot of stars. These characteristics could offer new clues about the environments in which FRBs arise, giving more information about the mysterious events. Researchers suggest that this FRB may have been linked to a magnetar, a highly magnetic star core left after a supernova.

Zooming in with the James Webb telescope

The ancient FRB was initially detected with MeerKAT, an array of 64 radio telescopes in South Africa. Nanayakkara said MeerKAT revealed "both the detection of the fast radio burst and, importantly, a very precise position on the sky."

The researchers knew the FRB was far away because of the large dispersion of the radio signal, but initial searches with powerful ground-based telescopes, "saw essentially nothing; it looked like empty sky," the researchers told Live Science. "The most likely explanation was that the galaxy was simply too faint to be detected in those observations. That is where JWST became transformative."

An illustration of a series of colorful hexagons in front of a pink background

An illustration of a fast radio burst (FRB) being detected by the MeerKAT radio telescope array. (Image credit: Carl Knox - OzGrav, Swinburne University of Technology Background Image Credit: NASA, ESA, CSA, STScI, Themiya Nanayakkara (USYD) Background Image Processing Credit: Joseph DePasquale (STScI))

The science team successfully got time on JWST with a program called Director’s Discretionary Time, which is aimed at time-sensitive observations. The researchers started by using JWST's Near Infrared Camera to trace the radio signal and take a very deep image of the target region.

"Suddenly, there it was: a very faint galaxy almost exactly where we expected the host of the FRB to be," Nanayakkara said. The researchers then used JWST's Near Infrared Spectrograph to obtain a spectrum (wavelengths of light broken into different chemical signatures), which showed hydrogen and oxygen.

"These spectral features act like fingerprints: because we know the wavelengths at which they are produced in the laboratory, we can measure how much they have been shifted by the expansion of the universe," Nanayakkara explained. "That gave us a very precise redshift of about 2.15. We are therefore seeing this galaxy as it was when the universe was only around three billion years old, so roughly one-fifth of its current age."

Because the host galaxy is fairly young, it supports the idea that at least some FRBs are generated by magnetars, which are more likely to appear in spry galaxies where intense star formation is occurring, the team said.

The team plans to continue hunting for FRBs with JWST.

"We do not know what the sources will be yet," Nanayakkara said, as that depends on what pops up in the sky and is spotted by ground-based radio telescopes. "Once our radio telescopes find and localize a suitable new source, we can trigger the JWST observations. So it is quite exciting, because we really have no idea what we will find when we combine the power of these two types of telescopes."

Strange 'centaur' object between Saturn and Uranus has mysterious, changing rings, James Webb telescope study hints

15 September 2026 at 22:01

The rings around a strange small body orbiting between Saturn and Uranus look mysteriously different from previous views, new observations from the James Webb Space Telescope (JWST) suggest.

The rings encircle Chariklo, which is a centaur, a strange type of object that shows characteristics of both asteroids and comets. Chariklo is only about 400 miles (250 kilometers) in diameter and is part of a large group of tiny objects in the distant solar system.

Scientists first discovered Chariklo's rings in 2013 β€” making it the first small solar system body found to have rings β€” and studied them with ground-based telescopes again in 2014 and 2017. When JWST took another look at Chariklo in 2022, a decade had brought a lot of difference, according to a study published Sept. 9 in the journal Science Advances.

"By comparing JWST observations with those obtained … over the last decade, we discovered opposite changes in the two rings: while the inner ring shows significantly higher opacity, the outer ring shows lower opacity, " Pablo Santos-Sanz, a researcher at the Institute of Astrophysics of Andalusia and first author of the study, said in a statement.

Researchers don't know exactly how the changes took place, but the study authors offered three suggestions. The first is that JWST, which has a fine resolution, was able to see both denser and sparser zones of the rings than previous observations showed. The second is that there were changes in the rings' material or in the grains themselves. Finally, a third possibility is that JWST could see "grains with wavelength-dependent optical properties," meaning the telescope saw effects in composition and grain size that explain the variability.

Santos-Sanz said the research suggests that small bodies with rings β€” even those orbiting far away from the gravitational influences of planets β€” may have more changes in their systems than scientists previously thought. "Our results force us to rethink how they form, how they evolve, and what mechanisms maintain their stability," he said.

A theoretical follow-up observation, taken the next time Chariklo passes in front of a star, would help to confirm the new JWST results, the researchers added β€” especially the apparent decreased opacity of one of the rings and the increased opacity of the other.

"These observations would help disentangle temporal evolution from wavelength-dependent scattering effects, and clarify the physical processes shaping Chariklo’s rings," the researchers stated in the study.

A JWST milestone

The new observations of Chariklo also mark the first time that scientists have planned a JWST viewing campaign specifically around a stellar occultation β€” that is, the researchers timed the viewing precisely to when Chariklo passed in front of a distant star from the telescope's point of view.

All observations of Chariklo's rings, on the ground and in space, have used stellar occultations. That's because the rings are too faint to be imaged directly, so astronomers must instead learn more about the rings by measuring the dips and increases in brightness as Chariklo passes in front of the background star. Scientists use a similar method to study the atmospheres of alien planets with JWST's infrared instruments.

Chariklo's speed relative to JWST was low, at 1.5 miles per second (2.5 kilometers per second), allowing for fine imaging of the rings. To time the occultation, the researchers used info from the European Space Agency's Gaia mission, which precisely charts the locations and movements of more than 2 billion stars, as well as calculated the orbit of JWST at a location roughly 930,000 miles (1.5 million km) from Earth in the opposite direction of the sun. According to the researchers, the planning and execution of the mission required "extreme precision."

Mercury may have shrunk much more than we thought, new study hints

10 September 2026 at 14:00

Mercury, which is about one-third the size of Earth, may have shrunk more in its evolution than scientists originally thought.

A new study suggests that the tiny planet may have contracted 10% to 30% more than previous models suggested β€” meaning the planet’s total diameter shrunk almost 12 miles (19 km) since Mercury was formed. (Mercury’s diameter today is roughly 3,032 miles (4,880 km).

Previous missions overlooked the extent of the shrinkage because impact-crater debris on Mercury's surface hid the evidence, according to a study published Thursday (Sept. 10) in the journal Geophysical Research Letters. That size difference is important when researchers consider the planet's history, said Gaku Nishiyama, a planetary scientist at the German Aerospace Center Institute of Space Research and an author of the study.

"Because Mercury's evolution is driven by its cooling, the amount of contraction β€” an indicator of the extent of cooling β€” is one of the most important observables that can be compared to models for estimating its evolution scenario," Nishiyama told Live Science in an email.

There could also be implications for the planet's composition. For example, more shrinkage at Mercury could mean the planet would have a larger metal core and fewer light elements, such as silicon, inside that core, according to an American Geophysical Union statement.

"The interior of Mercury would reflect its formation," Nishiyama said, and possibly hint at the innermost part of our solar system. "Therefore, to understand how our solar system has evolved up to now, information that can be extracted from this estimation β€” such as core composition and initial temperature condition β€” is critical."

A violent history

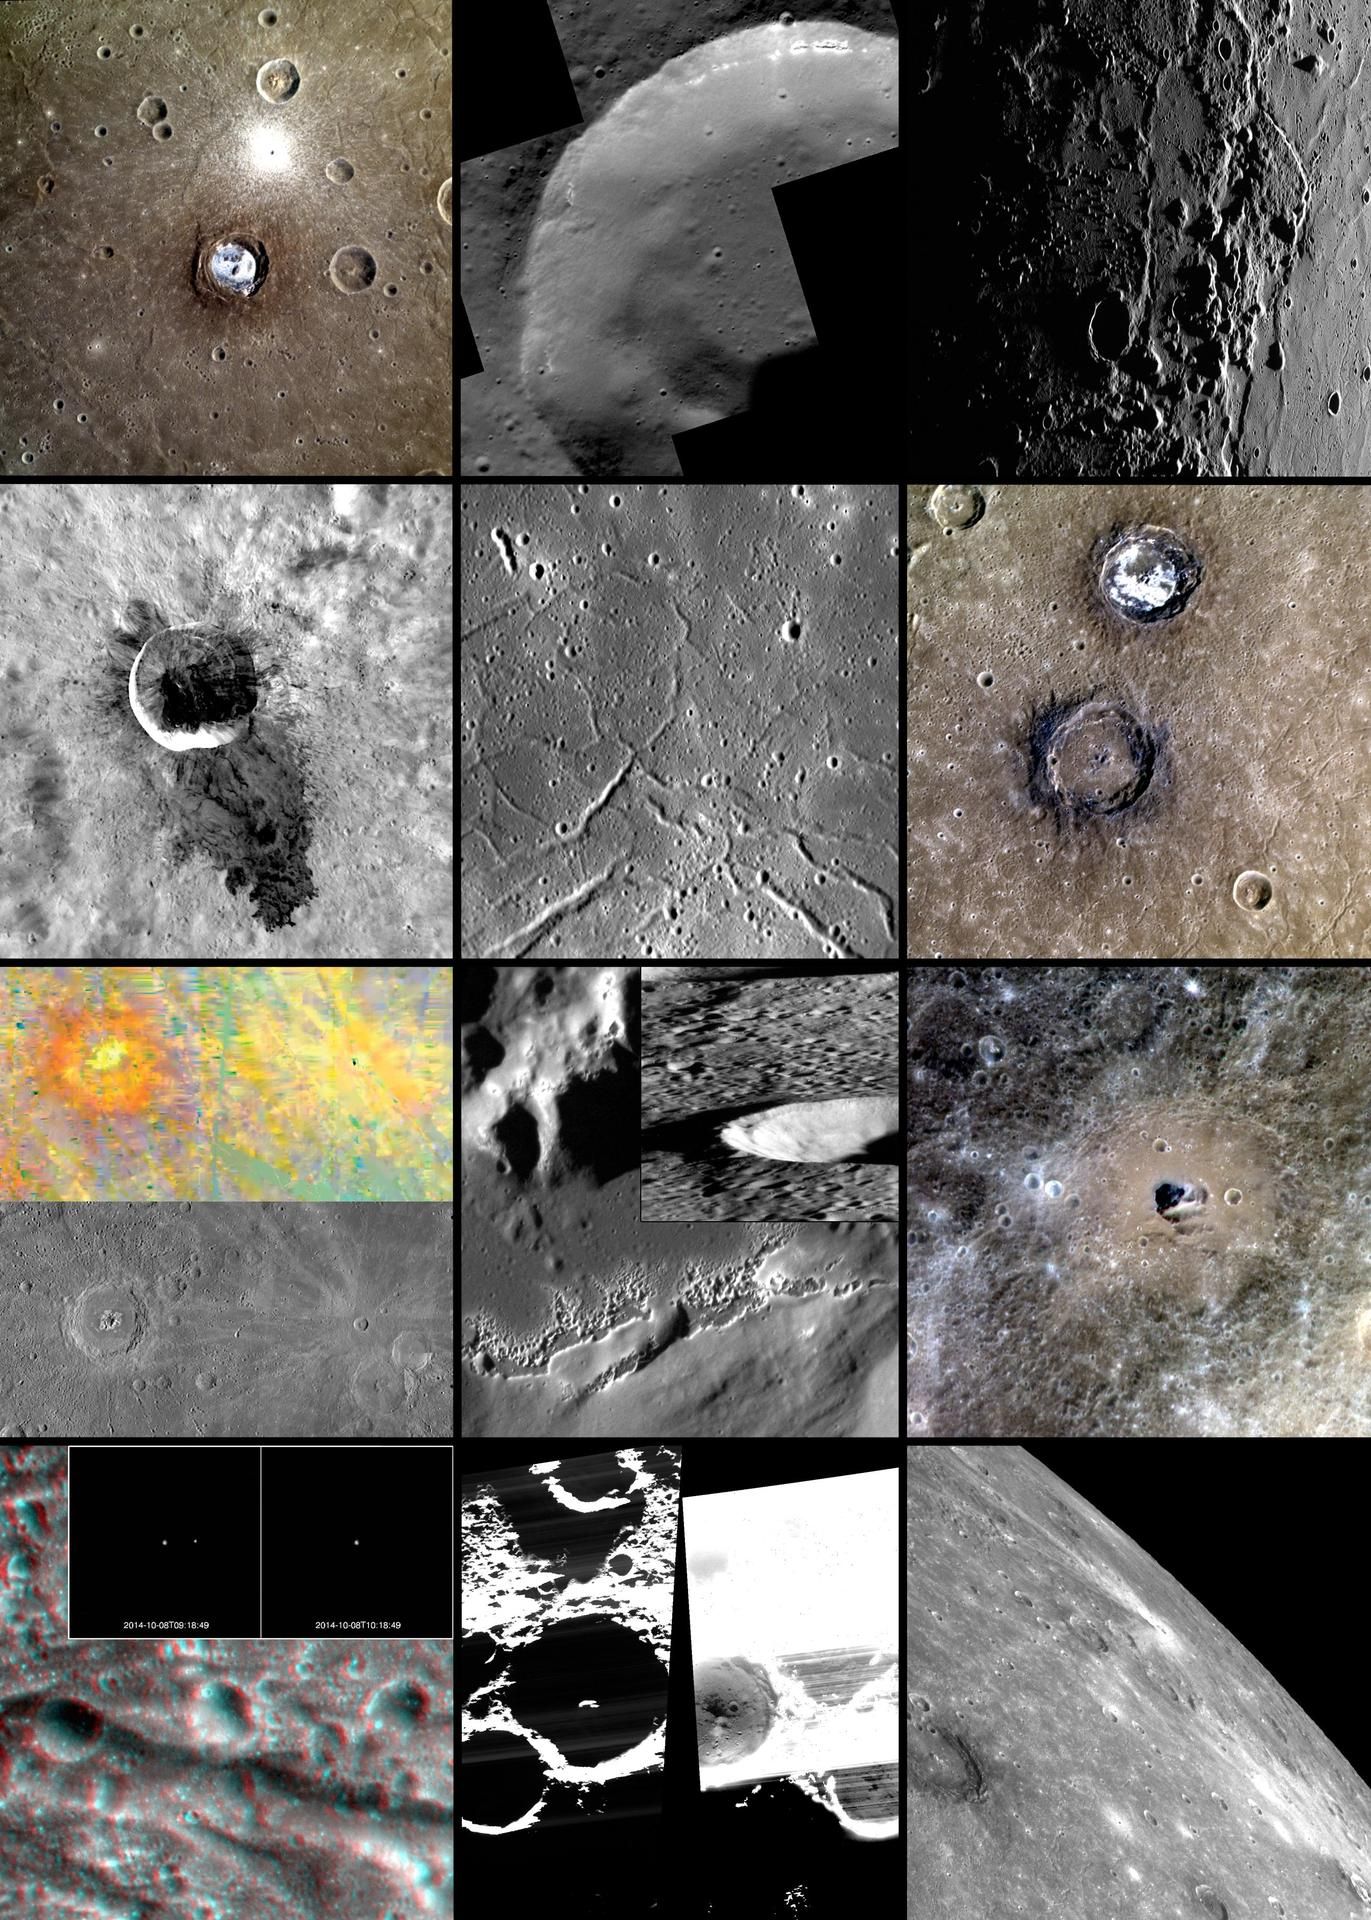
A series of images of the surface of Mercury from space.

Observations from NASA's MESSENGER spacecraft (examples shown here) helped the team build new maps of the planet's shrinkage. (Image credit: NASA/Johns Hopkins University Applied Physics Laboratory/Carnegie Institution of Washington)

Mercury and the rest of the solar system planets formed due to the gradual collisions and aggregations of rock and gas upon asteroids and comets. Some of those impacts that created the planets also released a lot of heat. Mercury has been slowly cooling from those ancient impacts, and its interior has been shrinking along the way.

While this kind of cooling affects the entire planet's landscape, impact craters can mask the effects because each crash into the surface generates its own surface changes, including debris and new divots. The craters build up over time, making it difficult to spot more ancient geology underneath.

Nishiyama's team compared two sets of maps from Mercury, using data from NASA's MESSENGER mission, which orbited Mercury between 2011 and 2015. One set of maps charted geological features showing contraction, and the other set estimated the roughness of the planet's surface. Their work covered the entire surface and demonstrated that the most rugged spots on the planet have fewer wrinkles from shrinking. In other words, according to Nishiyama, the debris from more recent impacts is covering up the evidence of shrinking.

Nishiyama said more information will help to confirm the estimate. Such data could come from the European Space Agency's BepiColombo spacecraft, which began its arrival sequence at Mercury earlier this month after nearly eight years of space travel. Once the mission settles in, the spacecraft will take higher-resolution imagery of the surface than MESSENGER did. Nishiyama's team expects BepiColombo to pick up smaller impact craters, as well as scarps and ridges, that could further refine the measurements.

"Stay tuned for future topography measurements by BepiColombo," Nishiyama said. "Future data from laser altimetry on BepiColombo will collect more information on planetary contraction by measuring topography more precisely."

See the highest-resolution footage of a black hole jet ever taken, thanks to AI and 27 years of observations

9 September 2026 at 18:34

Astronomers just dropped a video 27 years in the making: the highest-definition animation of a gargantuan black hole jet blasting out of a distant galaxy and twisting off into space.

The video, made from 116 images taken between 1995 and 2022, captured a blazar known as 3C 345, in the constellation Hercules. A blazar is a sort of quasar β€” a bright, feeding supermassive black hole embedded in the center of a faraway galaxy β€” that emits huge jets of gas into its environment. The jets blaze at nearly the speed of light and are charged with highly concentrated X-rays and gamma rays.

As described in an Aug. 26 study in the journal Nature, scientists gathered the images of 3C 345 using decades of observations by the Very Long Baseline Array (VLBA), a network of 10 telescopes spread across the U.S. (VLBA had two programs that caught views of the jet, called BEAM-ME and MOJAVE, which collectively followed hundreds of blazar sources.)

To turn those hundred-or-so images into an animated movie, the team used an AI neural network named Kine, achieving a resolution four times higher than that of any individual image. By doing so, the researchers mapped the speed of the black hole jet to the highest precision yet. (Several study co-authors had previous experience boosting the resolution of distant black hole images while working at the Event Horizon Telescope Collaboration, the team behind the first image of a black hole.)

"The higher quality of our video reconstruction enabled a detailed measurement of the plasma velocity in the jet," study first author Marianna Foschi, a postdoctoral researcher at Caltech, told Live Science in an email.

A big, bright surprise

The researchers were surprised to see that the mighty jet's brightest components were flying at 10 to 13 times the speed of light while the gas surrounding it was zooming at about nine to 12 times the speed of light.

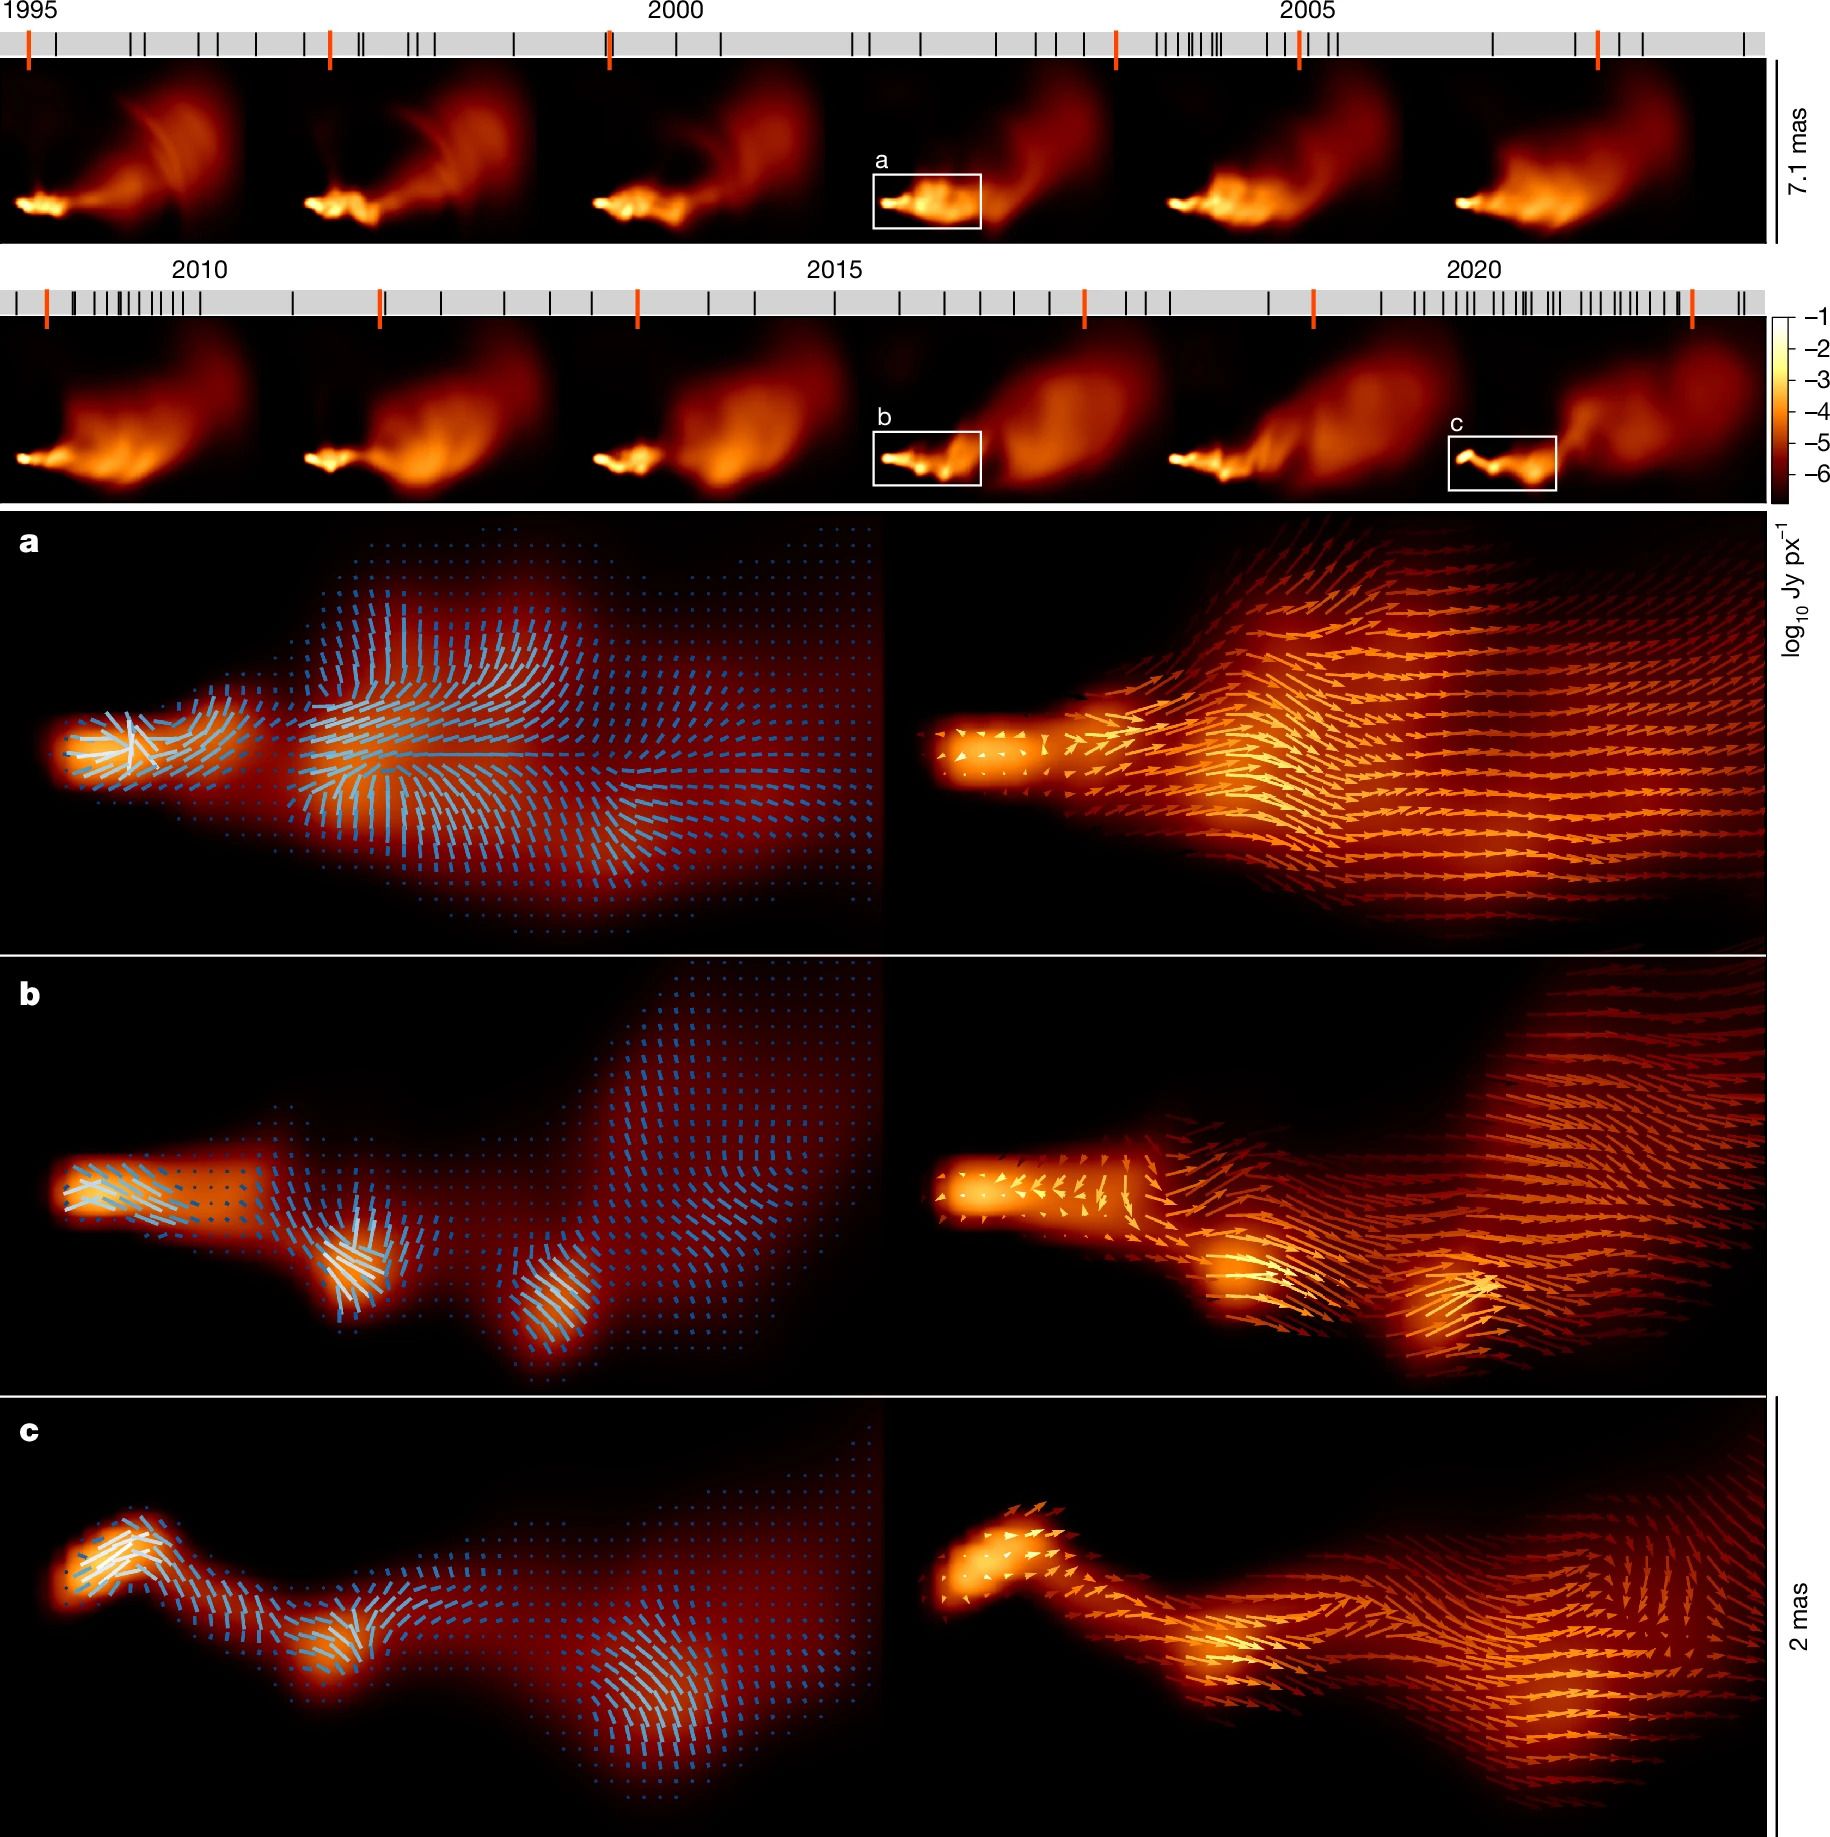
A series of orange plumes against a dark background

Still images of the black hole jet taken over 27 years. The bottom images (a-c) show the direction of polarization in the plasma jet. (Image credit: Foschi et al / Nature)

"This is unexpected because the general consensus is that these bright components are shock perturbations moving through the plasma, and as such they should have a higher velocity compared to the surrounding fluid," Foschi said. "Our work does not invalidate the shock model in general, but it puts it into question, at least in the case of this specific source."

VLBA uses radio antennae across the continental U.S. to map the sky, providing a wide view of the universe. But while VLBA has a comprehensive view of the sky, it lacks very fine details. The array is designed to generate a two-dimensional image with elements based on a measurement between two of the array's telescopes. Because the array has only 10 telescopes to do those measurements, however, its pixel resolution is limited.

That's where the Kine AI model makes a difference. The goal of Kine's work, Foschi said, is to develop an imaging algorithm that can create videos of observations at different times, focused on astronomical sources with variable brightness.

Kine is a neural network β€” a type of machine learning model that uses layers of "neurons" (computing nodes) to learn from a dataset, similar to the way a human brain learns. Kine can "process observations at different times, while learning and leveraging the spatio-temporal correlations present in the data," the research team wrote in the paper, referring to time and the three dimensions of space.

Foschi said the team is eager to apply Kine to other astronomical observations. "We believe this method will drastically change the way jet dynamics is studied from observations," she said. "In fact, our method enables a precise measurement of the projected velocity at any point in the jet."

See how much you know about black holes with our black hole quiz!

Hubble confirms mysterious, 10-sided cloud is growing over Saturn's south pole

3 September 2026 at 22:27

New Hubble observations have revealed a dramatic, 10-sided jet surrounding Saturn's south pole, and it appears to be evolving before our eyes.

The Hubble Space Telescope recently snapped a high-resolution view of the striking "atmospheric wave," which appears to have begun forming in 2023, archival Hubble images show. Scientists are curious about how this "decagon" popped up so quickly, given that Saturn's other famous multisided wave β€” a hexagon at the north pole β€” has been observed on the planet for 40-plus years.

"The question is, why did it suddenly form now when we haven't seen one before?" Amy Simon, a senior scientist at NASA's Goddard Space Flight Center and co-author of a new study describing the observations, said in a statement.

"The northern hexagon has been there every time we've looked for more than 40 years," Simon added. "This feature is different β€” it appears to be strengthening, giving us the rare opportunity to watch a giant atmospheric pattern develop."

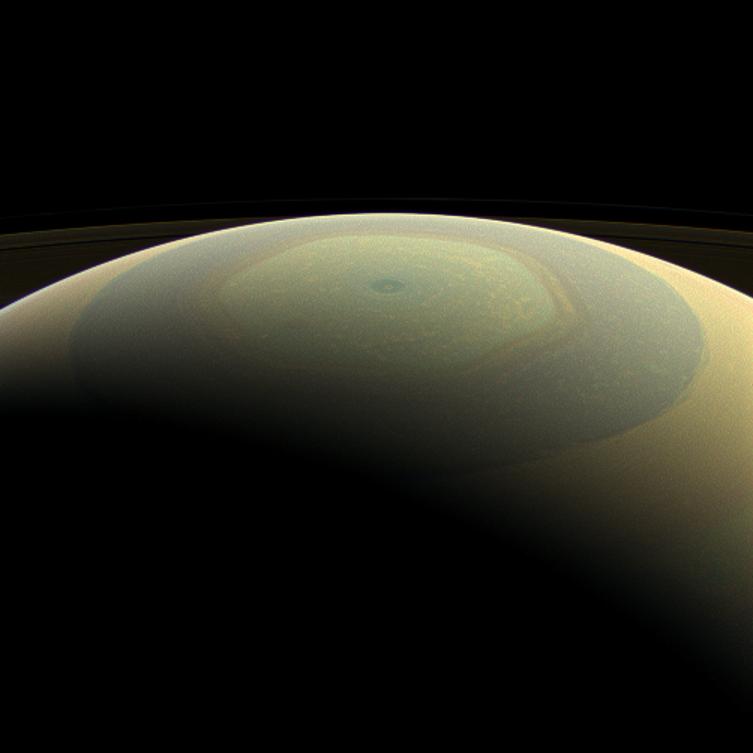
The globe of Saturn, seen here in natural color, is reminiscent of a holiday ornament in this wide-angle view from NASA's Cassini spacecraft.

The famous hexagon at Saturn’s north pole. (Image credit: NASA/JPL-Caltech/Space Science Institute)

Scientists can see the wave persisting through several atmospheric layers, which means it extends beyond the cloud tops. The wave is also found in a large jet stream at Saturn. More observations with Hubble and the James Webb Space Telescope (JWST) will be required to see how the wave is generated and what the decagon illustrates about atmospheres in large gas giants like Saturn.

The images were obtained as part of Hubble's Outer Planet Atmospheres Legacy program, which uses some of the telescope's time to image the solar system's outer planets β€” Jupiter, Saturn, Uranus and Neptune β€” once a year. The goal is to obtain long-term observations of these worlds, to supplement spacecraft orbiting or flying by.

From Earth's perspective, Saturn is slowly orbiting in its roughly 29-year journey of the sun so that its south pole is visible from our planet, allowing for a good view of the changing decagon. Hubble, in fact, was not the first to see signs of this decagonal shape; it was ground-based observatories that spotted a mysterious undulating band around Saturn’s south pole in 2024.

AgustΓ­n SΓ‘nchez-Lavega, first author of the study and a researcher in the Department of Applied Physics at the University of the Basque Country, and amateur astronomers Trevor Barry and Jean-Paul Oger first spotted the forming wave. The trio used the university's Planetary Virtual Observatory Laboratory, which brings in observations from around the world, to make the Saturnian discovery.

While more images in 2025 showed the wave starting to move into a decagon structure, Hubble was able to obtain high-resolution images without Earth's atmosphere in the way.

The Cassini spacecraft, which orbited Saturn between 2004 and 2017, didn't see the feature, hinting that it hadn’t started forming yet, according to NASA. "Given Saturn's symmetry in its north-south jet stream system, we have been searching for a counterpart to Saturn's northern hexagon on the south pole in Hubble images since 1990," SΓ‘nchez-Lavega said.

Both Hubble and JWST are expected to provide more opportunities to look at the ringed planet's developing decagon in the near future. In the meantime, Saturn isn’t the only solar system planet with perplexing polar features; 2017 images from NASA’s Juno spacecraft showed that Jupiter’s south pole is studded with gigantic, oval-shaped cyclones that echo the chaos of the planet’s famous Great Red Spot.

❌