❌

Normal view

Mass Measurements of the Double Neutron Star System PSR J0641+0448

5 June 2026 at 17:00
Z. L. Yang et al 2026 ApJL 1000 L1
Using the Five-hundred-meter Aperture Spherical radio Telescope, researchers have discovered and measured the spins and masses of a pair of neutron stars using the pulsar timing method.

The post Mass Measurements of the Double Neutron Star System PSR J0641+0448 appeared first on AAS Nova.

Courtside Seats on Mars

5 June 2026 at 17:00

A photograph of an entire visible hemisphere of Mars.

When the third known object from the galactic space beyond our Sun barreled through the solar system last year, Earth was in a terrible spot to view its flyby. Thankfully, however, a spacecraft that was previously busy mapping Mars took advantage of much better positioning for a closer look.

Cheap Seats

Astronomers have now observed three interstellar objects as they’ve flown through the solar system: 1I/ʻOumuamua, which shocked astronomers in 2017; 2I/Borisov, which followed in 2019 and behaved almost identically to a solar system comet; and now 3I/ATLAS, which was found buzzing toward the Sun in July 2025. As soon as 3I/ATLAS was spotted, pretty much every telescope on the planet took a look. The data swiftly revealed much that intrigued astronomers: while 3I/ATLAS was behaving essentially like a standard comet, its chemistry was nothing like its solar system counterparts, and its coma and dust outflow were strangely shaped. Among other oddities, it seemed to counterintuitively have a dust tail that pointed toward the Sun.

A plot showing that Earth-based observations could only get as best a 20-degree out-of-plane view, while Mars-based observations could get up to nearly 40.

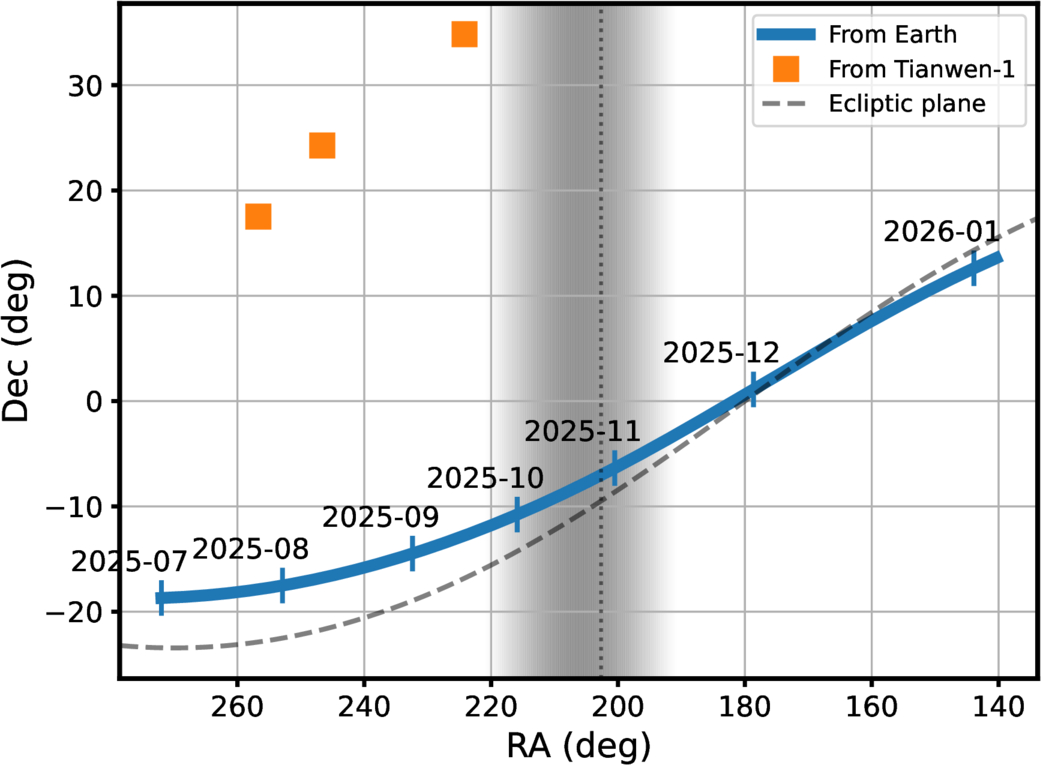
3I/ATLAS’s path across the sky as seen from Earth versus the clearer line of sight from Mars. The shaded region represents the times where the comet was too close to the Sun for viewing. [Xin Ren et al. 2026]

Unfortunately for astronomers, 3I/ATLAS didn’t make it easy for them to study the shape of its coma. Thanks to a cosmic coincidence, the interstellar visitor was traveling almost perfectly within the plane of our solar system, and Earthbound observers were often limited to an edge-on view of its tail. Even worse, 3I/ATLAS looped around the back of the Sun from our perspective, meaning no one on the planet could observe the comet for a few weeks in the fall. This led a group of astronomers to consider their assets that are farther from home.

Better View from Mars

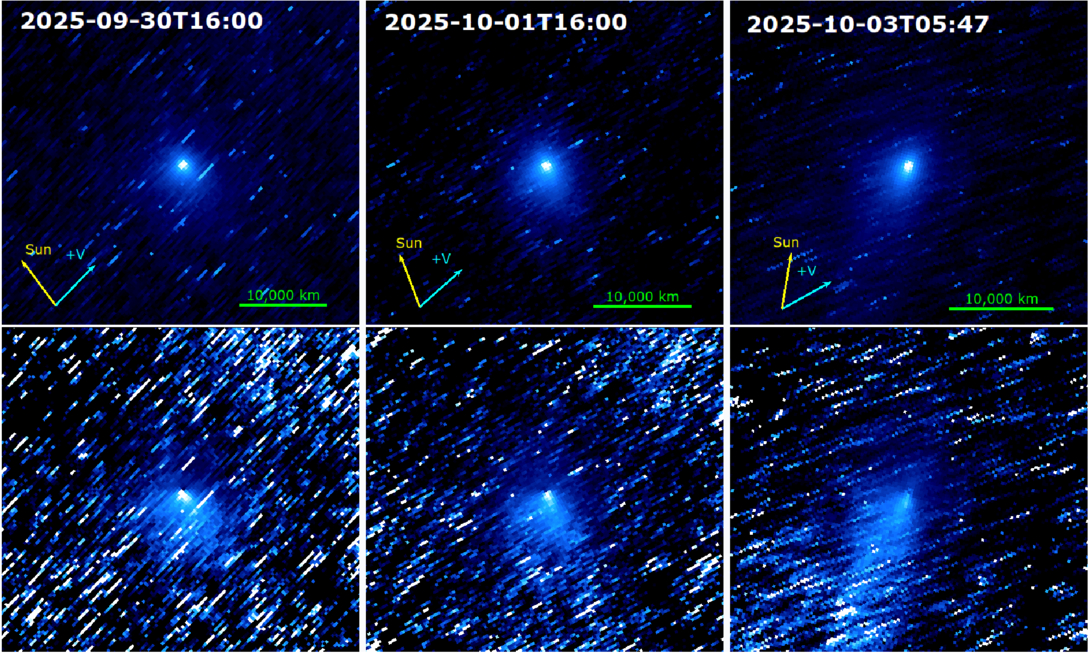
The Tianwen-1 spacecraft, which entered Martian orbit in early 2021 and has been diligently mapping the Red Planet ever since, has a high-resolution camera that’s normally pointed at the planet’s surface. By spinning the spacecraft around, a team of researchers led by Xin Ren (National Astronomical Observatories, Chinese Academy of Sciences) repurposed the camera to act as a small telescope when 3I/ATLAS flew by. In another cosmic coincidence, 3I/ATLAS happened to pass very near Mars last fall, and this close approach gave Tianwen-1 a great out-of-plane view of the coma. The orbiter managed to capture 57 images of 3I/ATLAS over three days last fall, representing China’s first-ever observations of an object from an asset in deep space.

Multi-panel photographs of a comet against a background of streaked stars.

Stacked images of 3I/ATLAS from the Tianwen-1 orbiter across three epochs; the tail’s apparent shape shifts as the viewing geometry changes. Click to enlarge. [Xin Ren et al. 2026]

The team took full advantage of the great view and leveraged the spacecraft’s unique perspective to extract some intriguing results. By tracking how the gentle pressure of sunlight nudged the escaping grains, the researchers found that the coma is dominated by surprisingly large dust. With an average size of hundreds of microns across, the dust is more like coarse sand than smoke, and they found that it ambles away from the comet at just 3–10 meters per second. All told, 3I/ATLAS was shedding dust at roughly 1,000 kilograms every second. The big grains may be a fingerprint of a cold, distant birthplace: models suggest such grains collect in the frigid outer reaches of planet-forming disks, hinting that 3I/ATLAS was forged far from its parent star before being flung into the dark.

As new surveys begin to turn up interstellar interlopers more often, this improvised observation makes a tidy point: the spacecraft already scattered across the solar system can double as a fleet of opportunistic comet-watchers, each offering a view we simply can’t get from home.

Citation

“Interstellar Object 3I/ATLAS Observed from Mars by China’s Tianwen-1 Spacecraft,” Xin Ren et al 2026 ApJL 1003 L10. doi:10.3847/2041-8213/ae61b3

The post Courtside Seats on Mars appeared first on AAS Nova.

The First Dedicated Survey of Atmospheric Escape from Planets Orbiting F Stars

4 June 2026 at 17:00
Morgan Saidel et al 2026 AJ 171 257
A survey of six gas giants orbiting F-type stars suggests that atmospheric escape of these planets is determined by the X-ray and extreme-ultraviolet output of their host stars as well as the Roche filling factor.

The post The First Dedicated Survey of Atmospheric Escape from Planets Orbiting F Stars appeared first on AAS Nova.

Now That’s Metal: How to Spot Stars That Have Swallowed Their Planets

3 June 2026 at 17:00

An illustration of an exoplanet about to be engulfed by its host star

Planets that get too close to their host stars are liable to be engulfed and consumed. New research explores how to identify stars that have had a planetary snack.

It’s Snack Time

Being a planet that closely orbits its star is dangerous, and various dynamical processes can draw a planet inward past the point of no return. When a planet vanishes beneath the surface of its host, it eventually disintegrates within the star, its atoms mixing into the blazing stellar soup.

This outcome is likely extremely common across the universe, and researchers have begun to see evidence for it: stars that appear to have absorbed angular momentum from their planets, white dwarfs with uncanny metals in their spectra, and stars with chemical abundances that don’t match those of their siblings. Now, in a recent publication led by Kaitlyn Lane (Vanderbilt University), researchers seek to find observational signatures of planetary engulfment of rocky exoplanets by main-sequence stars.

Modeling Engulfment

Lane’s team focused on main-sequence stars in the range of 0.5 to 1.4 solar masses, using one-dimensional analytical models to determine which of these stars will most readily display signs of having engulfed a planet. They simulated the stars as they consumed either an Earth-like planet or a super-Earth with the same composition as Earth but 15 times its mass.

illustration of a planet being engulfed by its star

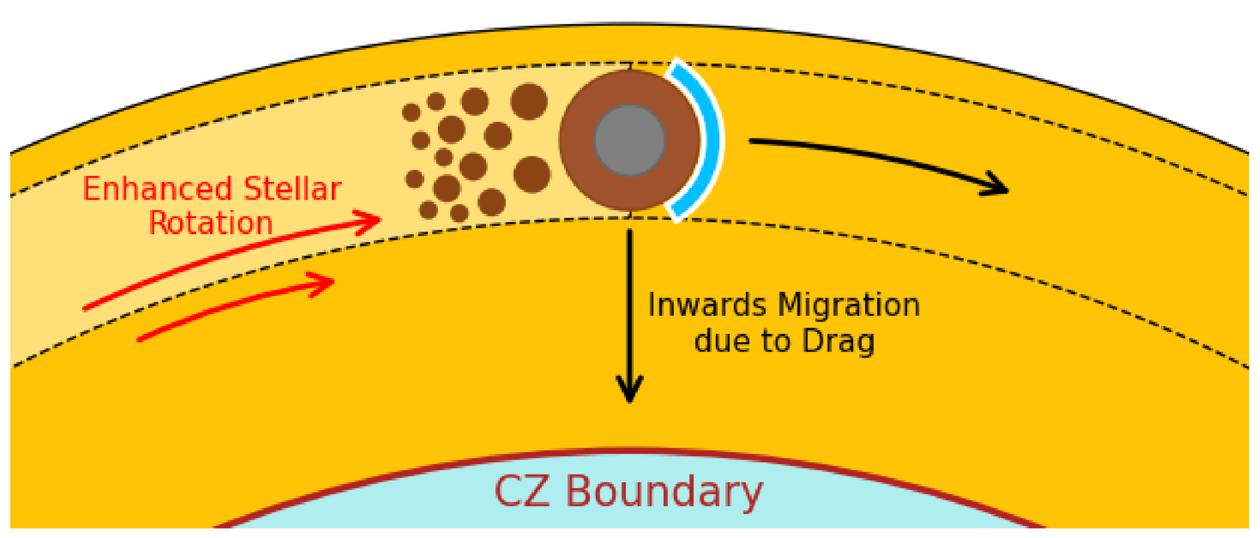
Diagram showing a planet being engulfed by its star and beginning to disintegrate before migrating inward. The boundary between the star’s outer convective zone (CZ) and inner radiative zone is shown. Click to enlarge. [Lane et al. 2026]

At the onset of the model, the engulfment is set to begin, the planet placed tangent to the star’s surface. The planets sink down and orbit just barely within their stars for 1–10 years, their solid surfaces slowly beginning to evaporate.

After that relatively lengthy phase, the process proceeds rapidly: as the planet inches deeper into its star, the drag forces grow stronger and the planet’s demise accelerates, with the planet disintegrating over the course of hours. In the last phase, the planet makes its final plunge and is destroyed in a half hour.

Signs of Planets Past

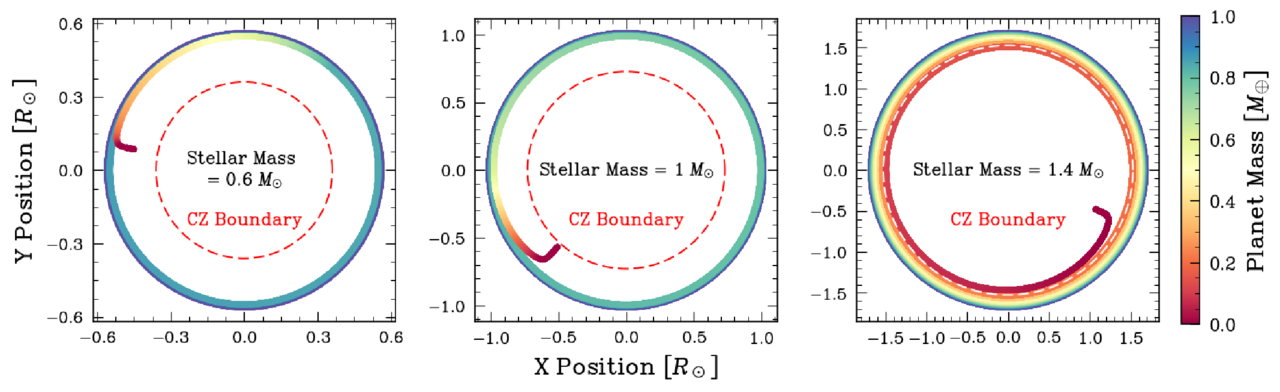
Lane’s team found that the planets tended to be destroyed fully within the outer convective layer of their stars, except in the case of the most massive stars studied here. For more massive stars, the outer convective zone is shallower than it is for the less massive stars, allowing a chunk of each planet to survive the passage through the convective zone to reach the radiative zone below.

simulation results showing planets disintegrating within their host stars

The trajectories of three example cases, showing how the planet loses mass as it spirals inward. In the 1.4-solar-mass case, part of the planet survives to reach the radiative zone, but the shallowness of the star’s convective zone means that the disintegrated planetary material is easier to observe. Click to enlarge. [Lane et al. 2026]

What this translates to, for the purposes of identifying planet-eating stars from afar, is that stars near the top of the mass range studied — from 1.0 to 1.4 solar masses — make the best targets. This is because the tell-tale planetary metals are not overly diluted within the stars’ relatively small convective zones, making these elements easier to detect. In terms of specific metals, the authors found that aluminum, calcium, and vanadium are the best signposts of planetary engulfment, with lithium also making the list.

While the authors acknowledge that there’s more work to be done — they plan to investigate the impacts of planetary engulfment on stellar structure more closely, for example — this work represents an important foray into identifying targets for future studies of stars that have eaten their planets.

Citation

“Observable Metal Pollution in Main-Sequence Stars: Simulations of Rocky Planets Engulfed by Stars in the 0.5 to 1.4 M⊙ Range,” Kaitlyn T. Lane et al 2026 ApJ 1003 67. doi:10.3847/1538-4357/ae5b9a

The post Now That’s Metal: How to Spot Stars That Have Swallowed Their Planets appeared first on AAS Nova.

Measuring the Distances to Asteroids from One Observatory in One Night with Upcoming All-Sky Telescopes

3 June 2026 at 17:00
Maryann Benny Fernandes et al 2026 Planet. Sci. J. 7 76
Using simulations of 20 asteroids from 0.05 to 2.4 au away, researchers demonstrate how the technique of topocentric parallax could be used to determine the distance to an asteroid in a single night.

The post Measuring the Distances to Asteroids from One Observatory in One Night with Upcoming All-Sky Telescopes appeared first on AAS Nova.

The First Starspot Spectrum Revealed by JWST

2 June 2026 at 17:00

M-dwarf star with starspots

Editor’s Note: Astrobites is a graduate-student-run organization that digests astrophysical literature for undergraduate students. As part of the partnership between the AAS and astrobites, we occasionally repost astrobites content here at AAS Nova. We hope you enjoy this post from astrobites; the original can be viewed at astrobites.org.

Title: A Panchromatic JWST Spectrum of a Giant Starspot on the Fully Convective M Dwarf TOI-3884
Authors: C. A. Murray et al.
First Author’s Institution: University of Colorado Boulder
Status: Published in ApJ

We often picture stars as smooth, glowing spheres, as if they’ve been run through an Instagram filter. But real stars have spots: cooler, darker regions on a star’s surface caused by strong magnetic fields.

Annoyingly, these spots can seriously interfere with how we study exoplanet atmospheres.

How to Probe a Planetary Atmosphere

Planetary atmospheres are often probed through transmission spectroscopy. When a planet transits its star, some starlight passes through the planet’s atmosphere before reaching us. We can distinguish the light that has passed through the planet’s atmosphere by comparing the star’s light in transit versus out of transit. In doing so, we can isolate the atmospheric spectrum and look for absorption features of species like water or oxygen.

Easy, right?

How Starspots Get in the Way

Things get more complicated once we stop thinking of the star as if it’s been smoothed out by an Instagram filter. Starspots are cooler than the surrounding stellar surface, which means they emit a different spectrum. They are also constantly changing: new spots can form, old ones can disappear, and the star’s rotation carries them in and out of view. This changes things.

First of all, your star’s spectrum changes over time, which could mean that the star’s spectrum out of transit is not the same as the star’s spectrum during transit. On the other hand, the planet may transit across a starspot instead of a “normal” stellar region. In this case, the light we measure during the transit is affected by the spot, and it is no longer accurate to directly compare it with the overall stellar light outside the transit.

Ultimately, absorption features that we thought were from the planetary atmosphere could actually be coming from starspot contamination instead.

Starspot Models: Our Solution?

To deal with this, astronomers build starspot models, where they vary the spots in terms of the following:

  • The surface covering fraction: this parameter tells us how much of the stellar surface is covered in spots
  • The temperature contrast: this parameter tells us how much cooler (in ratio) the spot is compared to the rest of the stellar surface, and by proxy how much dimmer

These models are promising, but how do we know that we have chosen the right parameters?

A Unique Laboratory: TOI-3884

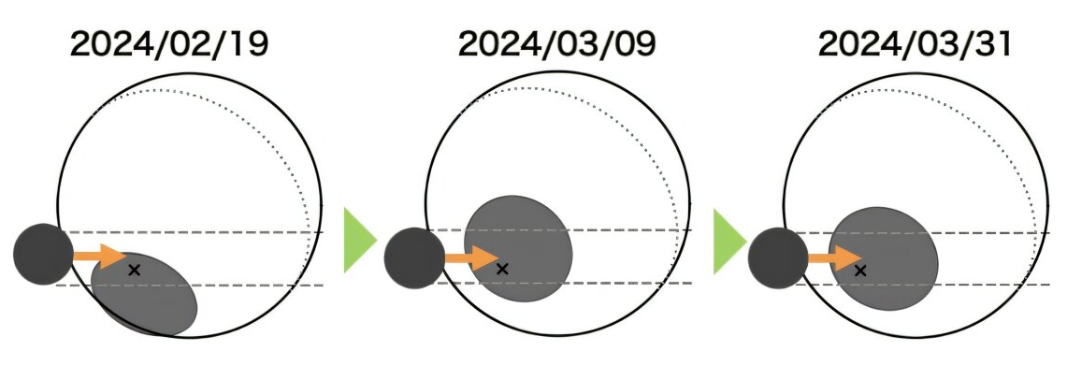
The TOI-3884 system is a unique laboratory for testing our starspot models. As seen in Figure 1, it has very convenient starspot geometry, with a large starspot located close to its pole. On top of that, we observe this star almost completely pole-on, which means that we always see this starspot, no matter how much the star rotates. To top this all off, the star hosts a close-in planet, which orbits the star from pole to pole.

Illustration of the TOI-3884 system

Figure 1: Illustration of the TOI-3884 system. The pole (and rotation axis) of the star is indicated with a black “x,” indicating that we see the star almost pole-on. The polar starspot is indicated in grey, and the transiting planet TOI-3884b is indicated in black. Different dates are shown, illustrating how the system evolves over the span of a few weeks. [Adapted from Mori et al. 2025]

The planet transits the star, and as it does so, it always passes over the polar starspot. This gives us a rare opportunity to probe the spectrum of a starspot. Similar to how we can use normal in/out of transit observations to probe a planetary atmosphere, we can now compare the observations during/after a “starspot transit” to probe the starspot region. Today’s authors do exactly this using six different transit observations from JWST.

So… How Good Are Our Models?

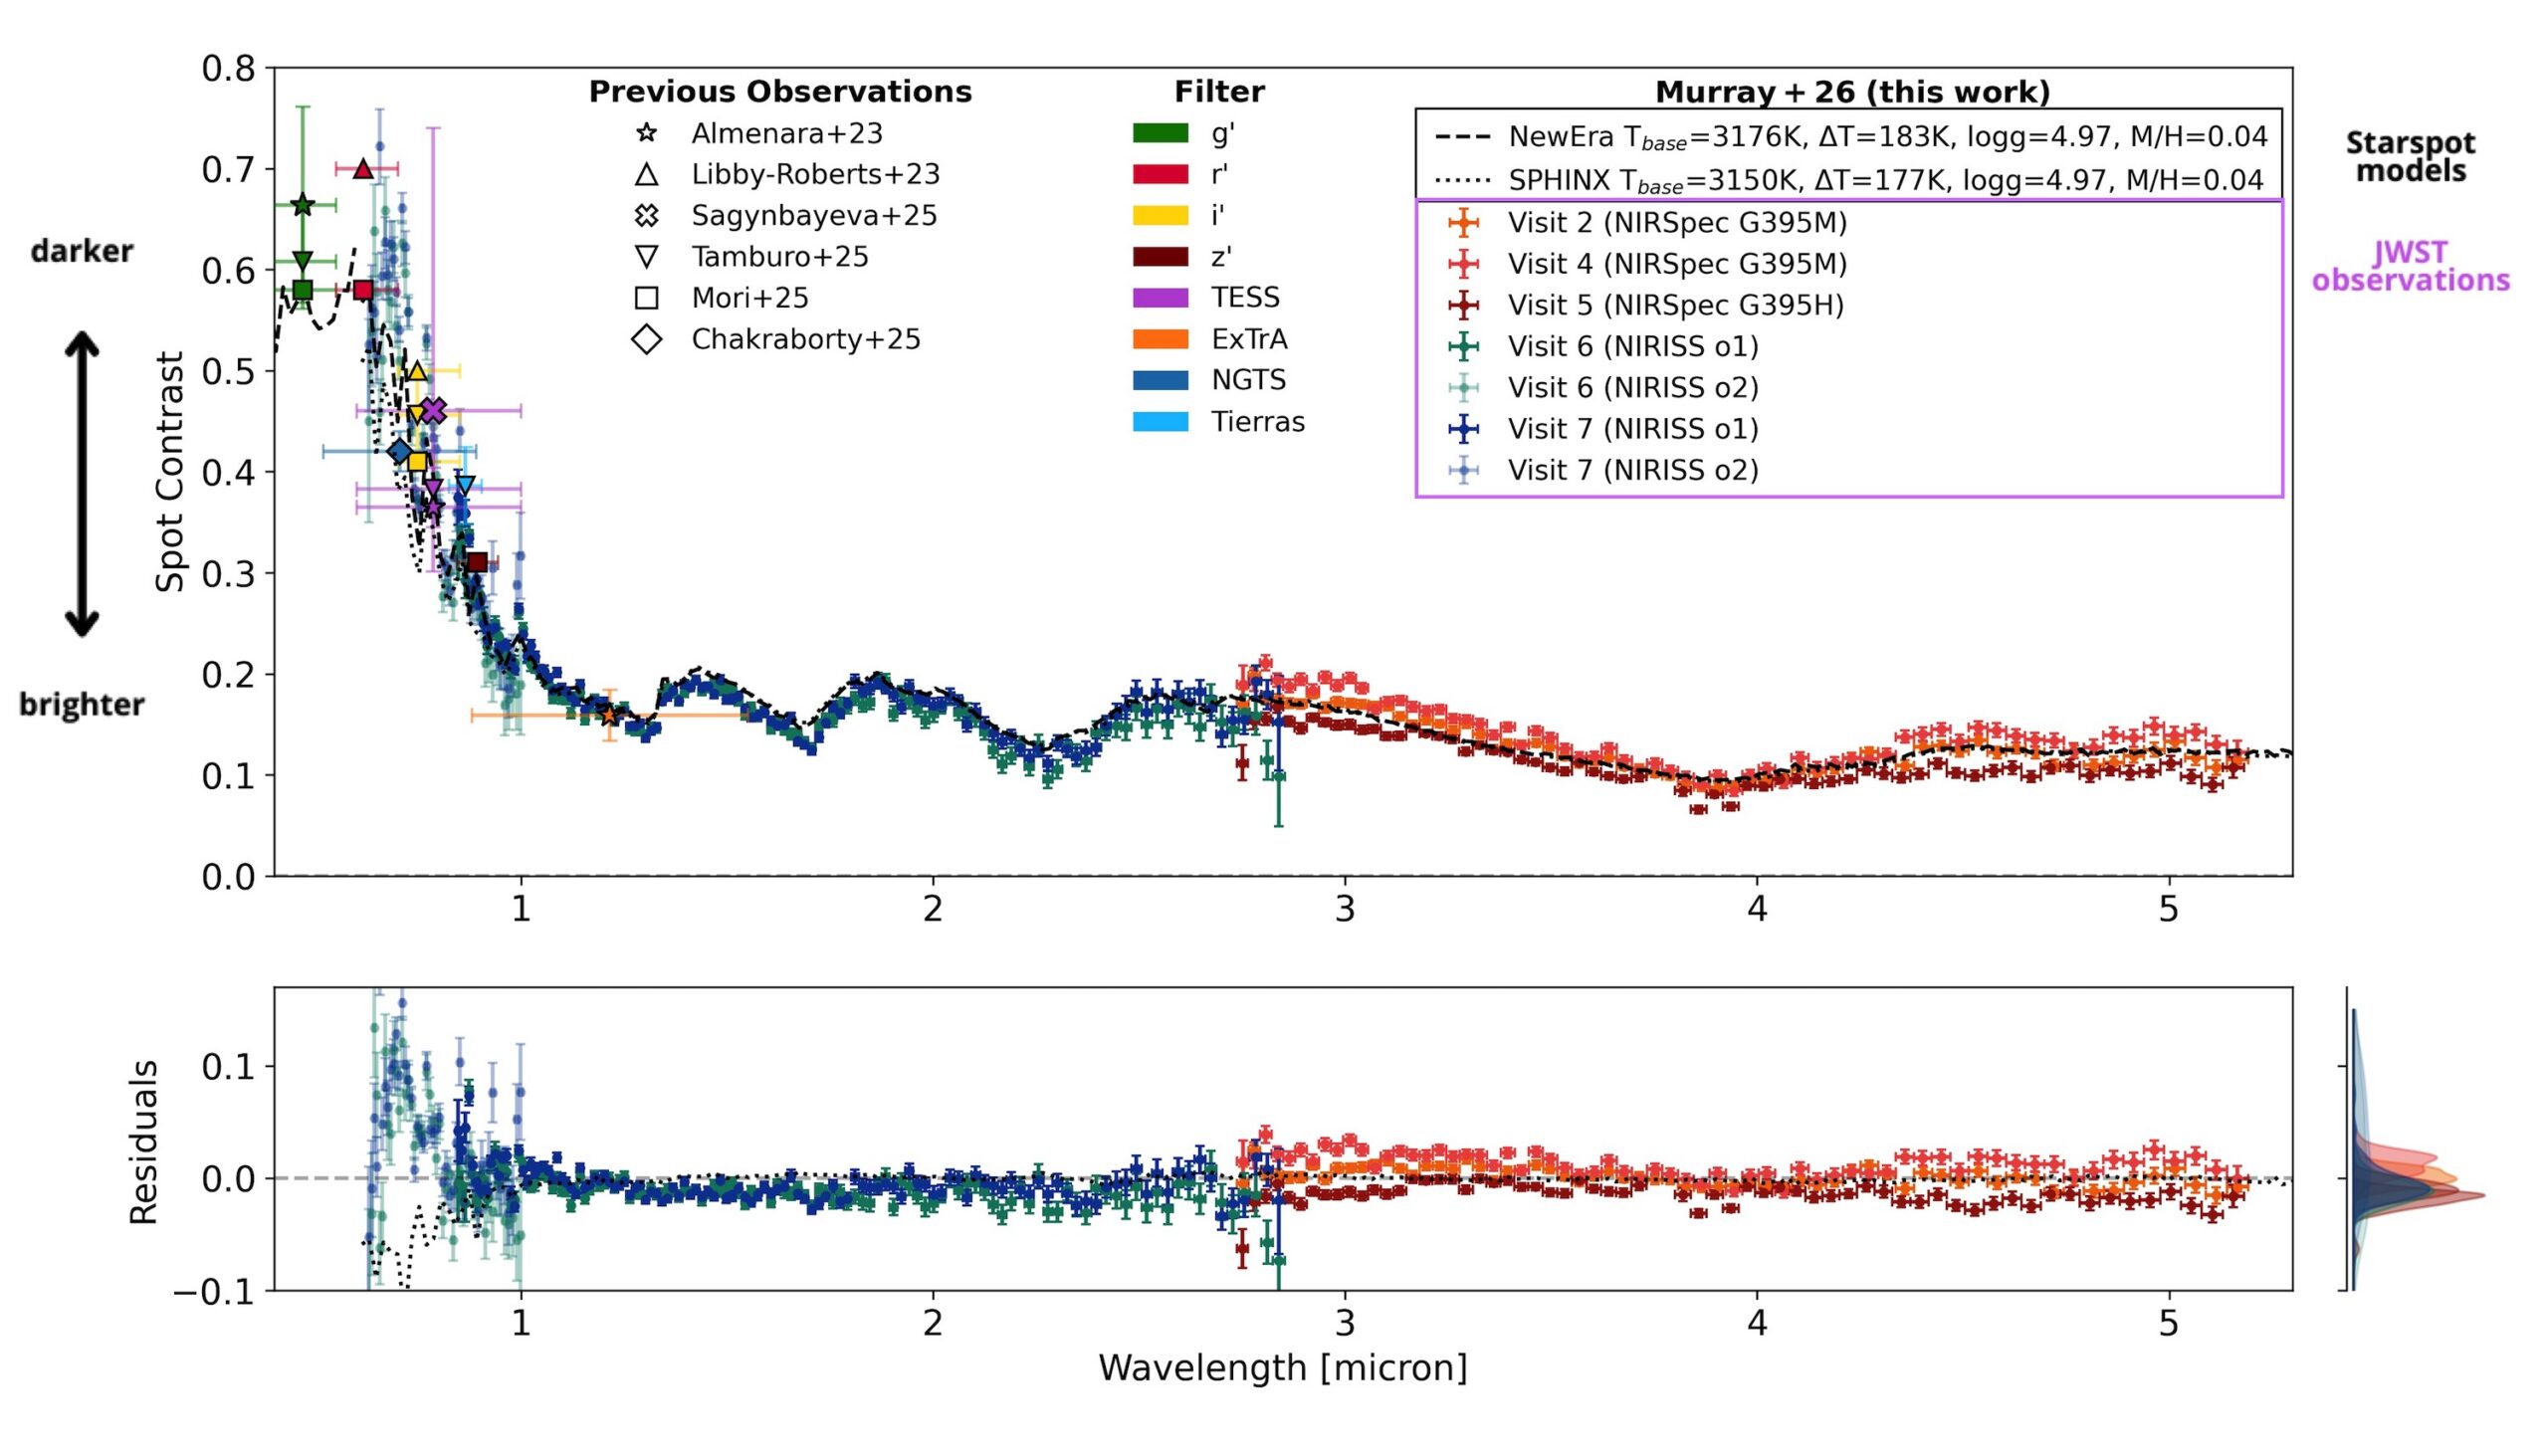
From the JWST observations, the authors extract a starspot spectrum for the first time. Figure 2 shows this as the spot contrast (how much dimmer the spot is than the surrounding stellar surface) plotted across different wavelengths. To see how well our models are doing, they compare this observed spectrum to two commonly used starspot models. The difference between the data and the models (the residual) is plotted in the lower panel.

spectrum of TOI-3884’s starspot.

Figure 2: The spectrum of TOI-3884’s starspot. The y-axis in the upper panel, the spot contrast, indicates how much dimmer the starspot is compared to the “normal” stellar surface. Different observations taken with JWST are indicated in different colored crosses, and other previous observations are overplotted in various other shapes. Model starspot spectra are shown in dashed or dotted black lines. The residuals between the model spectra and the JWST observations are shown in the bottom panel. [Adapted from Murray et al. 2026]

At wavelengths longer than about 1 micron, in the near-infrared regime, things look good! The residuals stay small, meaning the models do a solid job reproducing the observations. But move left into shorter wavelengths, in the optical regime, and the agreement quickly falls apart. The residuals grow, and it becomes clear that the models are missing something.

There’s still work to be done before we can confidently probe planetary atmospheres at optical wavelengths without worrying about stellar contamination, and this observed starspot spectrum provides a unique benchmark to test future starspot models. For now, the near-infrared remains a safer and more reliable window for planet atmosphere studies.

Original astrobite edited by Natalie Price.

About the author, Elise Koo:

I’m a PhD student at the University of Amsterdam, working to detect magnetic interactions between stars and their planets using radio and spectroscopic observations. Outside of research, I like to try out a variety of sports.

The post The First Starspot Spectrum Revealed by JWST appeared first on AAS Nova.

Predictions of Imminent Earth Impactors Discovered by LSST

2 June 2026 at 17:00
Ian Chow et al 2026 ApJ 1001 61
Simulations suggest that Rubin Observatory will discover 1–2 meter-size or larger imminent impactors each year, nearly doubling the discovery rate and providing an important set of eyes in the Southern Hemisphere.

The post Predictions of Imminent Earth Impactors Discovered by LSST appeared first on AAS Nova.

Blue Straggler in the Making: An X-Ray Active Binary in Algol Configuration

1 June 2026 at 17:00
A. H. Sheikh et al 2026 ApJL 1002 L29
Researchers have found a rare example of a blue straggler star in the process of formation, providing direct evidence for the formation of these puzzling stars through ongoing mass transfer in a binary system.

The post Blue Straggler in the Making: An X-Ray Active Binary in Algol Configuration appeared first on AAS Nova.

Featured Image: Massive Young Star Clusters, Revealed

1 June 2026 at 17:00

The Antennae galaxies are a nearby pair of interacting galaxies, shown in optical light from the Hubble Space Telescope (left) and in infrared light from JWST (right) in the image above. Between the two galaxies’ bright nuclei, there is a vast and dusty molecular cloud complex that harbors a large number of massive young star clusters — and in a recent article led by Rupali Chandar (University of Toledo), researchers have worked to pin down exactly how many clusters are embedded within the dusty whorls of the Antennae galaxies. The team used JWST to search for emission from star clusters too thickly blanketed with dust to be visible in previous observations by Hubble. They ultimately identified 45 sources, 40 of which were seen for the first time in this study. These star clusters mostly inhabit the overlap region between the two galaxies, are less than 2.5 million years old, and each contain roughly 104–106 solar masses. To learn more about how JWST’s infrared capabilities unveiled young star clusters in these interacting galaxies, be sure to check out the full article linked below.

Citation

“Nowhere Left to Hide: Uncovering All of the Massive Young Embedded Star Clusters in the Antennae with JWST,” Rupali Chandar et al 2026 ApJ 1002 64. doi:10.3847/1538-4357/ae56e8

The post Featured Image: Massive Young Star Clusters, Revealed appeared first on AAS Nova.

Dual Active Galactic Nuclei on 100 kpc Scales from the Million Quasar Catalog

29 May 2026 at 17:00
Zhuojun Deng et al 2026 ApJS 283 70
In a sample of 171 new dual active galactic nuclei, four triplets, and one quadruplet drawn from a catalog of nearly a million quasars, researchers find that roughly 16% of targets exhibit tidal features.

The post Dual Active Galactic Nuclei on 100 kpc Scales from the Million Quasar Catalog appeared first on AAS Nova.

Stacking Up the Discovery of Six Millisecond Pulsars

29 May 2026 at 17:00

Millisecond pulsar and companion artist's impression

The fastest spinning pulsars in the universe are often quite difficult to detect. Leveraging multiple observations from the largest single-dish telescope in the world, researchers have discovered six previously undetected pulsars.

Millisecond Pulsars in Globular Clusters

Globular clusters, compact collections of tens of thousands to millions of stars, are highly dense and rife with dynamical interactions. These active environments are ideal factories for the formation of millisecond pulsars — the extremely fast-spinning cores of once-massive stars, shining beams of radio emission from their poles. One way millisecond pulsars are thought to form is when a pulsar in a binary system steals mass from its companion star, transferring angular momentum and causing the pulsar to spin up. The densely packed environment in a globular cluster provides ample opportunity for a pulsar to acquire a companion to siphon.

However, millisecond pulsars in distant globular clusters are notoriously difficult to detect. Traditional pulsar searches that rely on a single observation tend to miss millisecond pulsars, many of which have signals too faint to be distinguished from noise or radio interference. Instead, researchers must rely on a different method to find these fast-spinning pulsars.

FAST

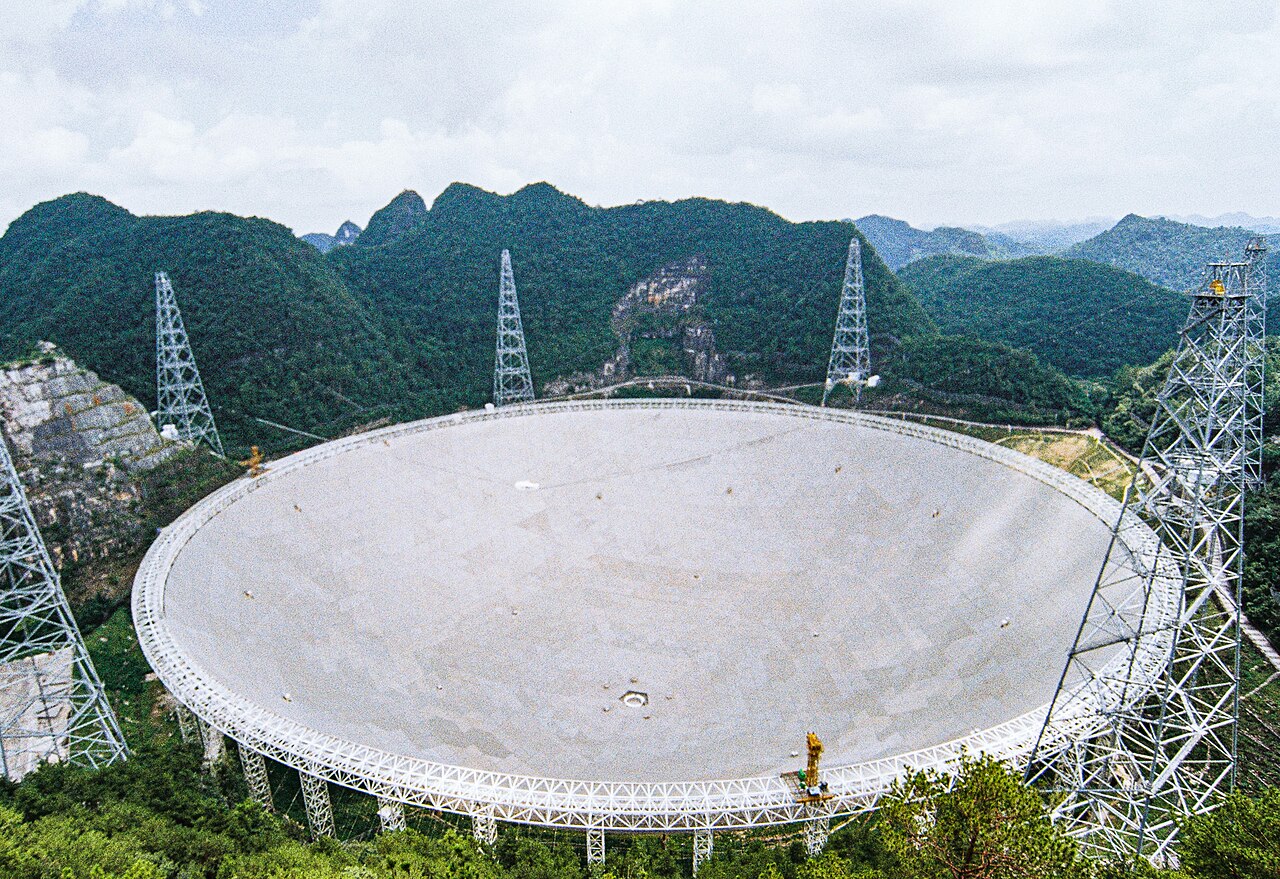
FAST, the 500-meter single-dish radio telescope located in southwestern China. [Wikipedia user SCJiang; CC BY 4.0]

Stack Search Success

To find faint millisecond pulsars, researchers have developed the stack search method, in which multiple radio observations are combined to tease out faint signals and decrease noise. Reliably stacking observations across epochs requires stability; isolated millisecond pulsars, now no longer spinning up after losing their companion, have very stable rotation periods, making them ideal targets for the stack search method. To date, the stack search method has successfully identified nine isolated globular cluster millisecond pulsars using data from the Arecibo, Parkes, and Green Bank radio telescopes.

Stack Spectra

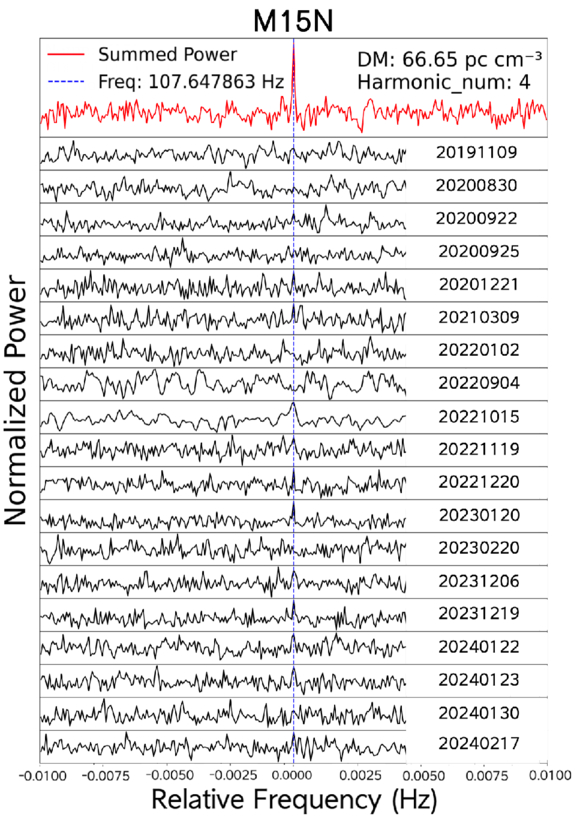
Power spectra from a discovered millisecond pulsar M15N. The black solid lines show the 19 individual observations of the pulsar, and the red solid line in the top panel shows the stacked spectrum. The stack search method pulls out a clear pulsar signal. [Dai et al. 2026]

In hopes of recovering more of these faint fast-spinning pulsars, Yinfeng Dai (Beijing Normal University) and collaborators used archival data obtained with the Five-hundred-meter Aperture Spherical radio Telescope (FAST), the world’s largest single-dish telescope. Targeting two specific globular clusters, NGC 6517 and M15, the team applied the stack search method to 23 and 19 observations of the globular clusters, respectively. From their search, the authors discovered six previously unidentified isolated millisecond pulsars: four in NGC 6517 and two in M15.

While previous studies identified brighter pulsars in the targeted globular clusters, the authors confirmed that all six newly discovered pulsars are too weak to be reliably recovered from single-epoch searches, underscoring the importance of the stack search method. In particular, this search increased the known pulsar populations of NGC 6517 and M15 by 27% and 18%, respectively, suggesting that a meaningful fraction of globular cluster pulsars are easily missed in traditional pulsar searches. Future studies employing this stack search method will continue to detect faint millisecond pulsars, unlocking this elusive population for further exploration.

Citation

“The Stack Search Tests on FAST Data: Discovery of Six Faint Isolated Millisecond Pulsars in NGC 6517 and NGC 7078 (M15),” Yinfeng Dai et al 2026 ApJL 1002 L31. doi:10.3847/2041-8213/ae5dbb

The post Stacking Up the Discovery of Six Millisecond Pulsars appeared first on AAS Nova.

Can the Dust Eclipses in WR 104 Provide Constraints on the System’s Inclination?

28 May 2026 at 17:00
Noel D. Richardson et al 2026 ApJ 1001 34
Researchers find a system inclination of 41.8 degrees for WR 104; this result is at odds with previous interpretations of the system’s dust plume, but a new geometric model reconciles these results.

The post Can the Dust Eclipses in WR 104 Provide Constraints on the System’s Inclination? appeared first on AAS Nova.

The Cosmic-Ray Knee as a Local Signature of Nearby PeVatrons

27 May 2026 at 17:00
Ke Fang and Francis Halzen 2026 ApJL 999 L13
The observed steepening of the cosmic-ray spectrum at ~4 PeV could be a global or local feature; a local feature could be explained by sources located ~1 kpc away with ages of 0.1–1 million years.

The post The Cosmic-Ray Knee as a Local Signature of Nearby PeVatrons appeared first on AAS Nova.

Third Star’s the Charm: Most Merging Black Holes Might Be in Triple Systems

27 May 2026 at 17:00

Illustration of merging black holes

Where do black hole mergers happen? Recent research finds evidence that most black hole mergers occur in triple systems containing a close inner binary and a more distant third party.

Assembling Merging Black Holes

Thanks to the combined efforts of the LIGO, Virgo, and KAGRA gravitational wave detectors, we’ve now collected the subtle signals from several hundred pairs of merging stellar-mass black holes. As this collection of spacetime ripples continues to grow, researchers are seeking to understand how these merging black hole pairs were assembled.

In the simplest scenario, pairs of high-mass stars independently evolve into black holes, lose momentum by emitting gravitational waves, and meld into one another. But the population of merging black holes likely contains contributions from multiple sources, including multiple-star systems, the disks surrounding accreting supermassive black holes, and black holes that have already experienced a merger. Which of these merging populations is reflected in our catalog of gravitational wave events?

Modeling Challenges

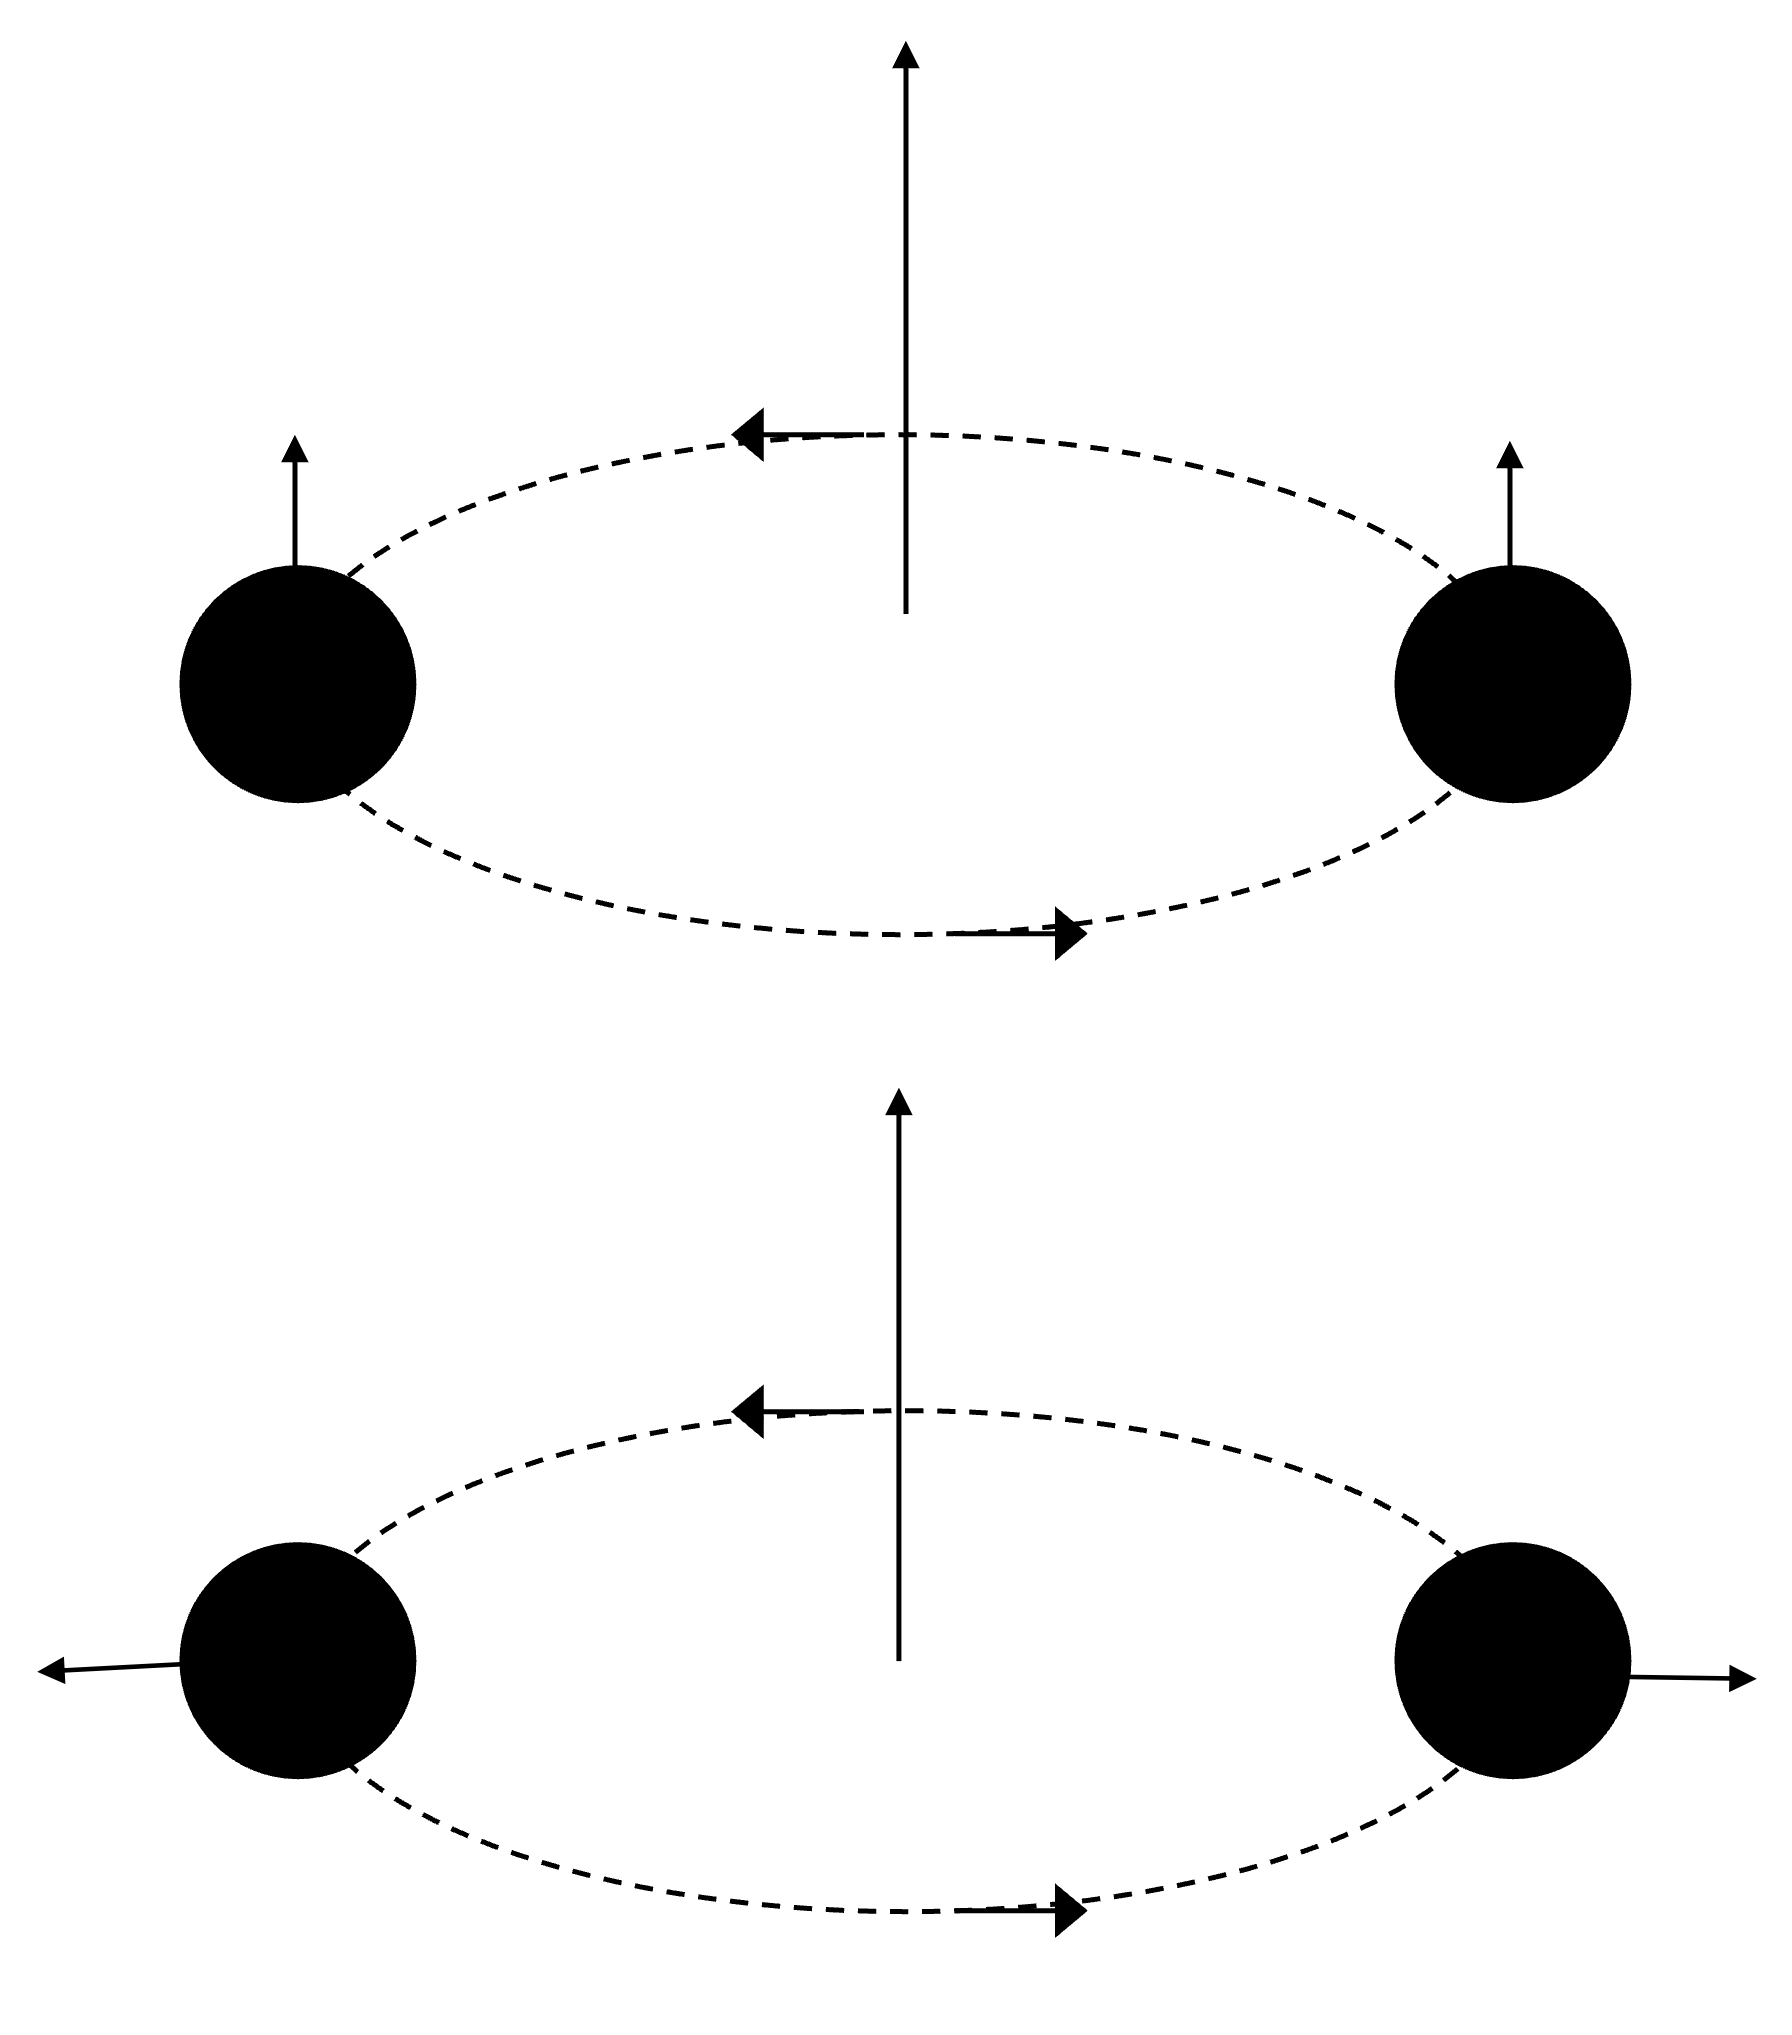
spin–orbit tilt diagram

A black hole binary system with aligned spins and orbit (top) and a binary with spins tilted by 90 degrees (bottom). [AAS Nova/Kerry Hensley]

In theory, this question can be answered by extracting the properties of merging black holes — mass, spin, and the like — from gravitational wave observations and comparing these properties against model predictions from different formation pathways. In reality, this is exceedingly difficult, as certain merger pathways can produce a wide variety of results, depending on assumptions or fine tuning.

So far, the increasingly large pool of gravitational wave detections tentatively points to a feature that could illuminate the sites of black hole mergers: a peak in the spin–orbit tilt distribution around 90 degrees. This feature has been most confidently extracted from nonparametric analyses, which do not make assumptions about the population of merging black holes, but it has also been hinted at in parametric analyses, which do make population-level assumptions.

Triple-System Feature

To investigate this feature further, a team led by Jakob Stegmann (Max Planck Institute for Astrophysics) performed a new, astrophysically motivated parametric analysis of the most recent catalog of gravitational wave detections from LIGO, Virgo, and KAGRA.

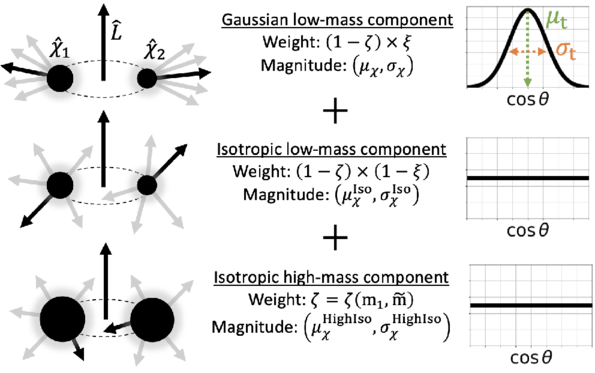
black hole populations used in modeling the observed spin–orbit tilt distribution

The three populations in the team’s modeling. [Stegmann et al. 2026]

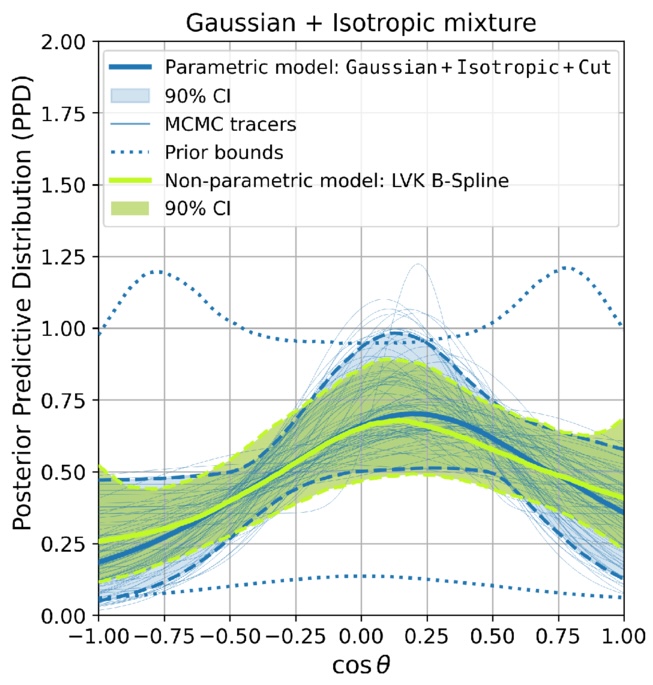
Their modeling tests combinations of multiple populations, including mergers in isolated binary systems, triple-star systems, and dense environments like star clusters. They also include a potential contribution from higher-mass mergers involving black holes that have merged previously. Using this framework, Stegmann’s team found that the observed spin–orbit tilt distribution is best matched by a model dominated by mergers in triple-star systems, with some contribution from other sources.
Posterior predictive distribution of black hole spin–orbit tilts

Posterior predictive distribution of black hole spin–orbit tilts. Both the authors’ modeling (solid blue line) and the nonparametric modeling performed by the LIGO–Virgo–KAGRA collaboration (solid green line) find evidence for a peak in the spin–orbit tilt distribution near cosθ = 0. [Adapted from Stegmann et al. 2026]

Specifically, this finding suggests that most mergers occur in hierarchical triple systems, which naturally predict an excess of 90-degree spin–orbit tilts without any fine tuning. Hierarchical triples contain an inner close binary with a distant outer companion; in these systems, relativistic spin precession, gravitational wave emission, and oscillations in eccentricity and inclination work to tilt the black holes in the inner binary by 90 degrees.

Stegmann and collaborators pointed out that the triple-system scenario aligns well with other properties of the observed population of black hole mergers, such as the mass and effective spin distributions. This scenario may also be necessary to explain certain merging pairs that might have had slightly eccentric orbits at the moment of merging. If future gravitational wave observations strengthen the evidence for a peak in the spin–orbit tilt distribution near 90 degrees, it will have profound implications for how and where black holes merge in our universe.

Citation

“Gravitational-Wave Observations Suggest Most Black Hole Mergers Form in Triples,” Jakob Stegmann et al 2026 ApJL 1000 L59. doi:10.3847/2041-8213/ae52ec

The post Third Star’s the Charm: Most Merging Black Holes Might Be in Triple Systems appeared first on AAS Nova.

Life on the (Red) Edge

26 May 2026 at 17:00

Earth in visible and near-infrared light

Editor’s Note: Astrobites is a graduate-student-run organization that digests astrophysical literature for undergraduate students. As part of the partnership between the AAS and astrobites, we occasionally repost astrobites content here at AAS Nova. We hope you enjoy this post from astrobites; the original can be viewed at astrobites.org.

Title: Retrieving the Red Edge on Earth-Like Planets with Heterogeneous Clouds and Surfaces
Authors: Zachary Burr et al.
First Author’s Institution: Jet Propulsion Laboratory; ETH Zurich
Status: Published in ApJ

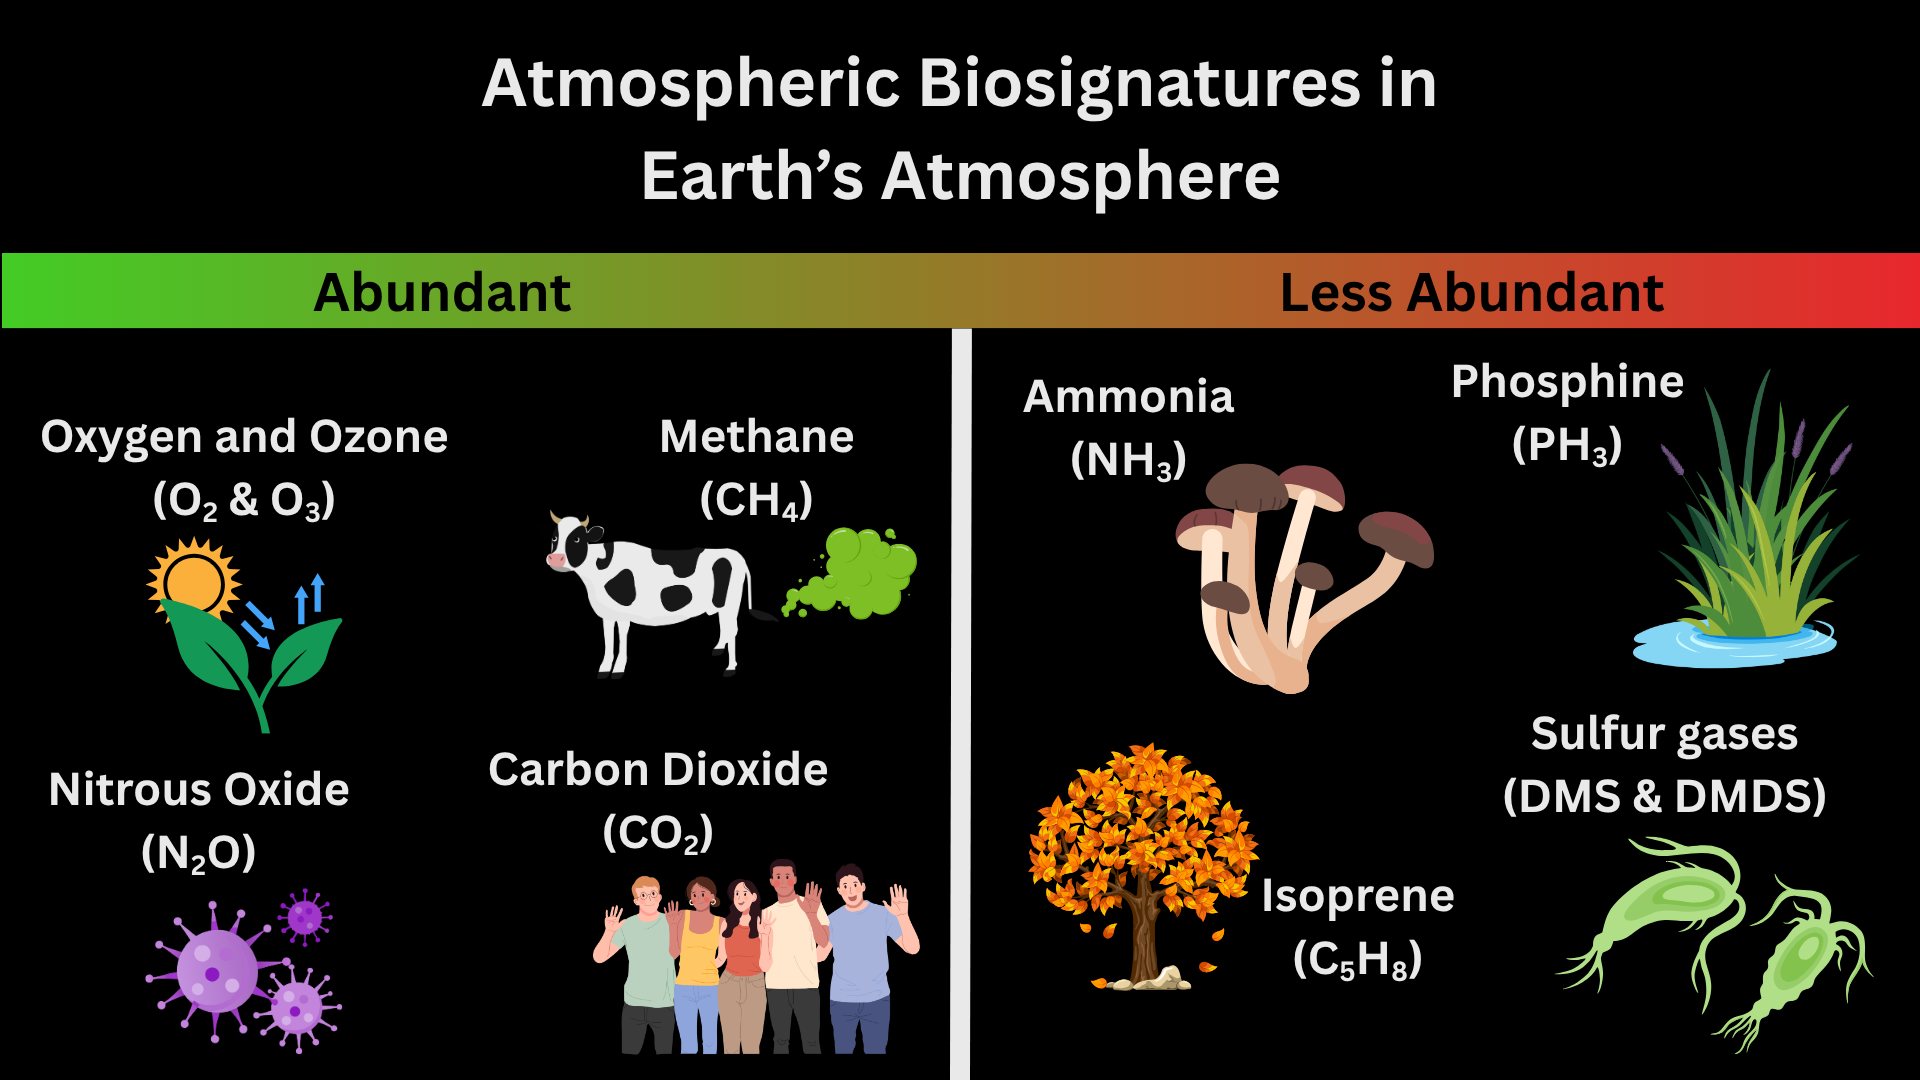
In the next 25 years, astronomers could find signs of life on other planets with the launch of the Habitable Worlds Observatory. Atmospheric signs of life, known as atmospheric biosignatures, are how astronomers currently search for life on other planets. Figure 1 shows examples of atmospheric biosignatures with pictures of each chemical’s origin on Earth. Before E.T. can phone home, though, we have to understand what chemicals make up a planet’s atmosphere. To do this, astronomers can use spectroscopy to observe a planet’s atmosphere in different wavelengths and measure the types and quantities of chemicals present.

biosignatures in Earth's atmosphere

Figure 1: Atmospheric biosignatures present in Earth’s atmosphere. More abundant biosignatures include oxygen and ozone (byproducts of photosynthesis in plants and bacteria) and nitrous oxide (byproduct of bacteria that don’t need oxygen to survive). Less abundant biosignatures include isoprene (released from the breakdown of leaves that have fallen from trees) and sulfur gases (byproducts of cyanobacteria). [Kaz Gary]

There are many ways to observe the spectrum of a planet, but the one you’re probably most familiar with is transmission spectroscopy. You can learn more about transmission spectroscopy of exoplanet atmospheres and how to model transmission spectra with these bites: 1, 2, 3. However, all of the current techniques for exoplanet spectroscopy (including transmission spectroscopy) measure the star’s light and how the planet affects the star’s light. This means it’s heavily dependent on how we model the star’s light to indirectly observe the planet’s light. The only way to take the spectrum of a planet directly is with direct imaging: the technique that the future Habitable Worlds Observatory will use to find signs of life in planetary spectra.

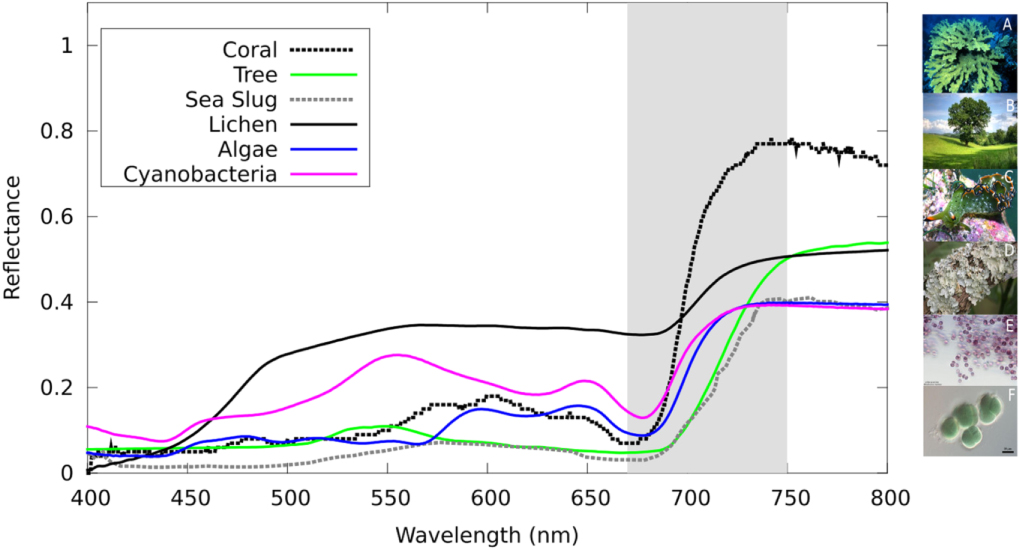
But are atmospheric biosignatures the only way to tell if life exists on other planets? Short answer: absolutely not. Let’s take Earth as an example. If we imagine Earth as a directly imaged exoplanet and take spectra of the light it reflects, you’ll find that around near-infrared wavelengths (~700 nanometers or just past the red part of the visible light spectrum), the light reflected off of Earth increases sharply. This sharp increase is called the vegetation red edge and is caused by plant and ocean life on Earth’s surface as shown in Figure 2. This is made possible because chlorophyll (the thing that makes plants green) absorbs nearly all visible light but reflects near-infrared light. The vegetation red edge is an example of a surface biosignature. In today’s article, the authors determine if the vegetation red edge will be visible in spectra of Earth-like exoplanets!

Spectra of different sources of the vegetation red edge

Figure 2: Spectra of different sources of the vegetation red edge on Earth. The vegetation red edge is highlighted in gray where the spectra rapidly increase and then level off beyond the visible light part of the spectrum. Each color represents a different source with pictures of each source on the right-hand side of the plot. [O’Malley-James and Kaltenegger 2019]

Snapshots

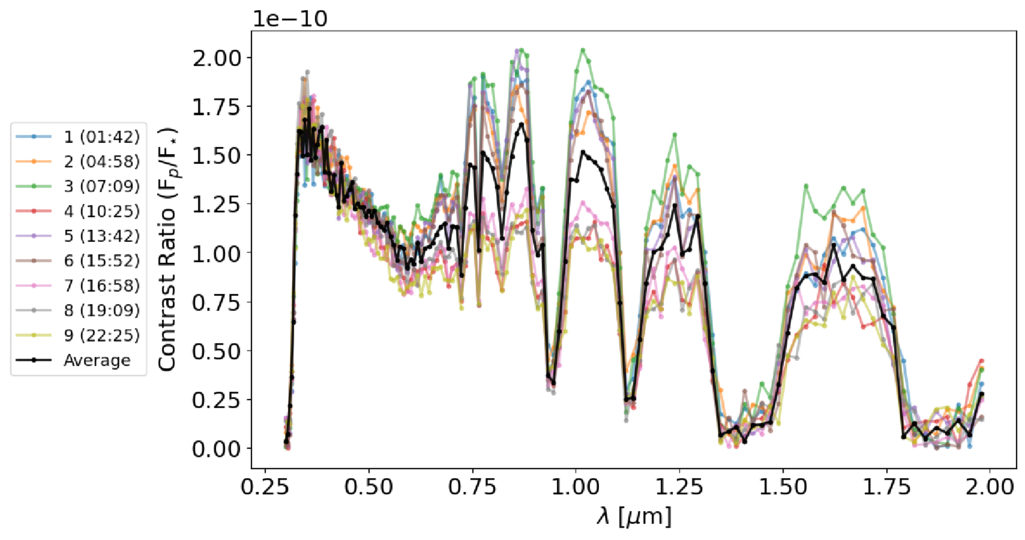
Planets rotate; that’s how we have morning, noon, and night in 24 hours guaranteed. This means that different parts of the surface will be visible at different times when we take spectra. Sometimes, we may see more ocean than land, other times not. To determine if the vegetation red edge would be visible at all points in Earth’s day, the authors simulated nine different spectra of modern-day Earth representing nine snapshots of Earth’s rotation. Additionally, they also simulated a time-averaged spectrum that shows an entire Earth day in one snapshot without the time variability. These spectra are shown in Figure 3.

Spectra of a directly imaged modern-day Earth at nine different times in its rotation

Figure 3: Spectra of a directly imaged modern-day Earth at nine different times in its rotation. The y-axis is the ratio of the planet’s signal to the star’s signal and the x-axis is wavelength in microns. Each color represents a time in UTC and the black curve represents the time-averaged spectrum. [Burr et al. 2026]

The authors then run retrieval models on all nine spectra to see if the vegetation red edge would be detectable in each spectrum, including the time-averaged one. Retrieval models take into account characteristics of the planet that would affect how light moves through its atmosphere, such as the atmospheric chemicals present and the surface gravity. They then use this information to generate possible spectral models that could fit the data. The best-fit model allows astronomers to infer what the atmosphere is made of and properties of the planet such as surface gravity. Because we are looking at Earth in visible light, much of the light from the planet is reflected. Typically, models of Earth-like planets in visible wavelengths only include atmospheric albedo: the measure of how reflective a planet’s atmosphere is. However, surface biosignatures can also be reflective as shown by the vegetation red edge. The authors use this to their advantage and introduce a surface albedo into their model that changes with the amount of desert, vegetation, and ocean visible on Earth’s surface at that time. They then further divide the nine spectra into three different types based upon the visible surface: majority land; 50% land, 50% ocean; and majority ocean. Check out the article online to see a cool animation of the Earth rotating and how the spectrum looks different at each time!

Arr! There Be… Vegetables?

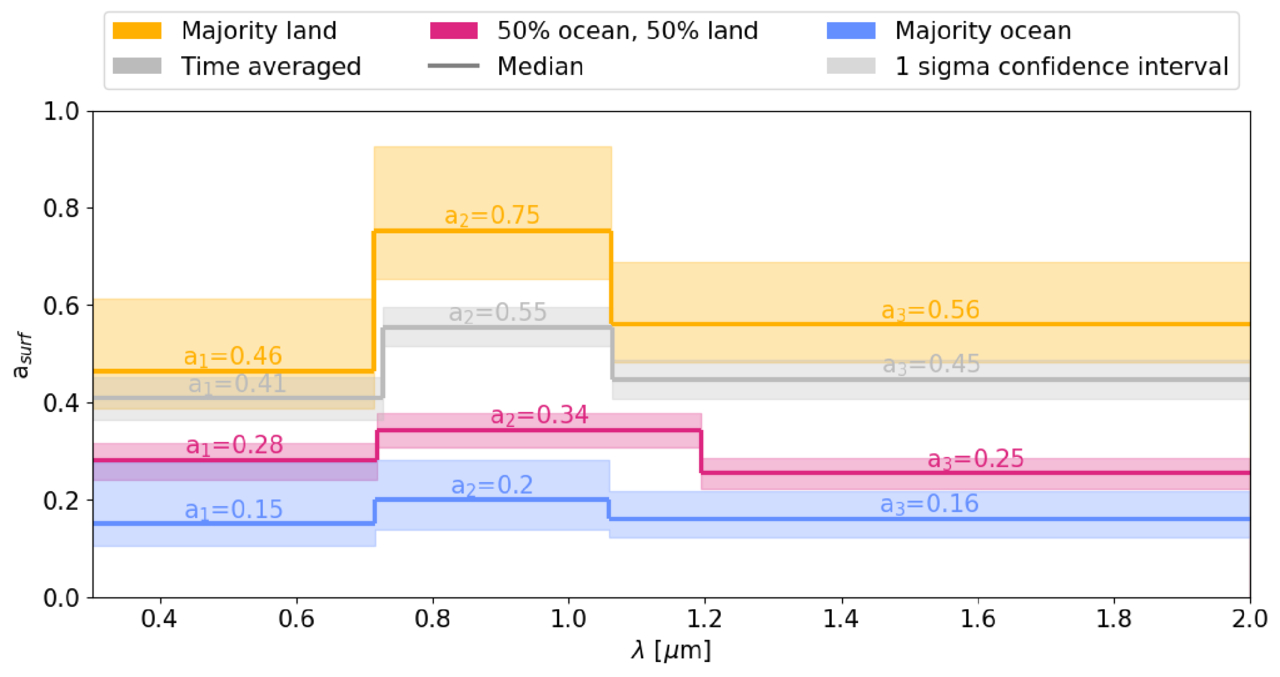
After running the models, the authors were able to detect a sharp increase in the surface albedo value in every spectrum, including the time-averaged one. This result is shown in Figure 4. The authors take this result one step further in order to validate that the vegetation red edge is actually a result of surface variation of vegetation. They re-run models on each of their spectra but instead include a constant surface albedo instead of a time-varying one. This resulted in incorrectly measured radii, chemicals, and surface gravity in nearly all of the models. Without the vegetation red edge and surface features, the models could not accurately determine if life was present on Earth.

Retrieved surface albedos for the nine time-varying spectra

Figure 4: Retrieved surface albedos for the nine time-varying spectra. The surface albedo is broken down into three different values (a₁, a₂, a₃). Each of these values represents a change in the surface albedo at different wavelengths (i.e., how reflective the surface is at three different wavelengths). The nine spectra were broken down by the amount of surface that was visible at that time and color-coded for each category. The time-averaged spectrum is shown in gray. Each category of spectra was able to retrieve an increase in reflected light from the surface at vegetation red edge wavelengths. The spectra that had the majority land visible have the biggest increase in the surface albedo. This makes sense since the amount of visible vegetation is the largest with majority-land planets. [Burr et al. 2026]

For the first time (to the author’s knowledge), the vegetation red edge has been shown to be a promising and observable biosignature in Earth-like atmospheres. This study has also laid the groundwork for future work on other surface biosignatures and their potential impact on spectra of habitable planets. Confirming signs of life in multiple different ways, both on the surface and in the atmosphere, will finally allow astronomers to say we are not alone in the universe. In fact, life likes to live on the (red) edge!

Original astrobite edited by Madison VanWyngarden.

About the author, Kaz Gary:

I am a fourth-year PhD candidate at The Ohio State University with a passion for planets. My current work focuses on modeling exoplanet observations for the Habitable Worlds Observatory and understanding planetary atmospheres. Outside of research, I help develop planetarium shows and love all forms of science communication. In my free time, I enjoy playing tabletop RPGs, painting, watching terrible reality TV, and hanging out with my pet hedgehog.

The post Life on the (Red) Edge appeared first on AAS Nova.

Optical Survey for Cislunar Moving Objects Using Image Stacking

26 May 2026 at 17:00
Rongyu Sun et al 2026 AJ 171 247
Using three dedicated telescopes and two spacecraft in the Earth–Moon environment, researchers demonstrate the abilities of an image stacking method to detect space debris.

The post Optical Survey for Cislunar Moving Objects Using Image Stacking appeared first on AAS Nova.

Variability of Europa’s Optical Aurora on Orbital and Multiyear Timescales

22 May 2026 at 17:00
Zachariah Milby et al 2026 Planet. Sci. J. 7 60
Analysis of 10 nights of observations of Europa’s auroral emission suggests that optical auroral brightness may be a proxy for electron density variations, assuming a stable atmospheric composition and density.

The post Variability of Europa’s Optical Aurora on Orbital and Multiyear Timescales appeared first on AAS Nova.

Playing Pool with Planets

22 May 2026 at 17:00

artist's impression of hot Jupiter exoplanets

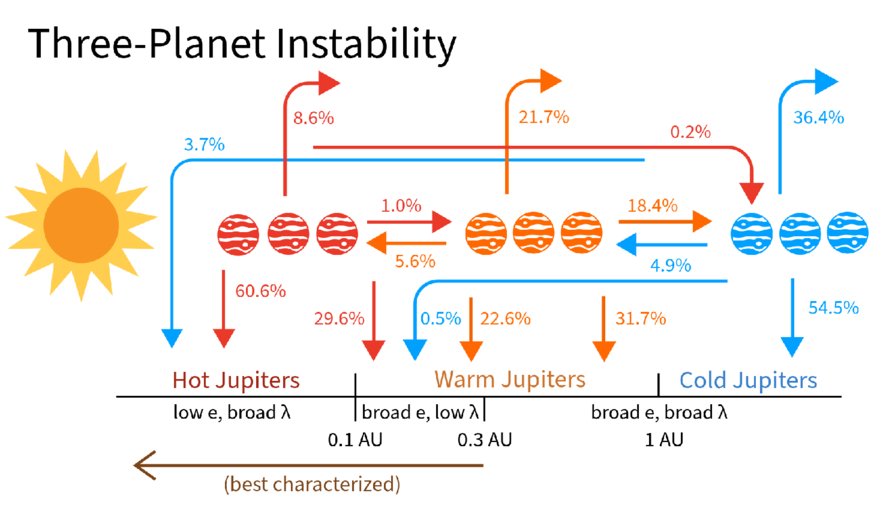
Each Jupiter-size planet in the galaxy falls into one of three distinct categories: hot, warm, or cold. A new study suggests that despite the apparent differences between these populations, they may have all formed from the same underlying dynamical process: a game of pool played at planetary scales.

A Diversity of Jupiters

Though our solar system has only one Jupiter-size planet, elsewhere in the galaxy we have found three different species of these massive gas giants. Cold Jupiters closely resemble their namesake and orbit far from their host stars; hot Jupiters are the opposite and are found whipping around their stars on extremely close-in orbits. In between these are the warm Jupiters, which tend to orbit in the intermediate space between 0.1 and 1.0 au.

A rendering of a star with lots of spots and flares with a planet in the foreground.

An artist’s depiction of a hot Jupiter. These planets orbit extremely close to their host stars, but likely got to their locations by scattering inward from more distant orbits. [NASA/JPL-Caltech]

Though these three populations are defined by their orbital distances, they differ from each other in other ways as well. For example, hot Jupiters almost never have nearby companions; if there are any other planets circling the same star, they’re usually far-out cold Jupiters. They can also orbit in pretty much any direction, including opposite the direction of their star’s spin, and are usually on perfectly circular orbits. In contrast, warm Jupiters often have friends nearby, are much more aligned with their stars’ spins, and can have modest eccentricities.

Given these differences, it’s often thought that each of these populations arrived at its current location through different dynamical processes and that the history of the warm Jupiters is likely quite different from the history of the hot Jupiters. However, a new study led by Julia Esposito (Georgia Institute of Technology) has proposed an alternative view. Maybe these populations, though they appear different now, were all created by the same process: planet–planet scattering.

Virtual Planetary Billiards

A cartoon of Jupiters at different distances from the sun with labelled arrows flowing inwards and outwards from each.

A schematic showing where different planets ended up as a function of where they scattered from during their evolution. Click to enlarge. [Esposito et al. 2026]

Esposito and collaborators set up 1,500 virtual planetary systems with three massive planets each, then simulated how the orbits evolved before probing the final configurations. In crucial contrast to previous simulation studies, the team initialized their Jupiters across a range of different distances and included the effects of tides sapping energy from orbits of planets that got too close to their host stars.

At the end of the simulation, the team surveyed the digital carnage. Almost every virtual system ended with only two planets after either ejecting one away from the star or having two planets collide. But, remarkably, the remaining two-planet systems looked tantalizingly similar to what we actually observe, with a mix of hot, warm, and cold Jupiters. Even more exciting, the end populations were highly correlated to where the violent scattering event took place.

For example, the warm Jupiters were almost all produced by “warm scattering” simulations, where the scattering took place between 0.1 and 1.0 au. The planets that survived the simulations and ended up as warm Jupiters matched all of the properties of the real warm Jupiter population: they had nearby companions, were moderately eccentric, and were mostly aligned with their stars. The hot Jupiters, meanwhile, were almost all produced by “cold scattering” events where the flybys happened far from the star and resulted in one planet hurtling inwards. These also matched all of the observed properties of real hot Jupiters.

The researchers concluded that planet–planet scattering can produce both the warm and hot Jupiter populations so long as you let the planets scatter from a variety of different distances. This exciting theoretical insight, if correct, would mean that astronomers could stop searching for different pathways to create each population. Happily, this model also provides testable predictions, and the authors lay out how the theory could be supported or disproven with additional data. Through virtual experiments like these, astronomers continue to build up an understanding of how the wide range of planetary architectures observed across the galaxy came to be.

Citation

“Unified Formation Channel of Hot and Warm Jupiters via Planet–Planet Scattering,” Julia Esposito et al 2026 ApJL 1003 L3. doi:10.3847/2041-8213/ae61b0

The post Playing Pool with Planets appeared first on AAS Nova.

Late-Blooming Magnetars: Awakening as Long-Period Transients After a Dormant Cooling Epoch

21 May 2026 at 17:00
Arthur G. Suvorov et al 2026 ApJ 1000 55
Magnetothermal modeling suggests that neutron stars may remain “silent” at radio frequencies for approximately 100,000 years before activating, potentially as long-period radio transients.

The post Late-Blooming Magnetars: Awakening as Long-Period Transients After a Dormant Cooling Epoch appeared first on AAS Nova.

HD 164604 c: A Second Giant Planet on a 15 Yr Orbit and Constraints on the Planet–Planet Mutual Inclination

20 May 2026 at 17:00
Guang-Yao Xiao et al 2026 AJ 171 209
A newly discovered massive giant planet likely has a retrograde orbit relative to the other known planet in the system, pointing to a potentially violent dynamical history.

The post HD 164604 c: A Second Giant Planet on a 15 Yr Orbit and Constraints on the Planet–Planet Mutual Inclination appeared first on AAS Nova.

❌