Most people think of Mars as a big red dustball, but researchers recently found Martian mineral deposits suggesting it was once warm and humid. The team used the Compact Reconnaissance Imaging Spectrometer aboard NASA’s Mars Reconnaissance Orbiter to analyze specific wavelengths of visible and near-infrared light from minerals on Mars’s surface to determine their chemical composition from afar.
Past researchers identified layered silicate minerals, called clays, across the Martian surface. Clays form when water interacts with rock, and record the amounts and chemical compositions of the waters that formed them. As water interacted with Martian surface rocks, it picked up more mobile elements like magnesium and iron and carried them to lower depths in the Martian soils, while less mobile elements like aluminum stayed in place. This process, called leaching, created 2 distinct layers of clays in the Martian rocks.
Scientists have proposed 2 main hypotheses for how these layered clays formed on Mars. The first is that they formed through underwater leaching in pools or lakes sometime in Mars’ past. The second is that they formed across the Martian surface, where a widespread humid environment provided the moisture needed to leach them.
To evaluate these hypotheses, a team led by researchers at Purdue University recently estimated the “true” thicknesses of Martian clay layers with a method scientists had previously only used on Earth. Rock layers containing clays can become tilted, making them appear thicker or thinner than they actually are. To address this discrepancy, the team used the High Resolution Imaging Science Experiment (HiRISE) tool on the Mars Reconnaissance Orbiter to create high-resolution elevation maps of the Martian surface. Then they combined these maps with surface composition data from the Compact Reconnaissance Imaging Spectrometer to create 3D composition maps.
Using the 3D composition maps, the researchers found where each clay layer was exposed at the surface and traced it underground to estimate an angle of tilt. They then used trigonometry to calculate the true thicknesses of each clay layer. They analysed 46 regions across the Martian surface, and found that the combined thickness of both clay layers was around 20 to 680 feet (6 to 200 meters), with an average of about 190 feet (60 meters). That’s a maximum thickness as high as a 60-story building!
Next, the researchers tested the extent of the clay deposits in a large ancient Martian valley known as the Mawrth Vallis Region. They focused on this region because it had large elevation changes, and scientists in the past had already collected high-resolution chemical composition and elevation data there.
They explained that if the clay layers were restricted to the lowest parts of the valley where water once existed, and had changing thicknesses and boundaries between layers, this would provide strong evidence in favor of the “underwater leaching” hypothesis. In contrast, if the clay layers were more widespread, with consistent layer boundaries and thicknesses, this would provide strong evidence of a humid surface environment, in favor of the “surface leaching” hypothesis.
The researchers found that the clay layers extended beyond the lowest parts of the valley and had consistent layer boundaries across more than half a mile (about a kilometer) of elevation change. Thus, they concluded that the clay layers formed by surface leaching in a humid environment.
These findings conflict with climate models of early Mars, which generally suggest that the Martian surface rarely got above freezing temperatures. To address this discrepancy, the team proposed that these deposits could have formed over a long period of time rather than in a consistently warm and wet environment. If the surface was frozen most of the time, but got above freezing in short bursts, these clay deposits could still have formed, just over a much longer time period. In this case, the Mars climate models and the researchers’ findings would agree.
The researchers acknowledged that their study has some limitations, particularly regarding the sparse sample locations. Though they found strong evidence for a widespread humid environment on early Mars, more in-depth studies of locations like Mawrth Vallis could better constrain the specific surface environmental conditions under which these clays formed and potentially reconcile their data with Martian climate models.
The years 2023 and 2024 were the warmest on record, coinciding with a powerful Pacific climate event known as El Niño. El Niño is the warm phase of a natural climate cycle in which surface waters in the eastern Pacific are unusually warm, bringing record-breaking heatwaves in the Amazon and heavy rainfall in the southern USA. Its counterpart, La Niña, is the cool phase that brings wetter conditions to the Northern USA.
In a typical El Niño, warm water in the eastern Pacific weakens the winds blowing westward across the tropical Pacific, known as trade winds, allowing more warm water to flow eastward – a self-reinforcing cycle that amplifies the event. However, the 2023 El Niño differed because the ocean warmed intensely, but the trade winds remained strong. Researchers from the Scripps Institution of Oceanography, led by Qihua Peng and Shang-Ping Xie, recently investigated how and why this unusual event occurred.
First, the researchers tracked how air pressures changed across the Pacific during the event using a metric calculated by NOAA, known as the Southern Oscillation Index. When the eastern Pacific warms during an El Niño, the difference in air pressure across the Pacific typically decreases. In 2023, they found that temperatures in the eastern Pacific rose to more than 3°F (2°C) above normal, yet the drop in air pressure was only about 31% as strong as they expected. They also calculated that changes in wind speed and direction could only account for about 30% of the warming. So why was the 2023 El Niño so strong?
To answer this question, the research team then looked beyond the Pacific, analyzing sea surface temperatures from NOAA satellite data. They found that the North Atlantic and Indian Oceans also experienced record-breaking heat in 2023, with temperatures in the North Atlantic exceeding 2°F (1°C) above normal – the warmest in recent history. This suggested that El Niño events can develop in response to ocean conditions worldwide, not just those in the Pacific.
Next, the team used a computer program that simulates how the atmosphere responds to ocean temperatures, called the Community Atmosphere Model, to examine how heat from other oceans affects the Pacific. They found that heat in the North Atlantic and Indian Oceans generated large columns of hot air rising over those regions. This air cooled at high altitudes and then sank over the central Pacific, strengthening a large-scale loop of rising and sinking air that drives trade winds westward. Strengthening this circulation worked against El Niño by keeping trade winds blowing westward about 30% more strongly than Pacific warming alone would have. If the trade winds remained strong, why was the eastern Pacific so warm in 2023?
To answer this question, the researchers studied 3 consecutive La Niña years between 2020 and 2023, analyzing ocean temperature and sea level data from NOAA’s Global Ocean Data System. During those years, strengthened trade winds transported heat into the western Pacific. As the seawater got warmer, it expanded, a process known as thermal expansion. Over those 3 years, thermal expansion and constant wind created a “pile” of warm water in the western Pacific, which reached its highest level of stored heat since 1982. When the trade winds eventually relaxed as La Niña faded, this piled-up warm water surged eastward, setting the stage for the El Niño event.
To test whether this stored heat alone could drive an El Niño, the team used a computer program that models oceanic and atmospheric interactions, called a coupled general circulation model. They input observed ocean temperatures from April 1, 2023, when La Niña ended, but removed all wind changes after that date. Their model successfully reproduced 87% of the warming observed between June and December 2023, which suggested that trade winds contributed just 13%. Stored heat was carried eastward by massive underwater waves traveling along the equator. As these waves reached the Eastern Pacific, they pushed cold water deeper, allowing surface water to warm. The researchers concluded that this oceanic process drove the 2023 El Niño to develop without the usual wind-driven feedback.
The team suggested that in a warming world, large heat reservoirs in the western Pacific will likely become more common, leading to more frequent strong El Niños. However, because their analysis focused on a single event, it remains unclear how often El Niños develop through oceanic processes alone. Ultimately, their study showed that the ocean can be more than a passive partner in El Niño – it can be the driving force.
A new Australian initiative is sending Year 9-12 students to one of the most extreme scientific environments on Earth, and asking them to contribute to real research while they’re there. For most students,...
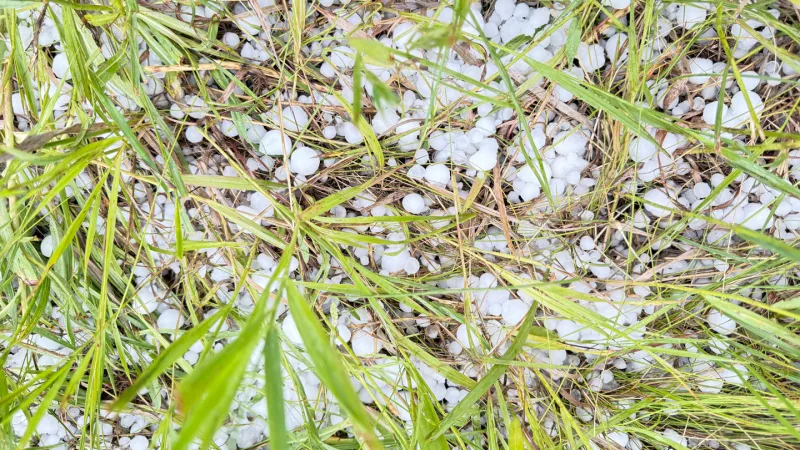
The amount of moisture in soil – and the way this moisture is distributed – combined with wind patterns in the lowest few kilometres of the atmosphere can influence where thunderstorms begin and how they develop. This new finding, from researchers at the UK Centre for Ecology and Hydrology (UKCEH) could help in the development of new early warning systems for such events, which are increasing worldwide and becoming more intense and dangerous as the climate warms.
Thunderstorms can develop quickly on hot afternoons, sometimes in less than half an hour of clouds building up, but predicting where they originate can be difficult.
A team of researchers led by meteorologist Christopher Taylor has now discovered that patches of dry soil 10–50 km across can combine with the wind field and affect how quickly convective storm clouds (cumulonimbus) form and grow.
“We already knew that differences in wind speed and direction with height (the ‘vertical wind shear’) in the atmosphere are critical ingredients for severe storm development, whilst gradients in land surface heating across the landscape can induce weak winds near the ground,” explains Taylor. “These two elements are usually studied separately, but we put them together and found that convective clouds grow very rapidly when the winds that steer them, some 3–4 km above the ground, oppose local surface-generated winds near the ground.”
This combination, he says, effectively increases the supply of moist, buoyant air into a cloud, accelerating the updraughts responsible for lightning and heavy rain.
“Storm initiations are clearly favoured in specific locations”
The result, he explains, challenges conventional thinking that over flat terrain, where cumulonimbus first develop, is essentially random. “In fact, under the conditions we studied – across sub-Saharan Africa – storm initiations are clearly favoured in specific locations, based on a combination of soil and wind conditions on that day.”
The work, which is detailed in Nature, could help in the development of more localized storm forecasting, he says, particularly in tropical areas where soil moisture gradients and wind shear are strong and can lead to flash flooding, lightning and strong winds.
The UKCEH team obtained its result by studying satellite images of 2.2 million afternoon storms in 2004–2024. They were able to obtain high-resolution data from the images and so observe fine-scale details of the wetness of soils.
The principle they have identified would be applicable to predicting thunderstorm formation in other parts of the world, such as Asia, the Americas, Australia and Europe – and not just the worst-hit tropical regions in Africa.
Ground-based measurement networks are scarce in Africa
Taylor and colleagues say they have been working with meteorological services in Africa for the last few years and contributing to international efforts to provide early warning systems for severe storms. Convective storms can be particularly damaging in built-up urban areas with intense rainfall damaging infrastructures such as roads and sanitation systems. “Unlike in the UK, where ground-based measurement networks are the backbone of weather forecasting, they are scarce in Africa and there are only a handful of meteorological radars here, explains Taylor. “We therefore had to rely on satellite data, which provide good quality information on some aspects of the coupled land-atmosphere system – notably the temperature (and therefore the height) of clouds and estimates of moisture in the top few centimetres of the soil.”
From this information, the researchers inferred how soil moisture affects evapotranspiration and atmospheric heating, how pressure gradients created by these heating patterns affect winds locally and, finally, how these inferred local winds interact with growing convective clouds.
The insights gleaned from this study could help improve the accuracy of short-term weather forecasts by providing a better indication of where storms are likely to appear within a region, Taylor says. “Just how much more skilful a forecast will be is an open question, but we have good reason to believe that in parts of Africa it could provide a big advance. In general, weather forecasting is a rapidly evolving field thanks to AI, and so the translation from research finding to application could be rapid.”
The researchers say they are now starting to look at how weather forecast models depict the processes described in their work. “Early indications suggest that models solving physical equations on a fine enough grid (of around 4 km) can capture the relationships between soil moisture, wind shear and cloud growth, but operational weather forecast models will require more accurate information on spatial variations of soil moisture to produce better forecasts,” says Taylor.
“We are also looking at how predictive models based on deep learning can exploit the new knowledge to provide forecasters with early indications of where storms may appear later in the day,” he reveals.
Wake-up call, and a call to arms The spectacular feature-length documentary ‘Ocean with David Attenborough’ is his very first partnership with National Geographic, now showing on Disney+ channel in Australia. With the great...