"Physicists smashed gold nuclei together at nearly the speed of light and found an unexpected pattern in the particles..." writes Live Science.
"If confirmed, that pattern could help reveal how the hot soup of quarks and gluons that filled the universe in the first few microseconds after the Big Bang cooled and condensed into the protons and neutrons that make up ordinary matter today."
In every collision, particles are flung out sideways; how hard they are flung, on average, varies slightly from one collision to the next. Physicists expected the size of these variations to change smoothly as they adjusted the collision energy. Instead, the variations dipped, shrinking and then growing again. This dip could be a sign of a long-sought "critical point," a special set of conditions at which nuclear matter changes the way it transforms from one form to another.
The signal, detected by the STAR experiment at the Relativistic Heavy Ion Collider (RHIC) at Brookhaven National Laboratory in New York, is strong enough that it is very unlikely to be a statistical accident. However, the researchers cautioned that the dip is a tantalizing hint, not proof of the long-sought transition. They published their findings Sept. 22 in the journal Physical Review Letters...
The team analyzed roughly 1 billion collisions, measuring how hard charged particles were flung sideways out of the fireball, according to the article.
The dip "does point to a set of conditions where the behavior of nuclear matter changes, and it gives theorists a new, precise measurement to test their calculations against," study co-author Rutik Manikandhan, told Live Science.
Japanese scientists may have found a surprisingly simple way to predict how some unusual materials behave by looking at the size of their crystal structure.
In their latest study, they claim that this structural measurement can predict magnetic ground states across a family of unusual materials more consistently than the electron-counting method scientists have traditionally relied on.
This could make the search for unusual magnetic materials less of a guessing game.
Until now, the challenge has been that quasicrystals and related materials have extremely complex atomic arrangements, making it difficult to find a single rule that works across different chemical compositions.
“Quasicrystals are among the most uniquely structured materials discovered to date and are expected to exhibit novel magnetic states and quantum phenomena not found in ordinary crystals. Until now, there has been no unified guideline for systematically exploring these novel phenomena in quasicrystals and their approximate crystals,” Farid Labib, first study author and assistant professor at Tokyo University of Science, said.
The new study suggests that a crystal’s size could provide that missing common measure when researchers search for unconventional magnetism.
Looking beyond the electron count
The researchers focused on Tsai-type approximant crystals. These materials mimic important structural features of quasicrystals while having a repeating crystal structure that can be studied experimentally.
Their atoms form nested clusters, with rare-earth elements such as terbium, dysprosium and holmium occupying positions that carry magnetic moments.
Researchers have often used the valence-electron concentration, or the number of valence electrons per atom, to classify magnetic behavior.
However, the magnetic boundaries associated with this measure shift with the rare-earth element and alloy composition, making it less reliable as a universal guide.
The researchers therefore synthesized Au–Al and Au–Ga-based 1/1 approximant crystals containing terbium, dysprosium and holmium, then compared their structures and magnetic properties. They also combined their measurements with data from previously reported Tsai-type compounds to see whether the pattern held across different compositions.
They found a nearly monotonic inverse relationship between electron concentration and the lattice parameter—the dimensions of the crystal’s repeating unit. This allowed them to reorganize the materials according to lattice size rather than chemical composition.
Three magnetic states separated by crystal size
The distinction turned out to be remarkably clear. Crystals with lattice parameters above about 14.72 Å (14.72 x 10⁻¹⁰ m) developed a whirling antiferromagnetic state, where magnetic moments form an ordered pattern with opposing contributions.
Between 14.62 and 14.72 Å, they showed a whirling ferromagnetic state with a net magnetization. Below about 14.62 Å, the materials enter a spin-glass state, where magnetic moments become frozen in a disordered arrangement.
The whirling magnetic states arise in these non-Heisenberg compounds partly because the local atomic environment creates a strong crystal electric field. This field favors particular orientations for the rare-earth magnetic moments, influencing how they ultimately arrange themselves.
The magnetic moments also interact indirectly through electrons moving through the material, linking the atomic structure to the way those moments arrange themselves.
A structural roadmap for new materials
The important point is not simply that lattice size correlates with magnetism. The study establishes specific structural thresholds that place different compounds on a common magnetic phase diagram.
This makes the lattice parameter an experimentally accessible starting point for deciding which materials may host a desired magnetic ground state.
“The unified magnetic phase diagram constructed in this study can serve as a practical roadmap for systematic exploration of new magnetic quasicrystals and approximant crystals exhibiting novel magnetic orders and quantum phenomena,” Kazuhiro Nawa, study co-author and a researcher at Tohoku University said.
“It can also provide a guideline for designing new magnetic materials with targeted magnetic ground states, opening new opportunities for discovering unconventional magnetism in quasiperiodic and complex intermetallic systems,” Nawa added.
The finding does not make electron concentration irrelevant. Rather, it suggests that lattice parameter may be a more consistent guide for Tsai-type compounds, while its usefulness in other magnetic materials remains untested.
What remains unclear is exactly why the lattice parameter works so well across these different compounds. The researchers also need to determine whether the same relationship holds in true quasicrystals.
Despite these limitations, the study indeed offers a more systematic route for exploring complex alloys and designing new quantum materials.
The study is published in the Journal of the American Chemical Society.
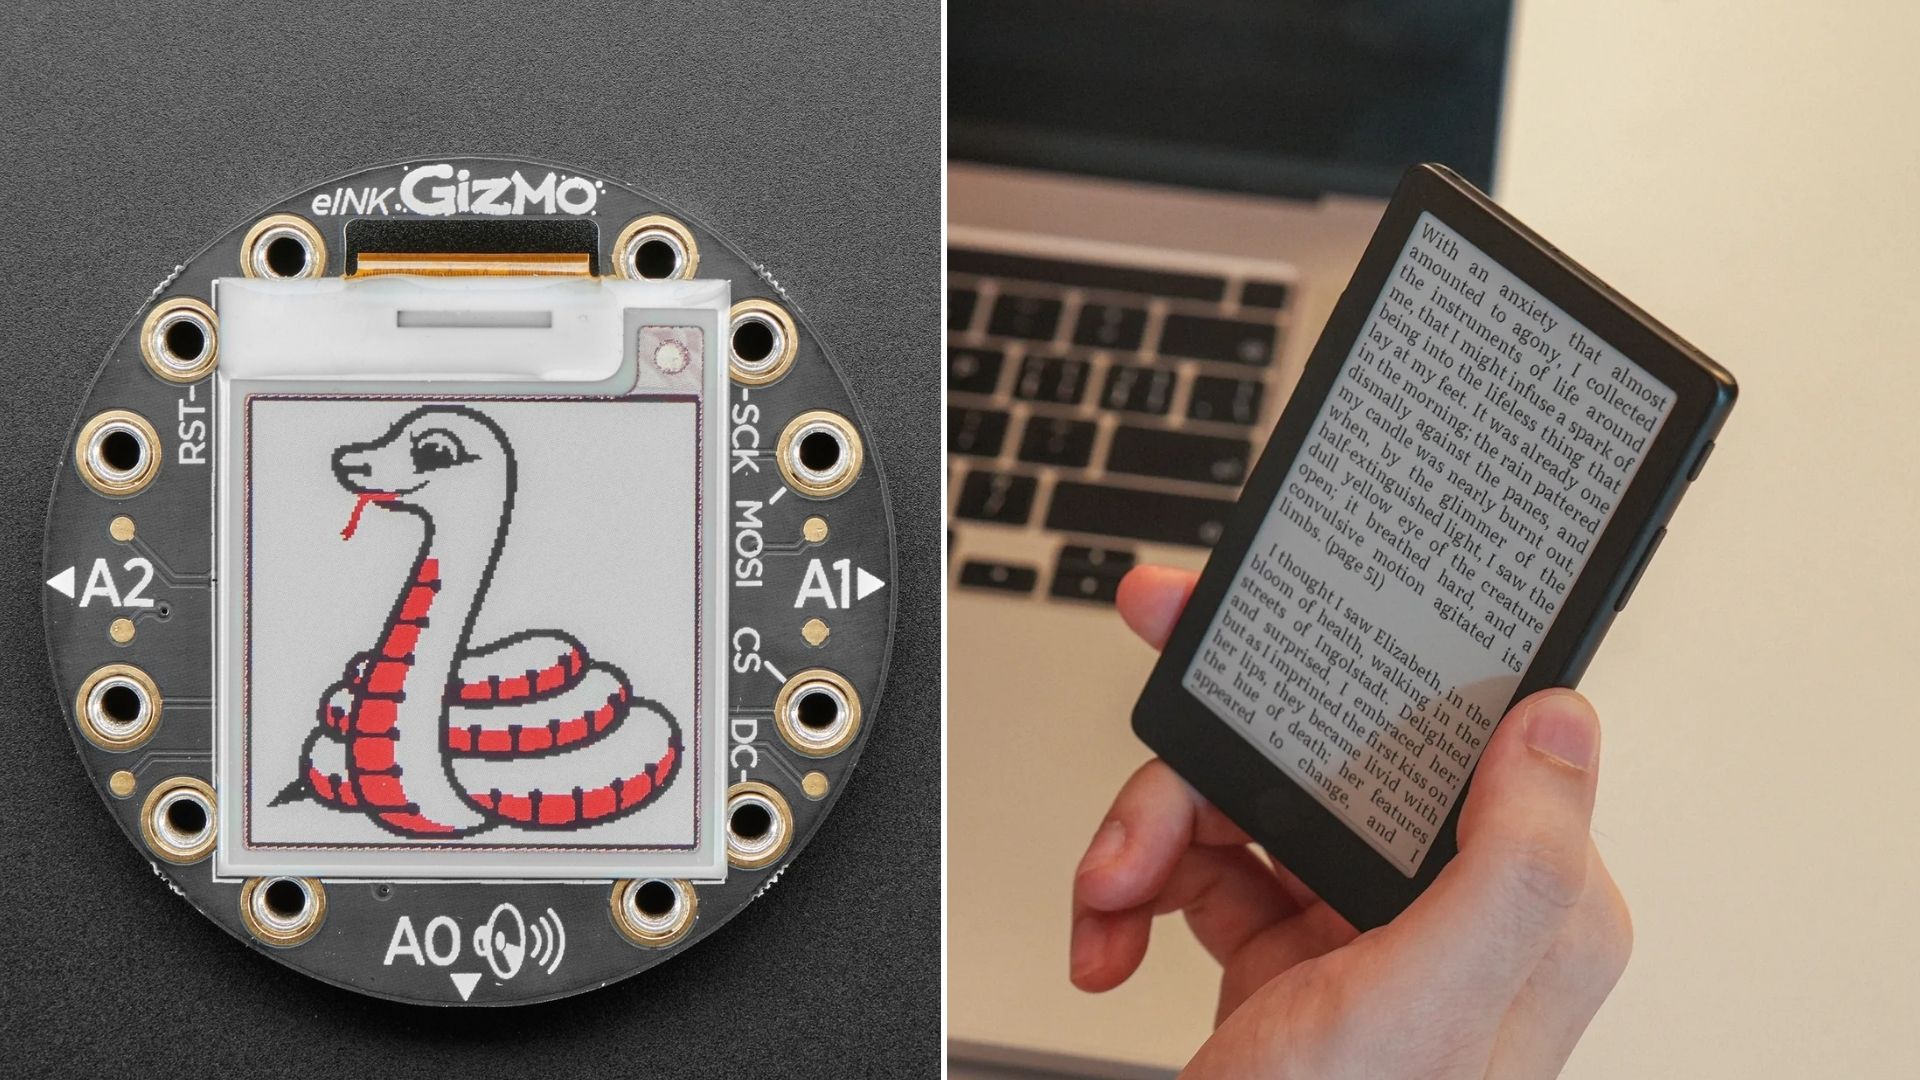
E-ink displays can look almost suspiciously like paper. They don’t glow like a phone screen, remain readable under bright sunlight, and can display the same page for days without constantly drawing power. Yet beneath that paper-like surface is a surprisingly simple bit of physics. Millions of tiny charged particles move around in microscopic containers.
The technology is officially known as an electrophoretic display, or EPD. It is used in e-readers, electronic shelf labels, digital signage and an expanding range of low-power devices.
Tiny capsules full of moving ink
At the heart of a conventional black-and-white e-ink display are millions of microscopic capsules. Each is roughly the diameter of a human hair and contains a clear fluid with electrically charged pigment particles suspended inside it.
In a common two-particle system, the particles are black and white and carry opposite electrical charges. The capsules sit above an electronic layer that can apply a controlled electric field to individual areas of the display.
Apply one polarity and the white particles move toward the top of a capsule. Reverse the field and the black particles move upward instead. What the viewer sees therefore depends on which particles are positioned at the surface.
This movement is called electrophoresis. Charged particles move through a fluid in response to an electric field. The same basic principle was demonstrated in early electronic-paper research, including the microencapsulated electrophoretic ink described by researchers at the MIT Media Lab in a 1998 Nature paper.
There is no backlight
This is where e-ink takes a very different route from an LCD or OLED display. A phone or laptop screen produces or controls light that travels toward your eyes. Traditional LCDs use a backlight, while OLED pixels generate their own light.
E-ink is reflective. Instead of producing the light you see, it uses ambient light, reflecting it from the pigment particles at the surface much like ink on a printed page. The brighter the surroundings, the easier the screen can be to see.
That is why an e-reader can be remarkably comfortable to use outdoors on a sunny day while a conventional display may become harder to see. E-readers can still have a light for reading in darkness, but it is generally a front light that illuminates the surface rather than a conventional display backlight shining through the screen.
The clever trick: the picture stays put
One of the most important properties of electrophoretic displays is bistability. Once the pigment particles move into position, they can stay there without continuously applying power. The electronics need electricity to change the image, but not simply to keep an existing image on screen.
That means an e-reader can display a page for hours while consuming essentially no display power between updates. E Ink says its displays consume power only when the image changes, with the energy required for an update depending on the display and operating mode. It is one reason e-ink devices can achieve battery life measured in weeks rather than hours.
So why does e-ink refresh so slowly?
There is a tradeoff for all that efficiency. LCD and OLED pixels can change extremely quickly because they control light electronically. E-ink has to physically move pigment particles through fluid. That makes its refresh behavior fundamentally different.
Modern E Ink displays have multiple refresh modes, and the company says some can update a full display in as little as 120 milliseconds. The technology is still generally slower and can produce visible flashing or ghosting during certain transitions, which is perfectly acceptable for turning pages or reading a document. But it is considerably less ideal for fast video or action-heavy games.
What about color?
Color e-ink works by adding more types of charged pigment particles or using different display structures. E Ink’s color technologies include systems using black, white, red, and yellow particles, while other approaches can produce a broader color range.
Its Advanced Color ePaper technology, for example, uses colored particles rather than relying on a conventional LCD-style color filter array. Color e-ink therefore remains reflective and low-power, but there is another tradeoff: color electrophoretic displays generally cannot match the brightness, saturation, and refresh performance of modern OLED or LCD screens.
Why e-ink still matters
E-ink is not trying to replace your smartphone display. Its advantage comes from doing less. It reflects rather than emits light, holds an image without continuously consuming display power, and can remain readable in bright environments.
That makes it especially useful when the priority is information rather than animation: books, labels, signs, notes, and other content that doesn’t need to change every millisecond. In a world increasingly filled with glowing screens, e-ink’s cleverest trick may simply be knowing when not to glow.
Superconductivity is supposed to be an all-or-nothing quantum state. Cool a material below a critical temperature, and electrons pair up and enter a state that lets electricity flow without resistance. Warm it back up, and that collective state disappears.
However, experiments on uranium ditelluride suggest that part of the superconducting behavior can survive after the main phase is gone.
Physicists at the University of Illinois Urbana-Champaign (UIUC) have found evidence that Cooper pairs—the paired electrons behind superconductivity—can arrange themselves into a repeating pattern called a pair density wave (PDW).
What’s even more interesting is that the pattern persists above the temperature where uranium ditelluride stops being superconducting. These findings provide the first direct evidence that a PDW can exist independently of the main superconducting phase.
“We were out on a limb when we first suggested it. It’s a very peculiar state, and, although there have been experimental hints, there has been no direct confirmation of the phase’s existence,” Eduardo Fradikin, one of the researchers and a physics professor at UIUC, said.
Finding the hidden state
In conventional superconductors, electrons form Cooper pairs and those pairs condense into one collective quantum state. Unconventional superconductors can behave differently and host additional electronic phases, including charge density waves (CDWs), where electric charge varies periodically across the material.
PDWs are similar in that they form a spatial pattern, but the quantity being modulated is the density of Cooper pairs. This idea was proposed in 2007, including the striking possibility that these paired electrons could exist above the superconducting transition.
However, “PDWs are tricky to analyze in real materials, because they behave like conventional superconductors in some experiments, and like CDWs in other,” Julian May-Mann, one of the study authors and a former graduate student from UIUC, said.
Uranium ditelluride, or UTe₂, offered an unusual place to look. Once considered an ordinary metal, it was found in 2019 to become superconducting below about 2 kelvins. It is also widely considered a candidate for an unconventional triplet-pair superconductor, in which the paired electrons can carry magnetic moments.
The researchers had previously detected CDWs on the material’s surface using scanning tunneling microscopy, but something did not fit, as magnetic fields could destroy the waves. A normal CDW should not respond so strongly to a magnetic field, prompting the researchers to consider whether a PDW was hiding alongside it.
Better crystals reveal the signal
The researchers first needed cleaner UTe₂ crystals because PDWs are extremely delicate and impurities can obscure their signatures. So they produced higher-quality samples using a new molten-flux growth method.
“Thanks to new methods for growing higher-quality samples, we were able to observe spectral signatures that respond to temperature and magnetic fields exactly as pair density waves should,” Vidya Madhavan, one of the lead researchers and a physics professor at UIUC, said.
They examined the crystals with a vector magnetic-field scanning tunneling microscope. Unlike a conventional setup, the instrument could vary both the strength and direction of the magnetic field—important because UTe₂ is anisotropic, meaning its properties depend strongly on direction.
The measurements revealed electronic modes whose responses to temperature and magnetic fields matched theoretical expectations for a PDW, including modes that survived above the superconducting critical temperature.
“We even showed that the modes persist above the temperature at which superconductivity disappears, a telltale theoretical prediction that has not been convincingly observed before now,” Madhavan added.
The researchers also found that a CDW-only explanation conflicted with established principles governing how electronic phases should respond to temperature and magnetic fields. The PDW interpretation provided a more consistent explanation of the observations.
A clue, but not the final answer
The result could reshape how physicists think about unconventional superconductors by suggesting that Cooper pairing can begin before the material develops its full superconducting state.
This could help researchers understand why some unconventional materials develop complex phases and potentially guide the search for new superconducting states.
“Pair density waves are the Cheshire Cat’s grin of superconductivity. They are the vestige that remains once the phase itself has disappeared. In conventional superconductors, Cooper pairs form when the full phase transition occurs, but, in this system, their observation in PDWs above the transition point shows that they are formed beforehand in a different state,” Fradikin explained.
However, there is an important limitation as well. Scanning tunneling microscopy probes the material’s surface, so the researchers cannot yet prove that the same PDW exists throughout the interior.
The next challenge is therefore to determine whether the hidden state extends into the bulk of UTe₂ and to establish its nature more firmly.
"Scientists have discovered a virus that is a tiny bit human, carrying a gene it stole from our ancestors about 100,000 years ago," writes the New York Times. "And this virus may be using our own gene to infect us."
Phys.org explains that it's "both an important gene for brain function and a jumping gene capable of moving and inserting itself into genomes."
BC200 is found only in humans and related primates and was discovered in the late 1980s as an abundant noncoding RNA in human neurons. Although BC200's physiological function is poorly understood, evidence suggests it may be involved in regulating the translation of neuronal messenger RNAs into proteins... The researchers also suspect that BC200 jumped in skin cells because these are the only cells known to be infected by molluscum contagiosum virus (MCV). The gene is also abnormally expressed in some tumors and overexpressed in the brains of patients with Alzheimer's disease, suggesting its jumping ability could play roles in these diseases.
[Cedric Feschotte, a senior author of the study] said he and his colleagues would like to explore whether the molluscum contagiosum virus uses BC200 to manipulate human host cells. They are also interested in better understanding the gene's role in disease, including breast and other types of tumors in which it is abnormally expressed, and whether it jumps in cancer cells and causes mutations.
Thanks to Slashdot reader joshuark for sharing the news.
While most magnets have two poles (north and south, or positive and negative), recent advances in quantum mechanics have revealed an "octupolar order," writes Phys.org, where a pattern of particles in a crystalline structure "behaves as if it has eight magnetic poles rather than the familiar two."
Now, a team led by quantum physicists at the University of Toronto has established a new method for observing quantum magnetic states using light to probe the atomic vibrations produced as electrons spin. The work is a critical first step toward harnessing multipolar magnetism for practical technologies, including next-generation data storage and computing devices.
"We identified new signatures of a hidden type of magnetic state which cannot be detected using ordinary probes," says Arun Paramekanti, a professor in the Department of Physics and the Center for Quantum Information & Quantum Control in the Faculty of Arts & Science at the University of Toronto, and senior author of a study published in Physical Review Letters that describes the findings.
"Our research opens up the possibility for using higher-order magnets in several applications including controllable read-write memory elements found in everyday computers...."
By directing a special type of rotating light at magnetic materials, the team observed a clear optical fingerprint of the otherwise hidden magnetic order.... The findings offer a new tool for uncovering and manipulating previously inaccessible forms of magnetism, opening new avenues for quantum technology development.
As we grow older, some cells stop dividing but remain in the body. Scientists call them senescent cells. They are sometimes nicknamed “zombie cells” because they are still alive, even though they no longer make new cells. These cells are part of normal life. They can help during early development and tissue repair. But when […]
A new report from the Brookings Institution presents evidence that increasing the size of the U.S. nuclear arsenal could make nuclear crises more likely. This raises an important challenge to arguments that the U.S. must consider increasing its stockpile in response to China's growing nuclear capabilities.
The International Meteor Organization, the nonprofit that coordinates and publishes amateur and professional observations of meteor phenomena, said its infrastructure has suffered a “critical blow” from a cyberattack.
“We recently suffered a cyberattack that dealt a critical blow to aging infrastructure, taking much of our site offline," a static page on its website on Wednesday said. “We expect several weeks of partial downtime as we transition to new infrastructure and services.”
“I am very sad to see the site down”
In the meantime, the IMO said it’s prioritizing the reporting of fireball observations, which can be reported here. The organization is also providing some information on its Facebook page.
A new report from the Brookings Institution presents evidence that increasing the size of the U.S. nuclear arsenal could make nuclear crises more likely. This raises an important challenge to arguments that the U.S. must consider increasing its stockpile in response to China's growing nuclear capabilities.
The ground is shifting beneath the feet of Australian authors and other creatives. A leaked proposal seen by the ABC suggests the government might grant artificial intelligence (AI) companies access to the copyrighted works of Australians under an opt-out system.
Arctic summer sea ice should have melted away years ago, according to the 'experts' who foretold its demise by 2007, 2012, 2016... But with the ice going nowhere, those experts are very quiet now, says Paul Homewood.
A new report by the International Bar Association (IBA) has found a significant gap between the importance legal professionals attach to fundamental rule of law principles and their assessment of how effectively those principles are implemented in practice.
The Defense Department issued a legal waiver authorizing current and former personnel to share unidentified anomalous phenomena–related classified information, but it doesn’t extend to other agencies.
The Defense Department issued a legal waiver authorizing current and former personnel to share unidentified anomalous phenomena–related classified information, but it doesn’t extend to other agencies.
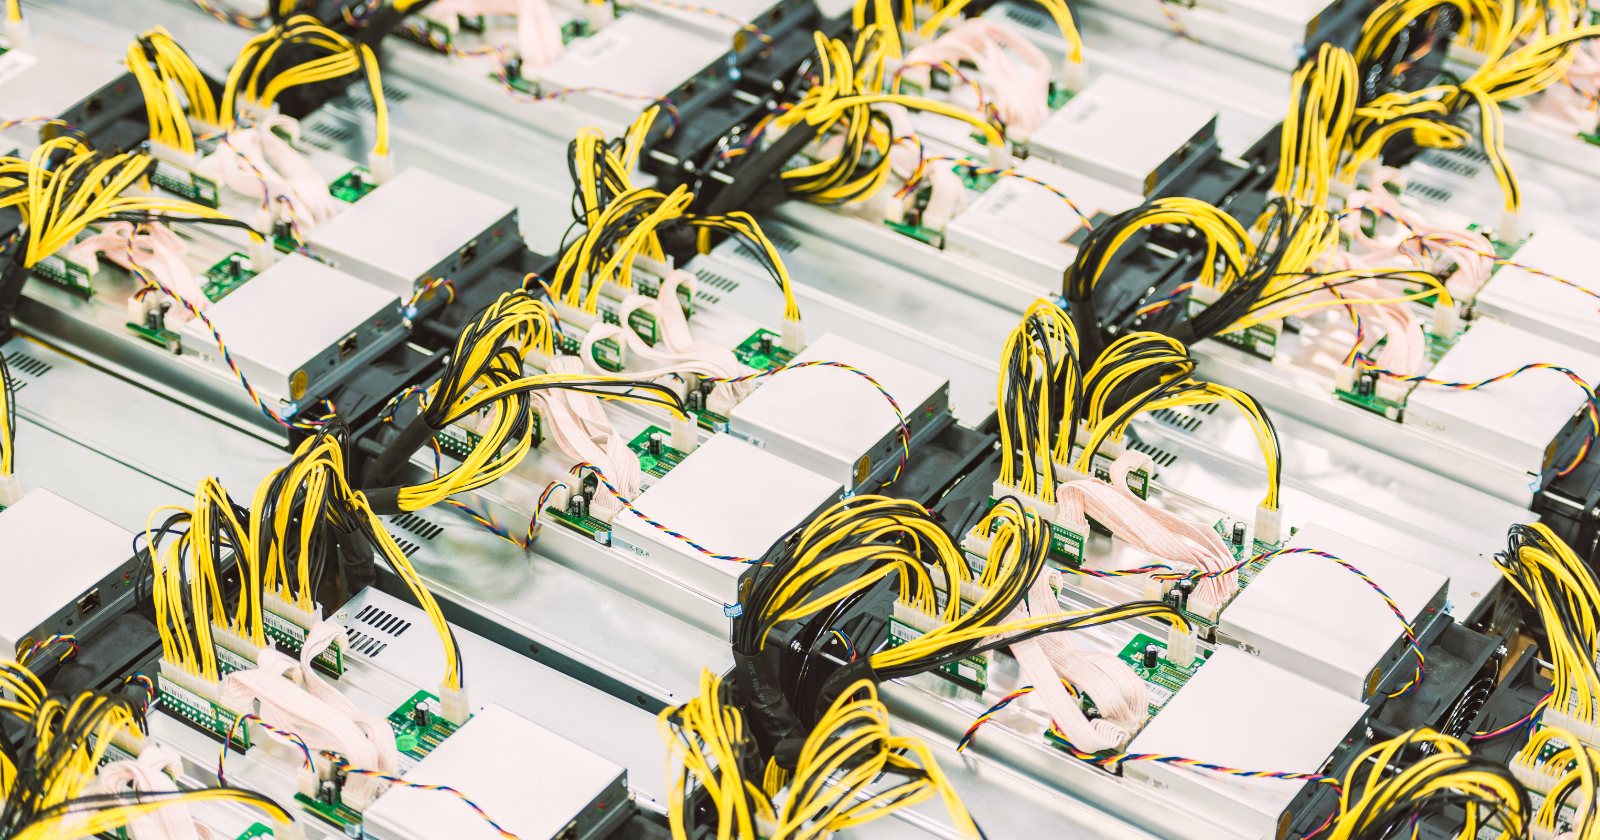
In 2021, the average transaction recorded on the Bitcoin blockchain carried an estimated water footprint of roughly 16,000 litres, once the water used to generate the electricity behind the mining process and to cool the machines doing the work is added up. That figure, drawn from a peer-reviewed study published in the Cell Press journal Cell Reports Sustainability, works out to roughly 6.2 million times the water footprint of a single credit-card swipe, based on de Vries’ own estimate — discussed in a later interview with Greenpeace rather than the paper itself — that one card transaction carries a footprint of around 2.6 millilitres.
The research, titled “Bitcoin’s growing water footprint,” was published online in late November 2023 by Alex de Vries, a data scientist with a background in financial economics who tracks the industry’s resource use. De Vries built his estimate around two components. The larger of the two, accounting for roughly 80 to 90 percent of the total, is indirect water use: the water consumed at power plants to generate the electricity that miners buy, whether through evaporative cooling at thermoelectric plants, hydropower reservoir evaporation, or other generation methods. The paper calculates this by combining data on where Bitcoin’s computing power is located with regional water-intensity figures, expressed in litres of water per kilowatt-hour of electricity produced on that grid.
The remaining share, direct water use, covers cooling and humidification equipment on-site at mining facilities, measured using an industry metric called water usage effectiveness, or WUE. For large-scale US mining operations, the study estimated a weighted-average WUE of between 0.25 and 1.03 litres per kilowatt-hour, depending on climate and facility design. Location matters enormously to the total: the study estimated Kazakhstan accounted for 63 percent of Bitcoin’s 2021 water footprint while hosting only around 14 percent of its computing power. Average water intensity across Bitcoin’s power mix rose from 8.63 litres per kilowatt-hour in 2020 to 15.0 litres per kilowatt-hour in 2021, the paper found.
What the comparisons mean
News coverage of the study, including reporting by ScienceDaily and Fast Company, popularized the comparison that a single Bitcoin transaction’s water footprint is roughly equivalent to filling a backyard swimming pool. The 6.2-million-times-a-credit-card-swipe comparison, cited in de Vries’ own commentary and repeated across outlets covering the paper, follows from dividing the 16,000-plus-litre figure by that credit-card baseline, and it moves with Bitcoin’s price. When the market fell during the 2022 downturn, mining activity and its associated electricity and water use fell with it, only to climb back toward record levels as the price recovered in 2023. Because a higher Bitcoin price makes mining more profitable and draws more computing power onto the network, the water footprint tracks the price cycle instead of holding steady. De Vries projected the network’s total 2023 water footprint at roughly 2,237 gigaliters, an increase over 2021 despite the intervening price crash.
Extrapolated to the United States, which absorbed a large share of mining capacity after China’s ban, de Vries estimated domestic mining operations consume water at a scale comparable to roughly 300,000 US households, or a city on the order of Washington, DC, a comparison he discussed in an interview with Greenpeace.
Where the estimate is contested
The methodology has drawn pushback. Critics covered in a DL News investigation note that per-transaction water figures are largely independent of transaction count — a block can bundle thousands of individual payments, so dividing total resource use by the number of on-chain transactions can make the per-transaction number swing based on how the network happens to be used that day — a shift in usage patterns, not a genuine efficiency change.
Bitcoin advocate Daniel Batten has gone further, arguing in commentary covered by the same report that the swimming-pool framing overstates the case by counting indirect water use from power generation that would occur with or without Bitcoin mining, and that applying the same accounting method to other electricity-intensive industries — banking, AI, search engines, construction, or media — would produce similarly large-sounding numbers. Separately, a UN-affiliated water researcher, Kaveh Madani, flagged in the same report that “water footprint” and “water consumption” are technical terms with distinct meanings in hydrology, and that using them interchangeably in public communication risks overstating the case. The Register’s coverage of the dispute frames it as a live disagreement between the paper’s author and its critics — not a settled question.
Why it matters beyond the headline number
The debate sits inside a larger and less disputed trend: much of Bitcoin mining has moved into regions and grids with high water intensity, including coal-heavy and drought-prone areas, since China’s 2021 mining ban scattered the industry’s computing power across new jurisdictions. That shift, documented in mining-location data tracked separately by the University of Cambridge, means Bitcoin’s water footprint is now heavily influenced by decisions about where mining farms are sited and what power sources they draw on, in addition to how much Bitcoin is worth on any given day. For a network whose environmental accounting has focused almost entirely on carbon and electricity for over a decade, the 2023 paper marked one of the first attempts to put a number on the water side of the ledger as well.
A new report by the International Bar Association (IBA) has found a significant gap between the importance legal professionals attach to fundamental rule of law principles and their assessment of how effectively those principles are implemented in practice.
The International Meteor Organization, the nonprofit that coordinates and publishes amateur and professional observations of meteor phenomena, said its infrastructure has suffered a “critical blow” from a cyberattack.
“We recently suffered a cyberattack that dealt a critical blow to aging infrastructure, taking much of our site offline," a static page on its website on Wednesday said. “We expect several weeks of partial downtime as we transition to new infrastructure and services.”
“I am very sad to see the site down”
In the meantime, the IMO said it’s prioritizing the reporting of fireball observations, which can be reported here. The organization is also providing some information on its Facebook page.

 Login