Ancient ferns may have helped keep Triassic Europe burning by rapidly regrowing after fires and supplying fresh fuel for the next blaze. Around 201 million years ago, Earth was rocked by the end-Triassic mass extinction. The crisis has been linked to enormous volcanic activity associated with the breakup of Pangea. Those eruptions released huge quantities [...]
Climate change is often discussed in terms of rising temperatures, extreme weather and environmental loss. But there's another consequence that can be harder to see: The impact on our mental health.
Editor's Note: This text was updated at 12:30 p.m. EDT to correct the spelling of Kim Meidenbauer's name.
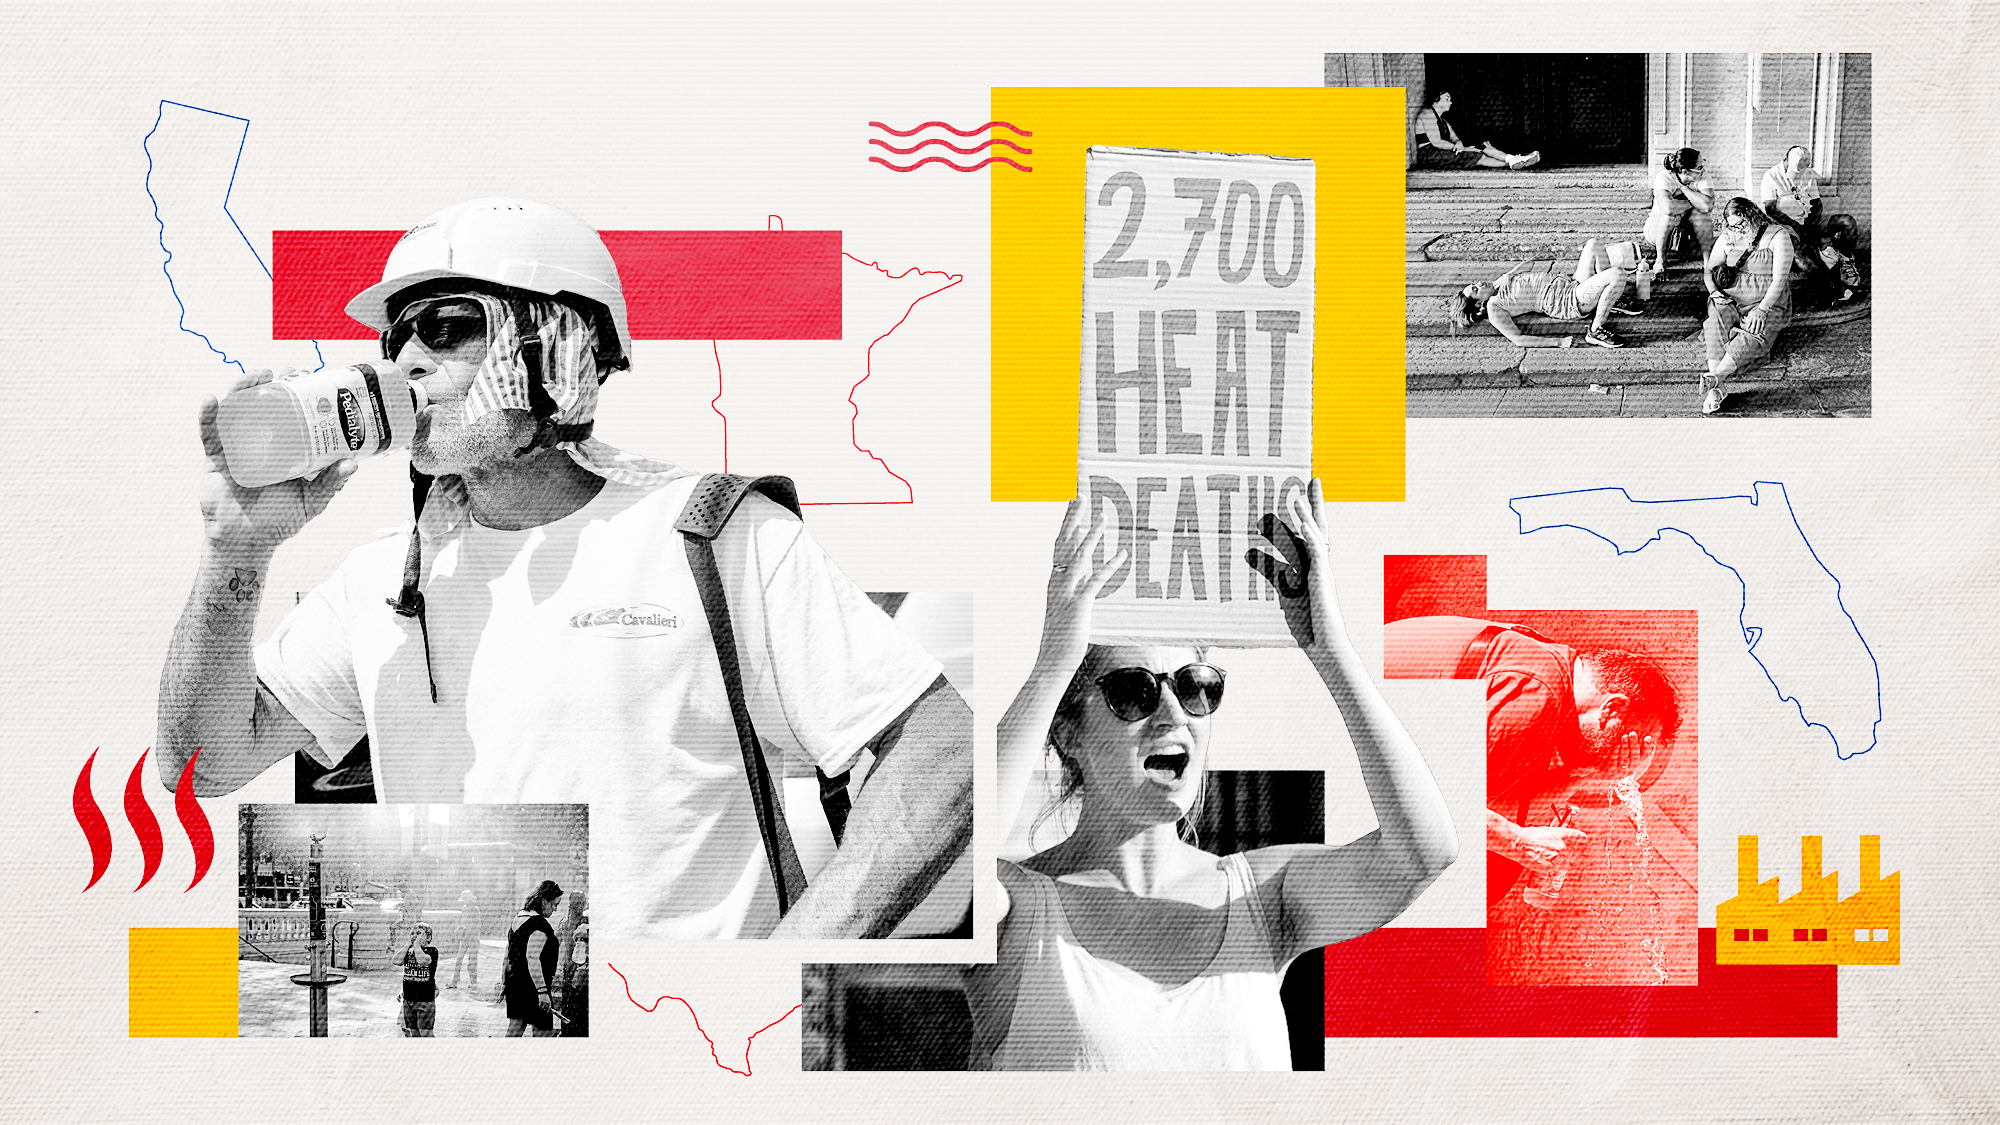
Burning up: How can we adapt to a warming world?
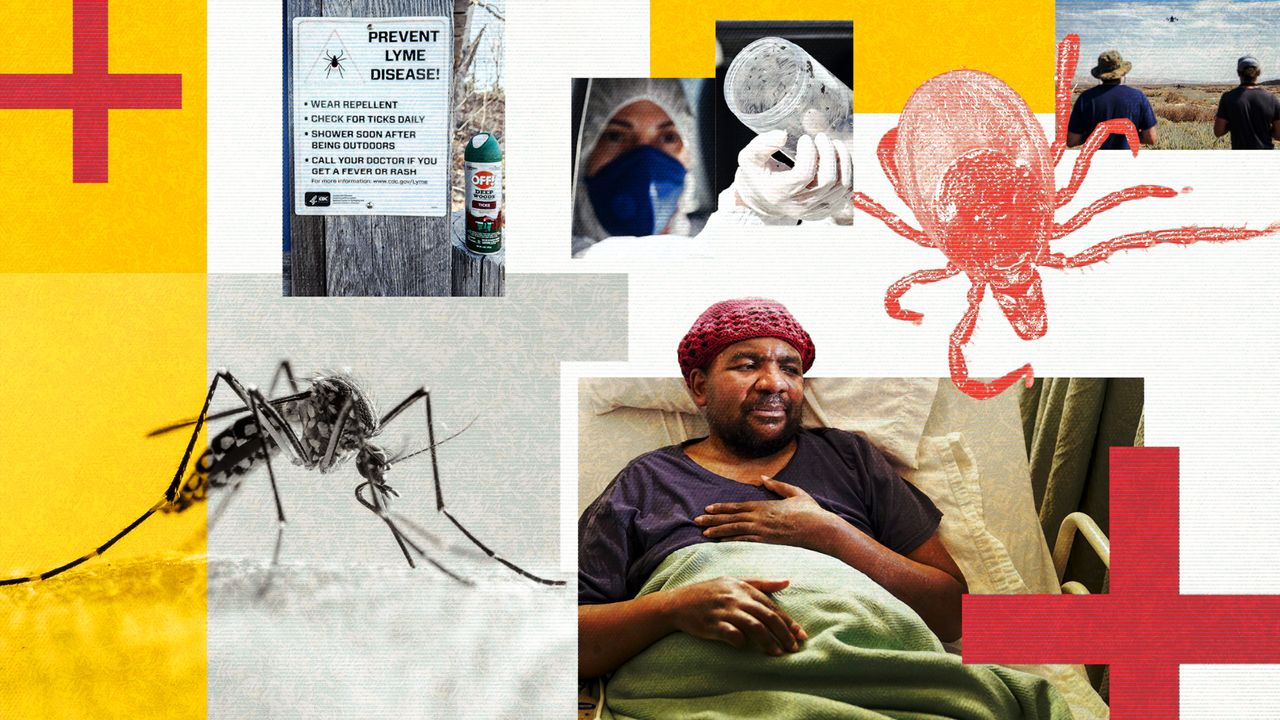
As the planet warms, our environment will be transformed, but so will our bodies. This video is part of a series where we investigate the health impacts of climate change, focusing on heat, air quality, food and infection risk. We also evaluate the promising solutions that could help us adapt to our warmer future.
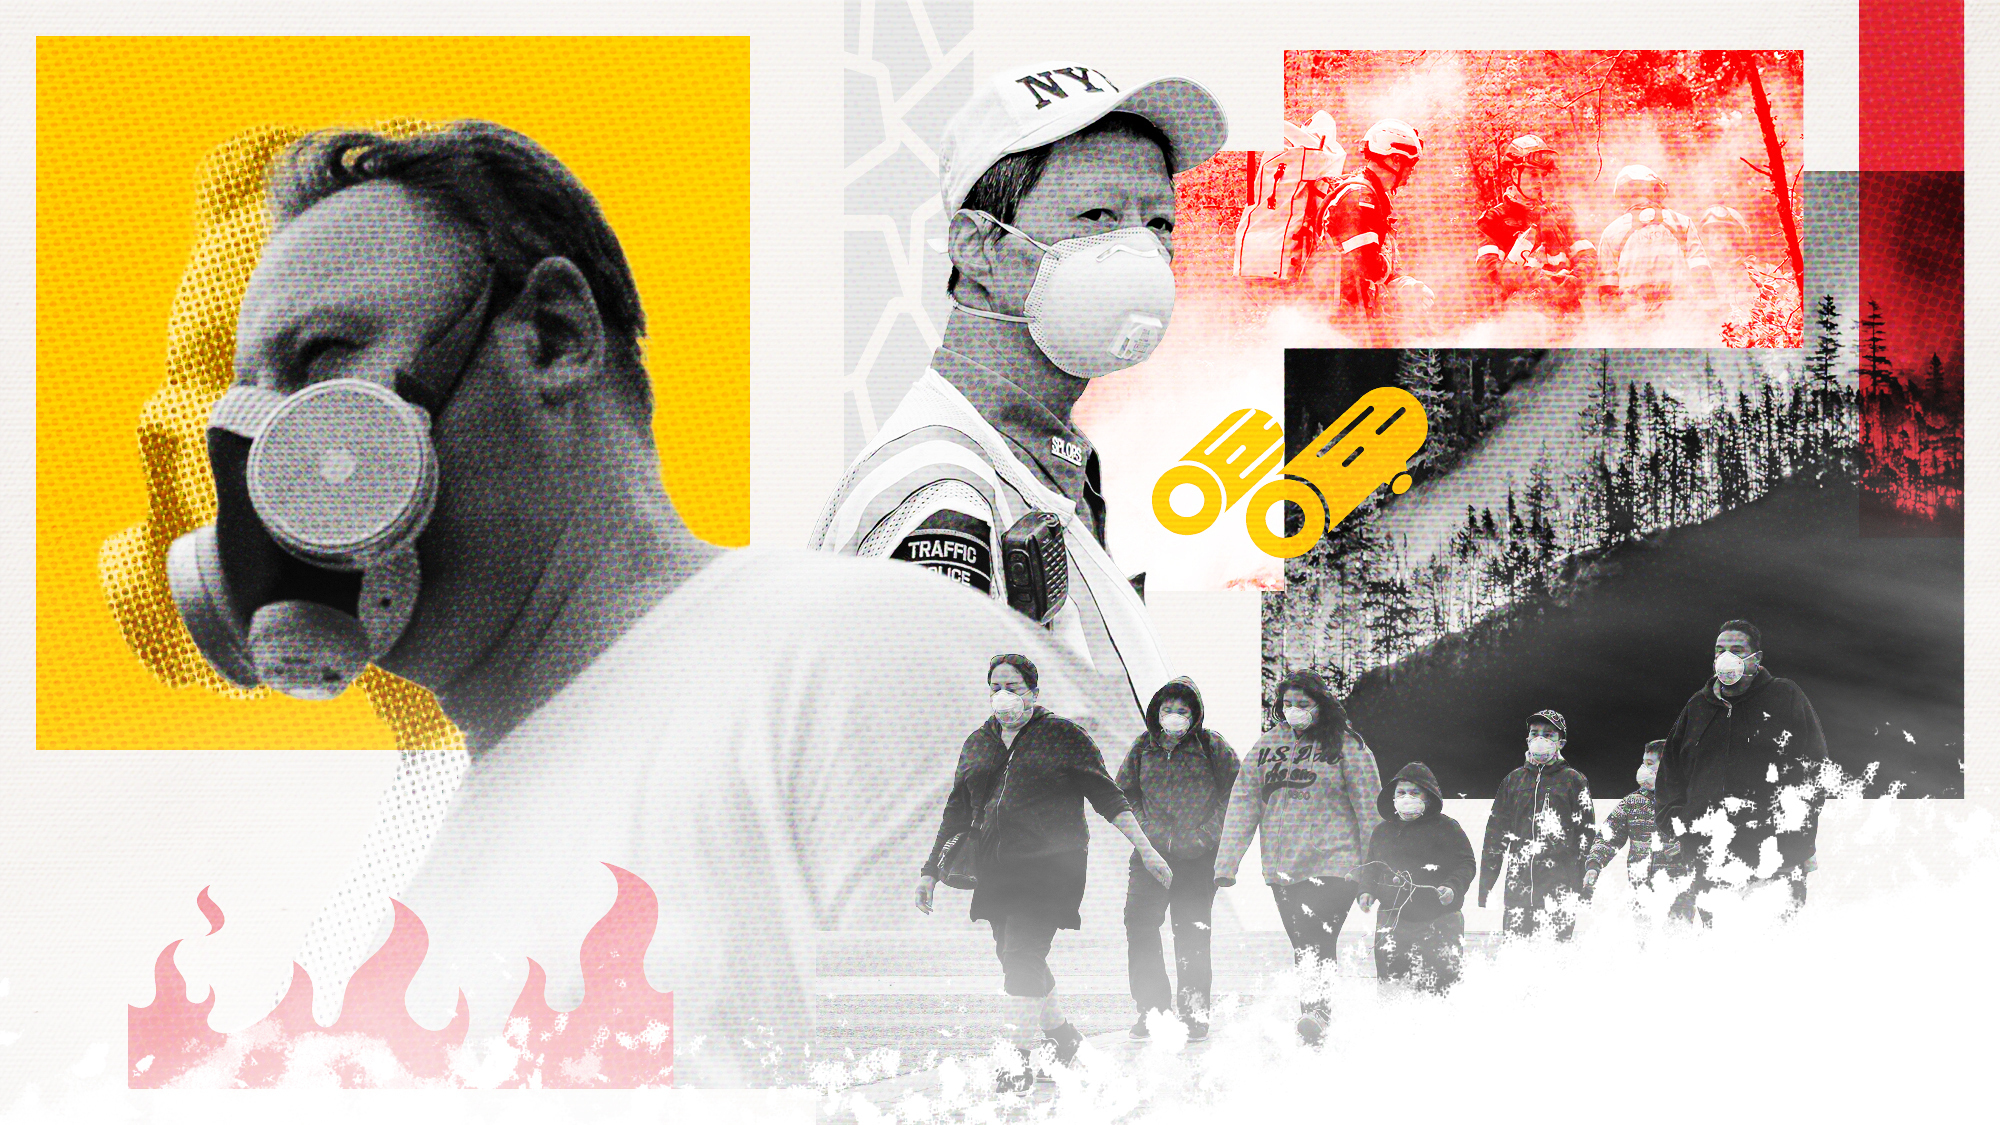
'Wildfire smoke is the fastest-growing environmental threat in the US': How a warming world will poison the air we breathe
Wildfires are projected to increase dramatically due to climate change. That could trigger a massive increase in heart attacks, premature births and early deaths, research reveals.
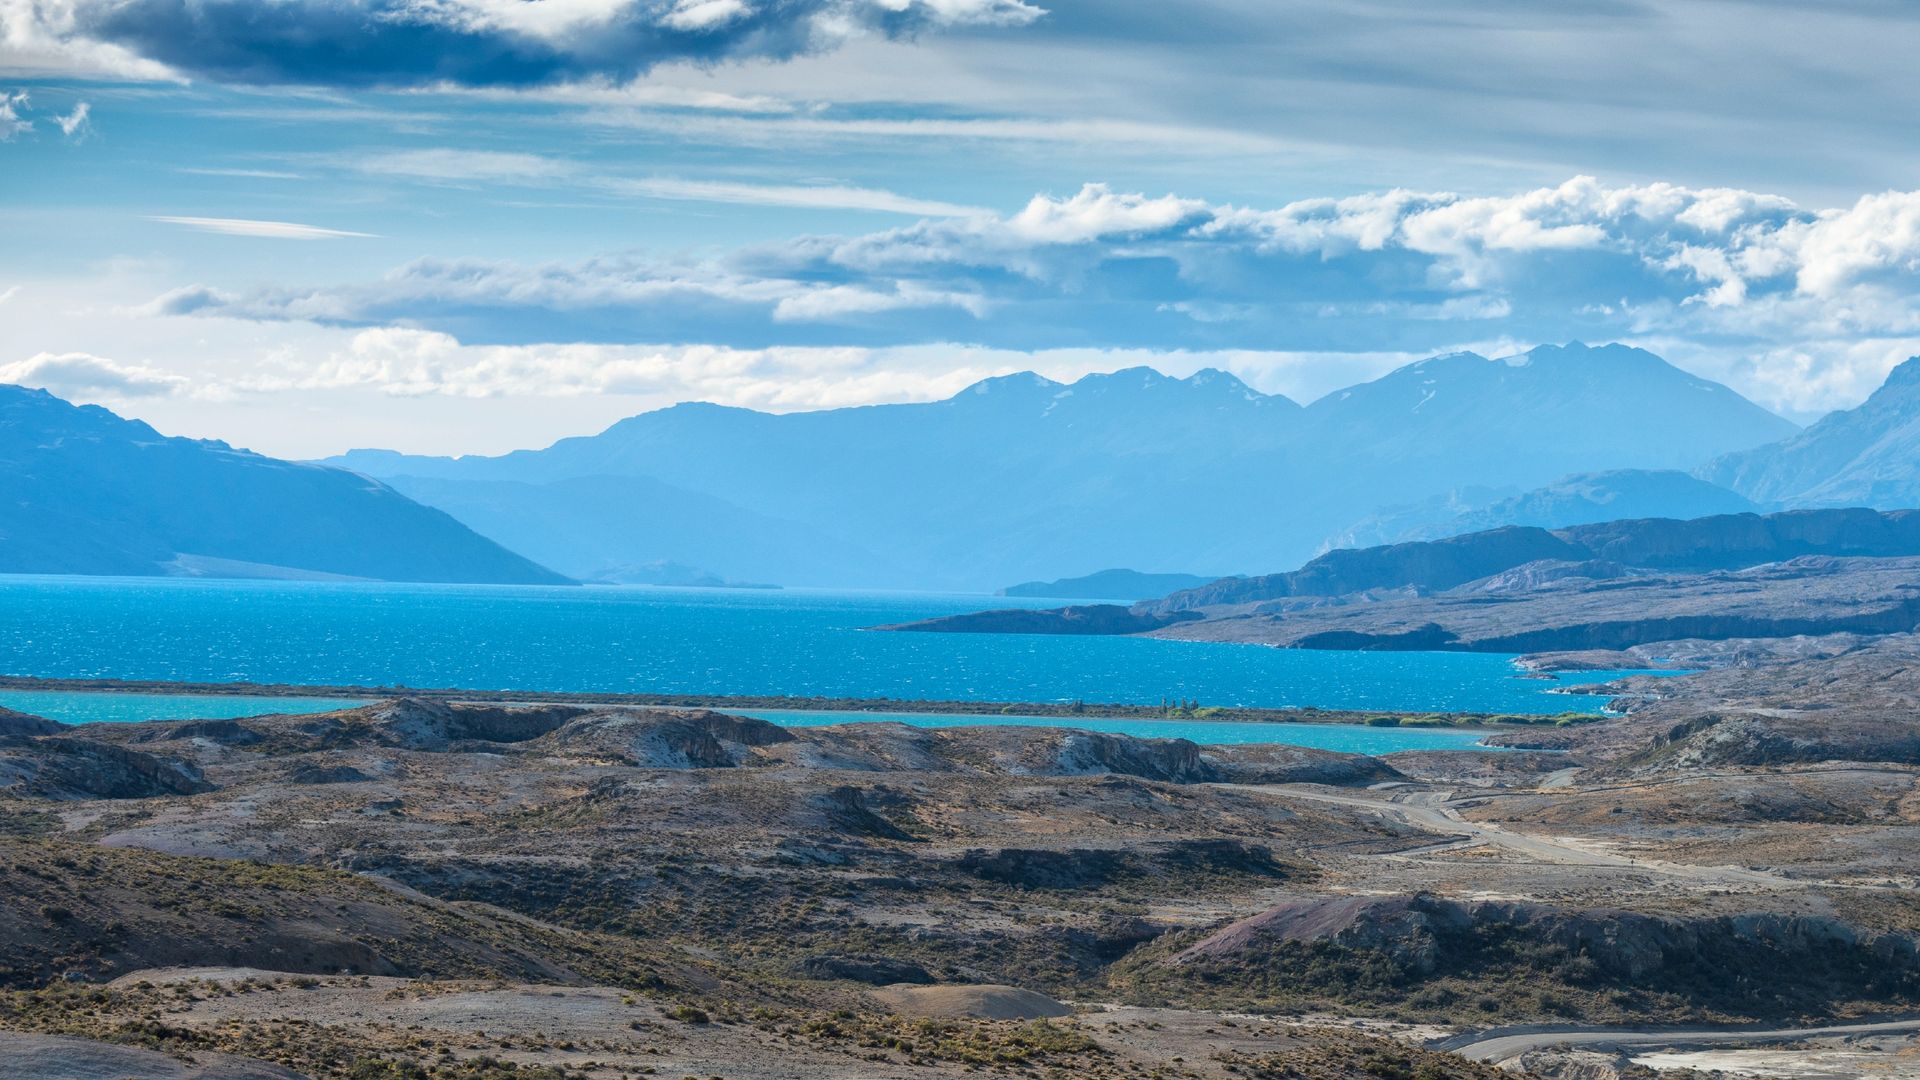
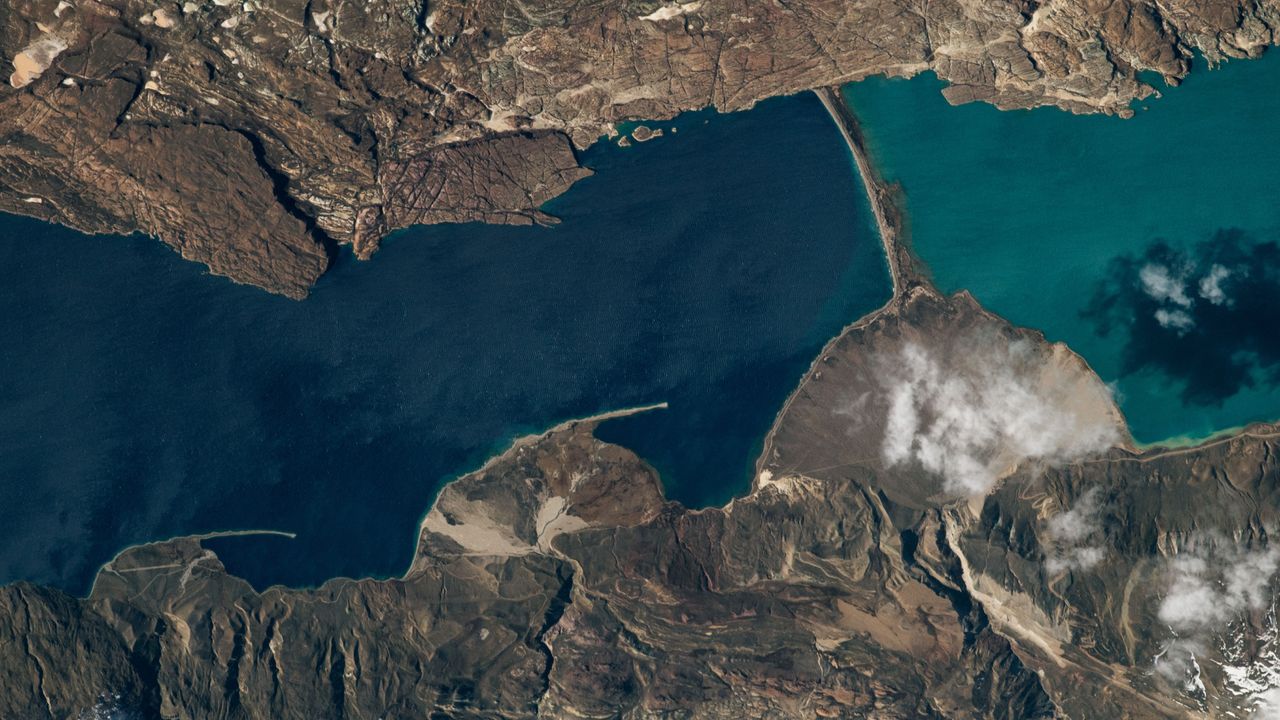
What's in the photo? The point where two different-colored lakes meet
Who took the photo? An unnamed astronaut on board the International Space Station
When was it taken? Sept. 15, 2020
This eye-catching astronaut photo shows the point where an ancient Patagonian lake has been split by a peculiar land bridge, creating two contrastingly colored bodies of water.
Lake Pueyrredón (on the left in the photo) is the Argentine half of a roughly 40-mile-long (65 kilometers) glacial lake, which stretches across the country's border with Chile in Patagonia — a region in South America that is well known for its diverse range of geographic features, including mountains, fjords, deserts and rainforests. The Chilean half of the lake is known as Lake Cochrane (not shown in this image). Both halves hold crystal-clear water that is up to 1,600 feet (500 meters) deep, giving Pueyrredón a deep blue hue when viewed from above.
Thousands of years ago, a thick sediment barrier formed across the southern section of Lake Pueyrredón, creating a new body of water known as Lake Posadas. This smaller body, which is roughly 5 miles (8 km) long, has a lighter, teal color due to its shallow water and a large influx of sediment from a nearby river, according to NASA's Earth Observatory.
Other rivers from nearby hills have previously dumped large quantities of sediment along the western shore of Lake Pueyrredón (bottom of the photo), creating a trio of fan-shaped landforms, known as deltas, that increase in size from north to south (left to right in the photo).
Wind-driven currents and waves have pushed some of this sediment from the outer edges of the two smaller deltas, creating long, thin strips of land, known as sandspits, pointing down-current.
This image, snapped from the banks of Lake Posadas, shows a close-up view of the rocky barrier that formed across Lake Pueyrredón thousands of years ago. (Image credit: Prisma Bildagentur/Universal Images Group via Getty Images)
The strip of land separating Pueyrredón and Posadas looks similar to the sandspits. However, it is most likely a moraine — a barrier of sediment and larger rocks that formed along the edge of a hefty iceberg or long-lost glacier, according to the Earth Observatory.
Eagle-eyed viewers may be able to spot a narrow airstrip on the smallest delta (running almost parallel with its sandspit). While the area is largely uninhabited, it is popular with tourists, who travel to the lakes to camp, hike, fish and kayak, according to a local travel site.
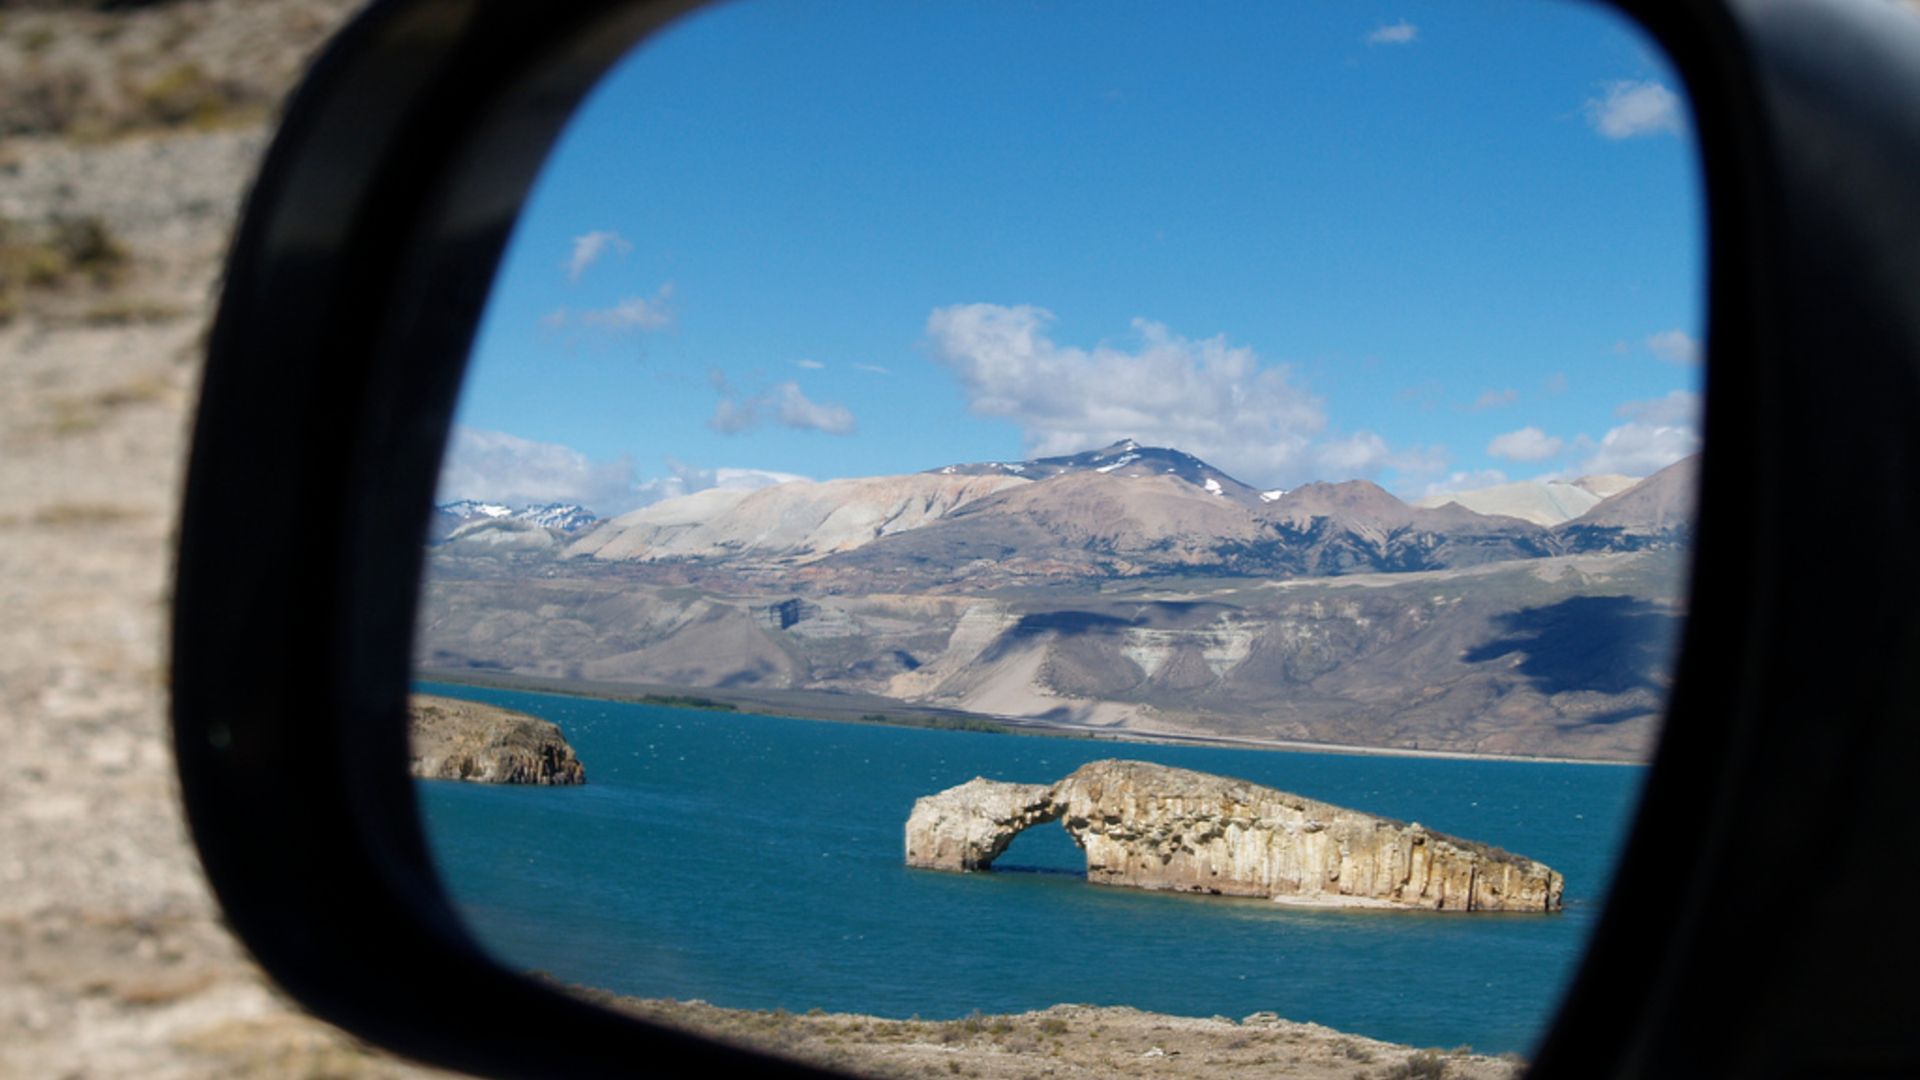
Lake Posadas is also home to a unique island with a massive rocky arch (see below) that is also popular with tourists.
This photo, captured in the side-view mirror of a tourist's car, shows the famous rocky arch in Lake Posadas. (Image credit: alextorrenegra via Wikimedia)
The two lakes in the astronaut photo sit within a large valley, which was carved by a massive ice sheet that once covered the area. The last remnants of this ice sheet are located in northern Patagonia, around 20 miles (30 km) west of Lake Cochrane, and have also been snapped from space by astronauts.
Patagonia is home to dozens of similar valleys and fjords that were carved out by the same massive ice slab. Around 210 miles (340 km) southwest of Pueyrredón and Posadas, a trio of ravines converge to create a rare configuration where a lake, river and glacier "touch" each other at a single point.
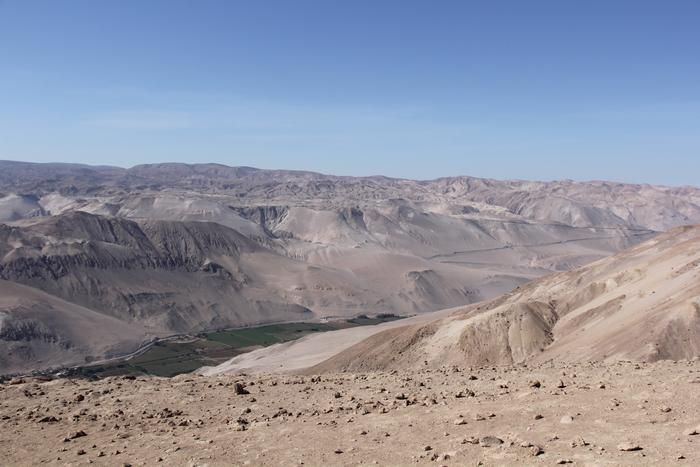
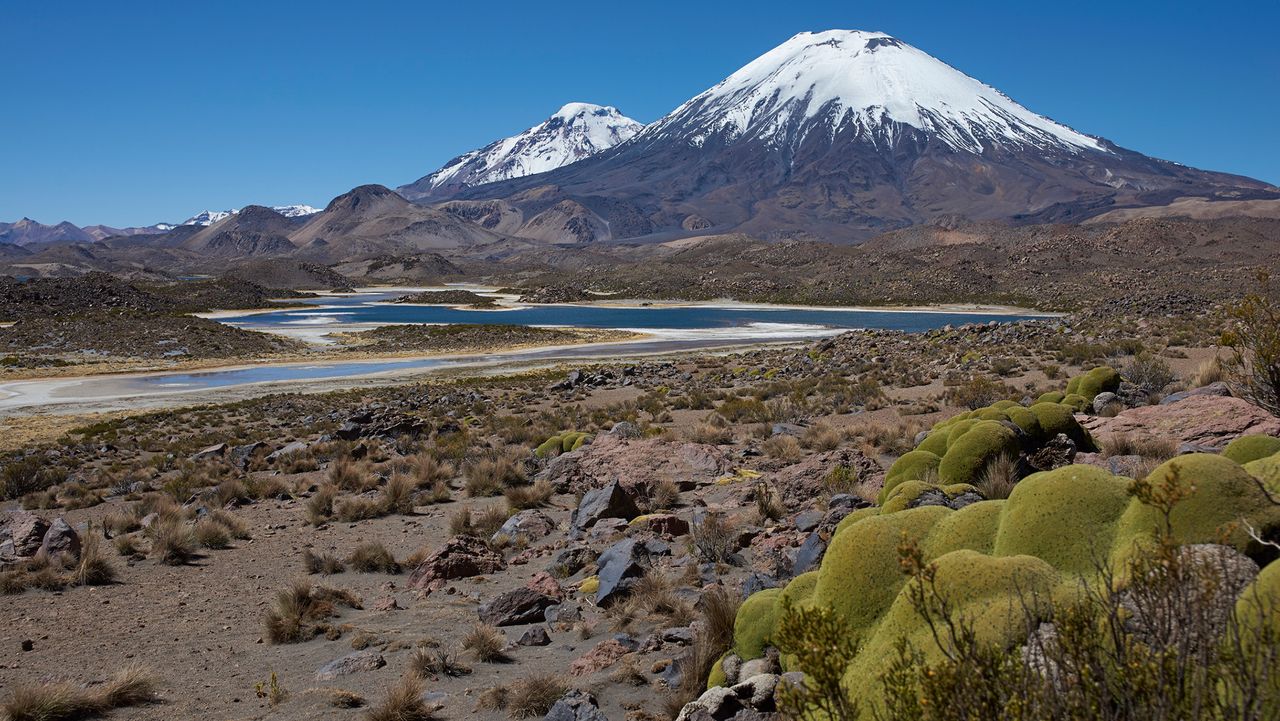
A volcanic eruption 22 million years ago froze a snapshot of the Andes in their youth, revealing a slow-and-steady formation of this formidable mountain range.
The eruption, which originated from the Lauca Caldera in what is now northern Chile, blanketed the landscape in a formation known as ignimbrite. This rock is left over after a pyroclastic flow — a mix of rock, volcanic gas and ash that sweeps over the landscape like a broiling tsunami. Pyroclastic flow is what buried the Roman town of Pompeii after the eruption of Mount Vesuvius in A.D. 79, preserving buildings and people where they fell.
Now, a new study published Sept. 11 in the journal Science Advances extrapolates the landscape under this Andean ignimbrite, revealing that it must have buried rolling foothills rather than craggy peaks.
"Pompeii shows how volcanic eruptions can freeze a moment in human history," Byron Adams, a geomorphologist at University College London, said in a statement. "This study shows that much larger eruptions can also freeze moments in Earth history, burying whole landscapes beneath volcanic deposits and preserving clues to how mountains were being built before the eruption. We cannot dig down to see the buried landscape, but we can use the shape of the volcanic blanket and what we know about how rivers shape mountains to infer what is hidden beneath it."
Volcano deposits, known as ignimbrite, that were incised by the Lluta River in northern Chile. (Image credit: Frances J. Cooper)
The original slope of the volcanic flow from Lauca Caldera was about 1.5 degrees, Adams and his colleagues wrote in the new paper. The researchers also calculated the erosion of the landscape to figure out how fast the rocks in the area were rising as the oceanic Nazca Plate pushed under the continental crust of South America, which is how the Andes were built.
They found that prior to the eruption, the uplift of the crust was no more than 0.16 mile (0.26 kilometer) per million years — quite a sluggish process. This finding corresponds to earlier work that used the formation of certain minerals within rocks to determine when a particular rock rose through the crust and approached the surface.
"There is debate over whether the Andes grew slowly and steadily over 40 or 50 million years or whether they rose extremely slowly and then popped up more recently, in the last six to 10 million years," Adams said. "Our findings, which cover a large part of the middle of that history, support the slow but steady hypothesis."
The same method could be applied to other mountain ranges worldwide, the researchers added.
Scientists have a new view of the ground under Los Angeles, and it's a bit shaky.
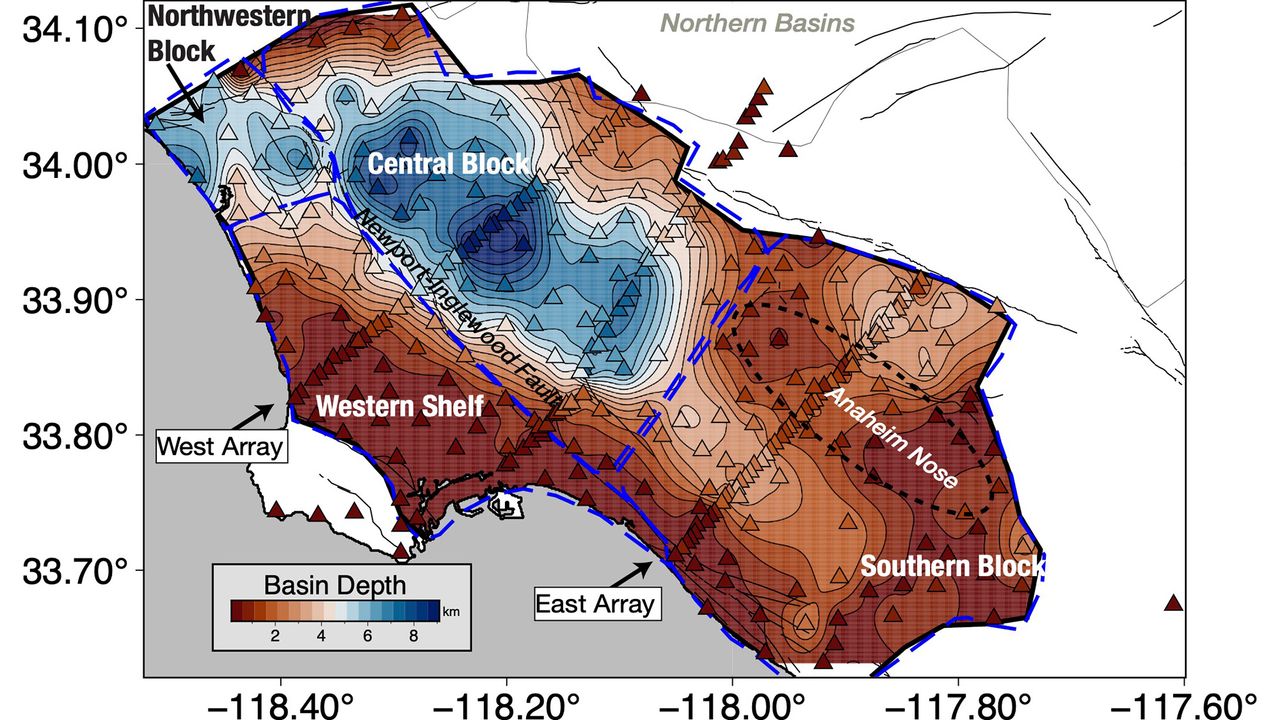
The 3D model of the Los Angeles basin shows that downtown LA is underpinned by up to 6.2 miles (10 kilometers) of sediment, which will likely amplify shaking from any earthquake that hits the region. That's not entirely new information, but the underground map is more precise than ever before, and it should help earthquake scientists better understand which areas of the city are most vulnerable.
"With this improved model of the basin, we now know the shape of the edges of the basin in a lot more detail," Elizabeth Cochran, a U.S. Geological Survey seismologist who was not involved in the study, told Live Science.
That's important, Cochran said, because irregular edges can focus or direct earthquake waves. In the magnitude 6.7 Northridge earthquake in 1994, Santa Monica experienced more shaking damage than expected because of the way the seismic waves traveled along the basin edge, she added.
Los Angeles sits in a sedimentary basin, a low spot where layers of sediment have accumulated for at least 15 million years. At first, the basin was underwater, so the lowest layers of these sediments were oceanic sediments. Later, when tectonic forces brought the basin onto dry land, additional sediment accumulated from the mountains nearby.
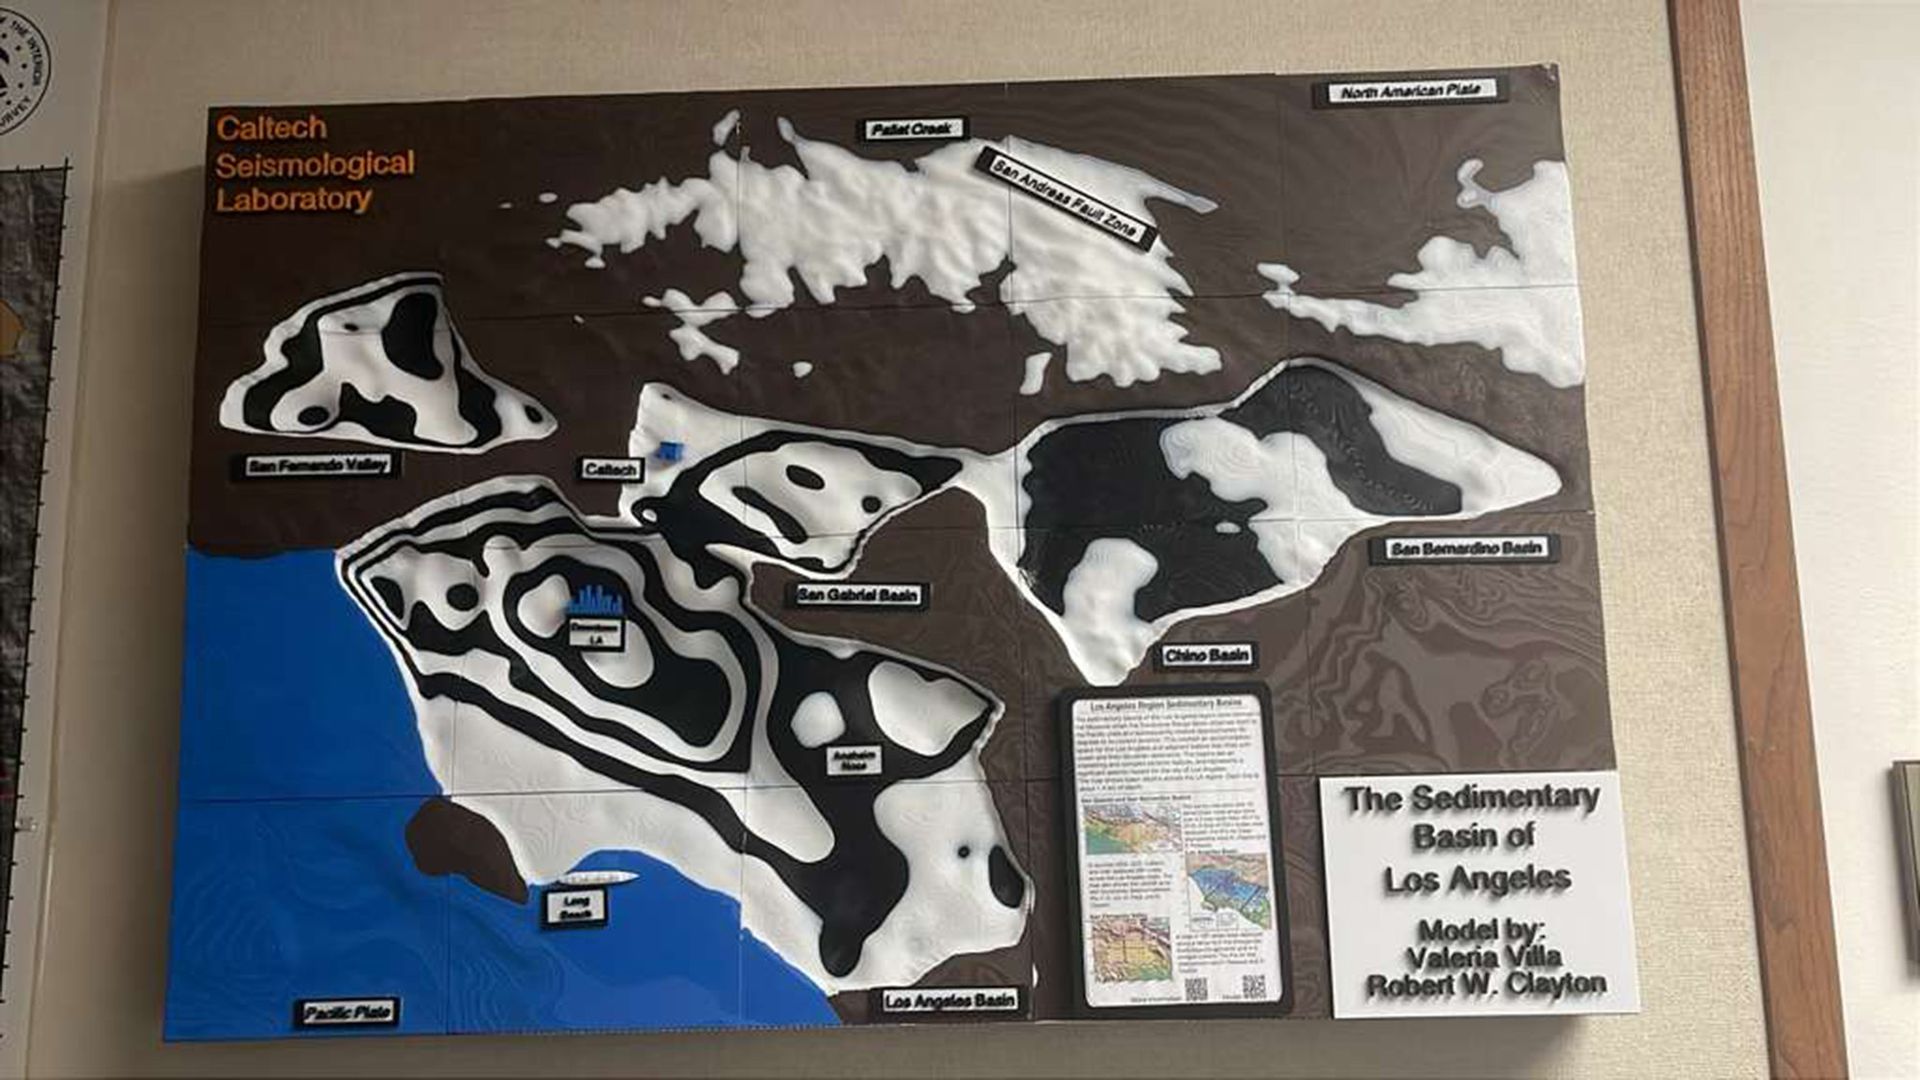
Researchers knew the general shape of the basin, but not in great detail. "Previous surveys were just linear arrays that went through just one cross section on the LA Basin, but this was the first full three-dimensional map," said Valeria Villa, a doctoral student at Caltech and co-author of the new paper describing the map, published Aug. 4 in the journal JGR Solid Earth.
A 3D-printed model of the LA sedimentary basin. (Image credit: Valeria Villa/Caltech)
The data from the new map came from 273 temporary seismic stations deployed around LA. These stations detected faint earthquake waves from distant quakes that couldn't be felt by humans. The paths and timing of these waves as they traveled helped researchers build a 3D map of the rock layers below the surface.
The central part of the basin, under downtown LA, holds the deepest sediments, which could amplify shaking. The edges of the basin are thinner, with 0.6 to 2.5 miles (1 to 4 km) of sediment before the hard crystalline rock that serves as the basin's bottom.
On its own, the map doesn't tell geophysicists exactly where shaking might be the worst in the case of a big LA earthquake, but researchers can now update their models and simulations to test different scenarios, Villa told Live Science. The damage will ultimately depend on a lot of factors, such as which fault causes the quake. Los Angeles is surrounded by many faults, including the famous San Andreas, which could give off a magnitude 7.8 quake that would jolt Southern California.
One important factor in the amount of damage to buildings during such a quake is "resonance" — whether buildings shake in time with the sediments below them, Cochran said. When buildings and sediments are in resonance, the damage is worse. A better understanding of the sediment layers beneath downtown LA will help researchers ensure buildings are designed to avoid resonating with the shaking basin, she said.
"You can, for example, change the stiffness of your building and do other things to offset this effect," Cochran said. "What is important is that you know what the ground is like, and what the larger geologic structure is like, underneath the region where you are building the building to know that this could be an issue."
Weakening Atlantic Ocean currents could cripple agriculture in some of the world's major breadbaskets, threatening global food security and raising the price of basic commodities, new research finds.
The study, which hasn't been peer-reviewed yet, investigated how a roughly 60% decline in the Atlantic Meridional Overturning Circulation (AMOC) would impact global food production. The AMOC is a system of ocean currents that regulates the global climate and brings heat from the tropics to the Northern Hemisphere.
In the new study, researchers used a computer model to simulate the AMOC's future decline. They modeled 100 years of change, assuming 3.6 degrees Fahrenheit (2 degrees Celsius) of warming above preindustrial levels. The team forced an AMOC slowdown over the first 50 years in one simulation but didn't modify the circulation in a second experiment, which enabled them to compare the world with and without an AMOC failure.
The model's outcomes mirrored the results of previous studies, showing broad cooling in the Northern Hemisphere and a southward shift of the belt of clouds and rain that encircles the globe near the equator. As in past studies, these effects were irreversible on human timescales, said study co-author Michael Hinge, a senior economist at the nonprofit Alliance to Feed the Earth in Disasters (ALLFED).
"Once the damage is inflicted, it stays there," Hinge told Live Science, adding that in the 50 years after the peak rate of AMOC slowdown in the model, the circulation weakened by an extra 20%. The study was posted on ALLFED's website July 7.
An agricultural "shock"
Hinge and his colleagues ran three models to look at the most common varieties of wheat, maize and rice, layering these models on top of the AMOC simulations. They found that global yields for these crops decreased by 5.3% by the 50-year mark, once the AMOC had weakened substantially.
"Lots of these effects manifest earlier, so it's a moving target," Hinge said.
He added that the results were based on a single warming scenario that was run once and used monthly rather than daily data, so they should be interpreted as a proof of concept. "We've set up a pipeline that is ready to take pretty much any AMOC scenario that can generate high-resolution climate data and see what it implies for crops," Hinge said.
While there was a 5.3% decrease overall, that global metric concealed huge differences between regions. For example, countries like Germany and Ukraine lost up to 19% of their cereal yields due to sudden, sharp cooling, while Canada showed a 12% decline in production for the same reason.
"Scandinavia, the United Kingdom and Canada are particularly exposed," Hinge said, "but there are many other [vulnerable] locations, some of which may be surprising even to the people who are living there."
For instance, the model produced a "very nasty brown splodge" of reduced precipitation over India, Pakistan and big parts of China, he said. Iran, Sudan and Eritrea, which are already water-stressed countries, also exhibited severe declines in rainfall, indicating that a portion of the agriculture there may not survive an AMOC collapse.
The 5.3% result also hides variability among years, Hinge said, because it's an average. So there may be years when global cereal losses reach 10% or more, which would bump up food prices, in part because countries might stockpile crops instead of trading them.
Global response
The regional effects of an AMOC slowdown would interact with climate change, triggering unpredictable outcomes. In particular, maladaptation — taking actions that end up backfiring — is a worry, Hinge said.
"You're preparing and setting up for much hotter temperatures or trying to develop areas for these temperatures and the trends you're seeing, and suddenly you see something different," he said. "That may cause an even larger compounding effect [on agriculture]."
The findings build on prior research led by Paul Ritchie, a climate scientist at the University of Exeter in the U.K., whose team explored the effects of an AMOC collapse on agriculture in Great Britain. That study, published in 2020, had similar limitations as the new one, so it's best to interpret both papers as a suggestion of what might happen rather than a precise forecast, Ritchie told Live Science in an email.
"I think the new study is valuable in showing the potential scale and geographic distribution of the initial agricultural shock," said Ritchie, who was not involved in the latest work. "What that would ultimately mean for food production and food security is more uncertain, because there are many possible responses by farmers, markets and governments." For that reason, the regional predictions may be more informative than the 5.3% global average, he said.
An AMOC collapse could reduce rainfall over the Indian subcontinent, crippling agriculture in this region. (Image credit: Bhaswaran Bhattacharya/IndiaPictures/Universal Images Group via Getty Images)
Average food prices worldwide could rise by 17% to 40% if the AMOC weakens to the extent it did in the model, the study predicts. The level of increase depends on how countries respond to the shock and their degree of preparedness, as well as on whether agriculture can be sustainably expanded in places like the African Sahel (the semi-arid zone directly south of the Sahara Desert) and Brazil, the analysis suggests.
The U.S. would not be spared from this price jump, and the model indicated that the country could see crop losses of about 3% for domestic wheat and corn. This loss would likely impact other foods that rely on cereal inputs, like meat, Hinge said. "The variety of foods available in the stores may well diminish for periods," he added.
An AMOC collapse would fundamentally deepen the need for countries to trade with each other, because some regions — such as the Indian subcontinent, China, Iran, Russia, Ukraine and Canada — could endure this giant shift only if they imported more food, Hinge said.
"Should countries turn inwards and start to restrict exports in an effort to ensure access for their own citizens first, or deal with the uncertainty, or offset concerns, then this will massively magnify the effects of AMOC," he said.
If governments behave as they have during past shocks, such as the 2008 financial crisis and the COVID-19 pandemic, they may restrict trade and start stockpiling food if and when the effects of AMOC weakening begin to show, Hinge predicted. The researchers hope their work and future modeling can help people understand the need to take swift, effective action if a collapse were to occur, he said.
Currently, "if that warning light starts flashing, we're not sure what to do with it," Hinge said. "There are no easy answers here; an AMOC [collapse] would be deeply catastrophic."
By burying thousands of pairs of cotton underwear across Switzerland, scientists uncovered striking differences in biological activity from one type of land to another. The results showed that gardens had especially active soils, while lawns were much quieter underground. Soil supports the global food system while also storing water, carbon, and essential nutrients. It is [...]
In August 2026, a series of powerful winter storms transformed parts of northern Chile’s Atacama Desert, covering the famously dry landscape in an unusual layer of snow. Snow is not unheard of in the Atacama. Significant falls occurred in 2025 and, before that, in 2011. But one of the August 2026 storms stood out because [...]
Longtime Slashdot reader AmiMoJo shares a report from the BBC: August was the joint-hottest month ever recorded, tying with July 2023, according to the EU's climate service. The record was driven by a combination of climate change and the rising influence of El Nino, pushing heat into the atmosphere across the Pacific. Temperatures for the month were 1.65C above pre-industrial levels -- surpassing the critical 1.5C threshold agreed by countries to avoid the worst consequences of climate change. While a single month above 1.5C does not mean it has been permanently crossed, it shows a trend towards breaching that limit. The month also capped western Europe's warmest summer, with high temperatures pushing the season past the deadly heat of 2003.
An anonymous reader quotes a report from The Guardian: Rising global temperatures caused by the burning of fossil fuels are transforming the world's forests, wetlands and tundra to the point they are releasing emissions that could further worsen global heating by as much as 30%, a new study has found. As the world heats up, permafrost in the high latitudes is thawing, fiercer wildfires are burning in drying forests and wetlands and lakes are warming. All of these changes are themselves causing the release of planet-heating methane and carbon dioxide locked in trees and soils, therefore worsening the climate crisis, the paper states.
While scientists have long known of these "feedback loops" that amplify the impact of direct pollution from burning coal, oil and gas, the emissions from natural sources are largely unaccounted for in climate projections. This additional heating is however significant, researchers found, with emissions from natural sources set to amplify global heating by 20% to 30% by the end of this century. This would add an estimated 0.2C to 0.4C to the global average temperature by this time, depending on the overall action taken by countries to combat the climate crisis.
[...] This latest paper makes clear that action by countries to cut fossil fuel pollution will still lessen the amount of additional emissions that come from landscapes. Under the most optimistic climate scenario where emissions are cut quickly, natural sources will add 0.2C of warming, the paper found. Under a worse case higher emissions scenario, 0.4C will likely be added. Current policies put in place by governments are likely to see the global temperature rise to 2.6C above pre-industrial times, according to Climate Action Tracker. This will likely cause severe disruption and hardship to billions of people through sea level rise, crop losses and other consequences. "This hidden multiplier is missing from the models guiding climate policy, so those models are likely underestimating how much warming is coming -- and overestimating how much carbon we can still afford to emit," said Sam Abernethy, a scientist at Spark Climate Solutions who led the research, published in Environmental Research Letters.
The disruption of the worldâ(TM)s carbon cycles is now being seen in "real time," said Rob Jackson, a Stanford University scientist and study co-author. "The results are a wake-up call, and itâ(TM)s imperative that they be included in the next generation of climate policies," he added. "Failure to do so will make meeting the worldâ(TM)s climate goals less and less likely."
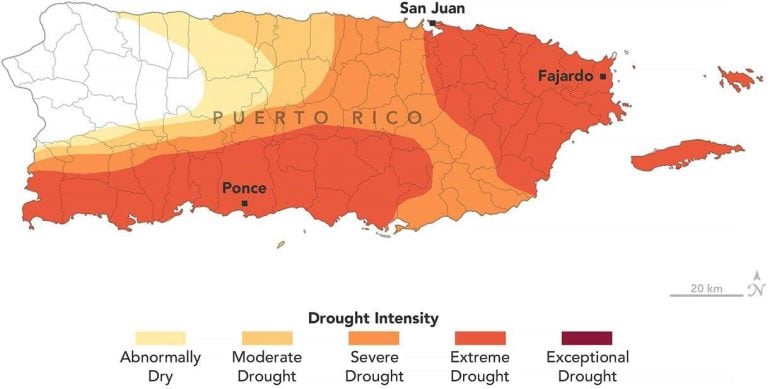
Puerto Rico went from no drought to widespread extreme drought in just months as rainfall collapsed and water shortages spread. Puerto Rico usually enters its wet season in May. In 2026, however, the expected rains largely failed to arrive through late August, leaving much of the U.S. territory in drought. The prolonged dry spell has [...]
As the planet warms, our environment will be transformed, but so will our bodies. In this series, 'Burning up,' we investigate the health impacts of climate change, focusing on heat, air quality, food and infection risk. We also evaluate the promising solutions that could help us adapt to our warmer future.
To the untrained eye, Xiaoyu Shan's lab bench looked like a home gardening experiment gone bad: dishes filled with dirt — some that looked like mud pies and others that were bone-dry — and not a plant to be seen.
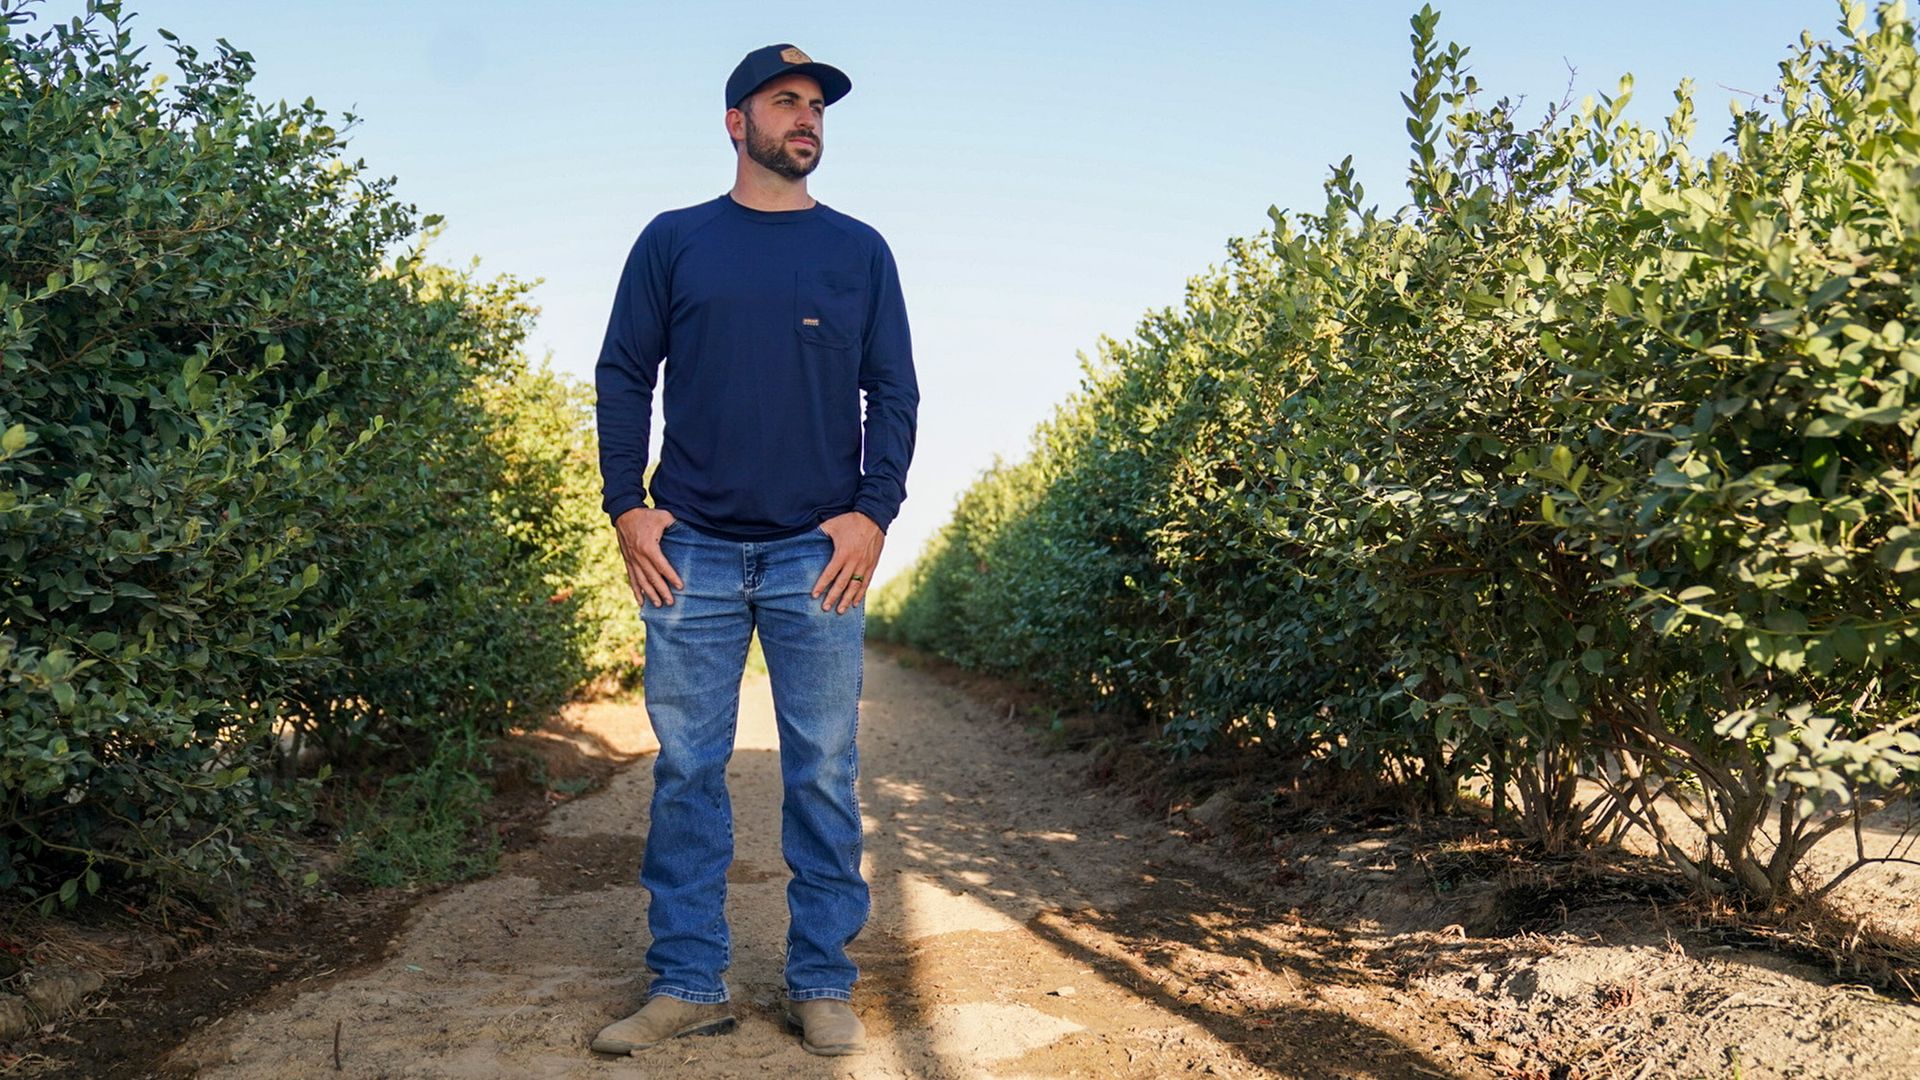
But those dishes held a warning. The dirt that Shan, a postdoctoral research associate in biology and biological engineering at Caltech, was studying contained soil microbes. And those soil microbes were exhibiting a concerning propensity: In dried-out soil, they were evolving to become more antibiotic resistant.
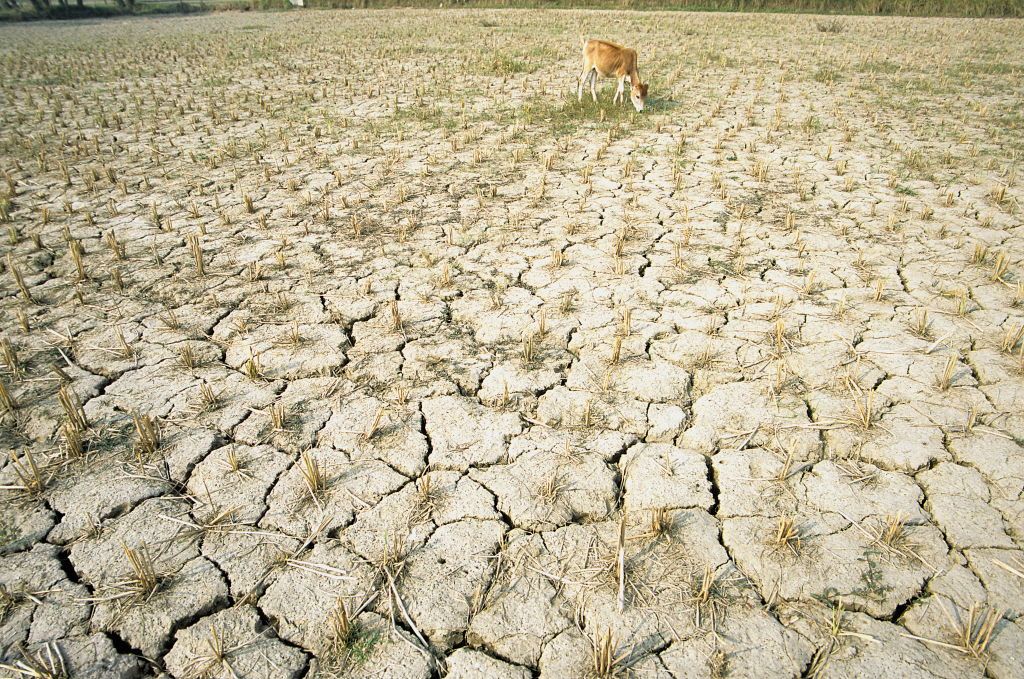
The study describing those findings, published in March, systematically showed that drought conditions could fuel the evolution of antibiotic-resistant bacteria. Most of this resistance is driven by humans' misuse of antibiotics, which spurs bacteria to evolve genes that help them ward off the drugs. But the Caltech study raised a new worry: As many places face increased drought conditions, climate change itself could act as a selective pressure that could supercharge the evolution of these drug-resistant superbugs.
"We can expect to have more resistant bacteria being selected for in certain places around the globe," said Dianne Newman, a Caltech microbiologist and co-author of the study.
Increased antibiotic resistance is just one way that climate change is likely to put new populations at risk of multiple types of infections.
And this increased disease burden will coincide with climate change scrambling supply chains, eroding nutrition and stressing our health in other ways.
"No individual metric really does justice to the overall risk and health and well-being of these multiple stressors being exacerbated all at once and compounding each other," said Marina Romanello, a principal research fellow at the Institute of Global Health at University College London.
Warm-weather disease
In the small mountain town of Bailey, Colorado, which lies at an elevation of 7,740 feet (2,360 meters), May often brings snowstorms that can blanket the ground in white even as the sun starts to bake the plains at lower elevations. But on Memorial Day 2026, the forest floor was dry and ticks quested their way along blades of grass, seeking a blood meal.
A mild winter in most of the country means ticks — and the diseases they carry — are a rising concern. In April, the Centers for Disease Control and Prevention (CDC) reported that emergency department visits for tick bites were at their highest for that month since 2017. That trend isn't a one-off, according to the CDC; as temperatures rise, insects and arthropods can survive longer in the year and farther north.
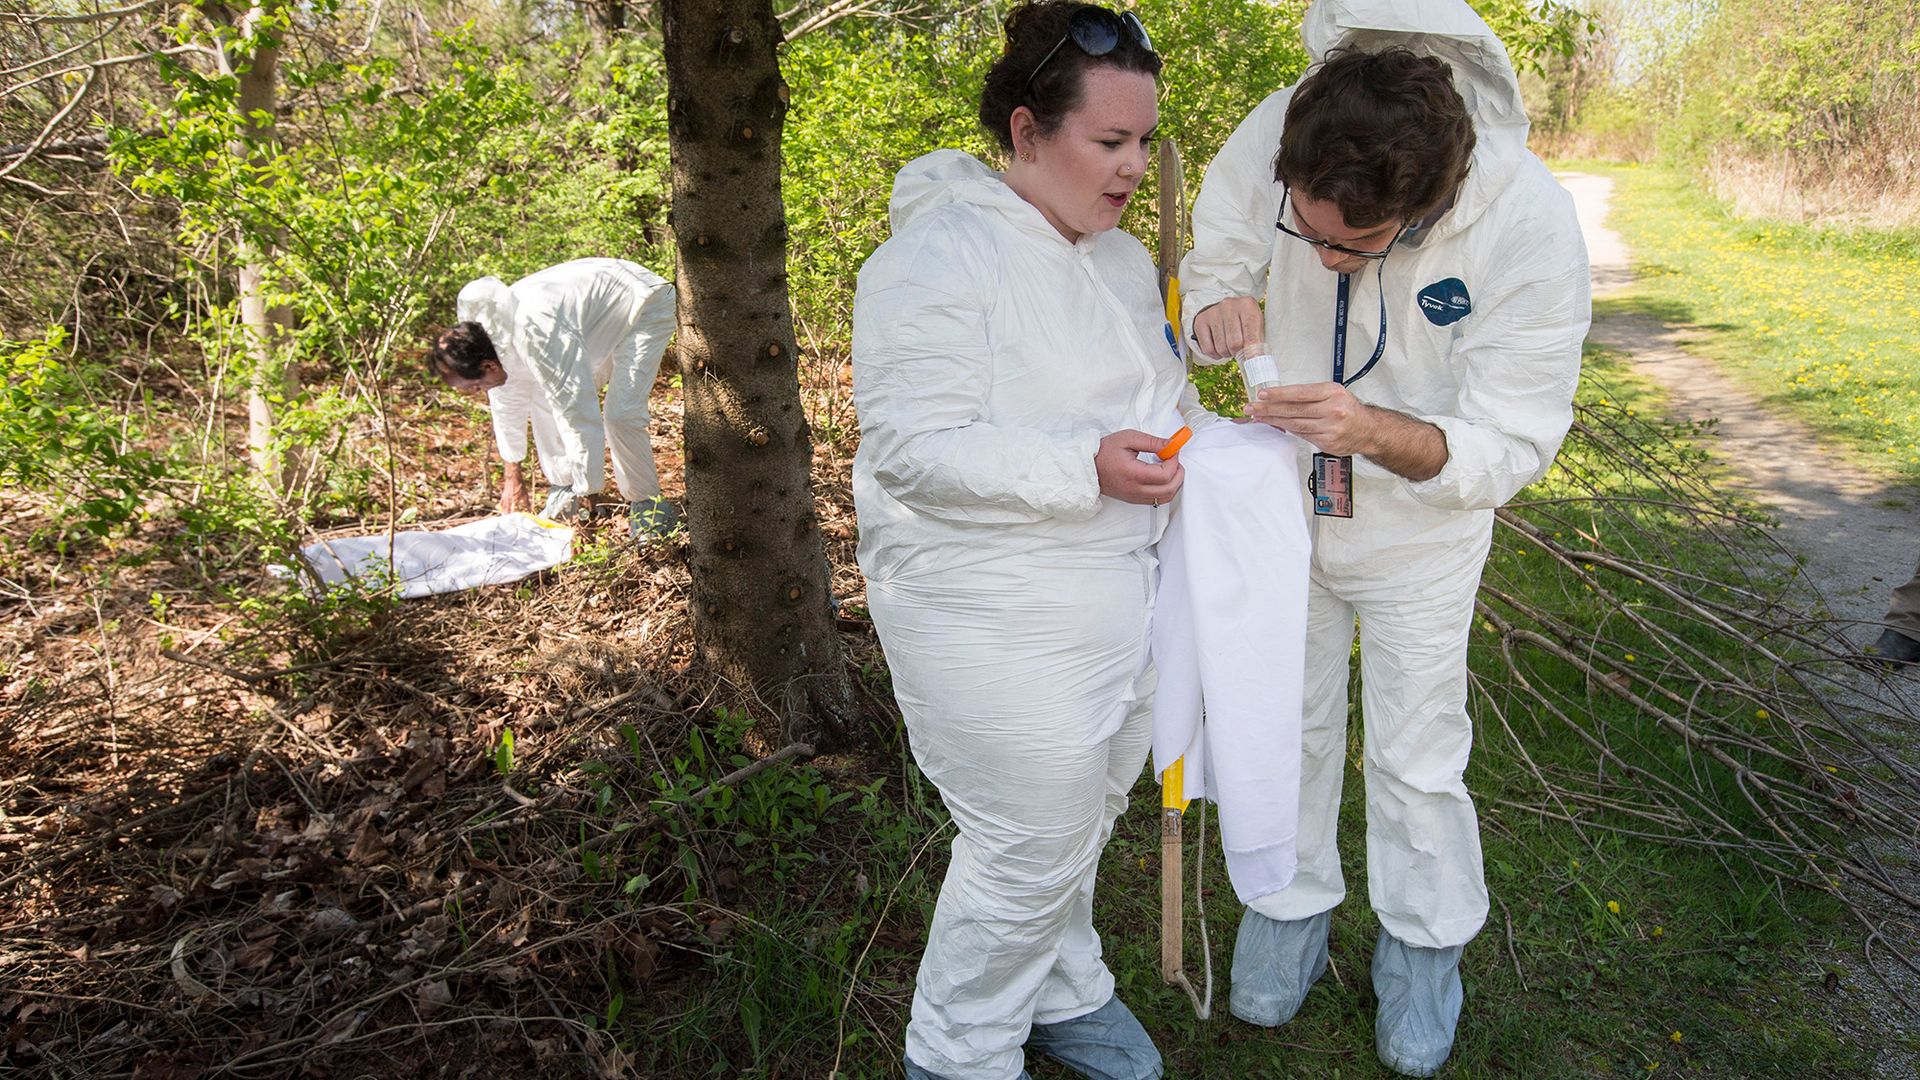
Public health workers in Ontario do a survey for black-legged ticks. Lyme disease, which is carried by the ticks, is spreading in new areas as the climate warms. (Image credit: Bernard Weil via Getty Images)
As a result, vector-borne illnesses such as Lyme disease (spread by black-legged ticks in the Ixodes genus) and West Nile virus (spread by mosquitoes) will become more common in increasingly northerly locations. Already, alpha-gal syndrome, which is not an infection but is transmitted by the Lone Star tick (Amblyomma americanum) and causes an incurable allergy to red meat, is also seeing a dramatic rise as the species expands its range across the Northeast. Positive tests for antibodies to the alpha-gal molecule have increased by 100 times between 2013 and 2024.
Right now, almost half a million people are treated for Lyme disease each year, and the CDC records more than 8,000 cases of other tick-borne diseases annually across the country. It's not clear how this will change as the climate warms. One 2022 study found major increases in Lyme disease only at levels of warming of 6.3 to 9.9 degrees Fahrenheit (3.5 to 5.5 degrees Celsius) by 2100, but that much warming that fast is now considered an implausible scenario. However, the researchers saw a huge amount of uncertainty in the numbers, given the number of variables that affect whether a spreading tick population will transmit more disease, such as how often people go outside or what steps they take to avoid tick bites. Tick-borne illnesses are likely also underreported, so even the true number of illnesses transmitted each year right now is unknown.
But ticks are responsible for spreading 90% of all vector-borne diseases in the U.S., so any trends in the suite of illnesses spread by ticks are likely to affect thousands to tens of thousands of people.
An even more ubiquitous bloodsucker, the mosquito, currently spreads only a few diseases in the U.S. The most common and most serious is West Nile virus, which mosquitoes catch from feeding on infected birds. As of Sept. 8, 504 cases of West Nile virus had been reported in the U.S. in 2026, with 363 of them affecting the central nervous system. And because fewer than 1% of West Nile cases progress to the central nervous system, those numbers likely represent a dramatic underreporting of milder cases, which can cause months of fatigue in some people, in addition to acute flu-like symptoms, such as fever, headache and body aches.
Mosquito-borne illnesses like West Nile are expected to spread more quickly in warming temperatures. Heat helps mosquitoes stick around longer during the year, much like it does for ticks. It also speeds up the transmission and replication of the virus inside the mosquito, since the insects are cold-blooded and thus their metabolism is ruled by the weather.
"Except for places that are already really, really warm, we should expect that the replication rate of the virus inside the mosquito will speed up," said John Drake, director of the Center for the Ecology of Infectious Diseases at the University of Georgia. "That shortens the generation time, and that means we expect there to be more transmission."
Even though mosquitos love water, climate-related drought could ironically nearly triple the number of human West Nile cases in the U.S. over the next 30 years from around 2,000 reported cases (according to CDC data) to between 5,000 and 6,000. That's likely because in drier conditions, more mosquitoes are infected, possibly because birds, the intermediate host of the virus, either congregate more closely with mosquitoes around water sources or breed less readily in drought, meaning the fraction of birds that carry the virus is higher than in more water-abundant times.
Except for places that are already really, really warm, we should expect that the replication rate of the virus inside the mosquito will speed up. That shortens the generation time, and that means we expect there to be more transmission.
John Drake, director of the Center for the Ecology of Infectious Diseases at the University of Georgia
Mosquito-borne diseases long ago eradicated from the U.S. could also resurge with warming temperatures. The southeastern United States will become more prone to malaria and dengue fever transmission under all levels of warming; summer 2026 saw more than 40 locally-acquired cases of dengue fever in Florida. Public health surveillance and disease-control measures have largely stopped those transmission chains, but the likelihood is that society will have to pour more money into beating these diseases back again in future decades. For example, there are malaria vaccines approved for children, but currently, they are recommended only in areas where the illnesses are endemic. If malaria were commonly found in the southern U.S., millions of Americans might need vaccines, including susceptible adults.
"If we were to get endemic diseases like those in the U.S. again, it could become a huge burden and it could be quite costly," Drake said.
Disaster and disease
Flooding is another factor that's exacerbating vector-borne disease under climate change. As climate change worsens, extreme weather events will, too. Because warm air can hold more moisture, many areas will see increased episodes of heavy rainfall and hurricanes will become more intense.
"Flooding creates habitat for these mosquitoes," Drake said.
Disasters also spur the spread of other diseases that are usually quite rare in the U.S., such as leptospirosis, a bacterial infection that spreads from animals to humans via animal urine. Floodwaters may be contaminated by the bodies of drowned animals; in 2022, after Hurricane Fiora hit Puerto Rico, leptospirosis cases leapt by a factor of 3.6 to over 10 cases a week.
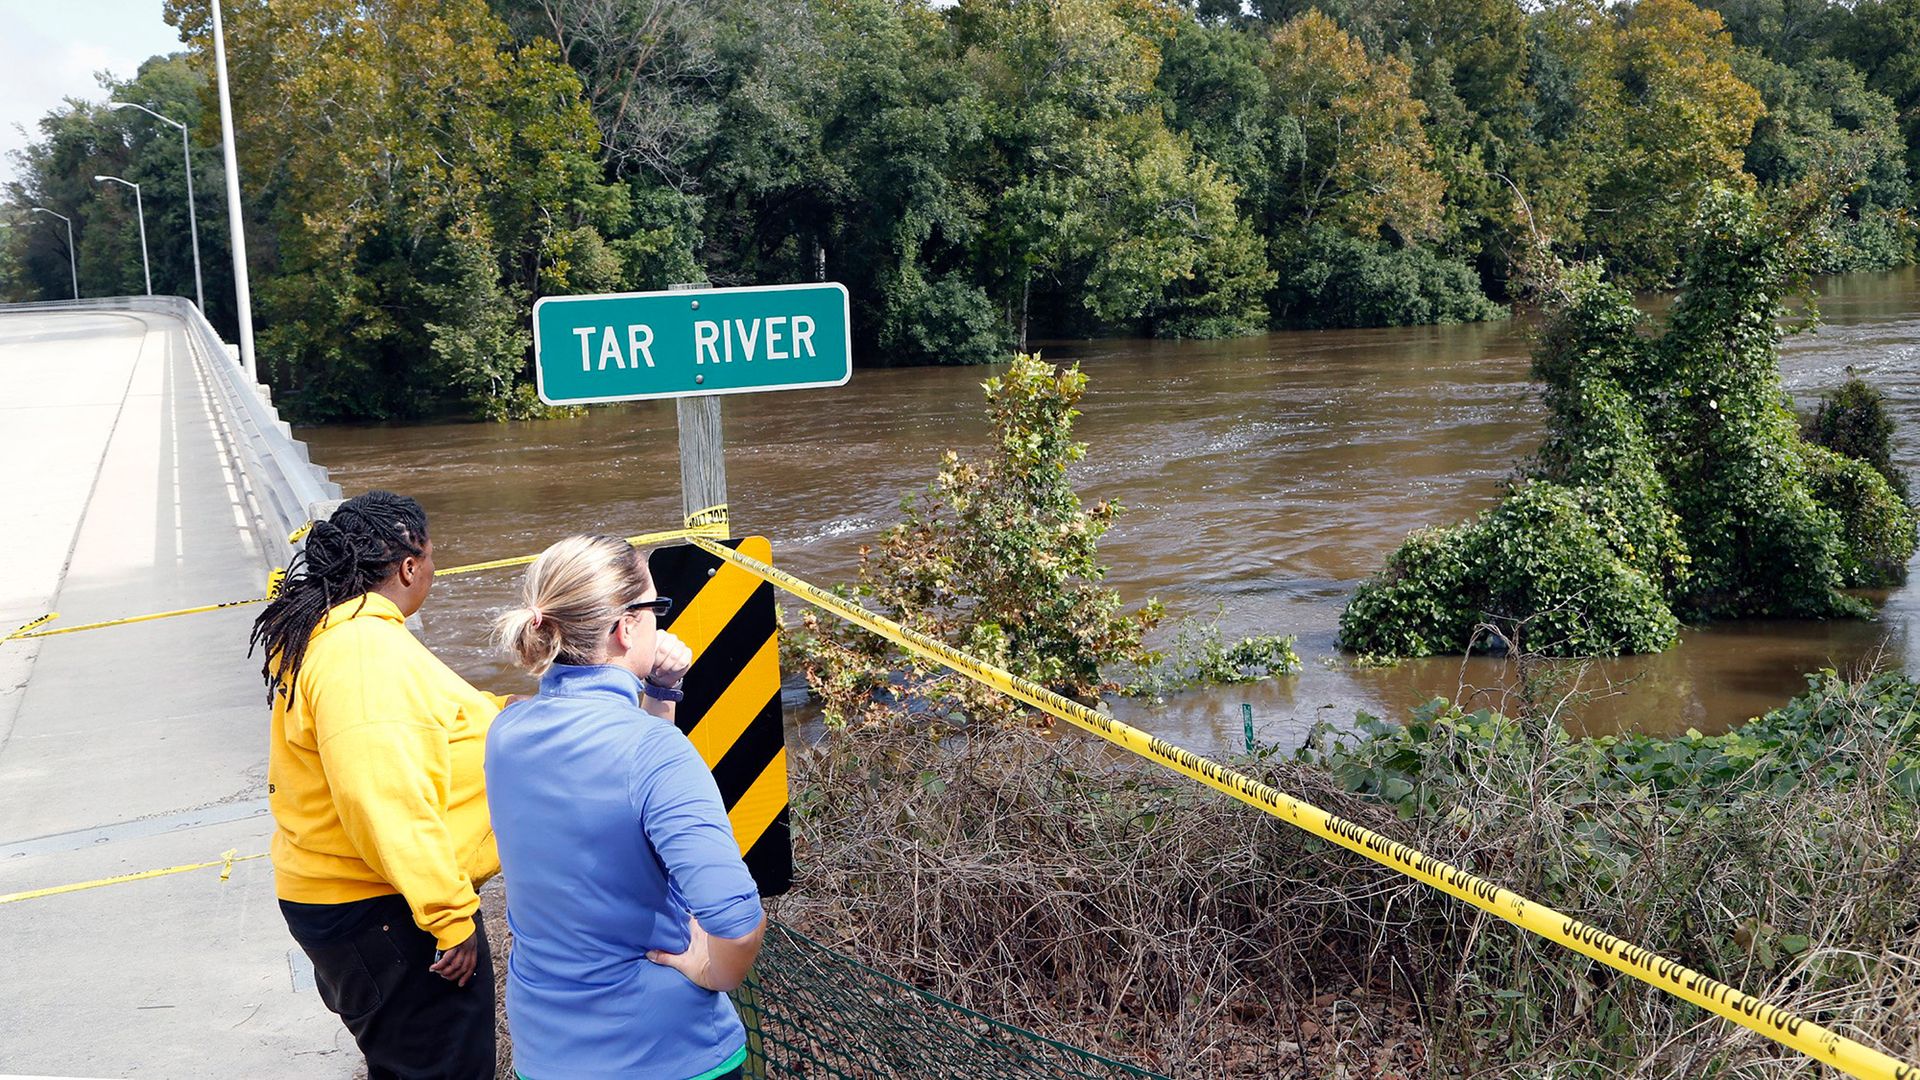
After Hurricane Matthew, emergency visits for gastrointestinal disease increased 11%. (Image credit: Raleigh News & Observer via Getty Images)
After Hurricanes Matthew and Florence in 2016 and 2018, respectively, North Carolina saw an 11% increase in emergency department visits for gastrointestinal illnesses. Black and American Indian residents were the most affected, likely because discrimination over generations has disproportionately pushed Black Americans and Native Americans to less desirable, more flood-prone land, the researchers found.
Cycles of precipitation, drought and subsequent dust storms can spur the spread of Valley fever, a fungal respiratory disease that causes an estimated 700 to 1,100 deaths per year, mostly in the U.S. Southwest. Valley fever is already on the rise, with cases in Arizona, one of the hotspots for the disease, doubling from about 64 cases per 100,000 people in 2005 to 145 cases per 100,000 people in 2022. As the West warms and dries, Valley fever is likely to spread from its stronghold in the Southwest and become endemic in Idaho, Wyoming, Montana, Nebraska, South Dakota and North Dakota, putting millions more people at risk.
The infectious disease risk from natural disasters tends to stack on top of other health problems stemming from these catastrophes. Flooded buildings can harbor mold that can worsen allergies, asthma and other respiratory illnesses. When major storms cause power loss, people turn to generators for electricity, which release pollutants linked to asthma. Though it's often hard to track the effects of these disasters, one study found that flooded regions after Tropical Storm Imelda in Texas in 2019 saw 10% more emergency department visits for asthma than nonflooded regions did.
Moreover, the threat to life and livelihood from these disasters can cause mental health conditions, such as post-traumatic stress disorder, Romanello said. The problems compound on each other, she said; already, she has heard reports from Africa about malaria outbreaks, fed by warming, and health workers struggling to reach the affected regions because flooding, also exacerbated by warming, has washed out roads.
"What is the most concerning aspect is that all of that is happening together, so we're seeing all of this risk being exacerbated at once," she said.
Jace White of Fresno acquired Valley Fever while working on his family farm. Valley fever is predicted to become more common with climate change. (Image credit: The Washington Post via Getty Images)
Antibiotic resistance on the rise
As Newman and Shan's work shows, as spots around the U.S. face new infection risks, existing treatments may become less effective. Their work showed that drought concentrated the natural antibiotics that bacteria make in the soil, making it harder for bacteria susceptible to the compounds to survive. As a result, the microbes with genes for antibiotic resistance did better. The problem for human health is that bacteria are very good at gene swapping, so these soil microbes can easily pass their antibiotic resistance superpowers to bacteria that infect people, their research showed.
"Gardening, breathing dust — that's how it happens," Newman said of human and soil bacteria coming into contact. "We are constantly encountering bacteria in our environment."
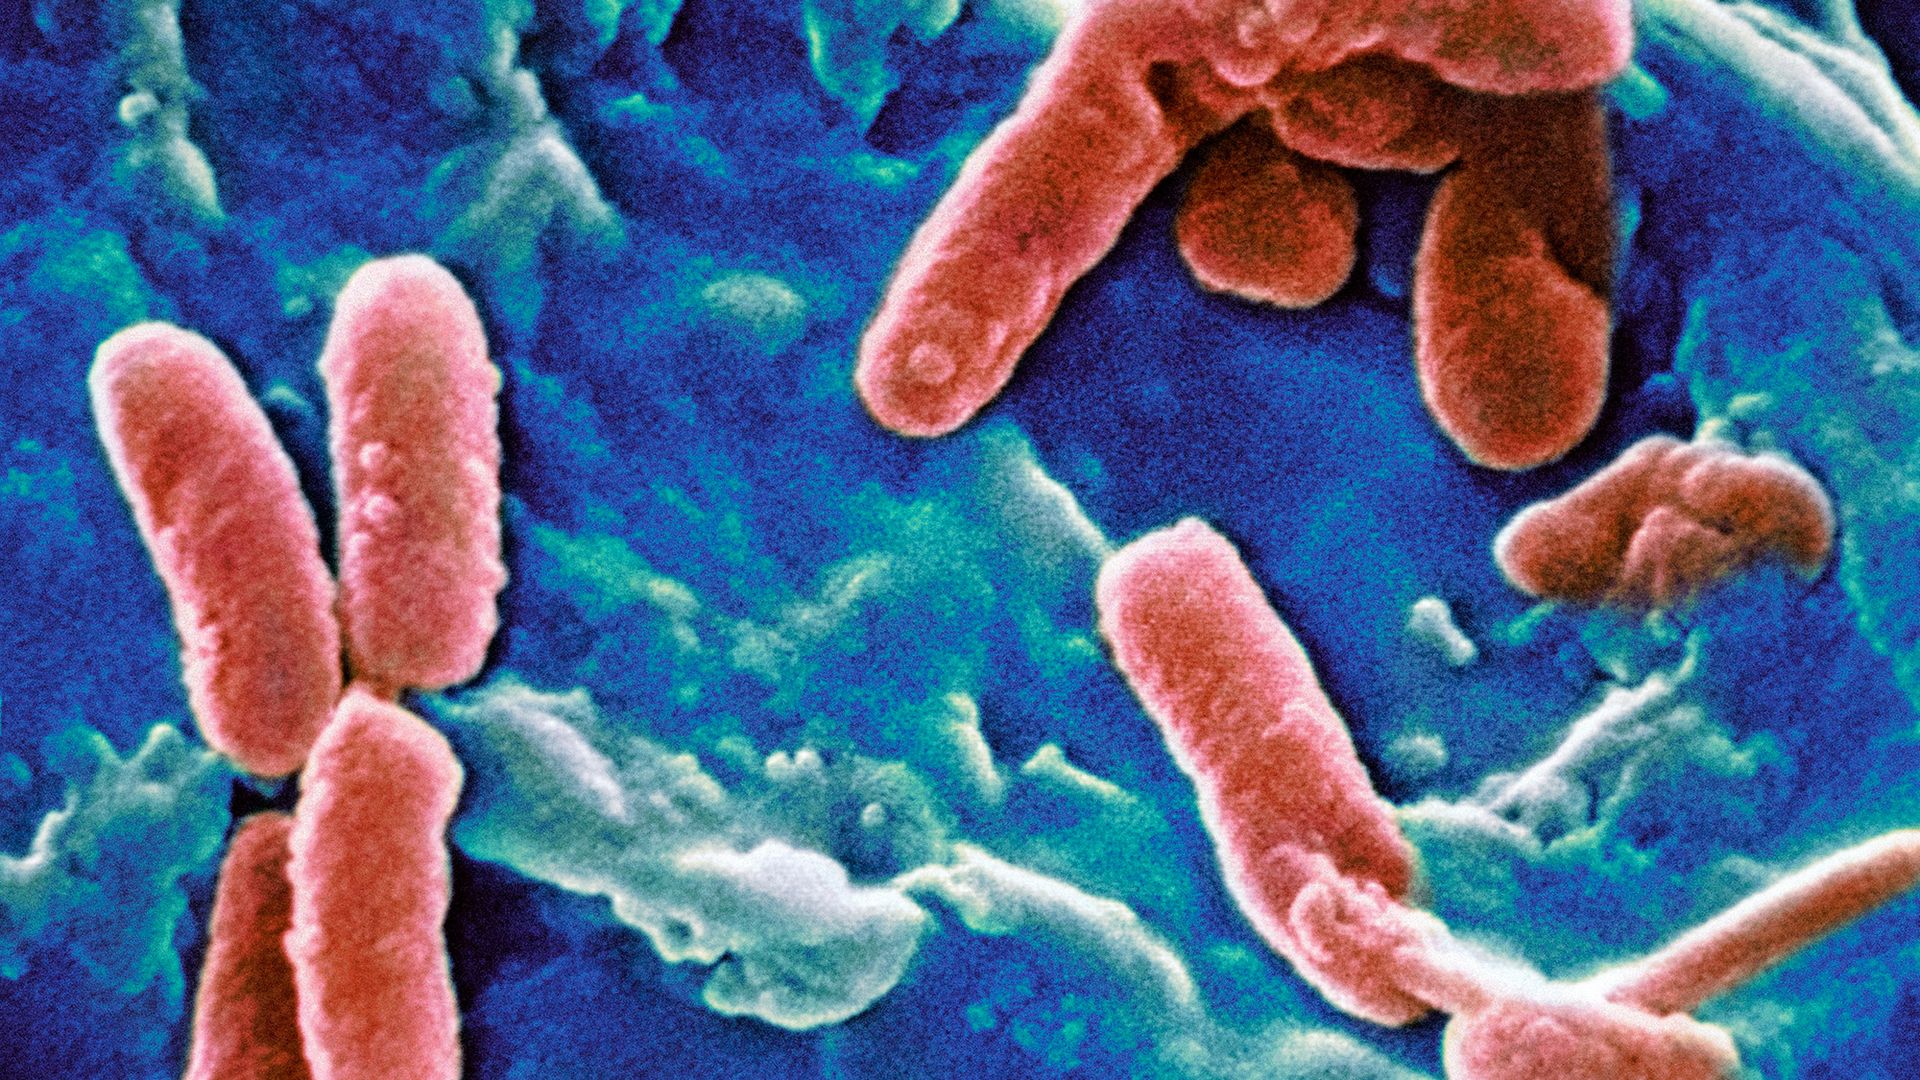
A scanning-electron microscope image of Pseudomonas aeruginosa. Recent research suggests that drought could fuel the rise of drug-resistant versions of such pathogenic bacteria. (Image credit: CDC/SCIENCE PHOTO LIBRARY via Getty Images)
The researchers found an association between drought and antibiotic resistance reported by hospitals.
They aren't the only ones. A recent study on Salmonella, a bacterium that causes about 1.35 million cases of food poisoning each year in the U.S. alone, found that temperature and rainfall promote antibiotic resistance in this microbe. "Globally, climate change was linked to about a 10% increase in Salmonella resistance gene abundance," said study first author Zhen-Chao Zhou, an ecology researcher at the Chinese Academy of Sciences in Beijing. Other microbes show similar effects.
Meanwhile, warmer conditions help bacteria grow faster, adapt to stress and swap resistance genes, Zhou said, while drought concentrates them in limited water sources where they mingle freely. Climate-change-induced flooding can then, in theory, spread the resistant genes far and wide.
Combating the compounding risks requires both public health and climate mitigation approaches, experts say. Not only does the world need to cut greenhouse gas emissions, but people also need to use antibiotics more carefully, Zhou said; improve sanitation practices, such as sewage management, around the world so that antibiotic-resistant strains don't spread as easily; strengthen food safety; and expand disease surveillance. The public also needs to understand that climate change is a health issue, Romanello said.
"When we talk about tackling greenhouse gas emissions," she said, "what we're talking about is a sustainable livable future with healthy economies."
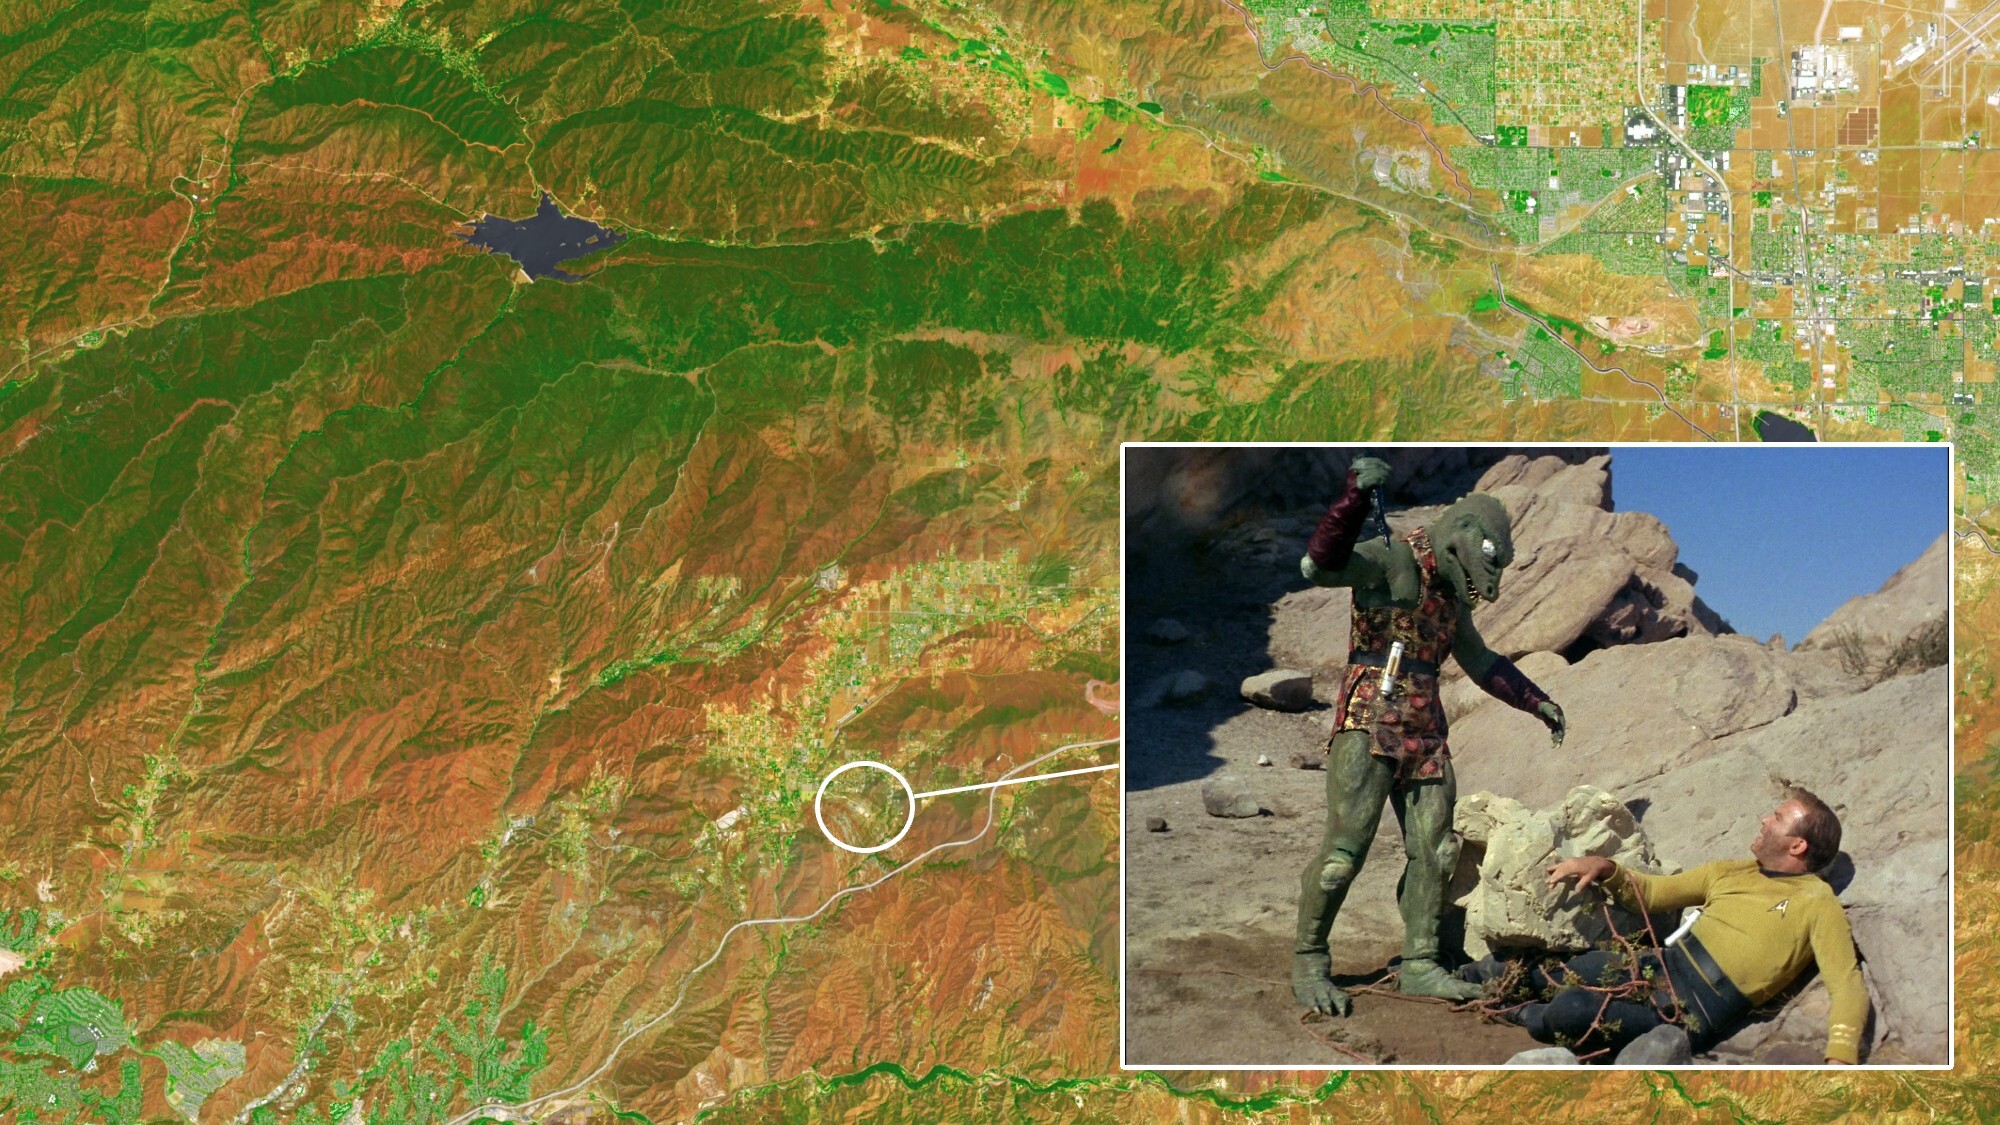
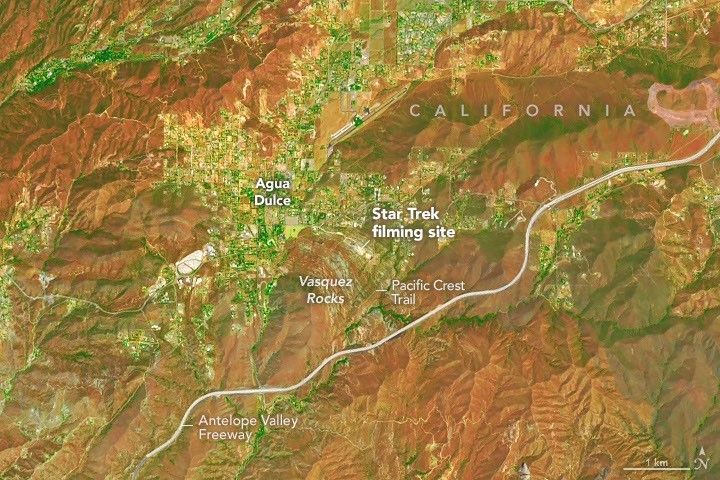
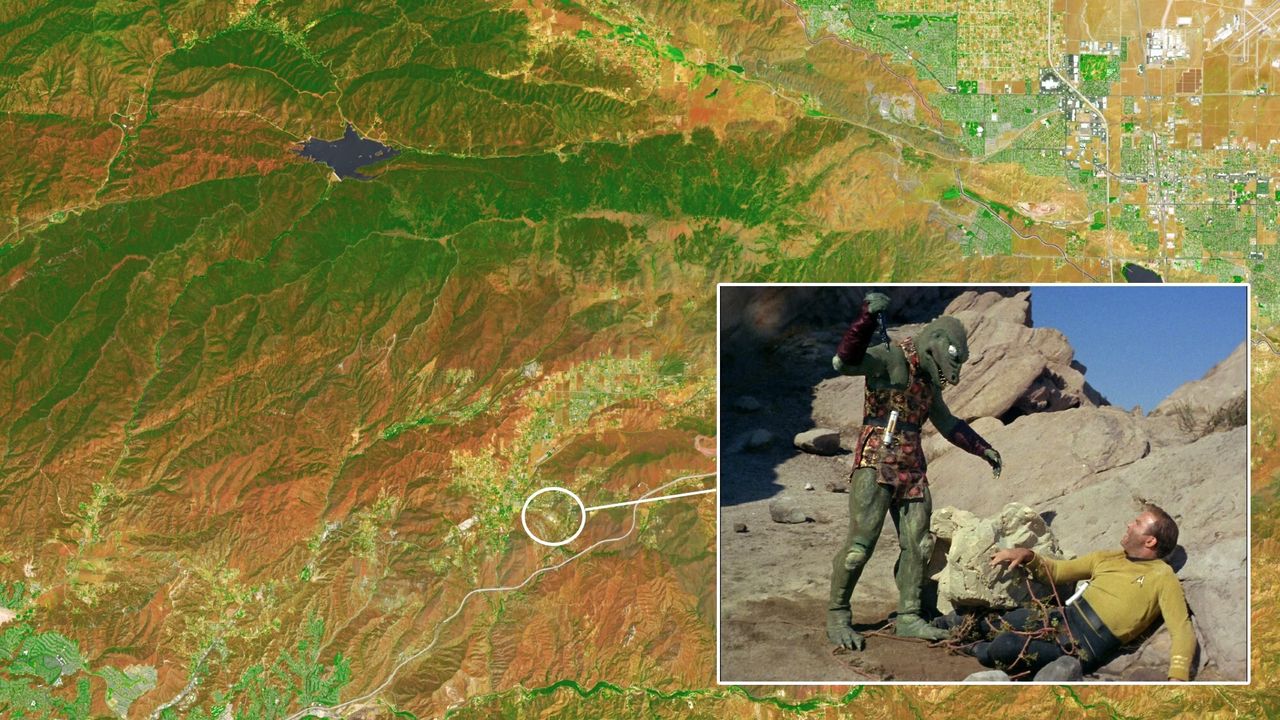
This new satellite image shows Vasquez Rocks in southern California, where Captain Kirk once faced off against the Gorn. (Image credit: NASA Earth Observatory/Michala Garrison/CBS via Getty Images)
Decades ago, Captain Kirk faced off against the Gorn on the uncharted desert planet Metron. But as we can see in new satellite imagery from NASA, that mysterious rocky world can actually be found right here on Earth in California.
What is it?
In this new image captured by the Operational Land Imager (OLI) on NASA's Landsat 9 satellite, you can see the wide variety of rock and vegetation in the area around Vasquez Rocks Natural Area County Park in southern California.
The 25-million-year-old Vasquez Rocks is a magnificent natural area with an incredible range of unique, large rocks jutting out of the ground. In this false-color image, you can see the area in shortwave-infrared and near-infrared wavelengths that show the differences in vegetation across the landscape.
And this location hides some amazing history. Not only is Vasquez Rocks home to incredible rock formations and desert vegetation, it is also where Captain Kirk fought the Gorn in Star Trek the Original Series. It's not a surprise the series chose this location for its infamous fight scene (among many other Trek scenes), as the massive, sun-bleached boulders pointing to the sky and barren landscape give it a distinctly alien feel.
A satellite view of the are around Vasquez Rocks. (Image credit: NASA Earth Observatory/Michala Garrison)
Why is it incredible?
While the rocky landscape of Vasquez Rocks is firmly fixed here on Earth, it has consistently made history as the backdrop to a whole host of iconic science fiction moments.
Indeed, Star Trek is one as Vasquez Rocks has been used for filming in a whole host of Trek episodes. It was even Spock's home world of Vulcan in the films Star Trek IV: The Voyage Home and Star Trek (2009).
But beyond Star Trek, the site has been used for filming sci-fi classics like Galaxy Quest, Battlestar Galactica and Planet of the Apes in addition to a whole host of cowboy movies and more.
It turns out that right here on Earth, we can find perfectly good alien worlds.
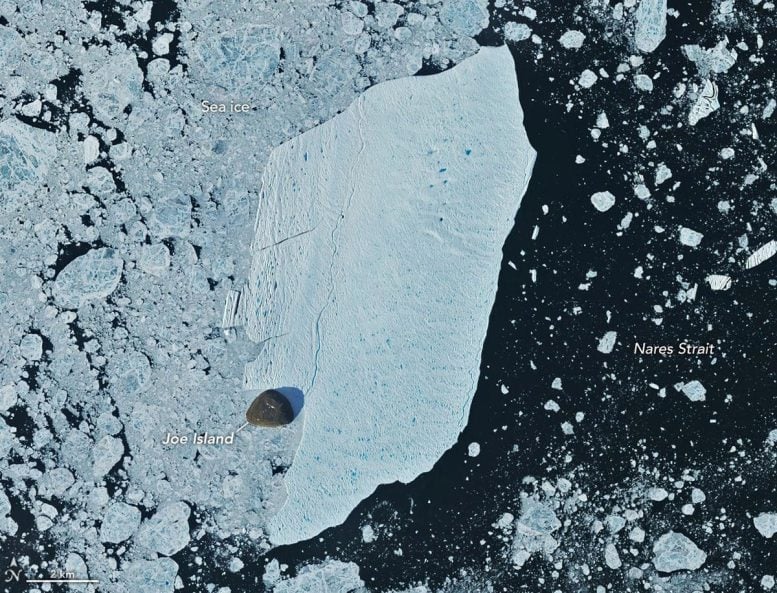
A giant 29-square-mile iceberg broke from Greenland’s Petermann Glacier and survived a collision with Joe Island that might have shattered a more fragile berg. Summer is the busiest time of year for iceberg activity in Greenland’s glacier-fed fjords, and 2026 brought another dramatic example. In August, a huge iceberg separated from Petermann Glacier on Greenland’s [...]
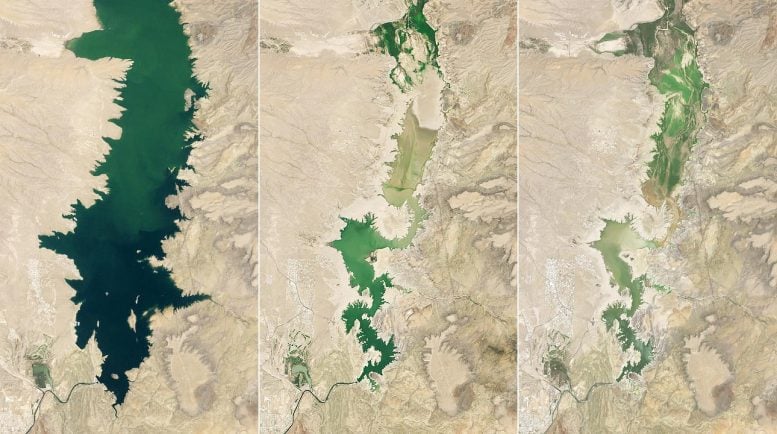
New Mexico’s largest reservoir plunged to just 1.4 percent capacity in July 2026, revealing the dramatic impact of prolonged drought and record early snowmelt. NASA is using satellite data to help water managers understand the shrinking supply and prepare for future shortages. When astronaut John Glenn remarked on the landscape below him while orbiting Earth [...]
Abnormally high temperatures on the Tibetan Plateau triggered two catastrophic rainfall events halfway around the world in California and nearby states in early 2017 and 2023, a new study reports.
This is the first time that researchers have identified this link, known as a climate teleconnection. The results could improve forecasts of extreme weather in the western U.S., which, in turn, could improve warnings for coastal communities and potentially save lives as well as billions of dollars in property damage, the study's authors say.
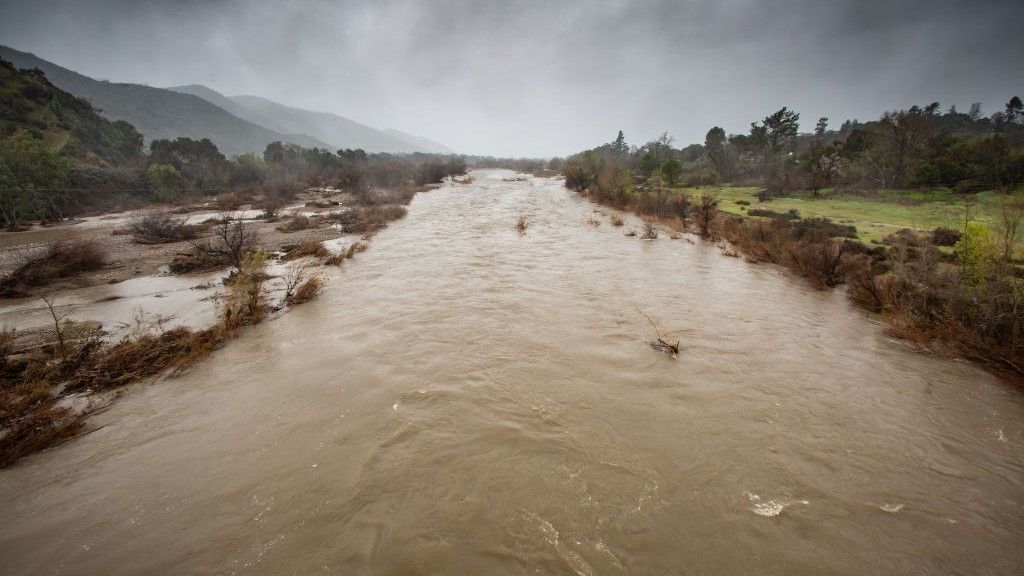
In December 2016 and February 2023, the Tibetan Plateau was warmer than usual for these times of the year. Roughly one month after each of these hotspots appeared, parts of California, Nevada, Oregon, Utah and Arizona received record-breaking precipitation, causing a total of around $6.6 billion in damage, according to the study, and killing at least nine people.
State-of-the-art forecast systems, which rely heavily on ocean conditions like El Niño, failed to predict this extreme rainfall, said study first author Yongkang Xue, a distinguished professor of atmospheric and oceanic sciences at UCLA. The record precipitation occurred during La Niña years, which are typically associated with dry conditions in California and neighboring regions, further complicating the picture.
"This study provides the first evidence from observational data analysis and model simulations that abnormally high early-winter temperatures on the Tibetan Plateau led to stronger atmospheric rivers along the U.S. Pacific Coast, driving heavy regional precipitation," Xue told Live Science in an email.
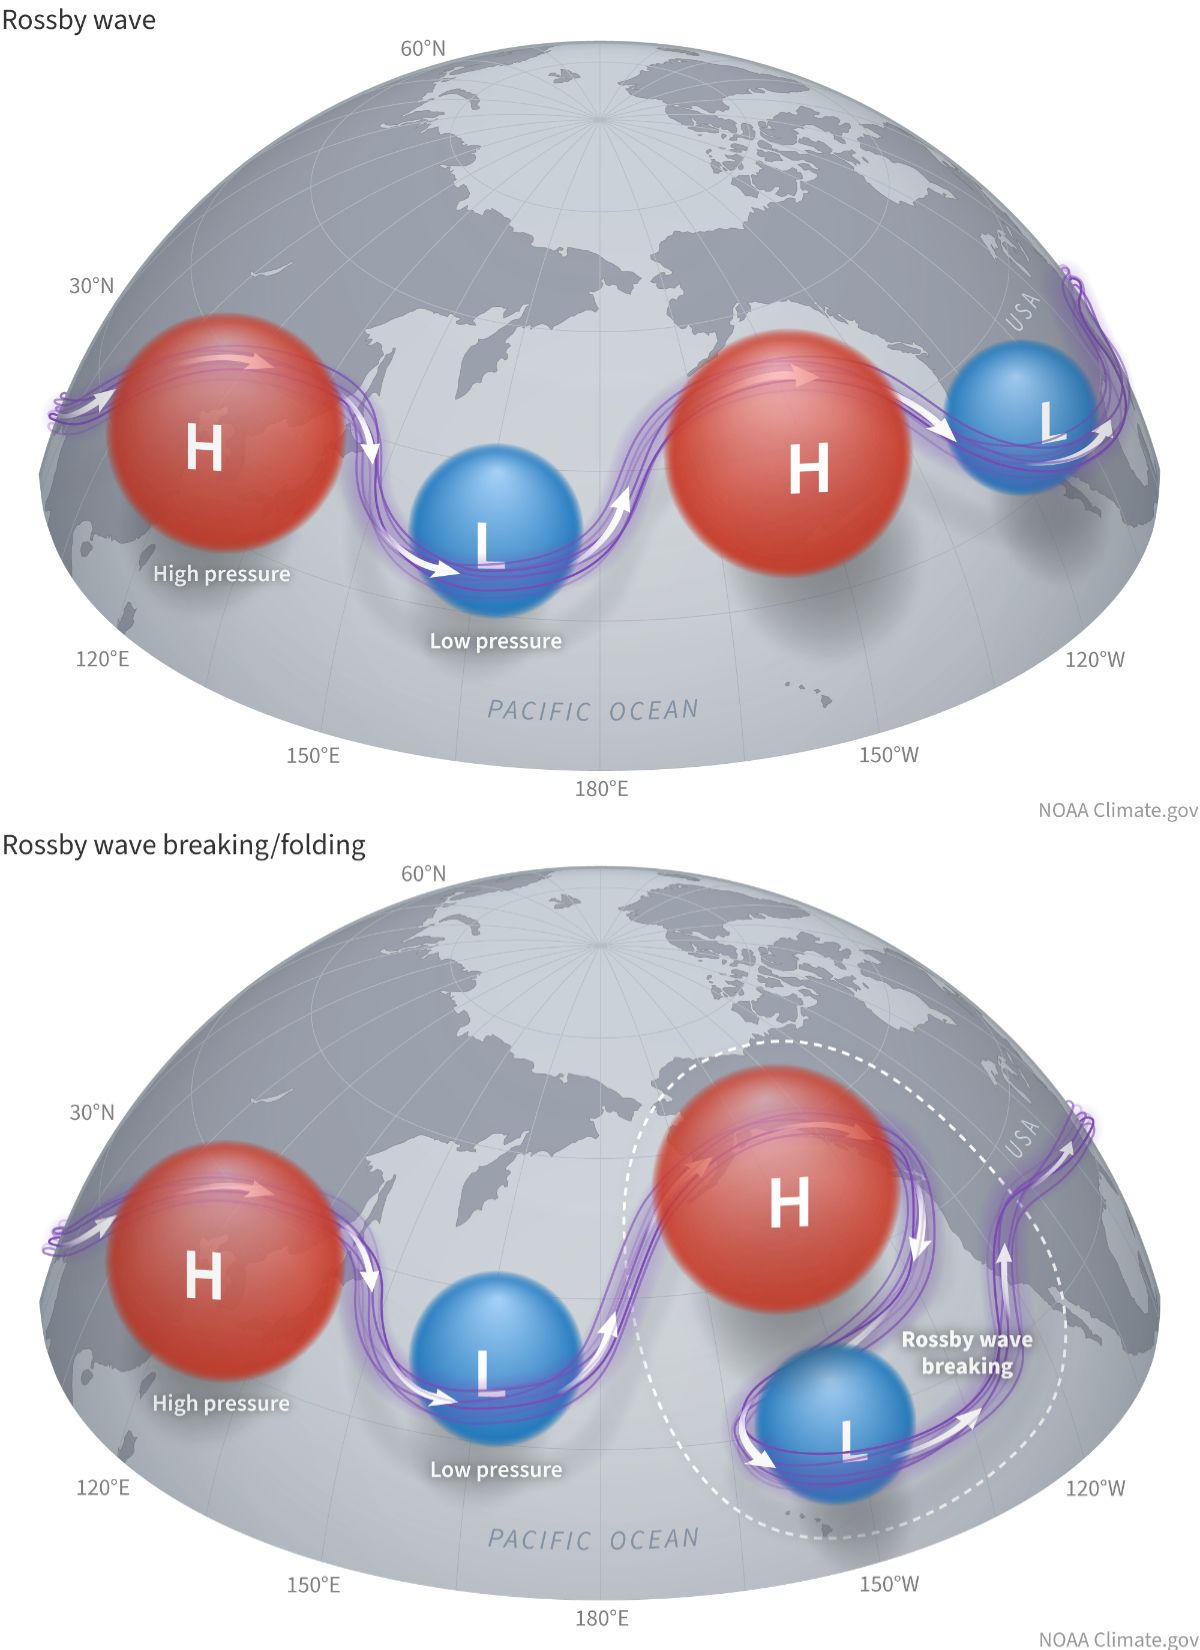
Atmospheric rivers are narrow, elongated corridors of intense water vapor transport. They are key drivers of precipitation and floods in the western U.S., and in this case, they interacted with giant waves in Earth's atmosphere, called Rossby waves, to produce devastating rainfall in the winters of 2017 and 2023.
As temperatures increased over the Tibetan Plateau in late 2016 and early 2023, a strong gradient formed with the regions north and south of the plateau. This generated an atmospheric disturbance that propagated eastward along the jet stream via Rossby waves, triggering what is known as a Rossby wave train between the Tibetan Plateau and the Rocky Mountains, Xue said.
Rossby waves are waves in Earth's atmosphere that wrap around high- and low-pressure systems. When there is an atmospheric disturbance, it can propagate in what is known as a Rossby wave train. (Image credit: NOAA Climate)
A Rossby wave train is a series of waves traveling in the same direction and at regular intervals around alternating high- and low-pressure systems. As the wave trains initiated over the Tibetan Plateau reached the northeastern Pacific Ocean, they suddenly broke, and this supercharged the weather above California and adjacent states, Xue explained.
"Over the eastern Pacific, the wave breaks — much like a towering ocean wave crashing near the shore," he said. "This wave-breaking mechanism reduces static stability and significantly intensifies atmospheric rivers, ultimately driving extraordinary, heavy precipitation along the West Coast."
The findings, published Wednesday (Sept. 9) in the journal Science Advances, are based on complex modeling and analyses of precipitation and surface temperature data, among other observations. The results are part of a new body of research examining the influence of land temperatures on weather patterns, and this is the first study of a winter season, Xue said.
The analysis is a "very specific and impactful case study," said Matthew Huber, a professor in the Department of Earth, Atmospheric, and Planetary Sciences at Purdue University in Indiana, who was not involved in the research. The results build on the well-established idea that extra heat on a mountaintop affects Rossby waves almost as if the mountain had suddenly grown, Huber told Live Science in an email.
Large mountains and plateaus generate waves in the jet stream that are thousands of miles long — "so long that we also call them planetary waves," Huber said. An increase or drop in temperature so high up above sea level adds or subtracts from the atmospheric disturbance that already exists due to the elevation.
"You can imagine the waves in the jet are kind of like a motorcycle rider going off a jump," Huber said. "How far and how high they jump depends on how fast they are going and how big a ramp they are going over."
The models replicated the extreme weather with surprising accuracy, raising hopes that the Tibetan Plateau could be integrated into early warning systems for the western U.S., Xue said. "As similar, though less severe, events become more [frequent] and extreme weather escalates globally, understanding this teleconnection allows forecasting agencies to better warn coastal communities of impending extreme conditions," he said.
Huber agreed that the results could help to better prepare for weather hazards. "This study shows that accurate predictions of weather events in the U.S. West are very sensitive to tiny changes very far 'upstream' and these upstream features are identifiable and traceable," he said.
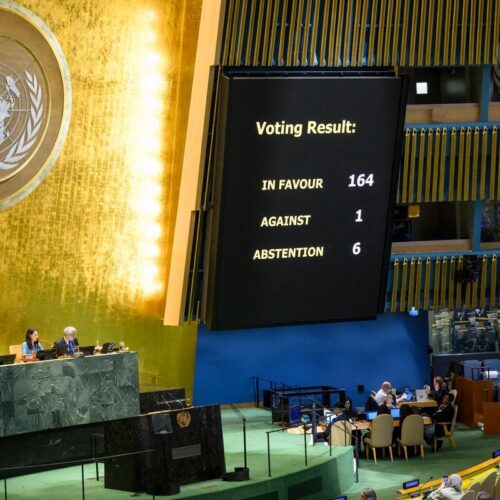
Nearly every country represented in the United Nations General Assembly recently voted in favor of promoting world maps that more accurately show the size of various continents. But the UN resolution is unlikely to change how millions of people regularly see versions of 16th-century Mercator maps depicting skewed continent sizes in navigation apps.
On September 4, the African-led resolution attracted 164 votes in favor, with six countries abstaining from voting. Only the United States voted to oppose the resolution after describing it as a “radical ideological project,” according to UN News.
The non-binding UN resolution does not impose map changes on anyone. Instead, it “encourages governments, schools, international organizations, and technology companies to use the Equal Earth projection and other so-called equal-area maps when relative size matters,” UN News reported. The resolution also encourages teaching about the trade-offs that arise from depicting a spherical planet on a flat map.

 Login