❌

Reading view

Rust preps improved borrow checker for stabilization

The Rust team has announced that it is enabling the Polonius Alpha borrow checker on nightly releases for testing. The team expects to fully stabilize Polonius Alpha later in the year.

The announcement was made in a blog post on August 4. In the blog post, Rust team member Jack Huey said there are no known remaining issues with Polonius Alpha and performance is generally acceptable for stabilization.

Enabling the Polonius Alpha borrow checker on nightly for testing is being done to help find serious performance regressions, unsoundness in the formulation, and diagnostic issues that need to be improved, Huey said. Issues can be reported in GitHub or Zulip.

Developers can disable Polonius Alpha and use the stable NLL borrow checker by passing -Zpolonius=off to rustc , using RUSTFLAGS=-Zpolonius=off, or including the following in a project’s .cargo/config.toml configuration file:

[target.x86_64-unknown-linux-gnu]
rustflags = ["-Zpolonius=off"]

The Polonius borrow checker has been in the works since 2018. In 2023, a new formulation of a the Polonius borrow checker was proposed that required a minimal re-architecture of the existing NLL (non-lexical lifetime) implementation and could be extended to allow more sound code to compile, according to Huey. Stabilization of that implementation has been delayed until now.

The borrow checker is a component of the Rust compiler that enforces strict rules on references, or borrowing. These include ensuring that all variables are initialized before they are used, that the same value isn’t moved twice, that a value isn’t moved while it is borrowed, that a place isn’t accessed while it is mutably borrowed (except through the reference), and that a place isn’t mutated while it is immutably borrowed, according to the Rust documentation.

  •  

What we lose when every engineer can do everything

Four months ago, a front-end engineer on my team looking to make upgrades to a product or feature would have filed a ticket and waited for the infrastructure group to unblock them. They might have lost a day, sometimes a week. Today, that same engineer makes changes themselves. The code is occasionally brittle, but it works, and the end result ships in a fraction of the time it used to take.

That small story is unfolding inside nearly every engineering organization right now. While some celebrate the sudden fact that one person can do the work of five, others are focused entirely on tech industry layoffs. Both perspectives skip the question I find more interesting: What happens to mastery when every engineer can suddenly do everything?

For two decades, we have described strong engineers as T-shaped. The horizontal bar represents breadth, which is a working familiarity across many areas. The vertical bar represents depth, the real command of one domain earned over years. Agent tooling has stretched that horizontal bar wider than ever before. My concern is the vertical bar, which is quietly getting shorter.

Consider what is now possible in a single quarter. With the right agent harness, one engineer can stand up a billing system, a data connector framework, regional and organizational tenancy infrastructure, or a consumption-based pricing implementation. The pull requests pass review. The tests are green. All looks good. But green tests cannot tell you if the person who shipped that work understood why the system needs redundancy in one specific place, where its failure modes are hiding, or which trade-offs the model made silently on their behalf. The pattern recognition that comes from watching systems fail over many years is suddenly weighted differently than it was even 12 months ago. Our industry has not caught up to that shift.

When the interview stops measuring judgment

The first place this surfaces is hiring, a trend that should concern anyone who has built a team. Traditional coding interviews were always an imperfect proxy for engineering judgment, but agent tooling completely obliterates them. If a candidate can produce a working solution in 20 minutes that would have taken two hours a year ago, the exercise no longer measures technical competence. It just measures how well a coder can prompt an agent.

At Thread AI, we have responded by widening what we look at when we interview job candidates. Our process moves across coding exercises, problem decomposition, system architecture, and behavioral components, with the weighting shifting by role. We allow AI assistance only in specific sections because our engineers still need to be able to operate without it. Some of our work happens in secure environments where you cannot lean on an agent to debug for you. What we’re really testing for now is judgment under ambiguity — the ability to notice when an agent’s output is confidently wrong — and the depth to predict where a system will break before it breaks.

Hiring teams that fail to make this shift will fill their rosters with false positives. They will hire people who interview like experts but struggle the first time a system behaves in a way the model did not anticipate. Ultimately, these companies will miss out on top-tier talent, and they won’t discover the misstep until it’s too late.

Confusing velocity with understanding

That brings me to a larger risk: the rise of false expertise as a category of its own. Historically, the reasoning has gone, “I built a proof of concept, therefore I am an expert.” I have watched versions of this appear in technical leadership, in investment decisions, and in policy conversations about AI. It travels well because the artifact looks real. A working demo is highly persuasive, even when the person behind it only half-understands how it functions.

The problem is bigger than one false expert shipping one bad product; an organization can absorb that. The real risk is a generation of consequential decisions being made by people who have confused velocity with understanding. You can already see the cultural scaffolding being built around this with the celebration of the “idea guy,” and the sudden fashion for invoking “taste” as a substitute for knowing how a system actually works. Those of us shaping tooling, hiring norms, and regulations have a narrow window to set better defaults before this pattern hardens into the way the industry operates.

Depth and breadth, held together

This is the path we’ve been walking at Thread AI since before the latest wave of tooling arrived.

To ground this in a specific example: I have spent 15 years building complex systems. I worked at Goldman Sachs through the financial crisis and the early Dodd-Frank infrastructure, moved critical payment systems into the cloud at The New York Times when that ground was still new, and built the system of record for model training and evaluation at Palantir across highly regulated environments in defense, health, and finance. This experience is the superpower that lets me course-correct an agent when it produces confident-but-wrong output.

I felt this sharply not long ago while scoping consumption-based pricing in a single quarter. The agents did an enormous amount of the heavy lifting, and at some point, I realized that my largest contributions to the effort were knowing where the system would fail and steering around it before we got there. I have also seen how organizations have built large teams around efforts like these in the past. Someone earlier in their career or relying purely on AI guidance would not have had that instinct to draw on. That is the part the public conversation keeps missing.

Every engineer at Thread AI, regardless of seniority, is expected to be a builder at heart. Our people own outcomes across compute, data, and the organizational and identity primitives that hold the product together, all without the traditional product-manager and project-manager scaffolding around them. Our model works only because the people in those seats have the depth to know what they do not know, and the breadth to fill the gaps with agents. They use the tooling instead of being used by it.

AI doesn’t replace deep understanding

The core issue facing organizations today is not whether AI will replace engineers. That question has been answered dozens of times this year with varying degrees of nuance, and it has stopped being interesting. The more useful question for anyone running a company is whether we are protecting the people who understand our systems deeply enough to recognize when the machines are wrong.

In our company, the answers have been to move toward explicit end-to-end ownership, and to hire for depth and breadth together rather than treating them as a trade-off. Layoffs dominate the headlines because they are an easy narrative, but they describe a symptom rather than the actual choice in front of us. The real choice is whether we let breadth quietly stand in for mastery, or whether we build organizations that keep human judgment in the loop on purpose.

In an era when software can be generated faster than it can be understood, the companies that hold onto what is human, verifiable, and deeply understood will be the ones still standing when the brittle parts give way.

—

New Tech Forum provides a venue for technology leaders—including vendors and other outside contributors—to explore and discuss emerging enterprise technology in unprecedented depth and breadth. The selection is subjective, based on our pick of the technologies we believe to be important and of greatest interest to InfoWorld readers. InfoWorld does not accept marketing collateral for publication and reserves the right to edit all contributed content. Send all inquiries to doug_dineley@foundryco.com.

  •  

Airtable joins Evernote, Brightcove, WeTransfer and AOL in Bending Spoons portfolio

Bending Spoons has snapped up Airtable to add to its portfolio of software companies, alongside AOL, Evernote, WeTransfer, Brightcove and Vimeo

Airtable made its name as a builder of low/no code database services, aimed particularly at non-technical staff, but is now one of many vendors facing financial difficulties in the face of the SaaS/AIpocalypse. The arrival of AI coding tools, which offer non-technical employees more flexible ways to build business applications, has hit demand for its services.

Bending Spoons bought Airtable in a deal it valued at just $1.285 billion, a far cry from the $11.7 billion Airtable was worth at its peak.

Bending Spoons has built its portfolio by buying once-successful companies like Airtable that have struggled to cope with newer, nimbler competitors or failed to adapt to emerging technologies. Bending Spoons takes these companies, cuts costs and markets them aggressively with the goal of returning them to profitability.

“Airtable is a pioneering brand reshaping how teams organize data and manage critical workflows. We’re committed to investing in Airtable for the long run, and doubling down on its core strength: bringing teams and workflows together in one flexible workspace. We plan to expand what can be done across the full spectrum of work and make Airtable even more valuable to customers at every scale,” said Luca Ferrari, Bending Spoons CEO and co-founder.

  •  

Microsoft releases open-source agent that generates unit tests

Microsoft has released code-testing-generator, an open-source agent for generating unit tests in any programming language, according to the company.

Released July 31, the code-testing-generator agent learns from the user’s repository, then plans, writes, and checks the tests to prove that they work. Currently the agent writes unit tests only. Integration tests, end-to-end tests, browser tests, and performance tests are outside its current scope, Microsoft said.

The agent coordinates test generation using the “research-plan-implement” (RPI) pipeline. First the agent searches the repository for the code that needs tests, detecting the language and test framework and looking for existing tests to guide its work, and finding the correct commands for building and running the tests.

Next the agent chooses the right amount of work from three paths:

  • Direct: Read the relevant code, write the tests, and validate the result.
  • Single pass: Research and plan once, then implement that plan.
  • Iterative: Repeat the cycle to cover a large request or reach a coverage goal.

The agent then plans and writes the tests It starts with simple code and then moves to code with more dependencies, mapping each behavior to a test file. The agent then checks that the generated tests are useful. According to Microsoft, it checks for the following problems before it finishes:

  • It considers small code changes that should make the tests fail.
  • It looks for weak or missing assertions.
  • It checks that every requested scenario has a matching test.
  • It builds the full workspace and runs the full test suite.
  • It confirms that the repository’s test command can find the new tests.

The code-testing-generator agent is available in the dotnet-test plugin in the dotnet/skills repository on GitHub. The plugin can be used in GitHub Copilot CLI and is also available in Visual Studio Code and VS Code Insiders through plugin support, which is a preview feature.

  •  

Meta launches Muse Code for complex software work with persistent AI agents

Meta has released a beta coding agent designed to handle complex software assignments across large codebases.

Available for macOS and Linux, Muse Code uses the company’s new Muse Spark 1.2 model. It includes specialized background agents that remain active throughout a session instead of being created separately for individual tasks.

The agents carry out work asynchronously and decide when to report their findings to the primary agent. Meta said keeping them active reduces repeated information gathering and the need for developer direction during difficult, multi-step tasks.

“Muse Code uses a local event log in which every model call, tool run, approval, and edit is appended,” Meta said in a post, adding that the record “makes the runtime replay-exact and restart-safe” and allows the agent to resume precisely where it stopped after a crash.

Muse Spark 1.2 is available through Muse Code and the Meta Model API, for which Meta announced expanded global access.

Training and evaluation

Meta said it co-trained Muse Spark 1.2 with Muse Code to improve the model’s performance and usability when used with the agent. The training incorporated Muse Code’s tools and agent workflows, while Meta increased the computing resources used for coding and broadened the range of development environments.

The model was also trained on longer assignments, including whole-repository generation and large end-to-end software projects.

Lian Jye Su, chief analyst at Omdia, said Meta’s co-training approach was unlikely to provide a clear advantage because rivals were also developing their coding models and agent harnesses in close coordination.

“Other vendors, such as OpenAI and Anthropic, have been treating harness engineering as part of the training process,” Su said.

Optimizing the model and agent together could improve planning and context handling, but any competitive advantage would need to be demonstrated through better results on enterprise projects while reducing the need for human intervention, said Pareekh Jain, CEO of Pareekh Consulting.

Meta reported that Muse Spark 1.2 achieved an 82.9% pass@1 score on Terminal-Bench 2.1, behind Claude Opus 5 but slightly ahead of GPT-5.6 Terra. On DeepSWE 1.1, the model scored 59.3%, trailing both rivals.

For Terminal-Bench 2.1 and DeepSWE 1.1, Meta evaluated each model with its selected coding agent rather than using the same agent throughout. It also acknowledged that rival proprietary models may have performed differently under tools and prompts designed specifically for them.

Neil Shah, vice president of research at Counterpoint Research, said cross-vendor comparisons would be more meaningful if models were evaluated with third-party tools or within the same agent harness.

“The key metric for CIOs is the pass rate against an enterprise’s own pipeline, which will determine the success of the model-and-harness bundle, or, in this case, Meta’s Muse Spark 1.2 and Muse Code,” Shah said. “This will be the real benchmark.”

Enterprise adoption hurdles

Su said security and governance requirements could slow enterprise adoption, particularly where coding agents must be connected to existing identity systems.

“Many enterprises are still less willing to open up their CI/CD environments for AI tool integration,” Su said.

Shah said companies would need controls governing how agents access repositories, along with records showing how models and agent workflows handle enterprise data. He also cited the difficulty of forecasting token consumption and its effect on costs.

Meta’s pricing structure also creates a data-governance choice. The company said the lower-priced Contributor model may be used to improve its products, while the standard tier is not used for that purpose.

The Contributor tier costs $0.10 per million input tokens and $0.20 per million output tokens, compared with $1.25 and $4.25, respectively, for the standard tier.

“There is also a fear of vendor lock-in and reliance, as it may hurt long-term flexibility and system interoperability,” Su added.

Jain said adoption was likely to begin with narrowly defined, lower-risk work before companies allowed persistent agents to modify critical production code.

  •  

Microsoft Web IQ: Ground your AI agents with up-to-date web data

Microsoft has unveiled a suite of IQ products over the last few months. Work IQ, Fabric IQ, and Foundry IQ build on what Microsoft used to call its “Graphs,” the underlying data architecture that underpins its cloud services. These graphs provided a way to query the data your business uses, treating that data as nodes in a graph database and using the GraphQL API model to extract that data — for example, to pull data related to a specific individual held across the various Microsoft 365 applications.

The IQ suite follows a similar approach, using the same data, but treating it as the sparse vector store needed to provide grounding data for LLM-based applications. By treating the data as a set of embedding vectors, and integrating it with Model Context Protocol (MCP) servers, Microsoft is giving you the necessary tools to tie LLM output to your data, reducing the risk of hallucination and improving accuracy. Using your own data is a key part of delivering effective agents, ensuring they work within your constraints.

Extending IQ to the web

Web IQ, the latest member of the IQ suite, was unveiled at Build 2026. A modernization of the retired Bing Search APIs, Web IQ is an agent-focused web search tool that builds on the massive Bing search index to provide up-to-date general information for use in your applications.

It may seem a little odd to be talking about a web-wide source of grounding data in the context of a suite of tools that exist to improve the accuracy of your AI applications by providing access to your Microsoft-hosted data. However, in many cases you want to link your agent not only to your data but also to related information from the wider world. For example, an agent powering an ecommerce service could use Web IQ and web-based data sources to provide product comparisons. An agent managing stock levels for a product that is weather-sensitive could use Web IQ as a source of weather data, using Bing’s multiple weather feeds and forecasts.

Just as Google Gemini drew on Google Search, Microsoft Copilot began by using Bing search data to provide grounding for consumer chatbots. It’s easy to take a service like Bing and use it with a LLM, as the nearest neighbor search algorithms use semantic vector similarity techniques to find results that look like your query, ranking them according to their proximity to your search terms.

Microsoft has been tuning its search vector index and the underlying technology stack to work with agents, as agents operate much differently than humans searching the web or querying a chatbot. Providing web search capabilities to agents means having to deal with persistent queries, as the agent hunts for the information it needs, refining queries and applying reasoning algorithms to develop the response it needs. LLM inferencing requires quick responses that deliver large amounts of data, working with queries that go far beyond the one-word or two-word requests that are typical of humans.

More than the training weights

Using Web IQ gives you access to up-to-date information, beyond the training data used to build and weight an LLM. Bing’s crawler works within the standards developed by the search engine industry, obeying meta tags and using its own algorithms to crawl regularly updated websites more often. Bing’s crawler ensures that data is both fresh and being used appropriately, with a focus on quality rather than quantity.

Providing access to web data is only part of Web IQ. Microsoft is using Web IQ to host its own models to manage embeddings, ranking, and content extraction, all running on the company’s global hyperscale platform. The intent here is to use only a limited number of models, to keep the system performance high while aiming to deliver accurate results. The Web IQ models are different from those used to deliver search results to humans, as they’re designed to deliver responses that are suitable for LLMs to use for reasoning.

The underlying search system is based on the DiskANN algorithm developed by Microsoft Research, which allows fast search without requiring enormous amounts of in-memory data access. This approach has been extended to manage information retrieval at scale, building on Microsoft’s distributed systems architectures, to support the demands Microsoft is seeing from agent-based systems. At the same time, it must respond to the rapidly changing economics of inference, where token costs now demand the best possible output from the fewest tokens.

To meet those economic demands, the Web IQ platform doesn’t deliver whole documents to querying agents. Whole documents can lead to expensive inference further down the chain, as LLMs process results repeatedly to drive the agent workflow. Instead, Web IQ structures the information retrieved from the underlying search engine data, delivering what Microsoft calls “structured evidence objects” as well as passage-level information from unstructured text documents. This should result in a much higher signal-to-noise ratio than simply querying a search engine, with a focus on delivering information that lets agents work using fewer tokens.

Using Web IQ in your agent code

The API for Web IQ is a standard REST call, delivering a request object to the Web IQ endpoint. Along with your API authorization key, you will send a query, a set of parameters that control the number of results returned, the language and region used, and the maximum size of the responses and the format used. Responses can be returned in text, HTML, or markdown formats, as well as extracted passages that are selected for context. All other options return the full document, so can be more expensive to use. Markdown is an interesting alternative, as it can be used as the basis for giving agents semantic memories.

Results include important contextual and citation information, including web page titles and URLs, as well as data about when the site was last crawled and how stale the underlying information is. This can be used to improve grounding and provide more information that can be included in formatted responses — much in the same way as Bing’s Copilot displays context in the form of footnotes in its responses.

Responses to video searches include text descriptions. If these aren’t provided as part of the original web content, they will be generated by an LLM. The same approach is used for image searches, with both offering the same contextual cues as the web search API. If you don’t care about the type of data being returned, you can choose a “classic search,” which will return text, images, video, and news.

Supporting autonomous agents

Microsoft provides LLM-ready documentation for the Web IQ service, with an llms.txt file and an OpenAPI description. These allow AI tools to discover Web IQ capabilities and include them in workflows as part of autonomous operations, so that agents and other AI applications can implement grounding calls to Web IQ whenever user interactions require them. The API descriptions include errors as well as the structure of a standard 200 response.

As Web IQ is designed for use by modern agent frameworks, the Web IQ API is available through an MCP server. The Web IQ MCP server exposes tools that map to API calls: web, videos, news, and images. They also include a browse option, which lets you pull content from a target URL. The service can be configured with a standard JSON file and requires an API key to control access and manage billing. If your account doesn’t have access to a specific tool, then it won’t be available from inside the MCP server.

If you’re building an agent and you want to evaluate the Web IQ MCP server, it can be added to common coding agents, such as the GitHub Copilot CLI. You can then test it out using familiar tools and generate code that can be dropped into applications via your choice of development tooling. Queries sent to the Web IQ MCP server use the same syntax as REST calls, without having to construct the calls yourself. Working with the MCP server allows you to connect Web IQ to your choice of agent framework, relying on its built-in MCP methods to reduce the code and maintenance overhead.

Web IQ is not for human interactions; Microsoft provides an alternative “Grounding with Bing” service for chatbots. Instead, Web IQ is a tool for agents, providing necessary background information that helps keep results fresh and relevant. It’s easy to use, fast, and, above all, cheap, which makes it an ideal tool for modern inference platforms built around Microsoft Azure’s AI tooling.

  •  

Java 28 starts to take shape

Java Development Kit (JDK) 28, a non-LTS (Long-Term Support) or “feature release” of standard Java due in March 2027, has started to take shape. Features listed for JDK 28 now include a preview of value objects, switching the default mode of the Shenandoah garbage collector to generational mode, and a preview of strict field initialization in the Java Virtual Machine (JVM).

As a non-LTS release, JDK 28 will be backed by six months of support by Oracle.

The three features currently targeted to JDK 28 include the following:

  • Introduce value objects, which are immutable and lack object identity. Value objects are distinguished by the values of their fields, and can be represented by the JVM in ways that improve performance. A goal of the feature is to give developers a programming model for immutable data in which the == operator, and all other operations, distinguish objects by the values of their fields rather than their identities. Value objects is a preview language and VM feature.
  • Switch the default mode of the Shenandoah Garbage Collector (GC) to the generational mode and deprecate the non-generational mode, with the intent to remove it in a future release. Goals include signaling the intent that future development will focus on generational mode, and reducing the maintenance cost of supporting two different modes. However, it is not a goal to remove non-generational mode at this time.
  • Introduce strictly-initialized fields in the JVM. Such fields must be initialized before they are read, thus default values such as 0 or null are never observed. For strictly-initialized fields that are final, the same value is always observed. A goal is offering designers of JVM-based programming languages a model for field initialization, which has stronger integrity guarantees than the present model. This is a preview VM feature.

The predecessor to JDK 28, JDK 27, is due September 15. JDK 27 also is a non-LTS release that will be backed by six months of support by Oracle.

  •  

Visual Studio Code 1.132 advances built-in dictation

Visual Studio Code 1.132, the latest version of Microsoft’s popular, open-source code editor, has been released. The brings improvements to built-in dictation, side chats, and support for commenting on web elements in the integrated browser.

VS Code 1.132 was released August 5. The update can be downloaded for Windows, Linux, and macOS at code.visualstudio.com.

With VS Code 1.132, the built-in multilingual dictation function lets developers dictate in multiple languages using an on-device model that follows language preference or detects the language automatically. The built-in dictation converts speech to text in chat inputs, editors, and terminals. Dictation now uses multilingual Nemotron 3.5 as the default on-device model. Plus, terminal dictation now applies shell-aware cleanup, so spoken commands preserve shell syntax.

Also in VS Code 1.132, developers can open a side chat by typing /bt in the chat input. A side chat shares the context and prompt cache of the primary chat, but allows developers to ask the agent questions about the current turn without interrupting the turn. Similarly, developers can select text in a chat response to ask contextual questions about that response.

Other new capabilities and improvements in VS Code 1.132:

  • The integrated browser adds support for selecting web page elements and annotating them with agent feedback. Users can trigger this mode by using the workbench.action.browser.addElementCommentToChat keyboard shortcut.
  • Active development continues on the agent host, a new VS Code feature that lets users connect to the same agent session from multiple VS Code windows. The agent host runs agent harnesses such as Copilot, Claude, and Codex in a dedicated process based on the Agent Host Protocol (AHP).
  • In the previous release, Microsoft introduced the hybrid Markdown editor, which combines rendered Markdown with in-place editing and agent-actionable comments. In this release, Markdown diffs can be opened in the hybrid Markdown editor. 
  • Expanded terminal output in chat now reflows to the available width as the view is resized. Previously, output used a fixed width, which caused lines to wrap too early and left unused space in wider views.

  •  

Five ways to evaluate AI agent orchestration platforms

AI agent orchestration platforms coordinate role-based and task-based AI agents, along with the tools, data, and people they depend on, into multistep workflows. These platforms are highly important for organizations scaling from handfuls to thousands of AI agents running in production.  

Two open standards do the connective work: MCP (Model Context Protocol) gives agents governed access to tools and data, while A2A (Agent2Agent) lets agents discover and delegate to one another, including agents built on other platforms. The orchestration layer sits on top, adding the routing, shared state, guardrails, governance, security, and observability needed to run workflows that range from fully autonomous to human-in-the-loop.

AI orchestration platforms may be the hottest AI technology of the year. In researching this article, I identified more than 60 commercial and open source platforms that businesses can use as a control plane to manage work between AI agents, people, and automations.

Like data fabrics and automation platforms, I suspect enterprises will utilize more than one AI agent orchestration platform. Platforms are being released by hyperscalers and solution providers in enterprise SaaS, process automation, customer experience, data management, AIops, and IT infrastructure. Development-centric platforms include open source, commercial, and no-code integration solution providers.

Here are five considerations when reviewing AI agent orchestration platforms.

1. Observable control, oversight, and trust

AI agent orchestration platforms are non-deterministic and leverage AI capabilities to coordinate responses and actions across AI agents. One area to evaluate is how administrators implement controls and guardrails over which AI agents can coordinate with others and under what circumstances. Additionally, platforms should also have controls on when and where people should be involved before taking action.

“CIOs should focus on how the AI orchestration platform clearly applies controls over autonomous decision-making,” says Heather Richards, global vice president of go-to-market strategy at Verint. “Ideally, the platform makes it easy to define who or what can take actions, how decisions are approved, and where accountability sits when something goes wrong. If orchestration doesn’t have built-in governance, visibility, and human override, it will scale risk faster than it scales value.”

Observable AI agents are primary capabilities for tracing how they interact and where decisions are made. But even more important is to review how platforms govern access to the context layer, which can include retrieval-augmented generation (RAG) for language models, knowledge graphs, and semantic layers.

“When evaluating an AI orchestration platform, organizations should consider whether governance and observability were built into the architecture from day one,” says Caitlin Schuman, director of AI strategy and customer innovation at Presidio. “A strong platform should make it clear what context is being used and should have a control layer that routes work across systems, agents, and humans.”

Deploying trustworthy AI agents is important for gaining employee adoption. Charles Crouchman, chief product officer at Redwood Software, suggests evaluating how an AI agent orchestration platform establishes trustworthy operations with enterprise resources. He recommends asking these five questions:

  • Can it connect to the systems actually running your business?
  • Can it be trusted to execute mission-critical logic across your ERP, supply chain, and finance platforms?
  • Does it provide deterministic guardrails for non-deterministic AI, so agents can’t go rogue in production?
  • Is it model-agnostic, so you’re not locked into a single LLM or agent framework as the landscape shifts?
  • Can you govern at scale with full audit trails, observability, and accountability?

“Validating these answers moves you from disconnected AI  reasoning to real execution, empowering you to take the next step towards an autonomous enterprise,” says Crouchman.

2. Secure and resilient operations

AI agent orchestration platforms centralize a growing number of operational workflows, so it’s important to evaluate whether their security, performance, reliability, and resiliency meet compliance and non-functional requirements.  

“Deploying agents is the easy part; the hard part is ensuring they operate safely, consistently, and in coordination with the people and systems around them,” says Daniel Meyer, CTO at Camunda. “Orchestration platforms should enforce controls between an agent’s decision and its action, handle long-running processes without losing state, and maintain a full audit trail natively.”

Organizations should also consider how platforms support agentic ops practices for identity management, monitoring, AI agent accuracy, and incident management.

“Don’t just seek solutions that coordinate workflow or handle the life cycle of an agent; also seek solutions that get the answers agents need faster, with more accuracy, all while meeting essential security and compliance requirements,” says James Urquhart, field CTO and technology evangelist at Kamiwaza. “A platform that securely coordinates context gathering and result formulation across widely disparate infrastructures and data sources is essential, not only to the performance of AI in the enterprise, but also to its agility.”

3. Integrated testing and feedback

Testing AI agents requires validating changes before deployment, just as with continuous testing for applications and APIs. But it also requires evaluating prompts, responses, and actions in production and ensuring that agents aren’t drifting from expected parameters or going rogue. One area in which AI agent orchestration platforms differ is how they support testing AI agents, monitoring them in production, and providing a centralized source of feedback to support accuracy improvements.

“When selecting an AI orchestration platform, don’t overlook where the software it produces actually gets tested and validated,” says Jean-Philippe LeBlanc, senior vice president of engineering at CircleCI. “AI can accelerate every stage of development, but without rigorous, automated validation integrated into the delivery pipeline, you’re compounding risk at the same rate you’re compounding velocity.”

Armando Franco, senior director of cloud and platform modernization at TEKsystems Global Services, says, “The criterion that actually matters is whether continuous outcome evaluation is a first-class capability of the platform itself, because without it, iteration speed collapses and the program stalls.”

4. Interoperability and open standards

MCP and A2A are two ways AI agent orchestration platforms support open standards and enable connecting to an ecosystem of agents. Many platforms also allow developers to select and replace the underlying AI models and to choose from a range of AI code-generation tools. These flexibilities ensure teams can optimize around performance, accuracy, compliance, costs, and other future considerations.

“When evaluating an AI orchestration platform, we look first at composability and interoperability,” says Rajesh Arora, chief data and analytics officer at Principal. “The real test is not how many features it offers today, but whether it can connect models, data sources, agentic solutions, and workflows in a way that adapts to our AI strategy, tech stack, and changing business needs.”

Other interoperability criteria to review include the platform’s AI agent cataloging capabilities, how permissions are configured dynamically, and whether prebuilt connectors are available for the required integrations.

5. Vendor viability and road map

Leaders recognize that AI is currently reshaping business more than driving transformation. To be successful, organizations require AI governance that keeps up with strategy and doesn’t lag too far behind. The same is true for AI agent orchestration platforms, so it’s important to review their release notes and road maps to see whether providers strike a reasonable balance between innovation and governance.

“The right orchestration platform provides a unified policy layer that follows work across agents, workflows, and AI tools, enabling your teams to build freely while IT and security maintain full visibility at the action and output levels,” says Brandon Sammut, chief people and AI transformation officer at Zapier. “If your governance can’t keep pace with how fast your people are building, you’ll either slow them down or lose sight of what they’re building.”

Since AI agent orchestration platforms are a new category, technology leaders should partner with their financial, legal, and compliance colleagues to assess vendor viability risks. In addition, reviewing customer adoption and support capabilities is important as top solution providers will continue to evolve their platforms.   

“A mature provider offers both a stable platform and the customer support you’ll need, and with a large customer base, they’ve already hit countless edge cases that can smooth your own implementation,” says Hannes Hapke, director of the 575 Lab at Dataiku. “Assess maturity by looking at funding and financial backing, the clarity and consistency of their public road map, and the size and activity of their community. An engaged user base, active forums, and a healthy ecosystem of integrations all signal a provider that will still be standing when you scale.”

Many organizations are still early in adopting AI agents and transitioning proofs of concept into production. But for those deploying a growing number of AI agents across many platforms, selecting an AI agent orchestration platform enables scaling workflows, operations, and governance. 

  •  

A trip down shareware lane

I hope you’ll indulge me this week as I take a break from my usual rantings about agentic coding and meander down memory lane.

I learned to code BASIC in the mid-1970s at my progressive junior high school. In math class. We took Fridays to learn about line numbers, loops, statements, and the amazing GOSUB, which was as close as we got to a function call. It strikes me that it was pretty early in the whole tech world to be teaching seventh graders to program, and I feel lucky.

Coding faded into the background for me through high school, but soon afterward the arrival of Windows 3.0 and modems made writing software fun again. You could even earn a little profit. CompuServe, AOL, and bulletin board systems (BBS) created a market for shareware.

I bought a copy of Turbo Pascal for Windows 1.0 from Borland and a copy of Mastering Turbo Pascal 6 by the great Tom Swan, and I learned the Pascal syntax. I remember being delighted to discover that Swan had also written a book specifically for Turbo Pascal for Windows, and I devoured that too. 

In search of SYSBACK

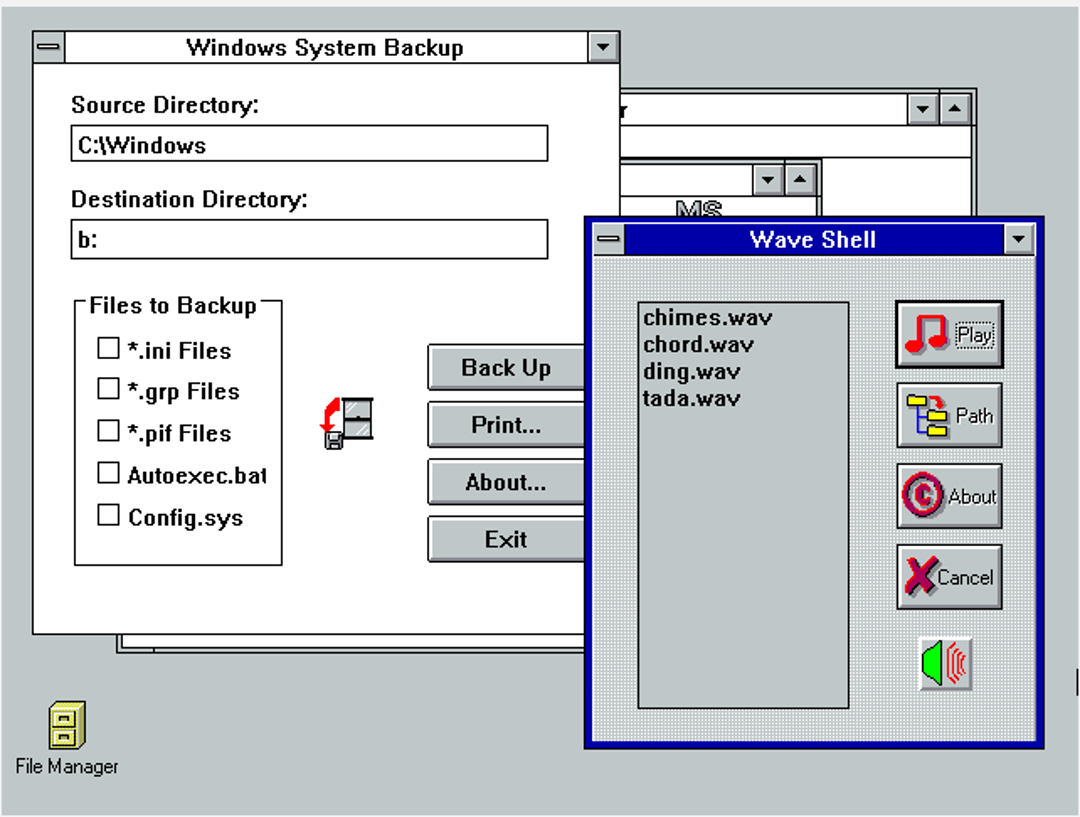
I soon came up with an idea for a shareware project — System Backup. Any of you who can remember back to the DOS and Windows 3.x days will remember that there were four files — AUTOEXEC.BAT, CONFIG.SYS, WIN.INI, and SYSTEM.INI — that were crucial to one’s setup. You’ll also remember that it wasn’t uncommon to twiddle with these files to eke out an extra measure of performance from the system. Backing those files up was critical to the tweaking, so I wrote SYSBACK.EXE to do the job quickly and easily. 

Windows 3.1 introduced the amazing feature of *.wav files — sound through your tinny PC speaker! That led me to write WAVSHELL.EXE, which listed all your sound files and made them easy to play.

I guess I didn’t have much faith in the value of my shareware because I released it into the wild of the pre-internet shareware market for a measly $2. People soon started sending me checks in the mail — my address was in the About Box, with a plea to pay for the software. Soon I added a licensing scheme and a “nag screen” that would go away if the user entered a valid license key. I actually made a bit of money.

Eventually both programs became unnecessary as Windows grew more functional, and I abandoned things. I’m sure all that code is on a hard drive in a landfill somewhere. 

But that doesn’t mean that SYSBACK and WAVSHELL don’t live on!

Last week, on a whim, I went searching to see if I could find any remnants of my glory days. Although it took a while, I was delighted to discover that both programs had clung to life in the dark crevices of the internet. 

I found WAVSHELL.ZIP and SYSBACK.ZIP and downloaded them. Sure enough, there were the files — the 16-bit Windows executables, along with the accompanying READMEs formatted for Windows Write, the simple word processor that came with Windows 3.1.

Return to Windows 3.1

So, what to do? Naturally I fired up Claude and asked how to get all this running. It suggested I give Oracle VirtualBox a try. At first I tried an open-source DOS version, but soon ran into conflict with memory managers and Windows. Tweaking CONFIG.SYS like the old days didn’t seem to make a difference.

This led to downloading a set of *.img files of MS-DOS 6.22. I mounted the first disk in the A: drive of the virtual machine. (For you youngsters, the A: drive was a floppy disk — maybe you remember those?) I had to do a virtual version of the old disk shuffle for the three floppies, and then do the same to install Windows. Everything installed and ran like clockwork, and soon enough, Windows 3.1 was up and running. 

Then, of course, I had to figure out how to get the files from my modern system to this ancient OS. This led me to WinImage, a shareware program (!) that builds floppy disk images for you. I built an image, copied the files onto the “disk,” and mounted it in the A: drive in the VirtualBox machine. I copied the files to the virtual hard drive, and behold!

System Backup and Wave Shell

Foundry

There they are, in all their glory. I have to say, it was quite a thrill. And they actually work!

Anyway, it was fun to remember all those halcyon days of CompuServe, 2400 BAUD modems, and getting checks from strangers in the mail. It seems strange to me that 35 years from now, some software developer will be writing a column about the deep dark past when people used to actually write code, argue about what programming languages were best, and, who knows, even had to type things out by hand.

  •  

Ruby on Rails critical bug puts every image upload under scrutiny

A new critical vulnerability in the Ruby on Rails (“Rails”) web application framework, CVE-2026-66066, could turn a seemingly innocuous image into a front door to your secrets.

Disclosed July 30, the high severity CVE (scored 9.5 out of 10) poses a significant risk to enterprises running apps that handle user-uploaded images in Rails.

Dubbed “KindaRails2Shell,” it targets the overly-trusting Active Storage component of the open-source framework, allowing unauthenticated attackers to read sensitive files or escalate to remote code execution (RCE).

The issue has been fixed in versions 7.2.3.2, 8.0.5.1 and 8.1.3.1 of Active Storage; enterprises running Rails should update immediately.

“The ‘chef’s kiss’ is the ability for an attacker to upload an image that isn’t actually an image [but] is code that allows them to steal secrets,” said David Shipley of Beauceron Security.

Attackers get the key to the castle

Ruby on Rails is an open-source, server-side application framework used for building full-stack web apps and application programming interfaces (APIs).

It is popular among developers because it is scalable, easy to learn and use, supports quick application development, taps into an active community of more than 1,000 engineers developing and maintaining it, and has an extensive library of nearly two million lines of prebuilt code.

CVE-2026-66066 specifically targets Rails’ built-in Active Storage component, which lets users upload files to cloud services or local disks and link them to their applications. In particular, the vulnerability exploits the way Active Storage interacts with the libvips image processing library to generate images.

Libvips contains what are known as “unfuzzed” operations which have not been hardened against malicious inputs through techniques known as fuzzing that test where they crash, leak data, or otherwise behave erratically. This makes them unsafe for use with untrusted content, but Active Storage does not adequately disable them.

“CVE-2026-66066 is particularly dangerous because an attacker may not need an account or privileged access,” explained Ensar Seker, CISO at SOCRadar.

Attackers can exploit the unsafe pipeline by uploading specially crafted files that trick Active Storage into giving them access to files that the Rails process is permitted to access, even highly-sensitive ones in app processing environments.

In practical terms, this could expose environment variables, Rails application secrets, database credentials, cloud access keys, API tokens and credentials for connected services, Seker explained.

Attackers can also gain access to the secret_key_base that signs and encrypts cookies, credentials, and session data. When secret_key_base is compromised, attackers essentially hold the key to the app.

“The immediate vulnerability is an arbitrary file-read issue, but the theft of secrets such as Rails’ secret_key_base can turn information disclosure into a much broader compromise,” Seker said.

Depending on the application, attackers could potentially forge trusted application data or sessions, access databases and cloud services, move laterally into connected systems, or achieve RCE.

That escalation path is what makes the vulnerability critical, Seker said. “A seemingly routine image upload feature, such as a profile picture, avatar or thumbnail generator, could become an entry point into the application’s underlying infrastructure.”

How to identify if you’re vulnerable

Applications are impacted when they are configured to use libvips for Active Storage image processing (the default behavior since Rails 7.0) and accept image uploads from untrusted or unauthenticated users. Enterprises should audit every internal and third-party app to determine whether they are configured this way, Seker advised, and patch Rails and Active Storage immediately. They should also examine every feature accepting images, including avatars, support attachments, product images, and administrative upload functions.

Upgrading Rails alone is not sufficient when an older libvips installation remains underneath it; libvips must be version 8.13 or later, he said.

Forensic guidance and tooling from the Rails project can help enterprises determine whether apps are vulnerable or files are exploitable, Seker noted. It’s also important to review app, proxy, object-storage, and image-processing logs for suspicious uploads or unusual requests.

Additionally, admins should rotate secret_key_base and every other credential available in Rails, invalidate active sessions, and investigate downstream systems for potentially exposed credentials.

“Security teams should treat this as a potential secret-exposure incident, not merely a patch-management exercise,” Seker said.

Don’t trust image processing pipelines

Complex image libraries support many formats and rely on numerous parsers and third-party components, creating a broad attack surface, Seker noted. Therefore, the libraries “should be treated as untrusted code execution territory.”

Image processing should be isolated in dedicated sandboxes, containers, or restricted to workers with minimal filesystem access, he advised. There should be no unnecessary network connectivity or access to an app’s files or secrets. Strict allowlists should be applied, file content human-validated, and uploads scanned before processing and stored outside app directories. 

Additional controls should include short-lived and narrowly scoped credentials, outbound network restrictions, dependency and software composition monitoring, and automated tests that confirm that dangerous codecs or operations are disabled post-upgrade, Seker said.

“The broader lesson is that organizations cannot assess exposure solely by asking whether they ‘use Rails,’” he noted, pointing out that two applications running the same Rails version may have very different exposure depending on their image processor, upload paths, and operating system packages. This makes visibility into runtime configuration, libraries, and app functionality critical.

This incident also demonstrates the importance of secret rotation in vulnerability response, he added. “When a vulnerability enables arbitrary file access, installing the patch closes the entry point but does not revoke credentials that may already have been copied.”

Don’t just assume you’re safe

This vulnerability illustrates a perfect use case for a software bill of materials (SBOM), which can speed up discovery of vulnerable software and triage it, Beauceron’s Shipley noted. And enterprises could also adopt intelligent web application firewall monitoring and intervention in addition to isolating systems and patching.

“The words you never want to hear in any critical vulnerability are ‘arbitrary code execution’ and ‘remote code execution’,” he said. “Either of those can mean bad news.”

What’s also interesting here is that the disclosure process was hijacked, he pointed out. Rails published technical details about the flaw and forensic tools to assess application vulnerability to it and to look for evidence of data exfiltration nearly a month before it planned to, because several researchers had reverse-engineered the attack and published proof of concept code.

The fact that proofs of concept are now available “materially increases the likelihood of opportunistic scanning and exploitation attempts,” Seker noted.

Therefore, he said, “even organizations that see no obvious evidence of compromise should not assume that patching alone removes the risk created by previously exposed secrets.”

This article originally appeared on CSOonline.

  •  

AWS’s Kiro Crew aims to turn AI coding agents into autonomous engineering teams

AWS on Tuesday released Kiro Crew, an open-source orchestration platform designed to help enterprises move beyond interactive AI coding assistants toward long-running, autonomous engineering workflows that span repositories, developer tools, and multiple work sessions.

Rather than simply generating code, Kiro Crew coordinates multiple AI agents, schedules recurring work, preserves project context across sessions, and integrates with developer tools to investigate incidents, monitor pull requests (PRs), triage tickets, and automate software engineering tasks while developers are away from their keyboards, according to the hyperscaler.

“Kiro Crew is a persistent, open-source development workspace for work that is bigger than a single task in a single session,” Darko Mesaros, distinguished developer advocate at AWS, told InfoWorld. “Think of it as an application layer that turns AI coding agents into always-working, self-learning, autonomous teammates.”

To support that model, the offering ships with persistent memory, multi-agent orchestration tools, approval workflows, scheduling, security controls such as sandboxing and signed audit logs, and a web and desktop dashboard for monitoring agent activity, the hyperscaler said in a statement.

Kiro Crew was originally developed inside Amazon as an internal project called MeshClaw and was later adopted by more than 39,000 Amazon builders in less than six months.

It can be deployed entirely inside customer environments, including laptops, containers, or virtual machines, without requiring an AWS account or AWS-managed control plane, AWS said.

To demonstrate how the new offering can be used, AWS is also launching a set of reference applications built on top of it, including DevFleets for worktree management, Issue Radar for issue and pull-request triage, and Task Runner for executing long-running engineering tasks.

Rather than standalone products, these apps combine purpose-built user interfaces with Kiro Crew’s orchestration engine, memory, scheduling, integrations, and backend services to automate specific engineering workflows, Mesaros said, adding that the hyperscaler is expected to add more such apps in the future.

Boosting developer productivity

Such applications, according to Michael Leone, principal analyst at Moor Strategy and Insights, would help platform engineering, DevOps, and site reliability engineering (SRE) teams, where much of the work involves repetitive, long-running operational tasks rather than writing entirely new software.

“These tasks can include dependency upgrades, framework migrations, flaky test cleanup, triaging and routing a ticket queue, and the first pass on an incident investigation,” Leone said.

“It’s a strong fit for long-running migrations that require checkpoints and retries over hours without supervision,” echoed Manoj Chandra Jha, principal analyst at Nord-IQ Research.

Taken together, those capabilities could significantly reduce software release cycles as well as the time developers spend supervising AI tools and reconnecting context between engineering workflows, according to Dave McCarthy, vice president of enterprise infrastructure at IDC.

“It eliminates context-switching and babysitting single prompts. Work continues asynchronously in the background while developers are in meetings, off the clock, or asleep, allowing teams to return to completed progress rather than a stalled process,” McCarthy said.

That, in turn, will allow developers to spend more time on higher-value engineering tasks, such as designing systems, making architectural decisions, and solving complex engineering problems, echoed Ashish Chaturvedi, executive research leader at HFS Research.

Why CIOs should care

Kiro Crew’s open-source, self-hosted architecture could help enterprises looking to bring governance and visibility to the growing use of AI coding agents, analysts said.

“Agent use inside most companies right now is shadow IT, with individual developers wiring up their own agents against their own credentials and nobody tracking it. A shared workspace with approval gates and logging gives you one place to see what ran, what it touched, and who authorized it,” said Leone.

Those governance capabilities, combined with the ability to run inside customer-controlled environments, according to Chaturvedi, could also help CIOs address security and compliance concerns: “Being open source and self-hostable, a CIO can run it on their own infrastructure and keep code and credentials inside their perimeter rather than sending them to a black-box agent.”

That reduction in security concerns, combined with Kiro Crew’s human-approval workflows, could provide enterprises with a lower-risk path to broader agent adoption, Jha said. “Since it embeds consistency and security screening at scale, and because review remains human-approved, it’s a low-risk entry point for demonstrating agentic ROI before extending trust to higher-stakes, unattended workflows.”

Not without trade-offs

Despite its benefits, the adoption of Kiro Crew comes with trade-offs, analysts warned.

Adopting Kiro Crew may not be a simple plug-and-play operation, said Stephanie Walter, practice lead for AI Stack at HyperFRAME Research. Rather, it introduces yet another orchestration layer for enterprises to manage and secure, she said.

Enterprises would need to draft up policies covering least-privilege access, human approvals, memory retention, code provenance, and auditability before allowing persistent agents to operate across source code repositories and CI/CD pipelines, Walter said.

More so because most enterprises, Walter added, are still not operationally ready to manage swarms of autonomous AI agents: “Many are still struggling to measure the cost and value of individual AI agents. Parallel agents multiply model calls, compute, CI activity, API usage, tool access, and human review, not just token consumption.”

Open architecture, but questions remain

Even for organizations that are ready to experiment with autonomous coding agents, integrating Kiro Crew into existing development environments may require additional work.

Although AWS built Kiro Crew around open standards such as Agent Client Protocol (ACP) and Model Context Protocol (MCP), the platform runs on the proprietary Kiro CLI at launch, according to Mesaros.

That means enterprises using other AI coding agents, such as Claude Code, Codex, or Devin, may need to build and validate their own connectors before they can use Kiro Crew as their orchestration layer.

“The dependency is real. AWS says Crew runs on the Kiro CLI at launch, and that CLI is proprietary and metered by credits, so it’s the harness actually wired up on day one. Until someone runs a different agent under Crew and shows it working, the open part stops at the orchestration layer,” said Leone.

For enterprises and development teams already using Kiro, however, adoption is expected to be more straightforward, as Kiro Crew can reuse existing .kiro configurations, including steering files, skills, and custom agents, without requiring additional setup, according to Mesaros.

The new offering, due to its open-source nature, is free as well, Mesaros pointed out, adding that customers need to pay only for the AI coding agents and tools they choose to connect to Crew.

AWS said it will govern the project through a publicly listed steering committee operating under an open governance model, with proposals submitted as pull requests and debated openly.

Kiro and AWS engineers will initially maintain the project, with trusted community contributors expected to join the maintainer group over time, it added.

  •  

JetBrains says a crafted HTTP request could break TeamCity

JetBrains is warning of a critical security vulnerability in its TeamCity DevOps platform that could allow unauthenticated attackers to execute arbitrary operating system commands on vulnerable servers.

“If exploited, this vulnerability may allow an unauthenticated attacker with HTTP(S) access to a TeamCity server to bypass authentication checks and execute arbitrary commands,“ the company said in a security advisory.

The flaw, tracked as CVE-2026-63077, affects all TeamCity On-Premises deployments and has been fixed in versions 2025.11.7 and 2026.1.3.

JetBrains warned that the flaw potentially exposes build environments, stored credentials, and software supply chains. Customers unable to upgrade are advised to deploy a security patch plugin immediately.

TeamCity Cloud customers are not required to take any action, the company reassured.

RCE achieved without authentication

According to JetBrains, the vulnerability resides in the TeamCity agent polling protocol, allowing an attacker with HTTP(S) access to bypass authentication and execute code with the privileges of the TeamCity server process.

The vulnerability carries a CVSS score of 9.8 out of 10 as it requires no authentication or user interaction, making internet-exposed TeamCity servers particularly attractive targets. Classified under CWE-502 (deserialization of unstructured data), the flaw can be used to send specially crafted data through the affected agent polling protocol to trigger remote code execution (RCE).

“Depending on the privileges granted to the TeamCity server process, a successful attack could expose TeamCity data, configurations, and stored credentials, modify server state, and potentially compromise the integrity of build artifacts and downstream CI/CD pipelines,” the company added.

The issue was privately reported on July 10 by security researcher Antoni Tremblay through JetBrains’ coordinated disclosure process.

JetBrains said it had found no evidence of active exploitation at the time of publishing the advisory.

Developers have two mitigation paths

JetBrains is recommending that customers upgrade directly to TeamCity 2025.11.7 or 2026.1.3, both of which include a permanent fix for the vulnerability.

Organizations unable to upgrade immediately can instead deploy a security patch plugin, which is available for TeamCity versions 2017.1 and later. Servers running versions 2017.1 through 2018.1 require a restart after installing the plugin, while newer supported releases can enable the fix without restarting, the company added.

The company also advised administrators whose TeamCity servers are publicly accessible to restrict external access if neither mitigation can be applied immediately.

“As a general best practice, we strongly recommend limiting network access to TeamCity servers to trusted networks wherever possible,” the company said. “We also recommend running the TeamCity server with the minimum operating system privileges required for normal operation.”

Given the vulnerability’s pre-authentication nature and the history of threat actors rapidly weaponizing TeamCity flaws, organizations running self-hosted CI/CD infrastructure are advised to prioritize emergency patching over routine maintenance windows.

The advisory also recommended running TeamCity servers on dedicated hosts separate from build agents, as per official instructions.

The article originally appeared on CSO.

  •  

OpenAI drops GPT-5.6 Luna and Terra API prices by up to 80%

OpenAI has cut API prices for its GPT-5.6 Terra and Luna models by 20% and 80%, respectively, while also reducing the number of usage credits the models consume in ChatGPT Work and Codex, in an effort to effectively increase the amount of AI work enterprise subscribers can perform without paying more.

“Starting July 30, API pricing is $2 per million input tokens and $12 per million output tokens for Terra, and $0.20 per million input tokens and $1.20 per million output tokens for Luna,” the company wrote in a blog post.

Prior to this update, enterprise customers paid $2.50 per million input tokens and $15 per million output tokens for GPT-5.6 Terra. For Luna, pricing stood at $1 per million input tokens and $6 per million output tokens.

These lower prices and effective reduction in credit consumption, OpenAI said, are the result of improvements in serving efficiency that allow it to deliver “more intelligence per dollar” for its most advanced family of AI models.

The efficiency gains, the company added, stem from optimizations across its AI training and inference stack, including software and GPU infrastructure, with GPT-5.6 Sol helping optimize production GPU kernels used to run AI workloads and reduce inference costs without compromising model performance.

Enterprises likely to spend differently, not less

Analysts say the price cuts are less about reducing enterprise AI spending and more about lowering the cost of deploying AI at scale.

“For CIOs, the biggest impact is likely to be scaling AI adoption rather than simply cutting costs or lowering AI budgets. Lower prices make it easier to move pilots into production, expand AI across more employees and business processes, and economically deploy more complex agentic workflows that require multiple model calls,” said Pareekh Jain, principal analyst at Pareekh Consulting.

“Instead of shrinking AI budgets, most enterprises will reinvest the savings into higher AI usage, allowing agents to perform more reasoning, automation, and multi-step workflows while delivering more business value for roughly the same spend,” Jain noted, saying the likely outcome reflects the Jevons paradox, the economic principle that efficiency improvements often increase overall consumption of a resource rather than reducing it.

Echoing Jain’s view, Chandrika Dutt, research director at Avasant, pointed out that enterprise teams are likely to use the leeway from the pricing change to build increasingly sophisticated agentic workflows that were previously difficult to justify economically.

CIOs need flexible AI architectures to benefit

More broadly, CIOs should view OpenAI’s pricing update as yet another sign that inference costs are likely to keep falling over the next 24 months across model providers, such as Anthropic, Google, and Microsoft, with a sharp increase being unlikely.

“These price decreases are broadly sustainable in the long run. New chips, better software, and more efficient model designs will keep driving down the cost per token, and heavy competition makes big price hikes risky for any single provider and thus unlikely,” Jain pointed out.

For enterprises and their leaders, that should mean designing AI strategies that prioritize AI FinOps and flexible architectures so models can be swapped as price-performance continues to improve across vendors, Jain added.

The larger and more advanced model in the GPT-5.6 family, named Sol, though, is not undergoing any pricing changes. Instead, OpenAI has introduced a new Fast mode for the model, replacing Priority Processing in the API. Existing API requests tagged “priority,” though, will continue to work, it added.

  •  

Why observability matters to frontend teams more than they think

For a long time, I thought of observability as something mainly owned by backend, platform or site reliability teams. Frontend engineers built the interface, handled browser behavior and called APIs. When something failed deeper in the system, another team looked at server logs and infrastructure dashboards.

That division works until the application is technically available, but the user experience is not.

A page may load while its most important data arrives several seconds late. A request may succeed after multiple retries, leaving the user staring at a spinner. One cloud service may slow down while the rest of the page continues working. From an infrastructure perspective, nothing may qualify as an outage. From the user’s perspective, the application is already failing.

As I gained more experience building applications that depended on cloud services and APIs, my view of frontend ownership changed. A frontend team does not need to operate every service it depends on, but it does need enough visibility to understand how those services affect the experience it delivers.

Observability gives frontend engineers that visibility. It helps connect what happens in the browser with what happens across the systems behind it. More importantly, it gives teams evidence they can use not only to debug problems, but also to make better decisions about how the frontend should behave when dependencies are slow, unavailable or inconsistent.

The browser sees a different version of the system

Server-side monitoring tells us what happened inside a service. It does not always tell us what happened across the user’s complete journey.

A backend dashboard might show that an API responded in 300 milliseconds. The browser may still take much longer to display useful content because of network latency, JavaScript execution, rendering work or additional requests. A successful response can also produce a broken experience if the returned data is incomplete or the interface fails while processing it.

This is why client-side telemetry matters. Browser error reporting can capture exceptions that never reach a server. Performance measurements can show how long users wait for content to become visible or interactive. Request data can reveal which dependencies are slow, unreliable or frequently retried.

Standard browser APIs provide useful starting points. The W3C User Timing API allows developers to mark and measure meaningful operations in an application. A team can measure how long it takes to load a dashboard, complete a search or render a critical section of a page.

Web Vitals can also help teams examine loading performance, responsiveness and visual stability using measurements tied more closely to the user experience. These metrics are useful because they move the conversation beyond whether a request succeeded. They help answer whether the page became useful quickly and respond when the user tried to interact with it.

The goal is not to collect every browser event. That can produce a large amount of data without producing much insight. It is better to begin with a small set of questions.

How long does the user wait before the main content appears? How often does a form submission fail? Which request prevents a page from becoming usable? Are users on certain devices or network conditions affected more often?

These questions make telemetry easier to design and easier to interpret. “The API is available” is a service-level statement. “The user can complete the task without an unexpected delay” is an experience-level statement. Frontend observability helps connect the two.

Logs and traces connect the frontend to its dependencies

Client-side logs are most valuable when they include enough context to reconstruct what the user was doing. A useful error record might include the application version, route, operation, request status and a correlation identifier. Browser information may also help when an issue affects only certain environments.

At the same time, frontend telemetry should be designed carefully. Logs should avoid form contents, authentication tokens, passwords and other sensitive information. Collecting more data does not automatically make an investigation easier. The right context is more useful than a large amount of unstructured information.

Correlation identifiers are particularly helpful. When the frontend includes an identifier with a request and that identifier continues through downstream services, teams can connect a browser failure to backend logs and distributed traces. Instead of comparing timestamps across several dashboards, engineers can follow one request across the system.

A distributed trace can show that a user action triggered an API gateway, an application service, a database call and another cloud dependency. It can also show where the request spent most of its time or where an error first appeared.

OpenTelemetry provides a vendor-neutral approach for generating and connecting telemetry such as traces, metrics and logs. It also supports JavaScript and browser instrumentation, which makes it relevant to frontend teams that want to connect browser activity with backend services.

Frontend engineers do not need to become observability platform specialists. They do need agreement with backend and platform teams on basics such as trace propagation, naming conventions, safe logging fields and where telemetry can be reviewed during an investigation.

Consider a page that occasionally loads without its main data. The frontend may record that a critical request timed out after several seconds. A correlation identifier from that request may lead to a trace showing that the gateway responded normally, but a downstream dependency exceeded its timeout.

Without connected telemetry, the report might remain, “The page sometimes does not load.” With connected telemetry, the team has a specific failure path, a measurable delay and enough evidence to decide what needs to change.

That evidence can support two actions. The service team can investigate the slow dependency. The frontend team can improve the experience by adding a timeout state, retry option or partial fallback. Observability makes both responses more precise.

Observability should influence architecture, not only debugging

The immediate benefit of observability is faster incident investigation. The larger benefit is better architectural decision-making.

When telemetry repeatedly shows that one dependency is slow, the frontend team can reconsider how tightly the interface depends on it. The page might render primary content first and load secondary information later. Cached data might be acceptable for a noncritical section. A timeout might lead to a smaller fallback instead of blocking the entire screen.

Observability can also expose hidden coupling. If unrelated components fail whenever one shared request slows down, the page may have been designed as a single loading unit. Breaking the experience into independently recoverable sections can make the interface more resilient.

The same evidence can improve retry behavior. Automatic retries may help with a temporary network failure, but they can also add more traffic to an already slow service. Telemetry can show whether retries recover requests, how long the recovery takes and whether users leave the page before it succeeds.

Service-level visibility matters as well. Frontend teams should understand the availability and latency expectations of the services they use. They should also understand what those services return during partial failures.

If a dependency may respond slowly, the interface needs a loading strategy. If data may be stale, the interface needs to communicate freshness. If a service is optional, the page should not collapse when it is unavailable.

Good observability also improves conversations between teams. Instead of saying, “The page feels slow,” frontend engineers can explain which user action is affected, how often it happens and where the delay appears. Debugging becomes a discussion based on evidence rather than guesswork.

A practical starting point can be small. Capture unhandled browser errors. Measure a few important user journeys. Record failures for critical network requests. Propagate a correlation identifier across frontend and backend systems. Review those signals with the teams that own dependent services.

From there, instrumentation should grow in response to real questions. Add a measurement when a workflow is difficult to understand. Add a trace when a request crosses several systems. Add a dashboard when a signal is important enough to review regularly.

Frontend observability is not about turning every frontend engineer into an operations engineer. It is about recognizing that the browser is part of the production system and often the only place where the complete user experience is visible.

When frontend teams can connect what users experience with the services behind it, they can debug more effectively, design interfaces that degrade gracefully and make better architectural decisions. Observability becomes more than a way to explain incidents. It becomes an input into how frontend systems are designed.

This article is published as part of the Foundry Expert Contributor Network.
Want to join?

  •  

The platform team isn’t a cost center, it’s product infrastructure

A few years ago, I sat in a postmortem that I still think about. We’d had a production incident where a routine deploy had quietly shipped with the wrong configuration, and it took us longer to notice and roll back than anyone was comfortable admitting. But when we traced the root cause, almost none of it was the feature code. It was the scaffolding around it: a Kubernetes manifest no longer matched our cluster, a CI pipeline whose green checkmark didn’t actually verify the thing we assumed it did, and a secrets-management step that three different services each did three different ways. The code itself had been fine for a week. Everything around the code is what failed us.

I have seen some version of that retro at nearly every company I’ve worked at over the last 15 years across a large IT services firm, a medical-device maker, a healthcare-technology company, a cloud-migration startup, and now a large SaaS platform. The names and the tech stacks changed. The pattern didn’t. Smart engineers spending a startling share of their week not on the problem they were hired to solve, but on the accidental complexity of shipping it.

For a long time, I assumed the answer was better documentation, or a stricter DevOps culture, or just hiring people who were more comfortable with YAML. I was wrong on all three counts. What actually changed my mind was reframing the problem entirely: the friction wasn’t a knowledge gap or a discipline gap. It was a product gap. Nobody owned the developer’s experience of shipping software the way a product manager owns a customer’s experience of using an app. And the discipline that closes that gap now has a name: platform engineering, which Gartner describes as having “emerged in response to this increasing cognitive load resulting from the complexity of modern software tools and architectures.” Gartner isn’t shy about how fast it’s spreading, either: the firm predicts that “by 2026, 80% of large software engineering organizations will establish platform engineering teams,” up from 45% in 2022. If that number is even close to right, the interesting question is no longer whether to build a platform team but whether you’ll build a good one.

The moment “DevOps” quietly stopped scaling

I want to be careful here, because “DevOps is dead” is a lazy headline and I don’t believe it. The principles behind DevOps include shared ownership, automation, and tight feedback loops. These are as right today as they were when the movement started.

What broke, in my experience, was the operating model. The original promise was “you build it, you run it.” Every team owns its own deployment, its own observability, its own on call. That works beautifully when you have a handful of teams and a shared oral tradition. It falls apart when you have 50 teams, because now you have 50 slightly different ways of doing the same undifferentiated work. 50 ways to define a service. 50 subtly wrong Kubernetes configurations. 50 on-call rotations paging fifty engineers about the same class of problem at 3 a.m.

The cognitive load of “run it yourself” grew faster than most teams could absorb. That framing of cognitive load as the thing you’re actually optimizing for comes from “Team Topologies,” a book that reshaped how I think about org design more than any purely technical text I’ve read. Its fourth principle is blunt about the limit: “Teams can only handle so much complexity before breaking down,” and “competent teams become ineffective when leaders keep adding to their plate without taking anything away.” That last line described my own teams so precisely it stung. “Team Topologies” also gave me the vocabulary I’d been missing. It names four fundamental team types, and it defines a platform team as “a grouping of other team types that provide a compelling internal product to accelerate delivery by stream-aligned teams”. Read that definition again: a compelling internal product. Not a shared-services desk, not a Terraform repo with a wiki. A product. That single word is the whole argument.

Treating the platform as a product changes everything

Here’s the shift that took me embarrassingly long to internalize: if the platform is a product, then developers are its customers, and you don’t get to tell your customers they’re holding it wrong.

That one reframing has downstream consequences that surprised me.

The first is that adoption has to be earned, not mandated. Early in my time working on internal tooling, I helped build a platform capability that we were quite proud of, and then we did what infrastructure teams love to do: we announced it, and assumed people would come. They didn’t. Teams routed around it, because the golden path we’d paved was, frankly, gravel. The lesson landed hard. A platform that developers have to be forced onto is not a platform, it’s a tax. When we went back and rebuilt it so that the paved path was genuinely the easiest path. This is the same instinct behind Backstage, the developer portal that was built at Spotify and is now a CNCF project; its own pitch is that it “restores order to your microservices and infrastructure” so product teams can ship quickly. Order you have to opt into isn’t order. The tool wins when choosing it is the lazy option.

The second consequence is that “self-service” has to mean what it says. It’s an overused word, so I hold it to the CNCF’s definition from its platforms white paper: “A platform should be self-serviceable. Users must be able to request and receive capabilities autonomously and automatically.” Autonomously and automatically. If a developer has to file a ticket and wait on my team to provision a database, I haven’t built a platform instead I’ve built a slower version of the help desk. The same white paper states the north star plainly: “An essential goal of a platform is to reduce the cognitive load on product teams.” I’ve started using that sentence as a litmus test. For any capability we’re tempted to add, I ask whether it removes load from a product team or quietly adds some. A surprising number of well-meaning platform features fail that test.

The third consequence is that you have to measure the platform the way you’d measure any product and resist measuring the things that only flatter the platform team. “How many clusters are we running” is an output my team cares about and nobody else does. The metrics that matter describe the developer’s lived experience, and the most durable set I know of comes from DORA, the long-running research program into software delivery performance. Its metrics have evolved from the original “four keys” have grown to five. The core throughput measures still ask exactly the right questions: change lead time (“the amount of time it takes for a change to go from committed to version control to deployed in production”), deployment frequency, and failed deployment recovery time, balanced against a change fail rate. I’ve found those double as a remarkably honest scorecard for a platform team, precisely because they refuse to reward busywork. You cannot game your way to a good lead time by shipping more internal tools nobody uses.

The fourth consequence is the hardest culturally: a platform product needs a roadmap, user research, and the willingness to say no. I’ve watched platform efforts collapse into a junk drawer of one-off requests, each reasonable on its own, that together add up to an incoherent pile of tools nobody can hold in their head. Saying no to a well-intentioned request is a product-management skill, and platform teams that never develop it end up rebuilding the very sprawl they were created to eliminate. The best platform leads I’ve worked with spend as much time talking to their internal users as any consumer-facing PM does.

What I’d tell my younger self

If I could go back to that retro years ago, I’d say a few things to the version of me who thought this was a documentation problem.

Start with the paved road, not the platform. You don’t need to build an internal developer portal in quarter one. You need to find the single most painful, most repeated piece of undifferentiated work is the distance between “here is my container” and “it is running safely in production”. Earn the next piece of scope by delivering that one well. Platforms that begin as grand architectures tend to die as grand architectures; the ones that survive start as one genuinely useful paved road that people choose on their own.

Resist the urge to abstract away everything. The goal of a good platform is not to hide Kubernetes so completely that no one understands what’s happening beneath them; that just trades one kind of fragility for another. The goal is to remove the toil while leaving the understanding intact. When the abstraction leaks you want engineers who can reason about what’s underneath, not a room full of people who only ever knew the buttons. I’ve paid for both mistakes: platforms too thin to help, and platforms so thick that an incident turned into an archaeology dig.

And treat “developer experience” as a first-class business metric, not a morale nicety. Every hour an engineer spends fighting the delivery pipeline is an hour not spent on the thing your customers actually pay you for. When I frame platform investment that way to leadership as reclaiming a meaningful fraction of my most expensive people’s time that’s when the conversation stops being about cost and starts being about leverage. It is genuinely one of the highest-return investments an engineering organization can make, and it almost never shows up as a line item that looks like one.

The platform team is not the group that keeps the lights on. It’s the group that decides how fast everyone else can move. Once I started treating it as the most important product my organization ships internally, almost every other decision got easier. I just wish it hadn’t taken me a missed release and a room full of frustrated engineers to see it.

This article is published as part of the Foundry Expert Contributor Network.
Want to join?

  •  

JetBrains open sources KotlinLLM runtime code generator

KotlinLLM, a research prototype for delegating runtime logic to a large language model (LLM) from Kotlin code, is now going open source and public, JetBrains announced.

Revealed July 28, KotlinLLM is an IntelliJ IDEA plugin prototype for experimenting with LLM-driven “Smart macros” in Kotlin, enabling code generation, runtime updates, and hot-reloading. In software engineering, LLMs are commonly used during development for code completion, code generation, and program comprehension, JetBrains noted, but using an LLM at run time of a compiled application is much less common. The existing options for doing this have the following trade-offs, according to JetBrains:

  • Direct runtime delegation is slow, non-deterministic, and costly, and makes the application depend on an LLM service at run time.
  • External agent workflows keep the generated logic outside the codebase, where it is harder to review, test, and ship.
  • Most prior work (byLLM, nightjar, Healer) targets interpreted languages like Python, not a compiled, statically typed language like Kotlin.

KotlinLLM addresses these limitations in three ways, JetBrains said:

  • The call site shows that a feature is LLM-backed, so it is visible in code review.
  • Generated behavior is saved as an ordinary Kotlin source, not kept only in the runtime session. It can be committed, reviewed, tested, and distributed like any other code.
  • Once generated, the code runs as plain Kotlin without the plugin. For scenarios that are already covered, there is no further LLM call, so no added latency or cost, and the result is reproducible.

KotlinLLM is open source under Apache License 2.0. The repository contains the KotlinLLM IntelliJ IDEA plugin, the Smart macro API, and example projects.

  •  

Critical Ruflo flaw lets attackers hijack AI agents through exposed MCP bridge

A critical vulnerability in the open-source AI agent platform Ruflo could allow unauthenticated attackers to take control of enterprise AI environments by exploiting an exposed Model Context Protocol (MCP) bridge, according to research published by Noma Security.

The flaw, tracked as CVE-2026-59726 and dubbed RufRoot, carries a maximum CVSS score of 10.0 and affects Ruflo versions prior to 3.16.3, Noma Security wrote in a blog post.

The vulnerability allows attackers to execute arbitrary code, steal large language model (LLM) API keys, access user conversations, hijack AI agents, and manipulate the platform’s persistent AI memory through a single HTTP request.

The researchers said the issue stems from an unauthenticated MCP Bridge that is exposed by default and provides direct access to the tools AI agents use to interact with enterprise systems.

“The MCP Bridge isn’t a random auxiliary debug interface; rather, it is Ruflo’s central nervous system. Every tool call, every agent action, every memory operation goes through the MCP bridge,” the researchers wrote. “Mistakenly giving unauthenticated access to the MCP Bridge means giving unauthenticated access to everything.”

One request leads to full compromise

According to Noma Security, Ruflo’s built-in MCP Bridge is an Express.js server that handles every tool invocation made by AI agents. The bridge exposes 233 tools covering shell access, database operations, agent management, and memory storage.

The researchers said the bridge’s /mcp endpoint accepts tool invocations without authentication. In a proof-of-concept demonstration, they used Ruflo’s terminal_execute tool to obtain command execution inside the container with a single HTTP request.

“Because the MCP Bridge requires direct access to the underlying system resources to execute these commands, it creates a high-stakes security boundary,” the researchers wrote. “When an attacker can reach this endpoint without authentication, they gain a direct pipeline to the underlying host infrastructure.”

The researchers said they were able to enumerate available tools, steal LLM provider API keys from environment variables, deploy attacker-controlled AI agent swarms, retrieve user conversations stored in MongoDB, and establish persistence.

The researchers also demonstrated what they described as AI memory poisoning by inserting malicious entries into Ruflo’s AgentDB pattern store, allowing future AI responses to incorporate attacker-controlled instructions.

Every stage of the attack chain was validated against a default Ruflo deployment running on AWS EC2, according to the researchers.

Beyond Ruflo: A broader MCP security challenge

While the authentication flaw is specific to Ruflo, security practitioners say the research highlights broader risks surrounding AI orchestration platforms and MCP infrastructure.

“MCP adoption has outpaced the security defaults built into a lot of orchestration tools,” said Amit Jena, AI Development Manager at Kanerika. “These platforms shipped fast, prioritized ease of setup over authentication, and assumed the network boundary would protect them. That assumption breaks down once the tool sits on a server reachable from a corporate network, which is increasingly where enterprises are running them.”

Jena said the research also points to a security concern that extends beyond a single product.

“The memory poisoning problem isn’t product-specific, and that’s the part worth paying attention to,” he said. “Any platform that gives agents a persistent, writable memory store needs to treat that store as a security boundary: who can write to it, and can you tell system-generated memory from memory an attacker planted. Very few platforms are doing that today.”

He added that, unlike traditional persistence techniques, poisoned AI memory can remain inside a trusted data store and continue influencing future agent behavior after the original intrusion has ended.

Patch addresses attack chain

Noma Security said it disclosed the vulnerability responsibly to Ruflo, which released fixes within hours along with a public security advisory.

According to the researchers, the updated release changes the MCP Bridge to bind to the loopback interface by default and fail closed if administrators attempt to expose it publicly without configuring authentication.

Noma Security also urged organizations running Ruflo to immediately close firewall access to ports 3001 and 27017, rotate all LLM API keys, audit AgentDB for malicious entries because “a patched redeploy alone doesn’t undo poisoning,” and inspect MongoDB for signs of tampering.

Jena said organizations should also review how AI orchestration platforms are deployed and managed.

“If a component can execute a shell command or query a database, it gets the same authentication, network segmentation, and logging as any other privileged system in the environment,” he said. He also recommended that security teams inventory the tools exposed through AI agent deployments, audit persistent AI memory separately from software patching, and narrowly scope and rotate LLM provider credentials following any suspected exposure.

The article originally appeared on CSO.

  •  

How AI can improve site reliability engineering

One percent of AI-active developers now generate 46 times more AI-written lines of code per day than the median active user, according to the Cursor Developer Habits Report. The bottleneck is no longer writing software. It is understanding what happens after that software ships.

Every new service, dependency, feature flag, generated abstraction, and deployment path increases the number of ways a production system can fail. AI has compressed the time it takes to create that complexity. It has not compressed the time it takes to understand it.

The result is a production environment that changes faster than engineers can rebuild a mental model of it. AI can help in this situation because most debugging practices were designed for a slower world.

Debugging yesterday and today

For decades, debugging was largely a spatial problem. A failure in Service A belonged to the team that owned Service A. They knew the deployment history, the operational quirks, the useful log queries, and the odd behaviors that never made it into the runbook. Incident response reflected that assumption. Teams owned services. Runbooks were scoped to those services. On-call rotations mirrored organizational boundaries.

That model still works when failures stay local. If a deployment introduces a memory leak, or a bad configuration causes a service to crash, the symptom and the cause usually live in the same place. The owning team can investigate, identify the issue, and restore service. Those incidents are becoming a smaller share of production failures.

AI-generated code is not inherently less reliable than human-written code. The change is volume and speed. Teams can now introduce more code, touch more systems at once, and evolve architectures faster than before. As systems become more interconnected, failures increasingly surface somewhere other than where they start.

A single-hop incident is local. The service experiencing the failure is also the service causing it. Investigation stays inside one team’s boundary.

A multi-hop incident looks different. The checkout API begins timing out. Nothing appears wrong inside checkout. Latency is normal. Error rates are low. The actual problem is a queue consumer silently dropping messages because a schema change deployed two days earlier was only partially backward compatible. The queue team sees healthy throughput. The data platform team never receives a page because nothing in its service violates an alert threshold. Every team is right about its own system, yet nobody can explain why customers cannot complete purchases.

The problem is not a lack of evidence. Modern production systems produce more telemetry than any human can use during an incident. The problem is knowing which evidence matters, which signals are coincidental, and how separate clues connect into a causal chain.

The role of AI in production ops

That changes the role AI should play. AI should not be treated as a magic on-call engineer. A frontier model does not know your architecture. It does not remember prior incidents. It does not know which dashboards lie, which services fail together, what changed last week, or which dependencies matter most. On its own, it reasons inside a vacuum.

The useful version of AI in production is more specific. It can assemble context, test hypotheses, trace dependencies, compare the current incident against past incidents, and rule out explanations that do not fit the timing or blast radius. It can do the work that currently eats the first 20 minutes of an incident: gathering evidence, checking recent changes, mapping dependencies, and narrowing the search space.

Humans still make the decisions that require judgment. They decide whether the evidence is strong enough to act, whether a rollback is worth the risk, whether to wake another team, and whether the safest move is mitigation or deeper investigation. But they should not have to spend half the incident reconstructing a system the organization already operates.

That is the larger productivity shift.

If AI can absorb more of the troubleshooting tax, engineers can focus on the work that actually compounds. They can simplify fragile architectures. They can improve instrumentation in the places where incidents repeatedly go dark. They can design safer degradation paths, sharper alerts, better rollback patterns, and evals that catch semantic failures before customers do. They can feed production knowledge back into development, so code assistants and review processes understand which services are risky, which patterns have caused outages, and which dependencies deserve extra scrutiny.

This is the work engineers rarely get enough time to do because they are stuck resolving the same classes of incidents again and again.

Letting the engineers engineer

The goal is not to remove engineers from production. The goal is to stop wasting their judgment on work the system should already be doing. AI should make incidents shorter, but that is only the first-order benefit. The larger benefit is giving senior engineers more time to prevent future incidents instead of being pulled into every confusing one.

As AI accelerates software creation, production operations need the same kind of acceleration on the other side. Not just faster debugging. Better allocation of human attention.

The AI code avalanche will not be managed by asking engineers to troubleshoot forever at machine speed. It will be managed by making production systems more legible, more resilient, and less dependent on whichever expert happens to be awake.

—

New Tech Forum provides a venue for technology leaders—including vendors and other outside contributors—to explore and discuss emerging enterprise technology in unprecedented depth and breadth. The selection is subjective, based on our pick of the technologies we believe to be important and of greatest interest to InfoWorld readers. InfoWorld does not accept marketing collateral for publication and reserves the right to edit all contributed content. Send all inquiries to doug_dineley@foundryco.com.

  •  

Shipping an MCP test agent: The boring parts nobody demos

The demo videos always end at the same moment. A figma frame turns into a passing test in twelve minutes. Someone in the room says the word “productivity.” The recording stops.

The parts that come after that moment are the parts I actually get paged about. Who owns the ticket the agent opened at 3:14 a.m.? Which model call produced the assertion in test case 47? What closes the 17 draft tickets a stuck run left behind before the next sprint planning notices them? None of that shows up in the demo. All of it shows up on the on-call rotation. After 20 years of leading test automation across consumer-scale platforms, I have a strong bias about which slide in the deck predicts whether a pipeline ships or stalls. It is never the architecture slide. It is the runbook.

This piece is about the runbook. I built an unattended agentic test pipeline over the Model Context Protocol — a five-agent SDLC (product manager, QA engineer, automation engineer, developer, pull-request reviewer) coordinating through MCP servers for Jira, Figma, Confluence, TestRail and GitHub, with hosted Claude as the orchestration model and an open-weights Hermes-3 as a validation baseline — and I ran it as an independent research project long enough to learn which production constraints the agent literature glosses over. What follows is the short list of things I now insist on before I let any agentic pipeline touch a shared system.

Composition contracts, or why the agent lied to itself

The most expensive failure mode I have seen in a multi-agent pipeline is not the model getting an answer wrong. It is agent A getting an answer right and agent B misreading it.

I watched this happen inside a run last month. The requirements agent produced a clean output with a field called acceptance_criteria that was a list of strings. The ticket agent expected acceptance_criteria to be a single markdown blob. Neither agent was wrong in isolation. Both were passing their own unit tests. What the pipeline produced was a Jira ticket whose acceptance criteria read, in full, the four characters [” — the JSON serialization of an empty first element. The test-plan agent read that, generated one test, marked it green and moved on. It took me until the pull-request stage to notice.

This is a composition fault. It is the natural failure mode of any system where independent components hand off structured data across a boundary they don’t jointly own. Distributed systems people have written about this for years — Martin Fowler’s tolerant reader pattern is the classical treatment — but the LLM literature mostly still treats it as a prompt problem. It isn’t. You cannot fix it with a better system prompt. You fix it with a typed handoff contract that both agents agree to before they run, plus a validator between them that fails loud when the shape drifts.

The heuristic I now use: Every agent-to-agent boundary gets a schema and a validator. Every agent gets a golden-input regression suite that catches contract drift before it reaches a downstream agent. Neither of those is glamorous. Both are the difference between a pipeline that produces work and a pipeline that produces a very expensive game of telephone.

If you want to know whether a team’s agentic pipeline is going to survive the first quarter, ask them what the contract is between agent one and agent two. If the answer is “the model figures it out,” budget for the cleanup.

Provenance, or the audit trail nobody wrote

The second thing I insist on now is that every artifact the pipeline produces has to answer three questions without a human doing archaeology: which agent produced it, which model call produced it and which upstream inputs the agent was looking at when it did.

This sounds like a nice-to-have. It is not.

Somewhere around week three of running the pipeline I hit a subtle case: the requirements agent was quoting a Confluence page back to itself. The MCP server for Confluence had returned an empty result on a first call, the agent had written a placeholder requirement, the second call had succeeded, the agent had retrieved its own placeholder and by the third pass it was citing that placeholder as source truth. The ticket said, entirely in earnest, that the requirement came from the design owner. It hadn’t come from anywhere. It had come from itself, four minutes ago.

You cannot debug that class of failure with logs of what the model said. You need logs of what the model was looking at. That means capturing the tool-call ID for every MCP call, stamping every artifact with the set of tool-call IDs it derived from and refusing to accept any retrieved fact into a downstream stage that cannot be traced to a real external source. I call it the prove-the-source rule. It’s boring. It’s a two-line requirement in the runbook. It is also the single guardrail that has saved me the most on-call time.

There is a nice side effect. When editors, reviewers or auditors ask where a decision came from, the pipeline can show them. That matters if you work anywhere near a regulated stack, and increasingly it matters everywhere else — the AI transparency and provenance framing in NIST’s AI Risk Management Framework is going to become the default expectation faster than most teams are budgeting for.

Cleanup and ownership, or why I now write the shutdown script first

The last thing that will surprise a team shipping their first agentic pipeline is the debris.

A pipeline that runs unattended for a week will leak. It will leak draft Jira tickets whose parent stories were never approved. It will leak GitHub branches for test suites that were never merged. It will leak TestRail runs that started, produced two results and never got a summary. It will leak Confluence page comments the agent posted while asking itself a clarifying question. None of these are bugs. They are the natural output of an autonomous system that starts more work than it finishes.

I learned this by accident. About six weeks into the project I ran a query on Jira for tickets created by the automation user in the past thirty days. I was expecting maybe 20. It was 91. 68 of them were [DRAFT] in the title and had not been touched by any human. I closed them by hand one afternoon, and while I was doing it, I understood that the pipeline had a silent second job I had never designed for: garbage collection.

Now every pipeline I run has three things I write before I write the first agent. A shutdown script that closes any artifact the current run has orphaned. A nightly reconciliation pass that closes any artifact any prior run has orphaned. And a single named owner — a human, on the org chart, with a Slack handle — for every downstream system the pipeline can write into. When the pipeline creates a Jira ticket, the ticket has a real assignee. When the pipeline opens a pull request, a specific reviewer is on the hook. When the pipeline files a TestRail run, someone gets pinged if it goes stale. The pipeline is not allowed to touch a system that does not have a named owner. That rule alone would have saved me the ninety-one-ticket afternoon.

There is one anti-pattern here I want to name outright. Do not, under any circumstance, let the agent close its own artifacts. I tried it. The agent, tasked with cleanup, closed the wrong thirty tickets and then confidently wrote a summary saying it had closed the right ones. Cleanup is a human loop or a deterministic script. It is not a model call.

The pipeline works. It saves real time on the right kind of work. It also costs real time on a shape of work most teams don’t put in the estimate: Contract validators between agents, provenance stamping on every artifact, a shutdown script, a reconciliation pass, a human owner for every downstream system and an unshakable rule against the model doing its own cleanup. None of that is glamorous. None of it is what the demo shows. All of it is the runbook, and the runbook is what determines whether a pipeline is a lab experiment or something the on-call engineer trusts enough to sleep through. The teams that write the runbook first ship. The teams that write it after the first Sunday incident spend the next two quarters catching up.

This article is published as part of the Foundry Expert Contributor Network.
Want to join?

  •  
❌