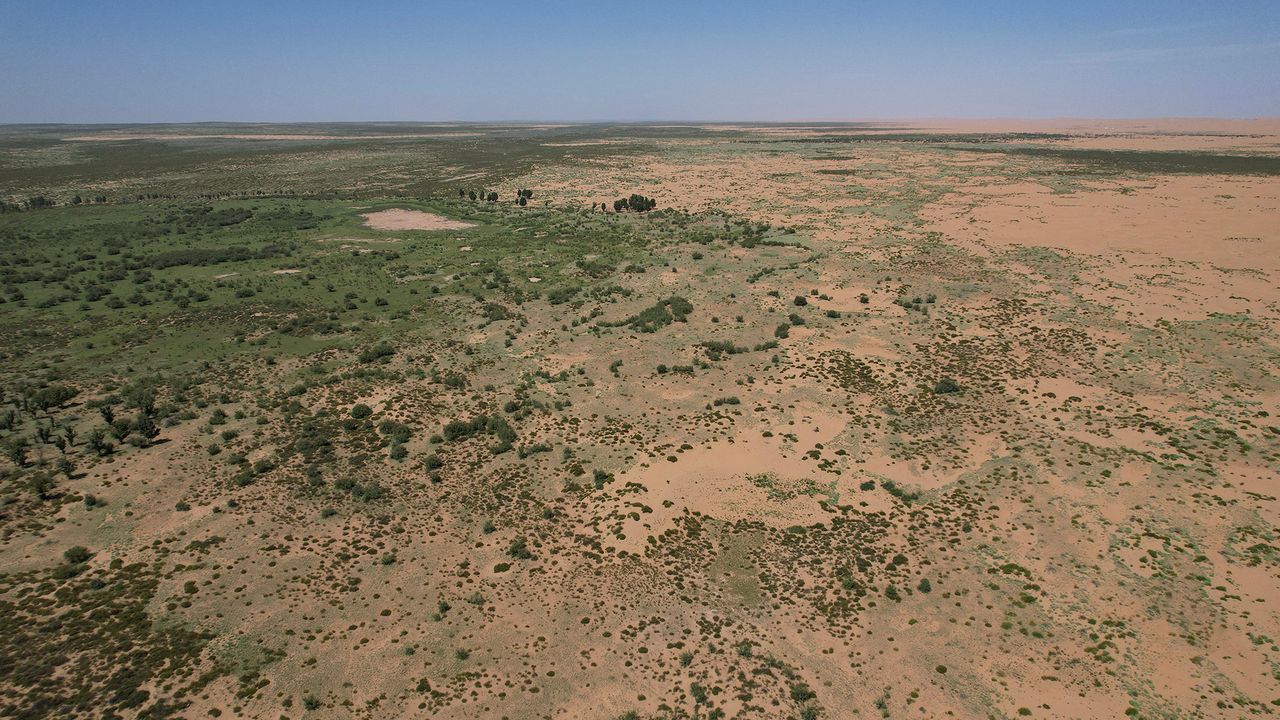
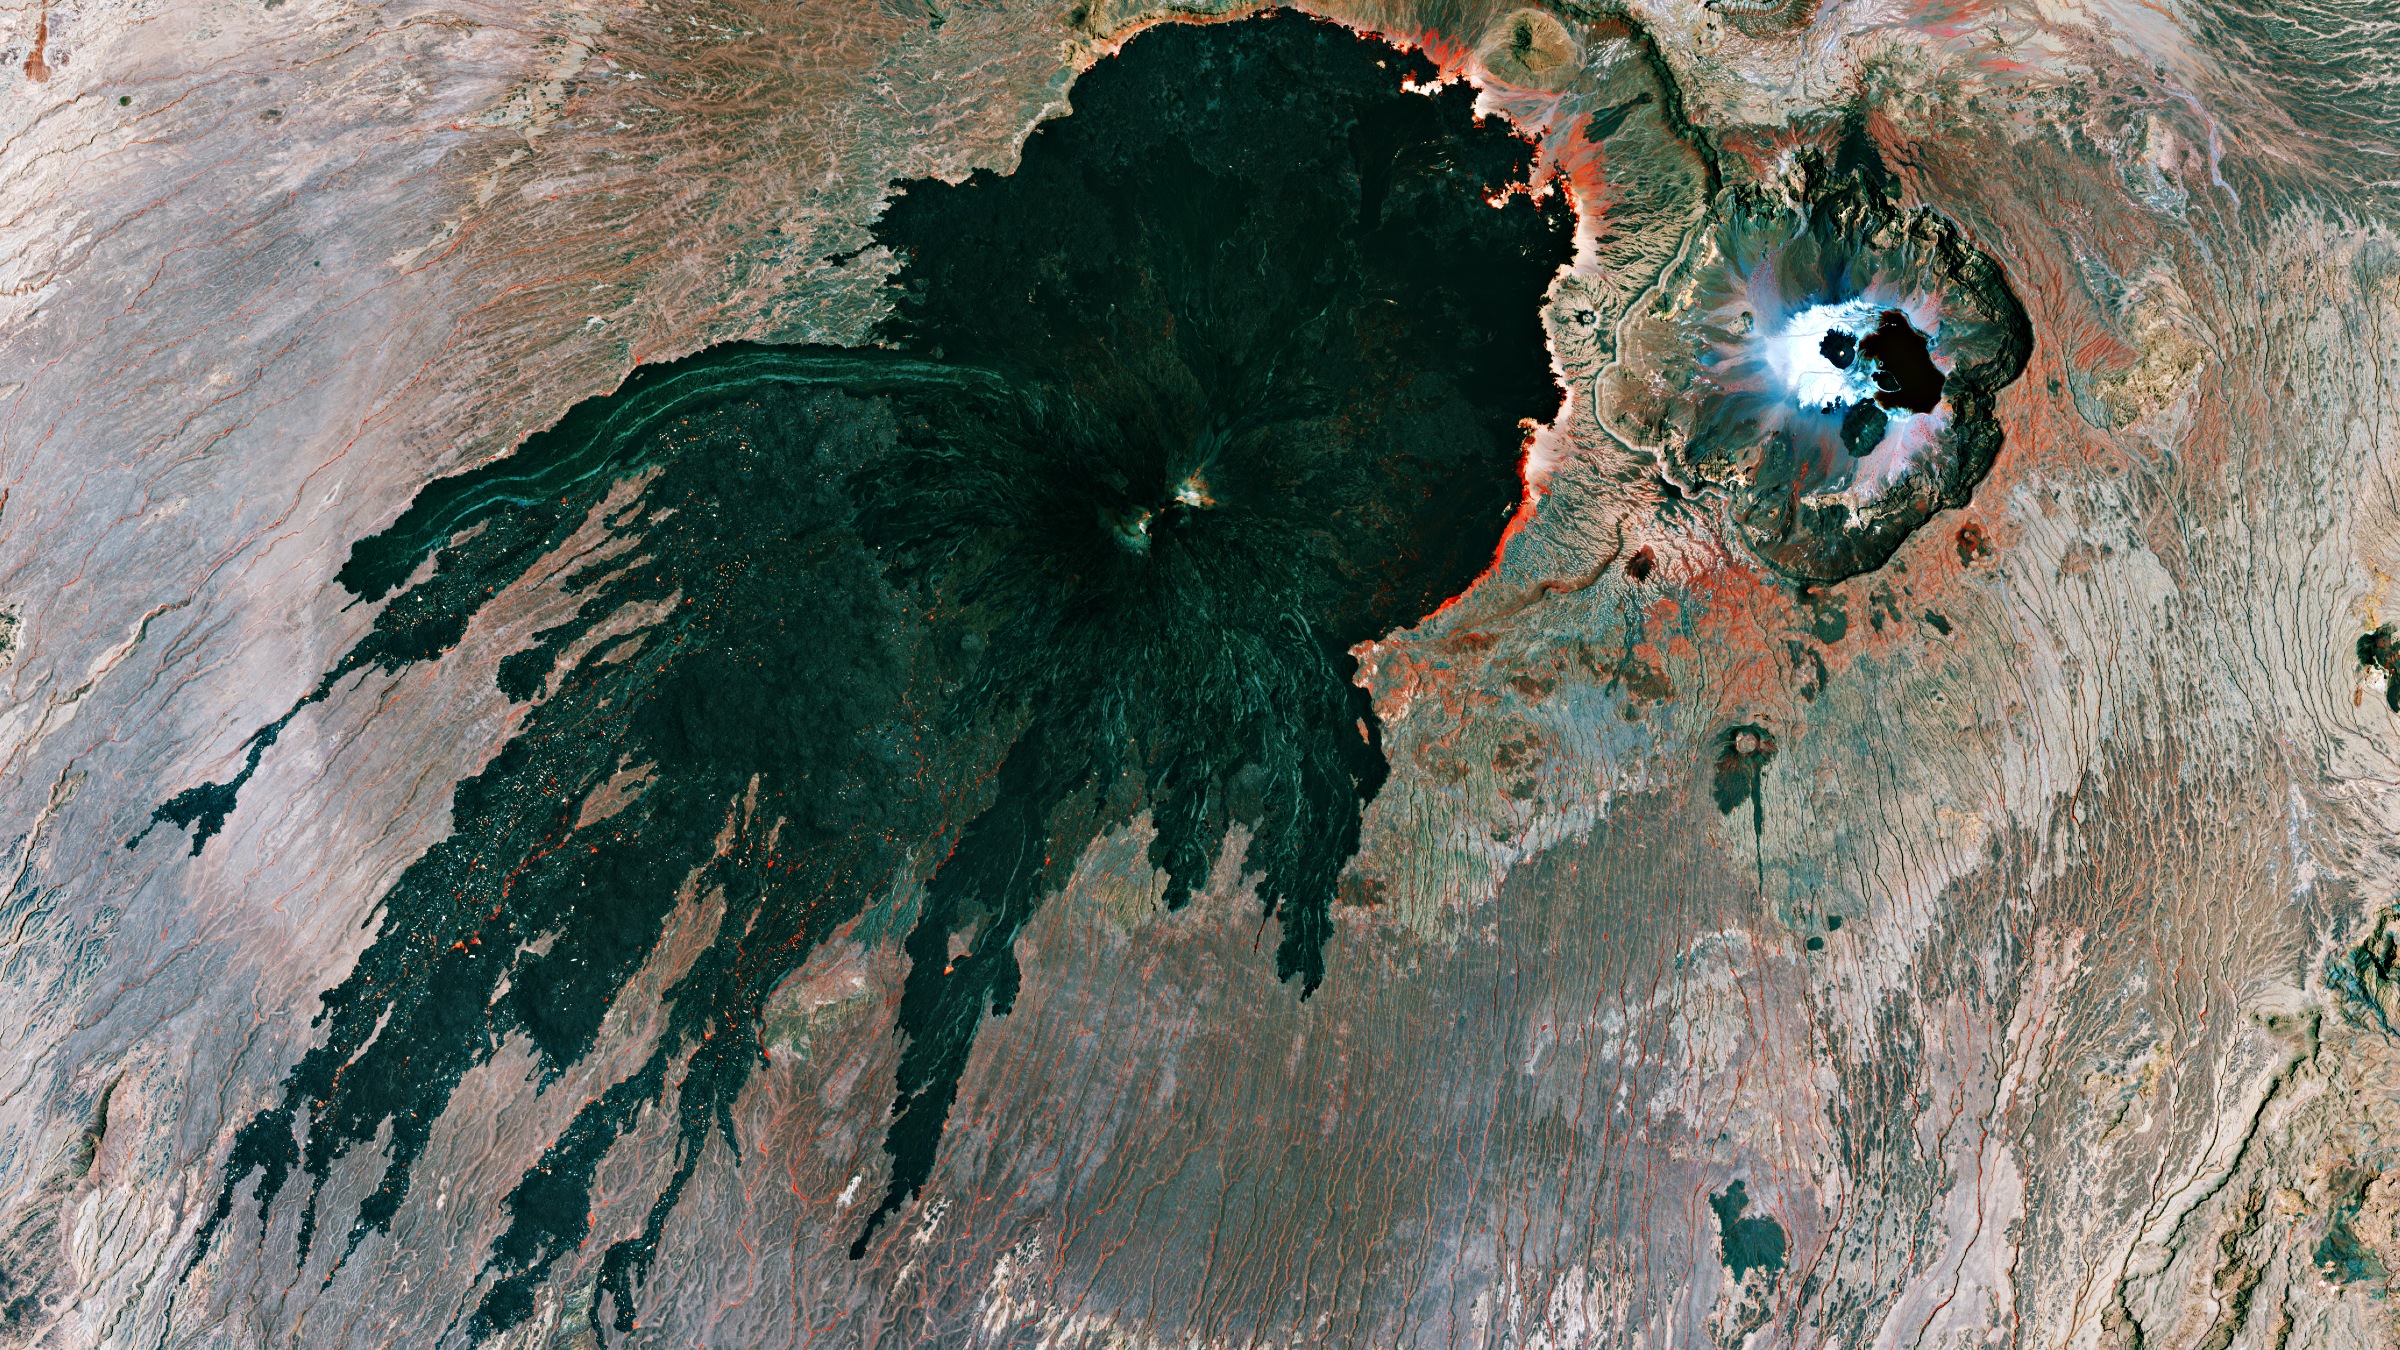
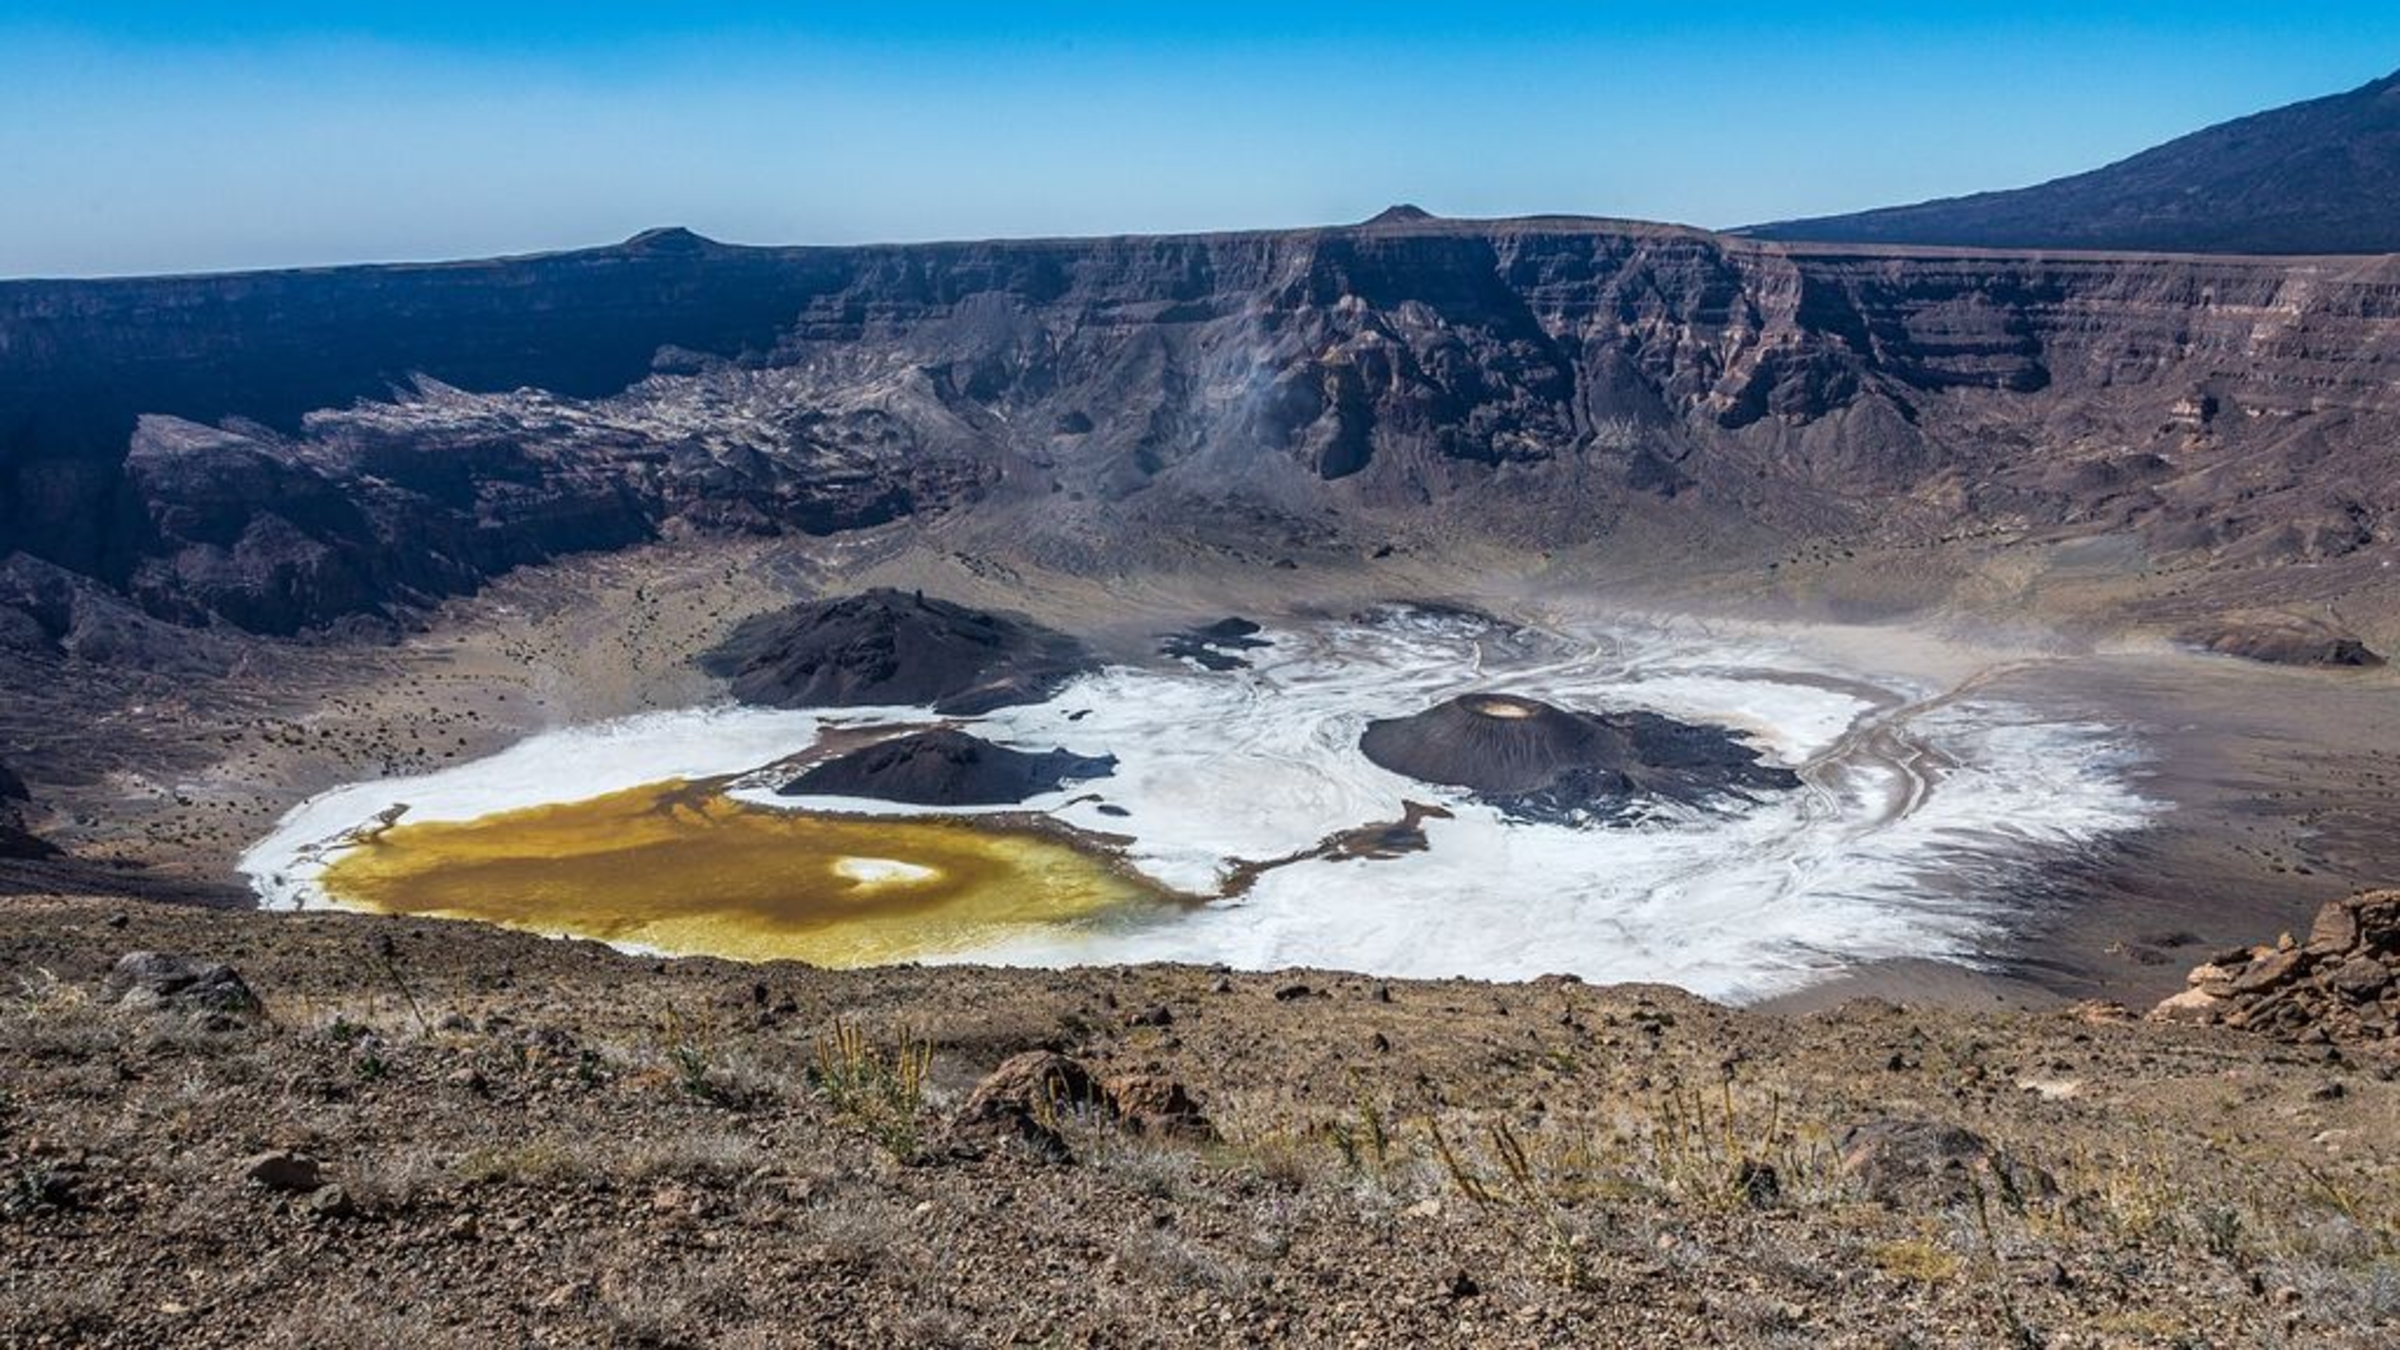
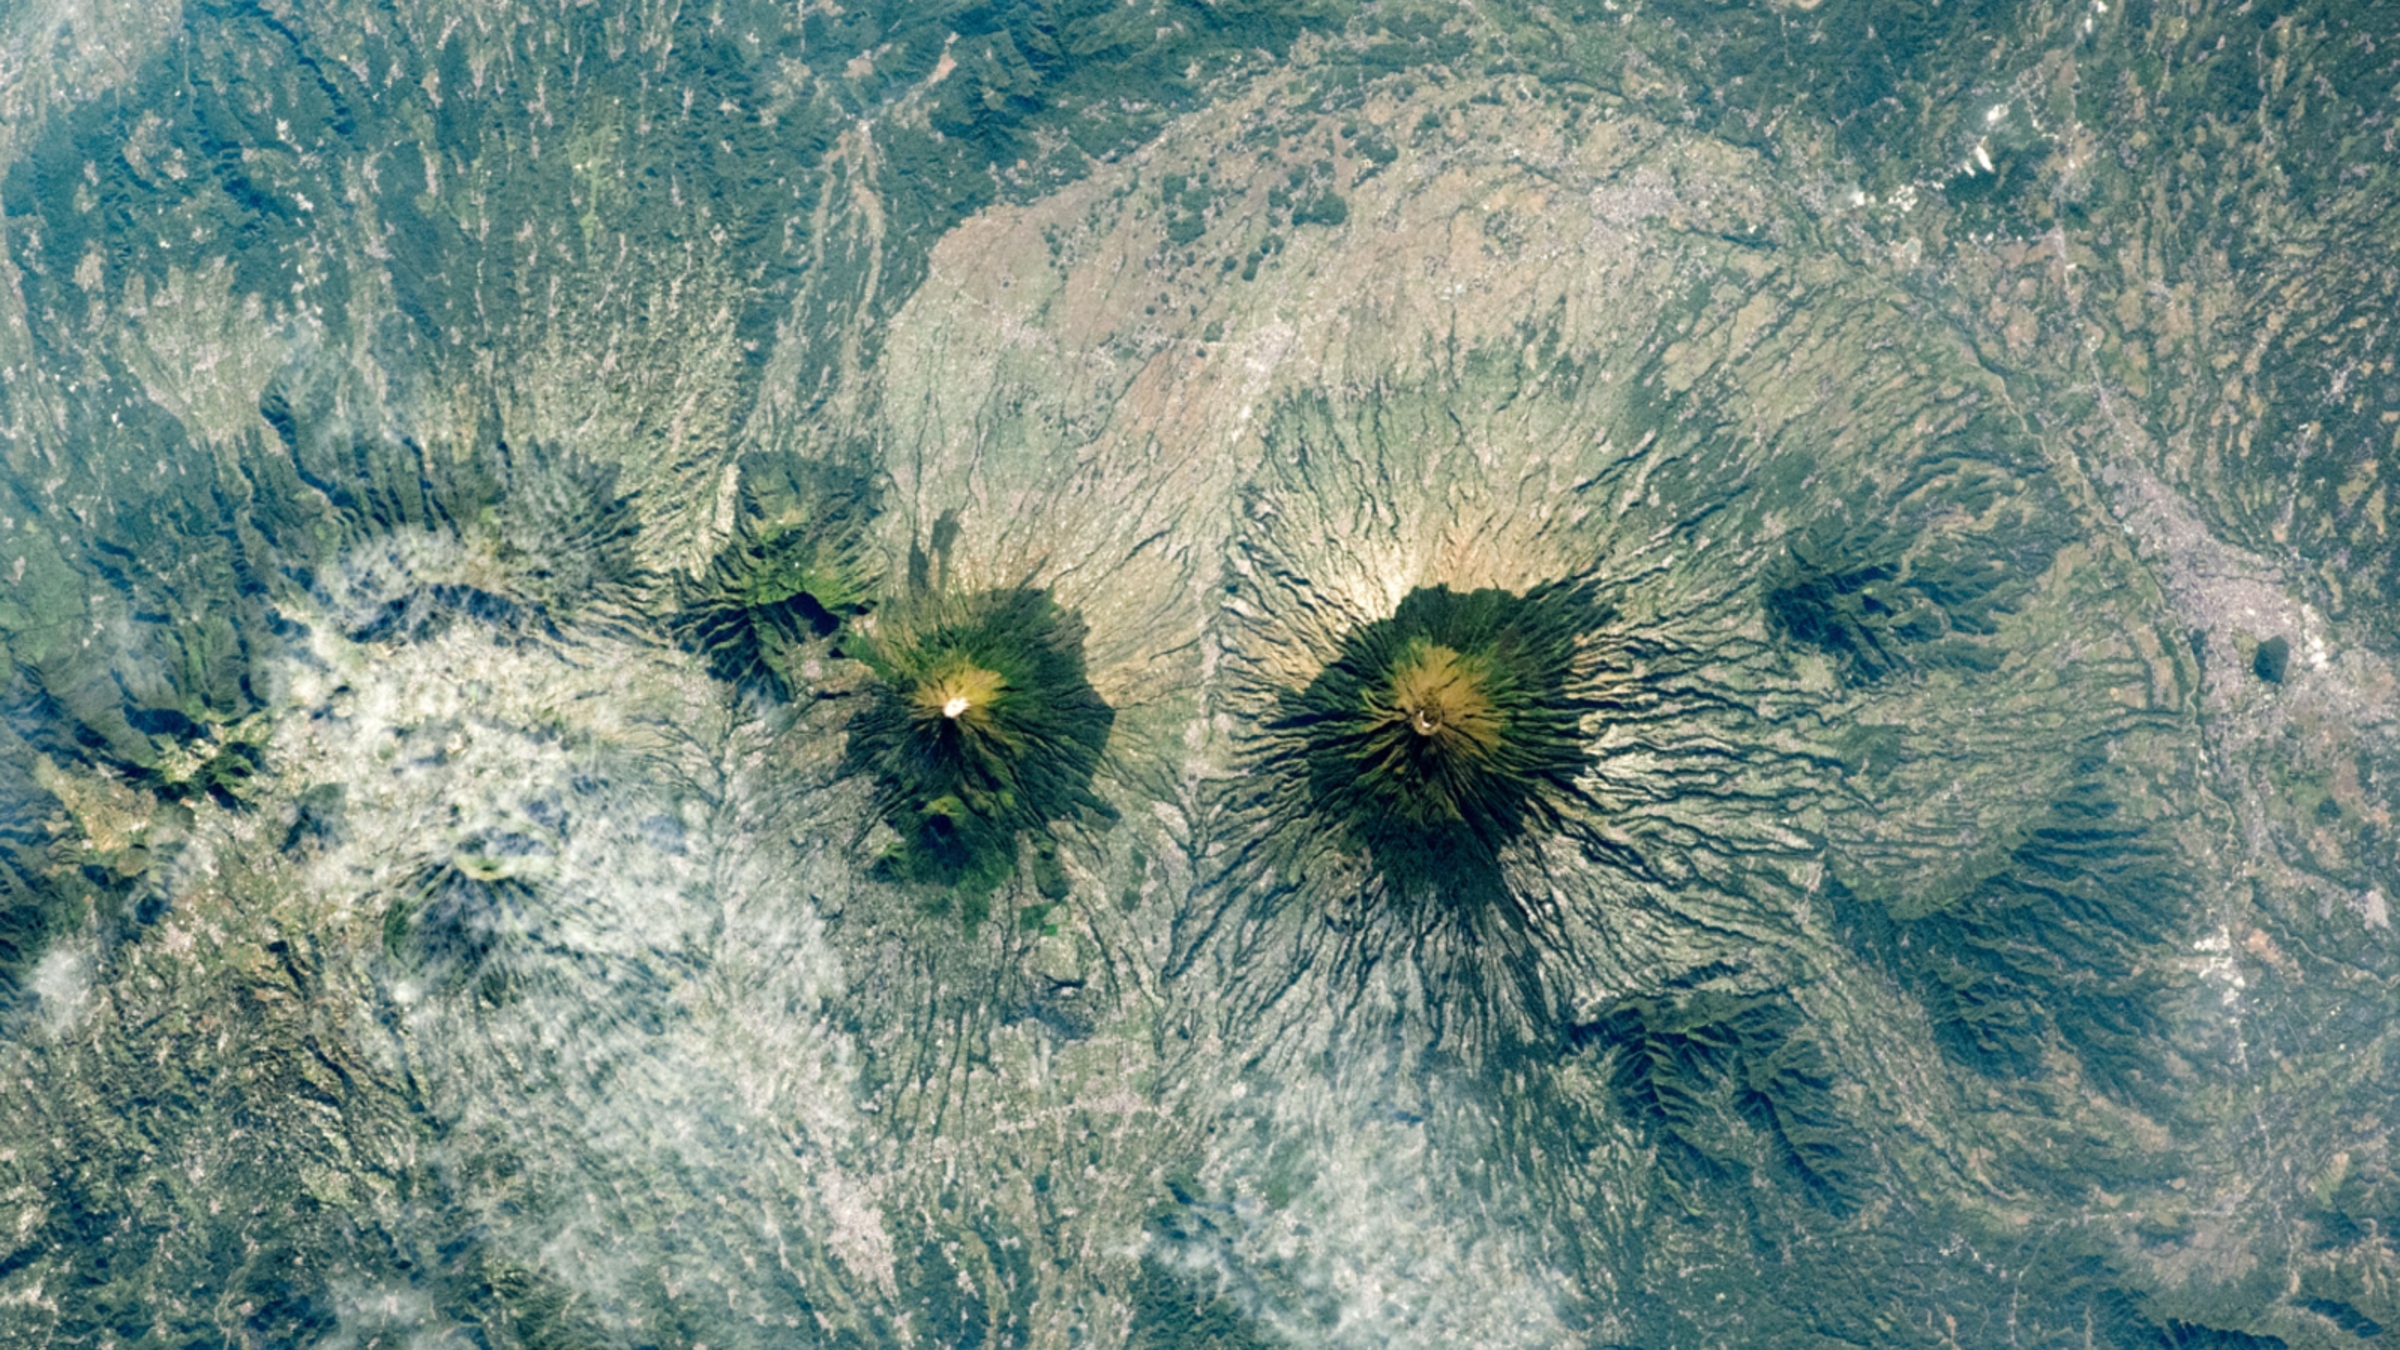
What it means: Abiotic means "without living organisms." Scientists typically use the term when referring to nonliving aspects of an ecosystem that affect organisms' growth or reproduction. Some abiotic factors might be light, water, fertilizer, nutrients or chemical elements, such as oxygen or sulfur. Others include the tides or rain. Sometimes, "abiotic" is used to describe the origin of a particular chemical. Abiotic methane, for example, comes from chemical reactions between rocks and water in Earth's crust, unlike biotic methane, which comes from decaying organic matter as well as microbes living in your gut.
How to use it in a sentence: A new "gold rush" of exploration is on for abiotic hydrogen, which forms when rocks react with water deep underground and could be a renewable, carbon-free fuel of the future.
Can you crack our science word of the day puzzle, Chain Word?
What it means: Abiogenesis is the emergence of life from nonliving matter through chemical processes. Scientists still don't know exactly how abiogenesis happened on Earth. Theories range from lightning strikes that could have scrambled water, methane, ammonia and hydrogen into amino acids and sugars — the building blocks of life — to chemical reactions at deep-sea vents. Abiogenesis is not the same as spontaneous generation, which held that living organisms such as maggots formed directly from decaying matter. It was a compelling idea for anyone who had watched meat rot, but Louis Pasteur, inventor of pasteurization, disproved it in the 1860s by showing that microbes could only grow from preexisting microbes.
How to use it in a sentence: All life on Earth may owe itself to an incident of abiogenesis more than 3.7 billion years ago.
Can you crack our science word of the day puzzle, Chain Word?
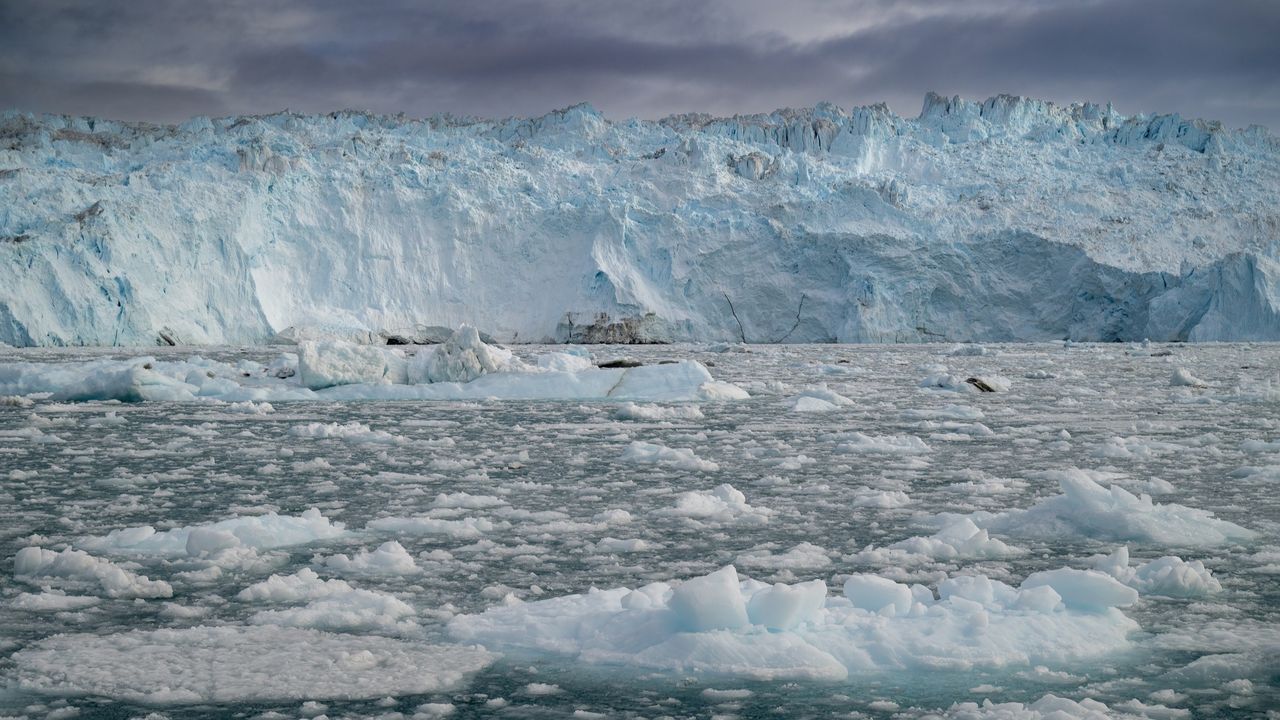
Runoff from Greenland's rapidly melting ice sheet could severely disrupt currents in the Atlantic Ocean that regulate the global climate, researchers say. But the fresh water won't trigger the complete and irreversible collapse of the circulation that some research predicts, a new study suggests.
By 2100, Greenland meltwater could cause a reduction in the strength of the Atlantic Meridional Overturning Circulation (AMOC) equivalent to an additional 10% to 20% on top of the weakening that many scientists already expect for this huge system of currents, researchers found.
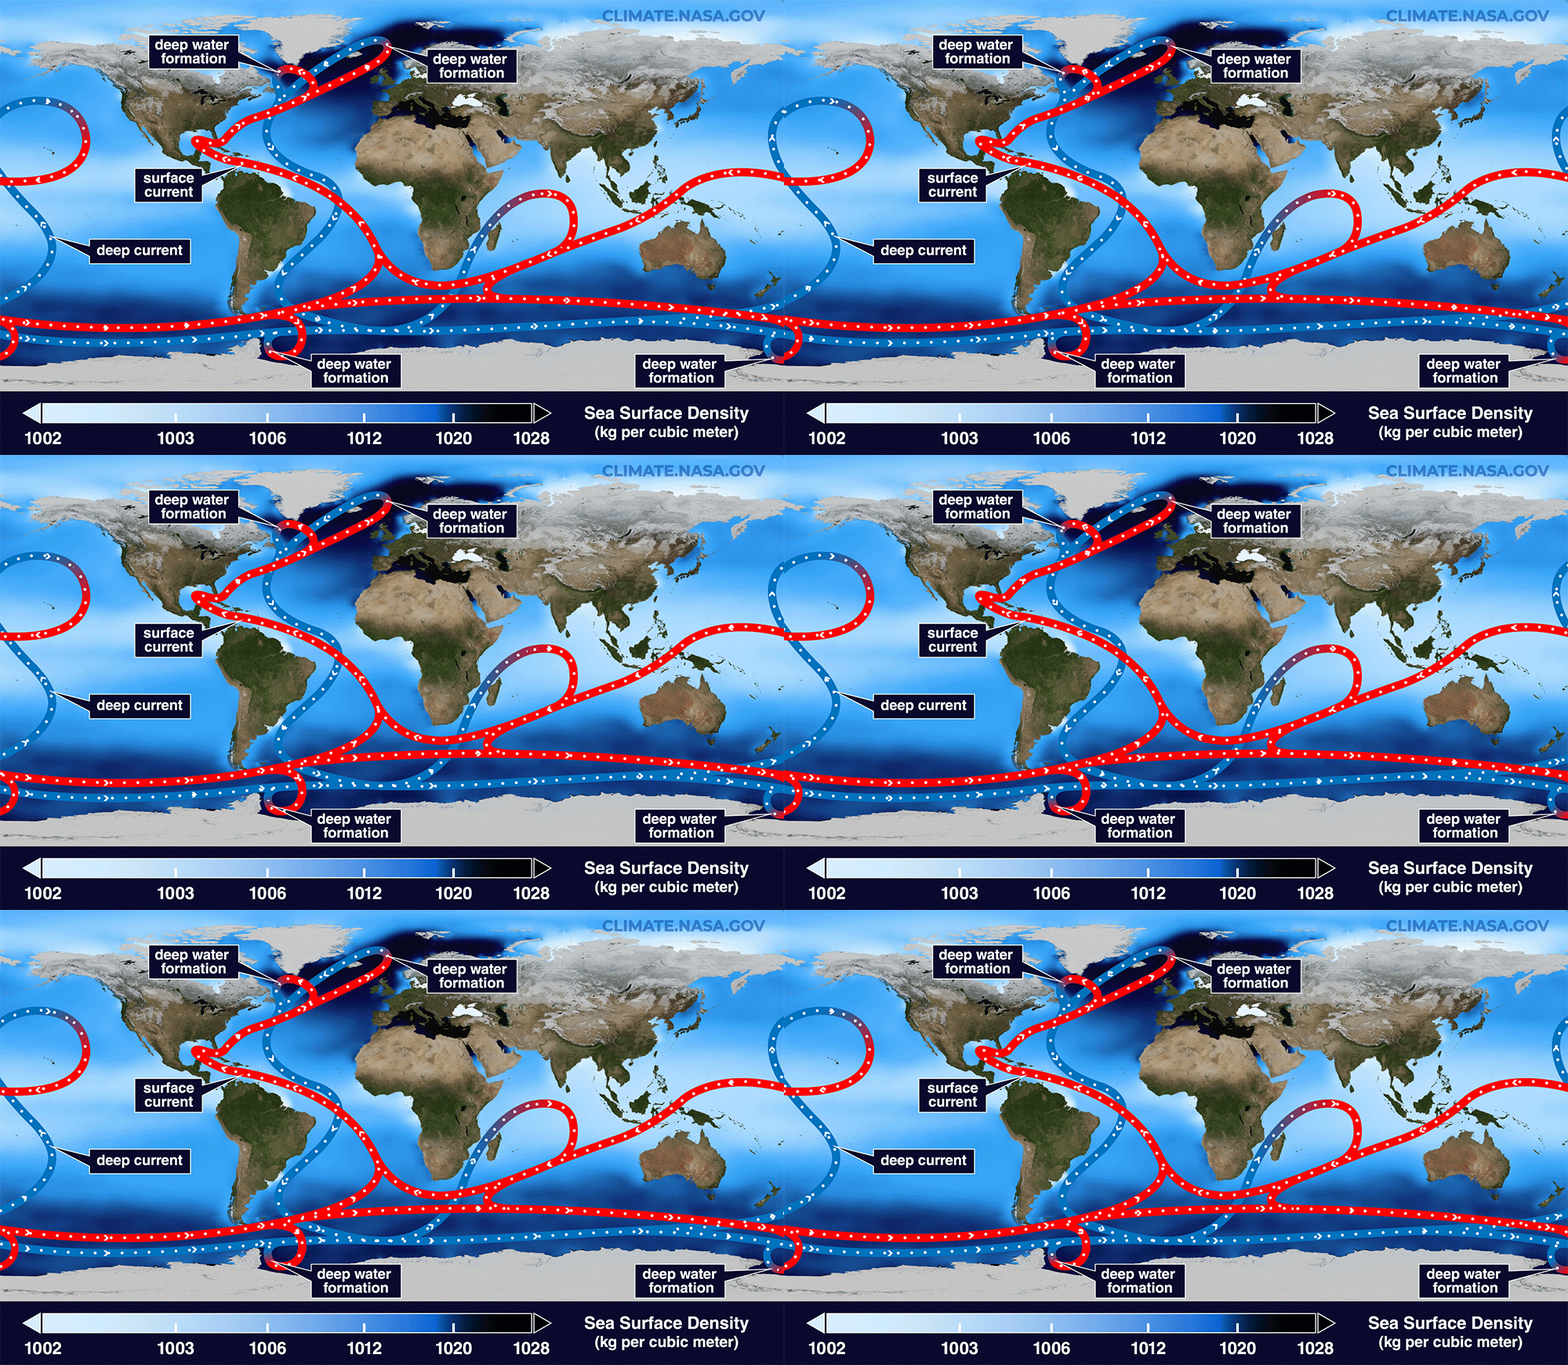
Previous research suggests the AMOC, which moves heat from the tropics to the Northern Hemisphere and cold water back south toward Antarctica, is at its weakest in more than 1,000 years due to Arctic ice melt and soaring ocean temperatures. Models indicate that the circulation will continue to weaken for decades to come, potentially unleashing freezing weather in Northwest Europe, additional sea-level rise along the U.S. East Coast and droughts around the equator.
The AMOC loops around the Atlantic Ocean, bringing warm waters north along the ocean's surface and cold waters south along the ocean floor. (Image credit: NASA/Goddard Space Flight Center Scientific Visualization Studio)
The new study revealed that by 2300, Greenland's ice sheet could cause a whopping 40% of AMOC weakening on top of the declines projected by some climate models if we continue to cook the planet. The results highlight the effects on the AMOC of a growing freshwater pulse from Greenland that most climate models currently don't take into account, the authors said.
"By the year 2100, yes, we have something, but the greatest fraction is what we add later," study co-author Jost von Hardenberg, a professor in the Department of Environment, Land and Infrastructure Engineering at the Polytechnic University of Turin in Italy, told Live Science.
Meltwater from the Arctic and Greenland slows the AMOC by preventing the formation of deep currents in the North Atlantic that drive the circulation south toward Antarctica. Deep currents form when masses of cold, salty water sink to the seabed, but inputs of fresh water and rising water temperatures are blocking this step by diluting and warming surface waters.
While Arctic meltwater is commonly integrated into climate simulations, researchers have been slower to include runoff from the Greenland ice sheet in models, partly because this runoff may not be as disruptive as Arctic meltwater on shorter timescales, von Hardenberg said.
"In order to represent correctly the Greenland melt, you need a specific, dynamic model for the Greenland ice sheet. It's nice to have, but it requires a lot of resources to develop," von Hardenberg said
The Community Ice Sheet Model version 2 (CESM2) is one of the few available simulations of the Greenland ice sheet. For the study, von Hardenberg and his colleagues used a global climate model called EC-Earth3, which does not include the Greenland ice sheet. The team added the ice sheet from CESM2 to explore how it might affect the AMOC over the next few centuries. Adding the ice sheet separately enabled them to compare AMOC weakening with and without Greenland, clearly revealing the impact of the ice sheet on the AMOC's strength.
The results, published June 19 in the journal Science Advances, suggest the Greenland ice sheet will have a big influence on Atlantic ocean currents, especially after 2100.
"Greenland starts really melting strongly only after that date," von Hardenberg said. "If you go farther in our simulation — we go up to the year 2300 — that is also when this meltwater really becomes extremely strong."
Yet unlike other studies that show the AMOC collapsing irreversibly under climate change, in this model, the circulation recovered once the team switched off the meltwater or dialed down greenhouse gas emissions. Both the simulations that didn't include the Greenland ice sheet and those that did had similar results, recovering partially when the meltwater was turned off and fully when greenhouse gas emissions were stopped.
The recovery in the model suggests that the AMOC is more stable than previously thought and doesn't suddenly flip from an active state into a collapsed one, von Hardenberg said. "It's consistent with a strong weakening, but not a shutdown," he said.
Overall, the findings show that it is important to include the Greenland ice sheet in climate models — something von Hardenberg and his colleagues are planning to do in the next version of the EC-Earth3 model.
"It's really something which is worthwhile doing to better constrain the uncertainty of these future simulations," von Hardenberg said. "If we have a larger set of models which include this component, we will be in a better position to try to answer the question, 'How much do we expect AMOC to decrease in different scenarios?'"
Other experts agreed that integrating the Greenland ice sheet in climate models will increase the accuracy of AMOC predictions.
"What makes the study particularly interesting is that it directly tests a process that has often been highlighted as an important source of uncertainty in future AMOC projections," said Jonathan Baker, a senior climate scientist at the Met Office in the U.K. who was not involved in the study.
The results are consistent with previous research showing that Greenland meltwater causes additional AMOC weakening, but whether the system could collapse is still uncertain, given that the team used only one model, Baker told Live Science in an email. "Repeating these experiments across a wider range of models will be important to assess how robust the findings are," he said.
Nicholas Foukal, an assistant professor at the University of Georgia's Skidaway Institute of Oceanography who was not involved in the study, said he doesn't think the use of a single model limits the analysis.
"I think this result is robust and I am glad to see the authors come to this conclusion in such a high-resolution and realistic coupled climate model," Foukal told Live Science in an email. "This finding also agrees with other modeling results that require immense amounts of fresh water, much more fresh water than is available on Greenland, to cause irreversible change in the AMOC."
However, a third expert said the model used in the study is unrealistic, because its parameters make the AMOC more resilient than those of other models. Therefore, the study should be replicated in other models to draw unbiased conclusions.
"While the experiment reported is interesting, its outcomes are neither surprising nor should be interpreted as exemplary for the whole model ensemble," Sybren Drijfhout, a professor of physical oceanography at the University of Southampton in the U.K., told Live Science in an email.
Researchers should investigate the impact of the Greenland ice sheet on the AMOC further, von Hardenberg said. "It would be interesting in the future to check it [the AMOC's recovery with Greenland meltwater] with other models, but of course it's encouraging to see it in one case," he added.
What's in the photo? A giant, milky-green swirl on the lake's surface
Who took the photo? An unnamed astronaut on board the International Space Station
When was it taken? Feb. 21, 2020
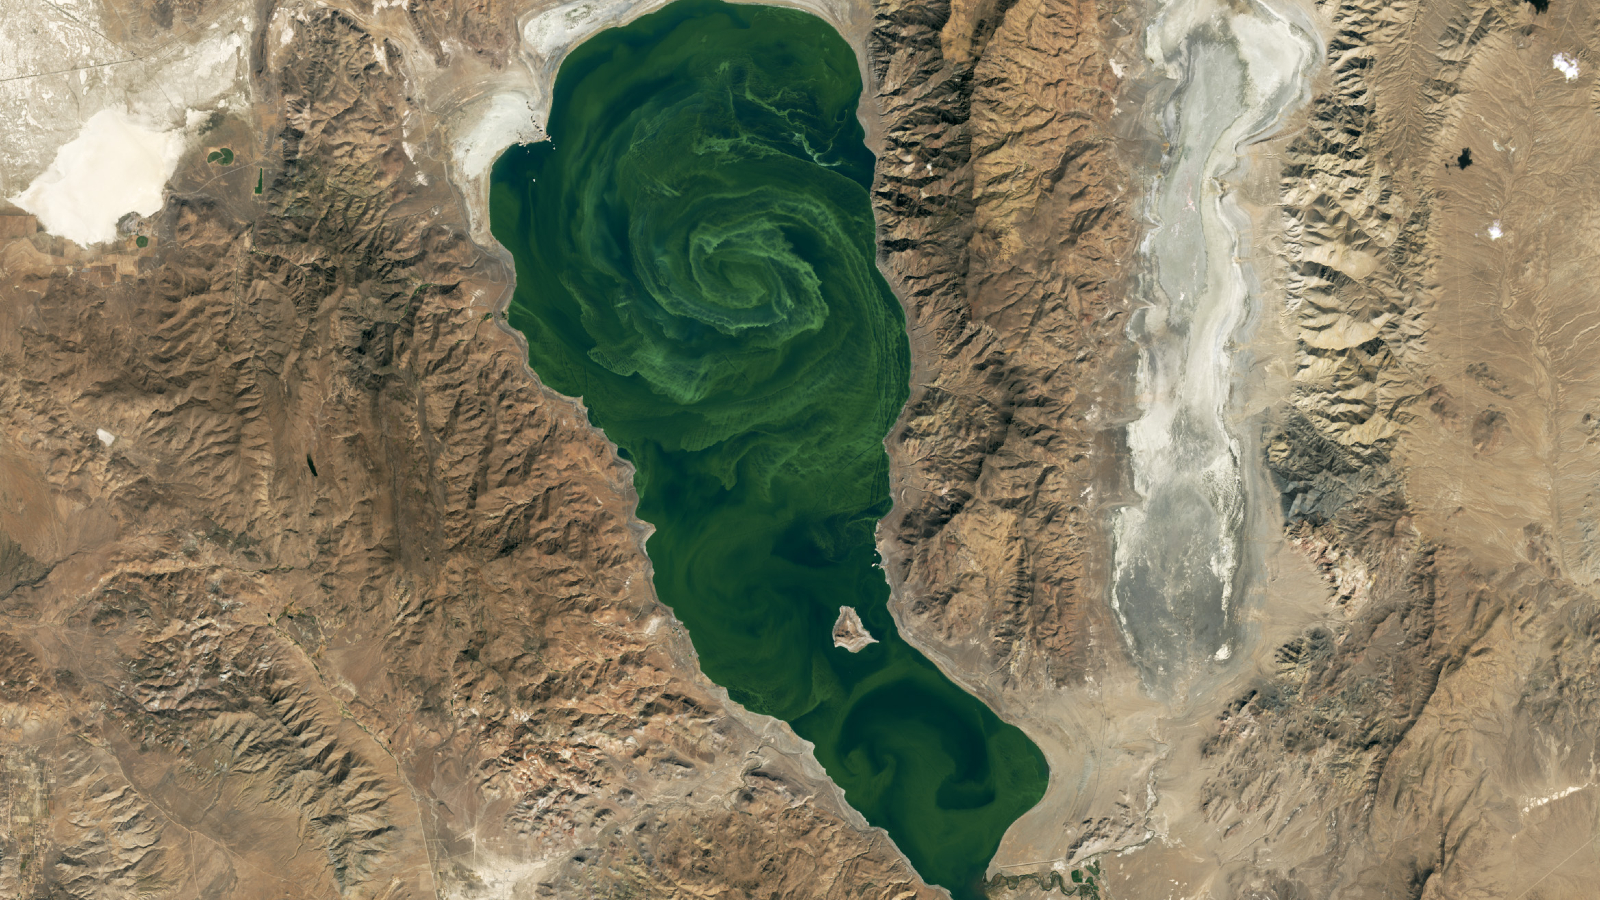
This eye-catching astronaut photo shows a cloud of sediment swirling into a giant, milky-green vortex in one of Europe's largest lakes.
Lake Skadar (also known as Shkodër, Shkodra or Scutari) is the largest lake in Southern Europe, with a surface area between 140 and 200 square miles (360 to 520 square kilometers), depending on the time of year. It is situated on the border between Montenegro, which surrounds the western half of the lake (left in the photo), and Albania, which encircles the lake's eastern shore. The body of water is split 65% to 35% in Montenegro's favor.
The lake's main water source is the Morača River, to the northwest, and its biggest outlets are the Bojana and Drin rivers, which start at the lake's easternmost point and eventually drain into the Adriatic Sea, which is partially visible in the bottom left of the photo. Skadar's southern shore is also hugged by a lofty mountain range, known as the Dinaric Alps.
During late winter and early spring, the lake's water level rises, and it usually fills with a milky-green substance that often gets whipped into a vortex by a combination of wind-driven surface currents and the natural flow of water between the lake's major inlets and outlets.
The swirling material looks very similar to blooming algae, but it is actually made of sediments — predominantly limestone and dolomite — that wash into the lake from the Dinaric Alps and other nearby mountains as the snow melts.
Lake Skadar formed millions of years ago and was once connected to the Adriatic Sea (visible in the background of this image). (Image credit: Wikimedia)
Skadar is a karst lake, meaning it was once a cave system that flooded and eventually collapsed, likely because the caves were made from the same easily erodible rocks that now swirl on the lake's surface, according to NASA's Earth Observatory. The lake is a "cryptodepression" because most of the lake's floor is below sea level.
The lake originally formed during the Cenozoic Era (66 million years ago to the present), according to the International Lake Environment Committee Foundation's World Lake Database. It is home to several small islands, some of which can be seen in the photo along the lake's southern shore. These include Beška, which is home to a pair of 600-year-old churches, and Grmožur, where the remains of a 19th-century fortification loom above the lake's surface.
The shipwreck of a paddle steamboat, named Skanderbeg, lies along the lake's western shore. Local partisans sank the vessel in 1942 after Italian soldiers commandeered it during the Axis occupation of Yugoslavia in World War II. When the lake's water levels are at their lowest, part of the shipwreck rises above the surface.
Skadar Lake is a biodiversity hotspot and has protected wildlife status on both sides of the Montenegro-Albania border. It is a particularly important site for birds; more than 280 avian species call it home, including the Dalmatian pelican (Pelecanus crispus) and several endemic species, according to BirdLife International.
The lake also hosts around 50 freshwater snail species — more than any other lake on Earth, according to a 2013 study.
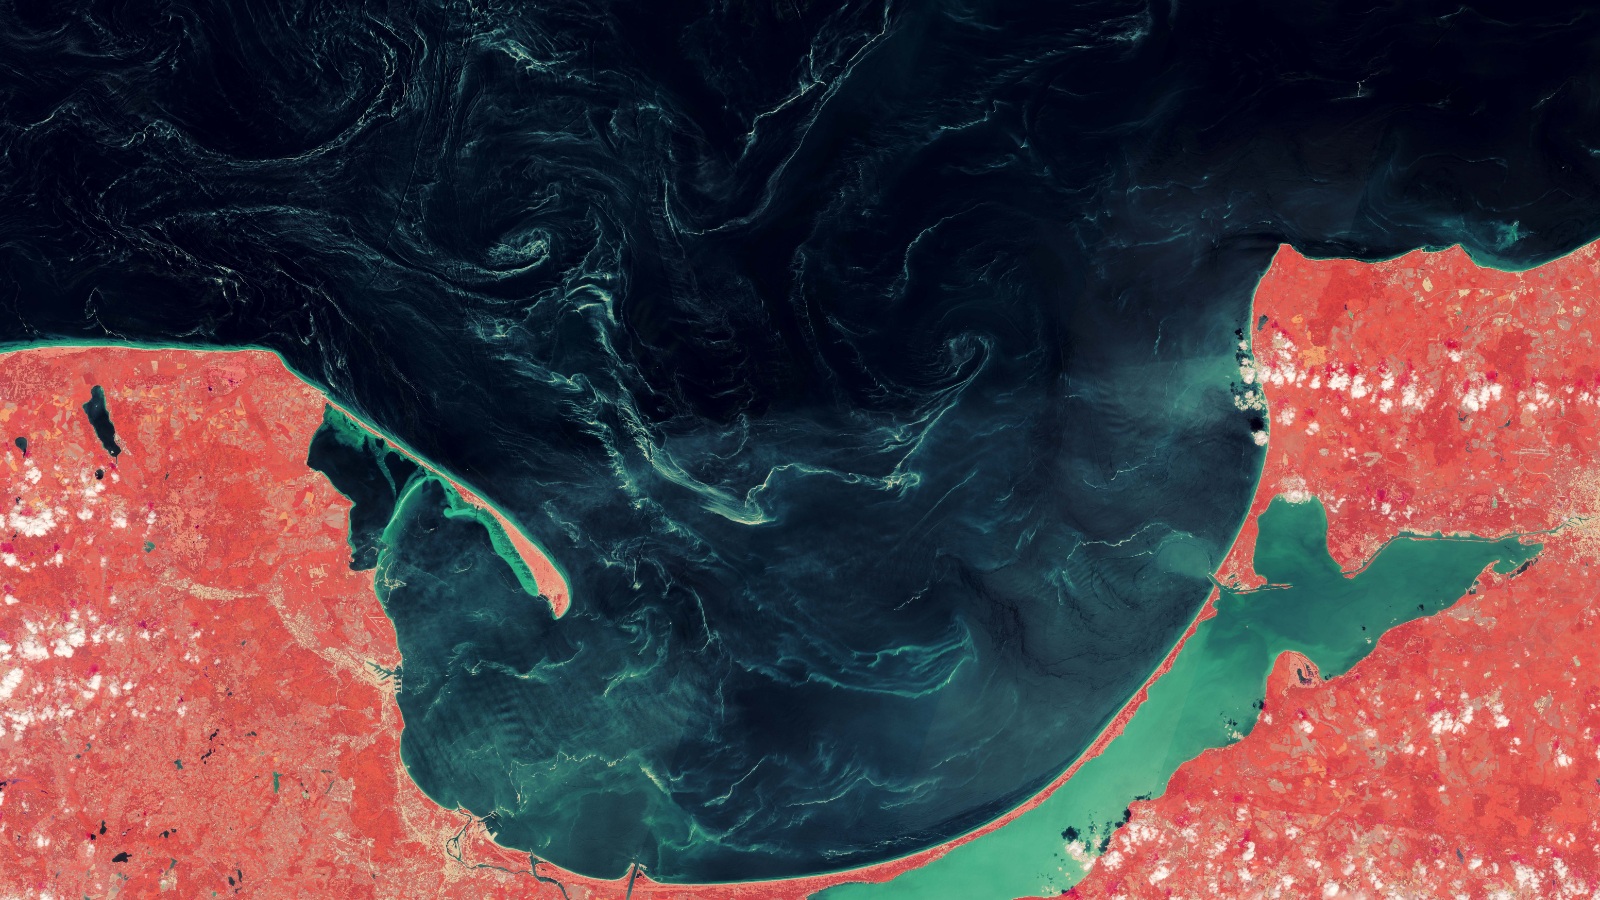
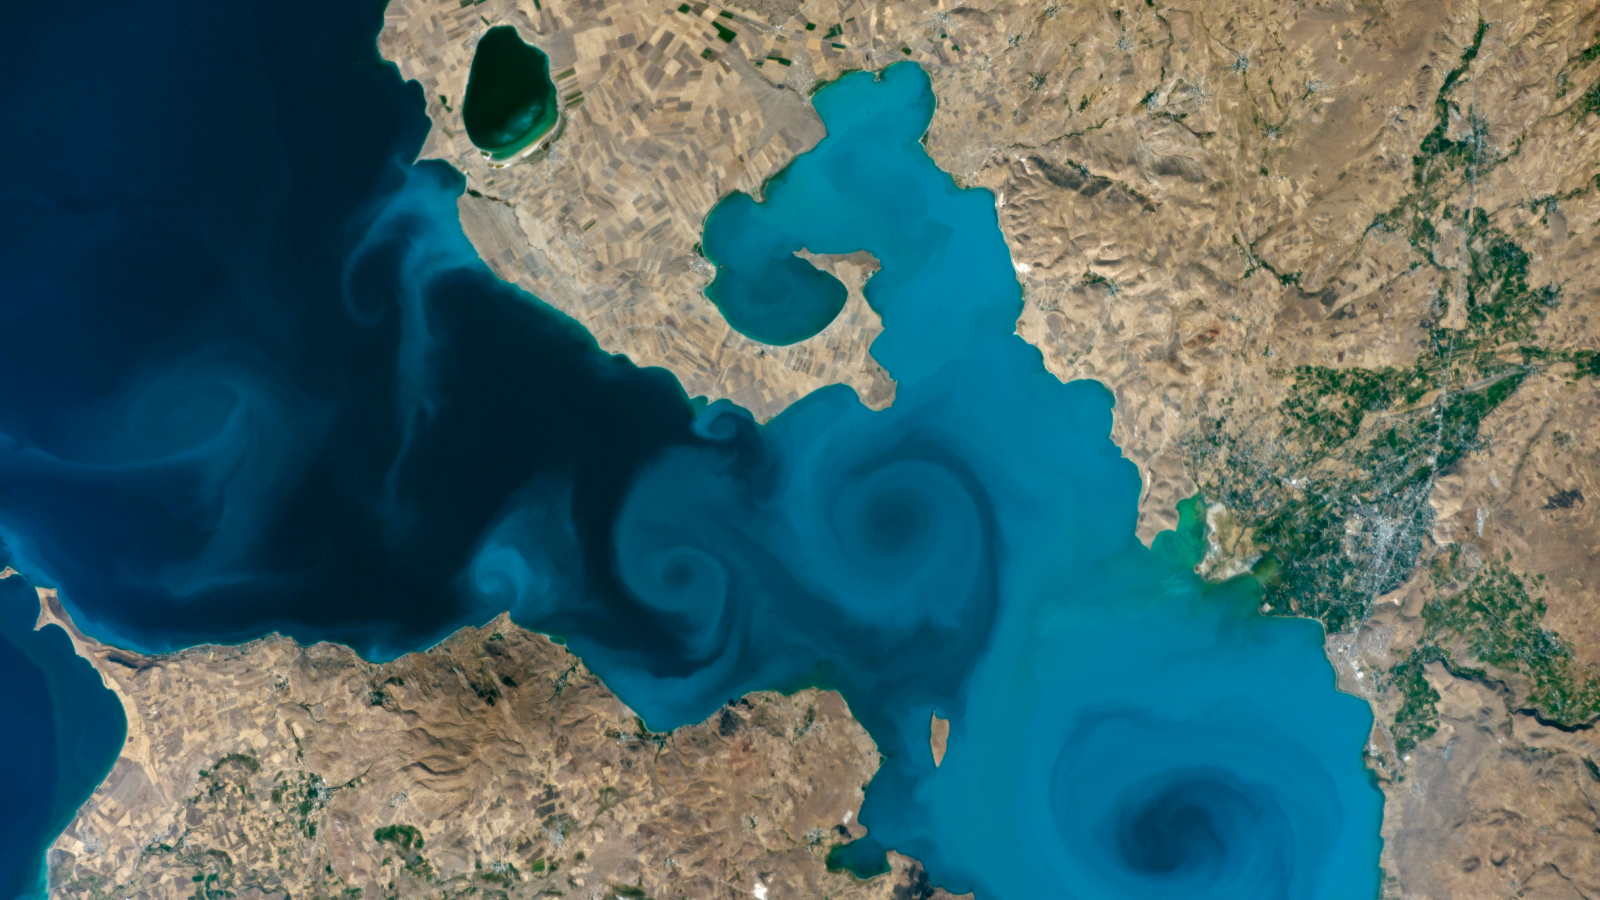
This 2018 satellite photo shows an unknown substance swirling across the Gulf of Gdańsk in Poland. Scientists were shocked to later discover what it really was.
What it means: Autotrophs are organisms that can feed themselves with inorganic substances such as light (for plants) or methane (certain microbes). Autotrophs were the first single-celled life-forms to colonize the planet, thriving on chemicals bubbling up from the subsurface at deep-sea vents or figuring out how to harness the sun for energy. Heterotrophs (like you, me and all fungi), arrived on the scene later to feast on these DIY-ers.
How to use it in a sentence: Stromatolites, microbial mats built by cyanobacteria, are autotrophs that thrived in ancient shallow seas.
Can you crack our science word of the day puzzle, Chain Word?
This year's El Niño will almost certainly become the strongest ever recorded, an analysis by a prominent climate researcher has warned. Though other scientists have cautioned that it's still too early to say what it will unleash.
Dynamical models now assign a 90% chance of the 2026-2027 El Niño being an all-time record event, sending temperatures in the Pacific Ocean up to around 3.6 degrees Celsius (6.5 degrees Fahrenheit)above average, according to an analysis by Zeke Hausfather, a research scientist at Berkeley Earth and an author of the Intergovernmental Panel on Climate Change's Seventh Assessment Report.
As the warm phase of a multiyear natural climate pattern, the El Niño could bring unprecedented temperature extremes to an already-warming world. The natural climate pattern is infamous for boosting global temperatures and fueling disruptive weather events such as floods and droughts.
A strong El Niño doesn't guarantee more severe weather impacts. The current El Niño models are also imperfect predictions of what's to come, and we won't know the true nature of this El Niño event until it peaks, likely later this year. However, forecasters have been warning of potentially supercharged El Niño conditions for months, and as more data emerges, there are more reasons to prepare.
According to projections by the World Meteorological Organization, the current El Niño — officially declared on June 11— is on track to rapidly develop into a "strong" event between July and September. The National Oceanic and Atmospheric Administration's (NOAA) Climate Prediction Center now predicts a more than 80% likelihood of very strong El Niño conditions taking hold by the end of the year, ranking this El Niño event among the largest in the historical record.
"These are striking forecasts," Emily Black, a professor of terrestrial processes and climate at the University of Reading and a senior scientist at the National Centre for Atmospheric Science in the U.K., told Live Science in an email. "El Niño forecasts always come with uncertainty, but the level of agreement between models at this time of year, combined with the observed warming already underway in the tropical Pacific, means this should be taken very seriously."
"The important point is that a very strong El Niño would substantially shift the odds of damaging weather in many parts of the world, particularly in the Global South — with severe impact on livelihoods," Black added.
The International Rescue Committee, a humanitarian organization, has warned that the intense El Niño conditions threaten to unleash severe flooding and drought across East Africa and Asia, hitting some of the most vulnerable communities, Al Jazeera reported Tuesday (July 14).
El Niño continues and will strengthen through the end of the year, with a 97% chance it will persist through early spring 2027. An #ElNino Advisory remains in effect. #ENSO https://t.co/5zlzaZ1aZx pic.twitter.com/ASC46wKOn4July 9, 2026
During El Niño, warmer waters gather east of the equatorial Pacific, forcing the jet stream south. In the U.S., this typically brings warmer, drier conditions to the Northeast, while the Gulf Coast and Southeast experience an increased risk of flooding. Globally, the net result of the warmer waters is more heat in the atmosphere, on top of the temperature rise from human-driven global warming.
"El Niño is a natural climate phenomenon, but it is now happening against the backdrop of a much warmer planet," Black said. "That matters because a strong El Niño releases heat and energy into an already warmed world."
"This does not mean every impact can be attributed simply to El Niño or simply to climate change," Black added. "The two interact. El Niño can load the dice towards drought in some regions, flooding in others, marine heatwaves, disrupted monsoons and unusually high global temperatures. Climate change makes many heat extremes more severe and can intensify heavy rainfall because a warmer atmosphere can hold more moisture."
The last El Niño event occurred between 2023 and 2024. Both years broke temperature records, with 2024 becoming the hottest on record and the first to breach the 1.5-degree- Celsius (2.7 degrees Fahrenheit) warming limit set by the 2016 Paris Agreement. The current El Niño is forecast to be more intense than the one in 2023 and 2024, with the projected "very strong" status putting it in a different class of severity.
Residents wade through stagnant water over a flooded road at Kohoto estate in Naivasha, Kenya on November 17, 2025 (Image credit: Tony Karumba/AFP via Getty Images)
The strongest El Niño in history?
Hausfather's analysis reports that there's around a 90% chance that the current El Niño will be the strongest ever recorded, with data from multimodel forecasts suggesting that it may obliterate the previous record.
"With the July runs now in from 667 ensemble members across 14 different seasonal forecast models, it looks like this year's El Niño is not only very likely to be the strongest event since reliable records began — it may end up the strongest by a truly mind-blowing margin," Hausfather wrote in The Climate Brink Substack post published Monday (July 13).
NOAA recognizes El Niño conditions when the eastern tropical Pacific Ocean is at least 0.5 C (0.9 F) warmer than the historical average, while wind, surface pressure and rainfall in the region are also consistent with El Niño conditions. The El Niño is then categorized as weak, moderate, strong or very strong. A very strong El Niño (above 2 C, or 3.6 F, warmer than the historical average) is often nicknamed a "super" El Niño, though it's not a scientific term.
The July models suggest that temperatures will likely sail past 2 C above average in the coming months and could potentially even exceed 3.5 C (6.3 F) above average by the end of the year. This is based on newly introduced sea surface temperature forecasts that account for rising background temperatures that can inflate El Niño warming figures. In the traditional and most widely used indices, the temperature-anomaly forecasts cluster closer to 4 C (7.2 F), with some even exceeding 4 C.
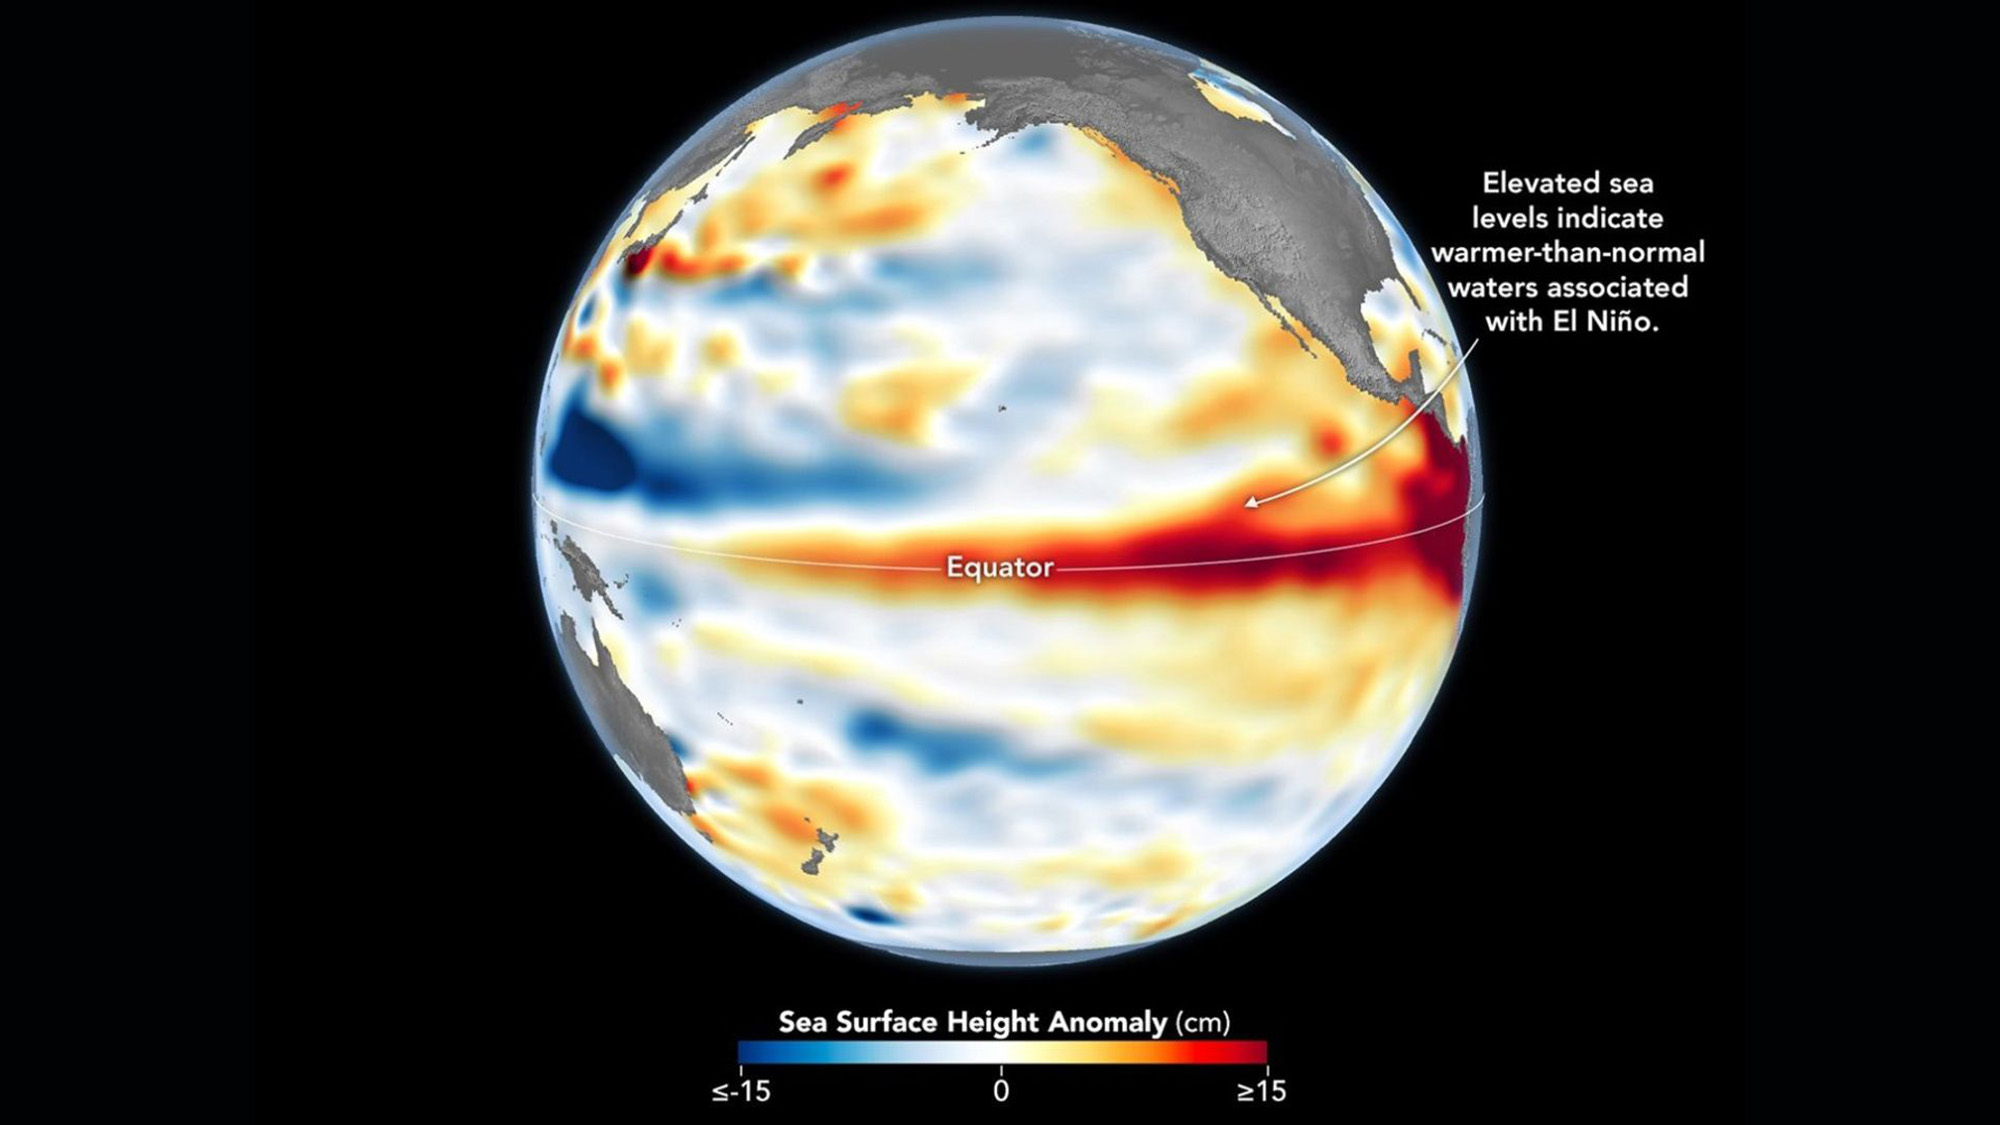
This Sentinel-6 Michael Freilich satellite image captures the massive wave of warm water and higher-than-usual sea surfaces (red) that stretched across the Pacific on June 8, just a few days before El Niño was declared. (Image credit: Data for the map were acquired by the Sentinel-6 Michael Freilich satellite and processed by scientists at NASA’s Jet Propulsion Laboratory (JPL).NASA Earth Observatory/Lauren Dauphin)
In The Climate Brink Substack, Hausfather noted that the multimodel median for the event's peak is currently forecast at 3.6 C (6.5 F), or around 0.8 C (1.4 F) hotter than the prior record holder (2.75 C, set in the 2015-2016 El Niño event). Hausfather wrote that around 91% of ensemble members (individual computer models) have this El Niño exceeding the 2015-2016 record at their peak — around 77% likelihood in the newly introduced indices.
However, Black stressed that the models are still estimates, and not guarantees.
"It is certainly plausible that this could become a record-breaking El Niño, and the latest forecasts make that a real possibility rather than a remote one," Black said. "However, I would still be cautious about treating any probability estimate as a certainty."
"There are two reasons for caution," she added. "First, this event has not peaked yet, and El Niño events usually reach their maximum strength later in the year. Second, 'strongest ever recorded' depends on the index, dataset and baseline used."
"Impacts are what matter"
The most severe El Niño events have left a trail of devastation in their wake. For example, the 2015-2016 El Niño saw a record-breaking hurricane season in the central North Pacific, severe drought in the Caribbean and Ethiopia, and, of course, abnormally hot global temperatures, according to NOAA's Climate.gov. If the forecasts pan out, the current El Niño will match or exceed the 2015-2016 event, as well as an even more infamous super El Niño that occurred between 1877 and 1878, long before modern recordkeeping of El Niño began in 1950.
The 1877-1878 event likely fueled an extreme drought that fed into the 1876-1878 global famine, which ultimately killed more than 50 million people — making it among the worst humanitarian crises in history. However, the disaster was far from just an environmental one, with extractive colonial agricultural policies helping to create conditions for a massive humanitarian crisis. Nonetheless, the famine highlights what can happen when environmental and socioeconomic factors converge.
The El Niño-Southern Oscillation cycle triggers a warm El Niño and then a cold La Niña roughly every two to seven years, with each phase typically lasting around nine to 12 months. Carbon Brief has predicted that 2026 is likely to be the second-warmest year on record, with the intensifying El Niño increasing the likelihood that 2027 will be the warmest year ever recorded.
The strength of an El Niño event does not necessarily correspond to the size of its influence or impact, according to the Climate Prediction Center. More severe events typically, but not always, increase the certainty of expected impacts. Black believes the impact of an El Niño event is more important than where it ranks in the observational record.
"Records are compelling, but impacts are what matter," Black said. "Even if it falls just short of a record, a very strong El Niño can still have serious consequences. Finally, these forecasts are concerning, but they are also useful: they give societies time to anticipate possible impacts and act before the worst effects are felt."
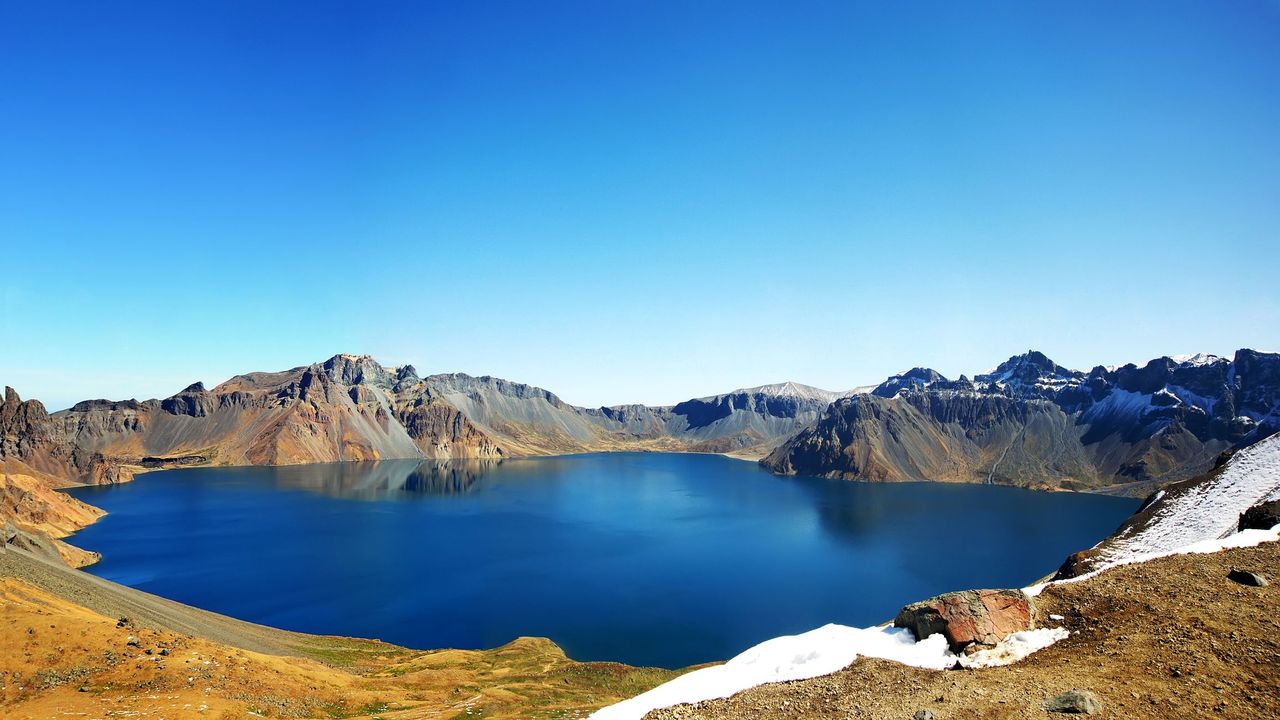
Why it's incredible: It is the deepest lake in China and sits at the top of a giant volcano.
Heaven Lake is a crater lake at the top of Mount Changbaishan (also called Changbai Mountain) — a colossal, dormant volcano on the border between China and North Korea that formed through successive eruptions over the past 2.6 million years.
Known in China as Tianchi, the lake is the highest and largest crater lake in Northeast Asia, according to UNESCO. It is also the deepest lake in China, according to a study published in March. The lake sits at an elevation of around 7,200 feet (2,200 meters), covers roughly 3.6 square miles (9.2 square kilometers), and has a maximum depth of 1,224 feet (373 m), according to the study.
Heaven Lake is surrounded by 16 peaks that belong to Mount Changbaishan. The lake fills a caldera created by past eruptions, the biggest of which was the "millennium eruption" that took place in A.D. 946 and remains one of the largest eruptions in modern history.
Water started to pool on Mount Changbaishan's summit after the prehistoric Tianwenfeng eruption, which scientists dated to between 70,000 and 40,000 years ago. Heaven Lake has periodically emptied and refilled since then due to precipitation, snowmelt, and an active geothermal system beneath the volcano that forces water up through fault lines.
Although hundreds of reports in the early 2000s claimed there was a creature with a head shaped like that of a horse living in the water, scientists have repeatedly said they are skeptical that any large creature could survive in Heaven Lake.
Mount Changbaishan is one of the best-preserved stratovolcanoes from the past several million years, according to UNESCO. Stratovolcanoes, also known as composite volcanoes, are volcanic mountains built from alternating layers of solidified lava, volcanic ash and rocky debris. Mount Changbaishan is an "open-air classroom for volcanism" because it recorded the different stages of multiple eruptions in astounding detail.
In North Korea, Mount Changbaishan is known as Mount Paektu or Paeku Mountain, meaning "white-topped mountain." The volcano's Chinese name means "forever white mountain."
China, North Korea and South Korea have clashed over the volcano in the past, as the mountain holds cultural and geopolitical significance for the three countries. Two border treaties between China and North Korea in 1962 and 1964 divided the volcano and Heaven Lake roughly down the middle, with North Korea securing 54.5% of the lake.
In the 2000s, China moved to develop the region around the volcano, opening the Mount Changbai Airport and the Mount Changbai Eastern Railroad to connect the region with the rest of the country.
A geological park surrounding the Chinese site of the volcano was officially designated a UNESCO Global Geopark in 2024.
Discover more incredible places, where we highlight the fantastic history and science behind some of the most dramatic landscapes on Earth.
A large pit discovered by an amateur astronomer on Google Maps in 2024 is actually a 390 million-year-old meteor impact crater, scientists have confirmed.
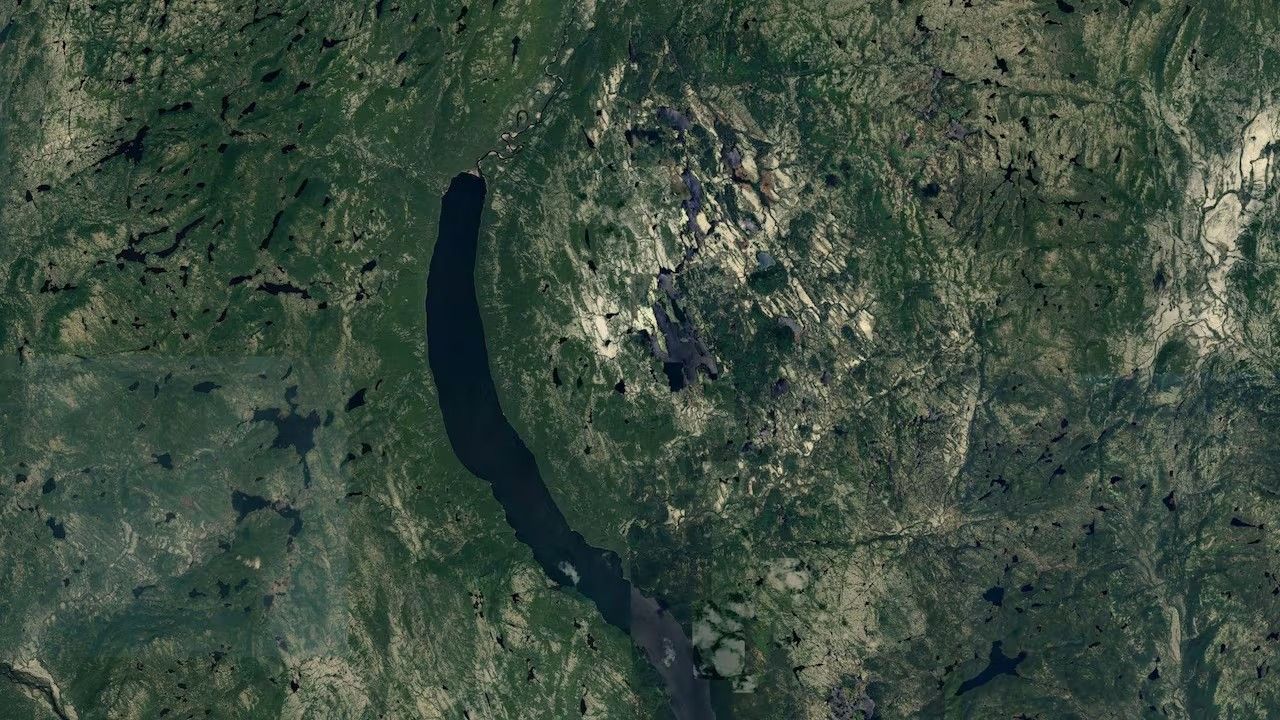
Joël Lapointe was planning a camping trail through Quebec's Côte-Nord region when he stumbled upon a large indentation in the terrain, CBC reported at the time. The pit, centered around Lake Marsal, was about 25 kilometers (15.5 miles) in diameter and a near-perfect ring — it didn't seem like a normal ditch. Lapointe eventually got in touch with French geophysicist Pierre Rochette, who said that the surrounding topography was "very suggestive" of an impact crater.
Initial testing of samples retrieved from the site contained a mineral called zircon often formed during meteor impacts. However, zircon's presence alone was not enough to prove the crater's extraterrestrial origin story. So a team of scientists had visited the pit in person.
"One of the key things we look for is evidence for shock metamorphism, which can only occur due to the immense pressures created by asteroid or cometary impacts — or nuclear explosions," Gordon Osinski, a professor of planetary geology at Western University, told Live Science in an email. "Most of these features are microscopic, so you can only confirm in the lab with samples."
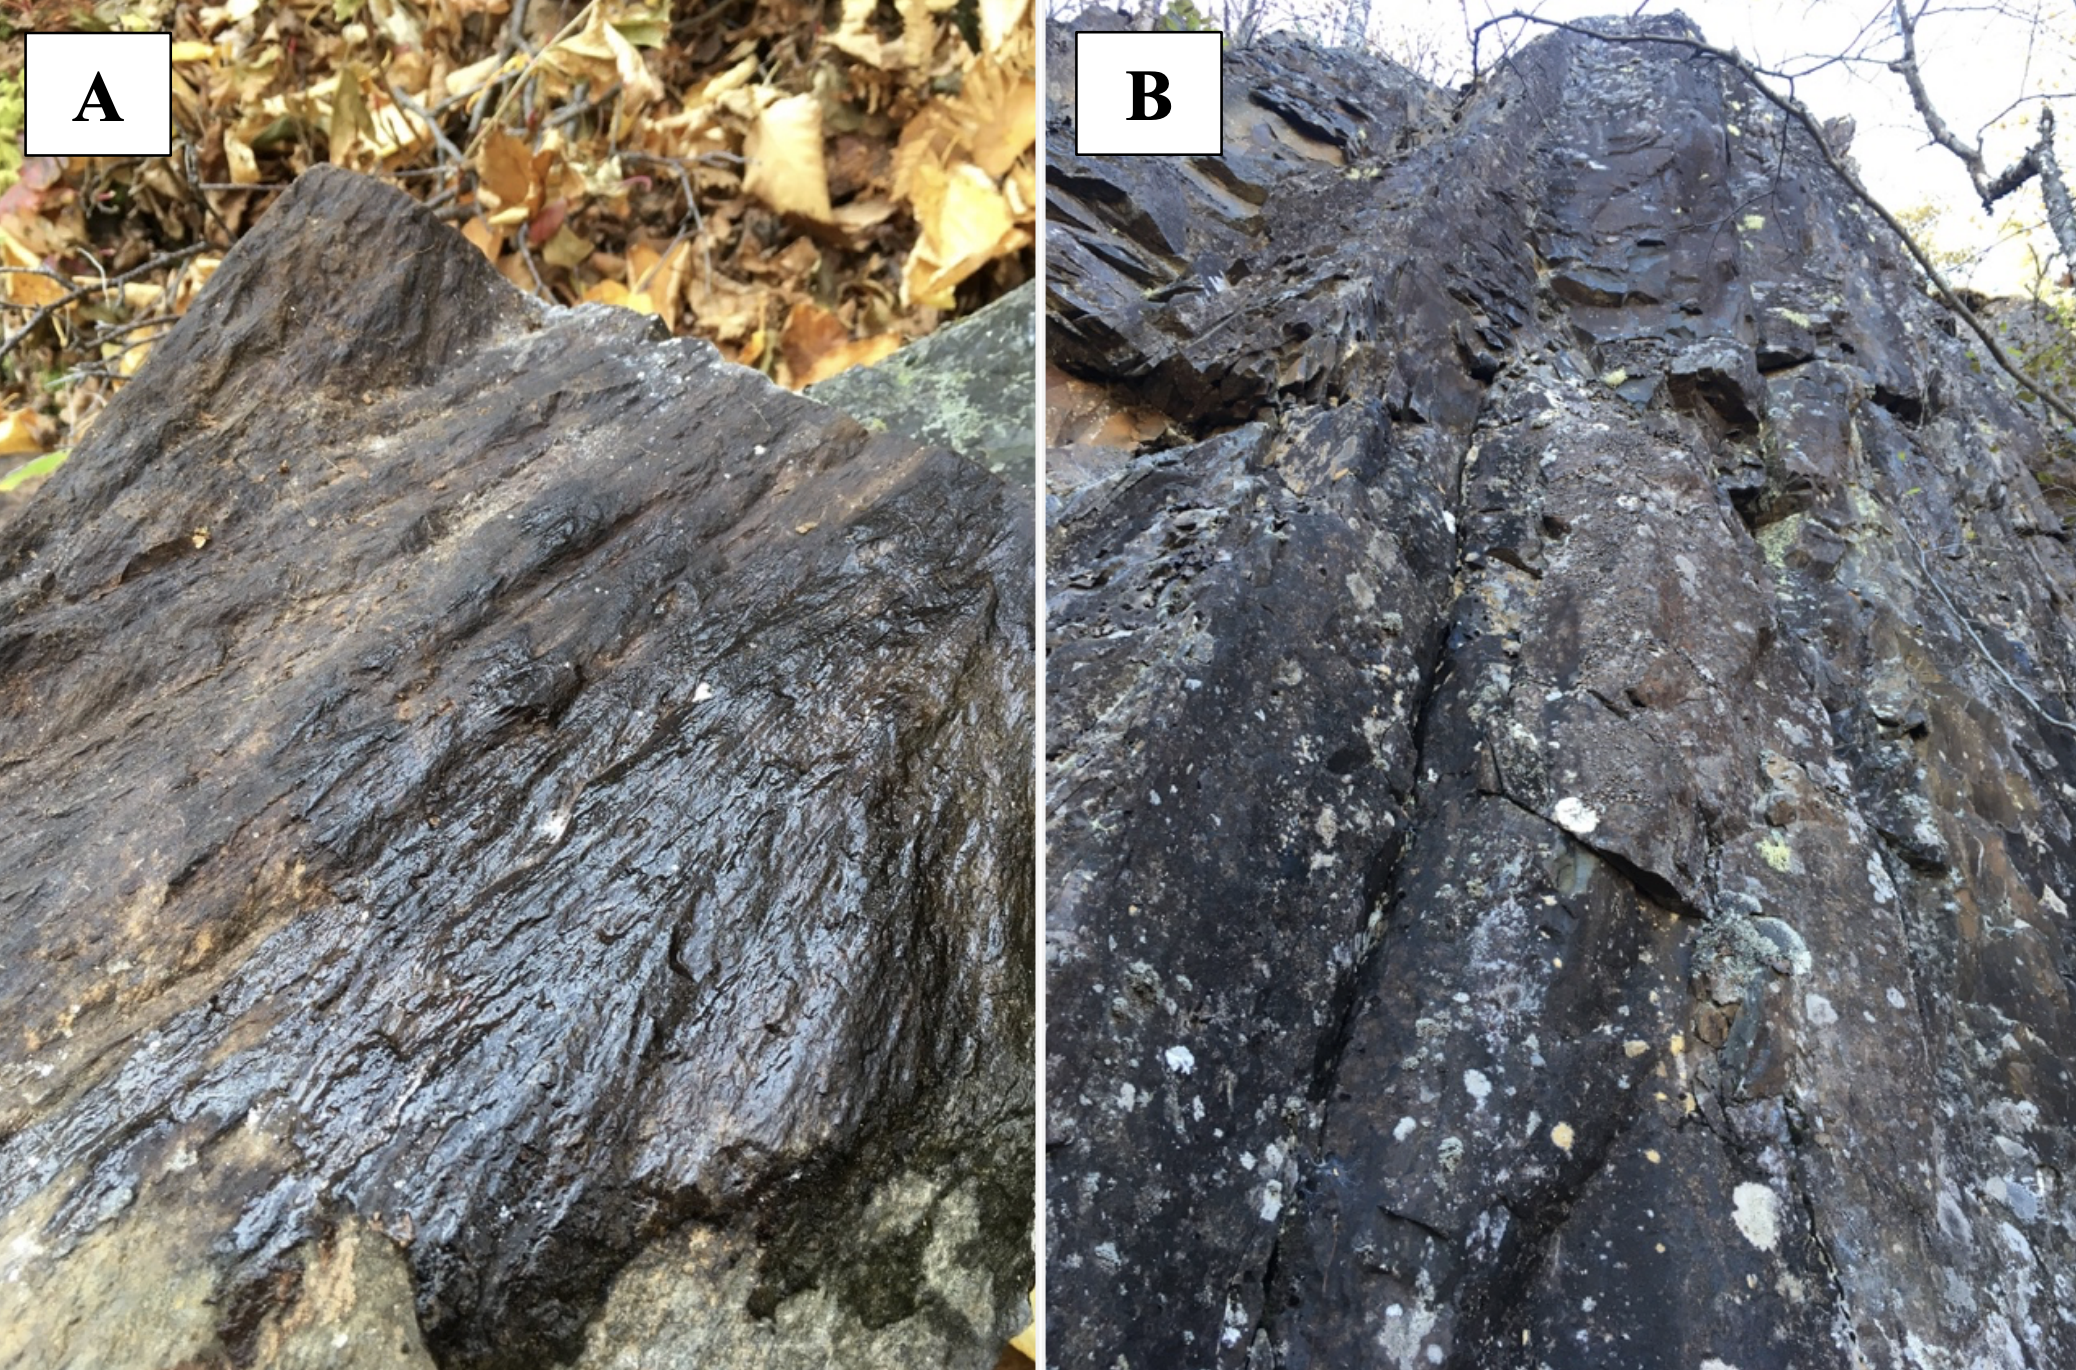
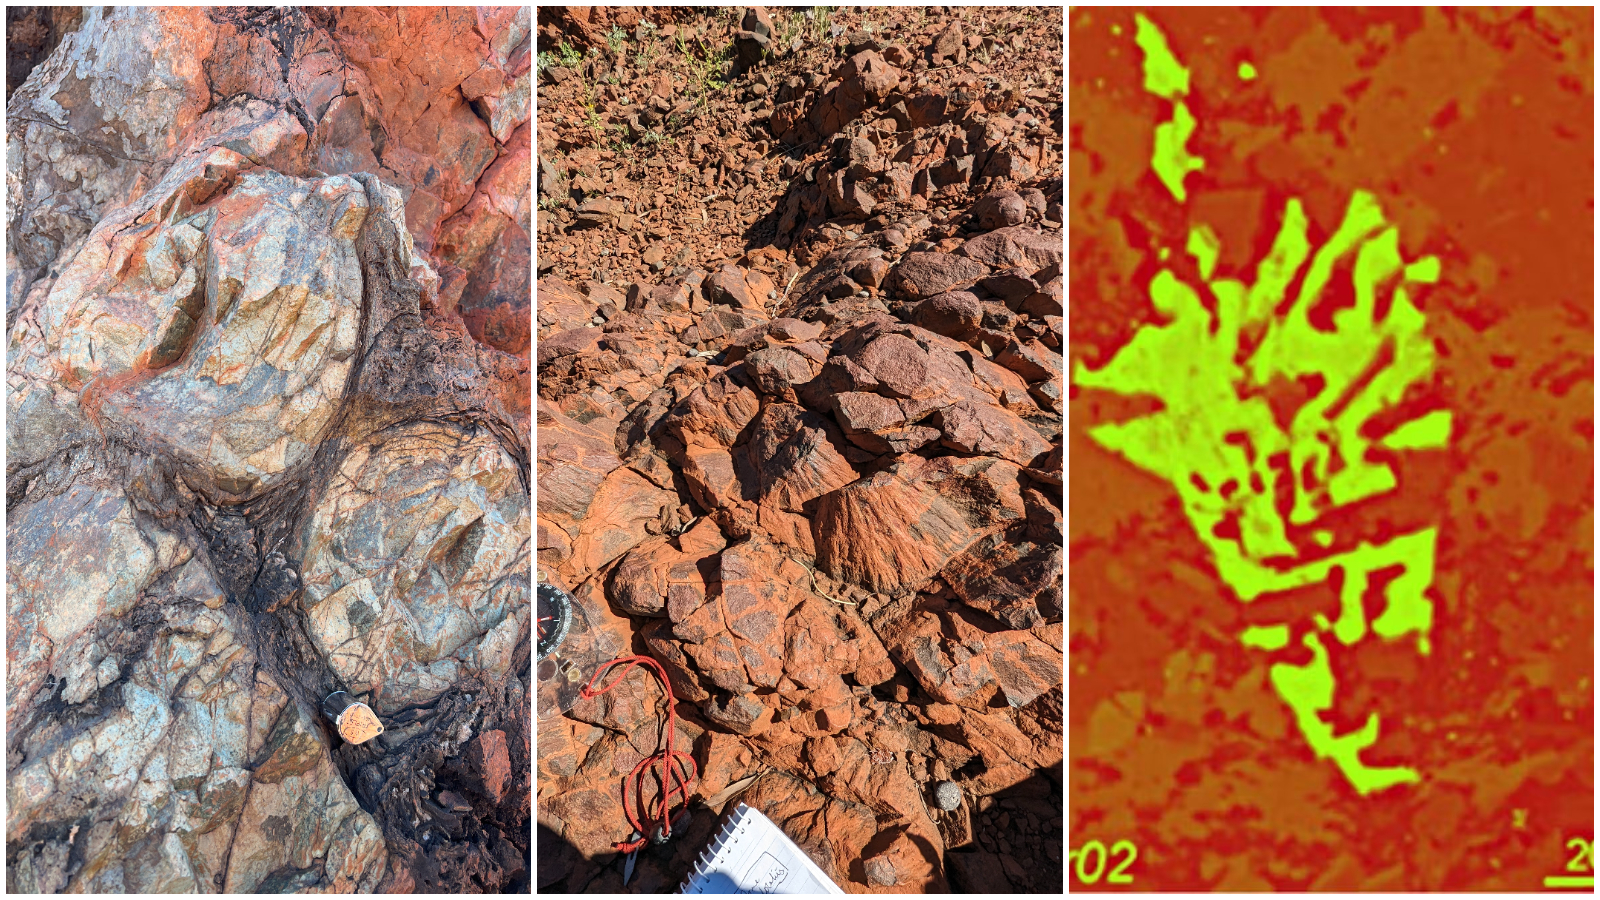
But there is one feature Osinski said can be seen with the naked eye: grooves or lines in the rock's surface called shatter cones, which are caused by shockwaves passing through the ground.
In October 2025, Osinski and a team of geologists visited the site to investigate whether any of these features were present. "This was one of the most arduous expeditions I’ve ever done — and I’ve done 25 expeditions to the Arctic and 6 continents," he said. "The terrain was incredibly rough and rugged, plus [there were] lots of bugs."
But they eventually found what they were looking for — shatter cones. They also discovered big cliffs of impact melt rock, created by the intense temperatures and pressures produced by a meteor impact. "You can melt literally tens of cubic kilometres of the Earth's crust when you get a big enough asteroid hitting," Osinski told CBC.
A) Shatter cone at the center of the structure. B) melt rock 4 km (2.5 miles) west of the structure center (Image credit: Gattacceca, J. et al.)
Osinski, who runs a website called Impact Earth dedicated to verifying meteor impact sites, is used to getting emails about strange looking satellite images. "I get lots of messages from the public thinking they have found a crater and 99/100 turn out not to be the case," he told Live Science. "This is one of those rare examples that shows this is possible."
So far, we know of roughly 200 impact craters on Earth, 31 of which have been found in Canada. "Typically about 1 or 2 craters are discovered per year, but these are typically less than 5-10 km [3 to 6 miles] in size," Osinski said. "[A crater of this size] is pretty rare."
The last meteor crater confirmed in Canada was in 2010.
After the new investigation confirmed the pit was punched out by a meteor impact, Osinski, Rochette and their team named it Uhaachatik Crater following discussions with the Ekuanitshit Innu council, a council representing the indigenous people in the area. The researchers will present their work at the Annual Meeting of the Meteorological Society in Germany next month.
Speaking to Radio-Canada, Lapointe said that he was very happy to hear his discovery had been confirmed as a genuine meteor crater. "It's not every day that an ordinary citizen finds a 390-million-year-old crater," he said. “I encourage everyone to not ignore intuition or an observation, even if it isn’t part of your field of expertise.”
Osinski and the team will continue their work on the collected samples to learn more about the impact site. "Any crater discovered offers us insight into how craters form and the effects that they can have on Earth’s geology, biology, and climate," he told Live Science.
Extreme coastal flooding events are occurring far more frequently in our warming world than ever before, threatening countless communities that will only become more vulnerable as climate change intensifies.
A recent study found that once-in-a-century flooding events now strike on our planet about once a decade. The study, published June 10 in the journal Nature Climate Change, also found that human-driven climate change has quadrupled the frequency of coastal sea level extremes since 1900.
The findings were released alongside another study by a separate team, published in the journal Science Advances, that found human-caused sea level rise was clearly measurable at 97% of sites sampled around the world, and was responsible for around 58% of the observed daily extreme water level exceedances between 2000 and 2018. In other words, human activities are the primary drivers behind sea level extremes — which include storm surges, high tides and rising sea level anomalies.
As the ocean's potential to devastate coastal communities surges, Live Science spoke with Sönke Dangendorf, lead author of the Nature Climate Change study, to learn more about what's to come. Here's what he had to say.
Patrick Pester: How do you separate human-driven sea level rise from natural forces?
Sönke Dangendorf: The absolute basis for doing these kinds of investigations is to work with observations, but observations are unfortunately sparse. We have a few more than 100 tide gauges [distributed worldwide] that offer long, century-scale records of sea level change since the early 20th century. We see that sea levels are changing at those locations, but we cannot tell a whole lot about what is happening elsewhere. So, what we can do is use the same climate models that we use to produce future projections of sea level change.
If you compare observations with the models, then the models need to be able to reproduce what the observations have shown. That was the first step we did, and indeed we proved in this study that the climate models are capable of reproducing observed climate. The nice thing with climate models then is that if you are able to reproduce what has been observed, you can start doing experiments. For instance, you can keep greenhouse gases constant in the modeling and then assess the influence of natural climate variability on the changes that we have observed. That's what we did in the study.
We found that we have seen already a 12-fold increase on average globally in what used to be a once-in-100-year event in 1900. And when we do these forcing experiments, we have also seen that anthropogenic forcing [human-driven change], in particular since the 1970s, has become the dominant force.
PP: What does this mean for coastal communities around the world?
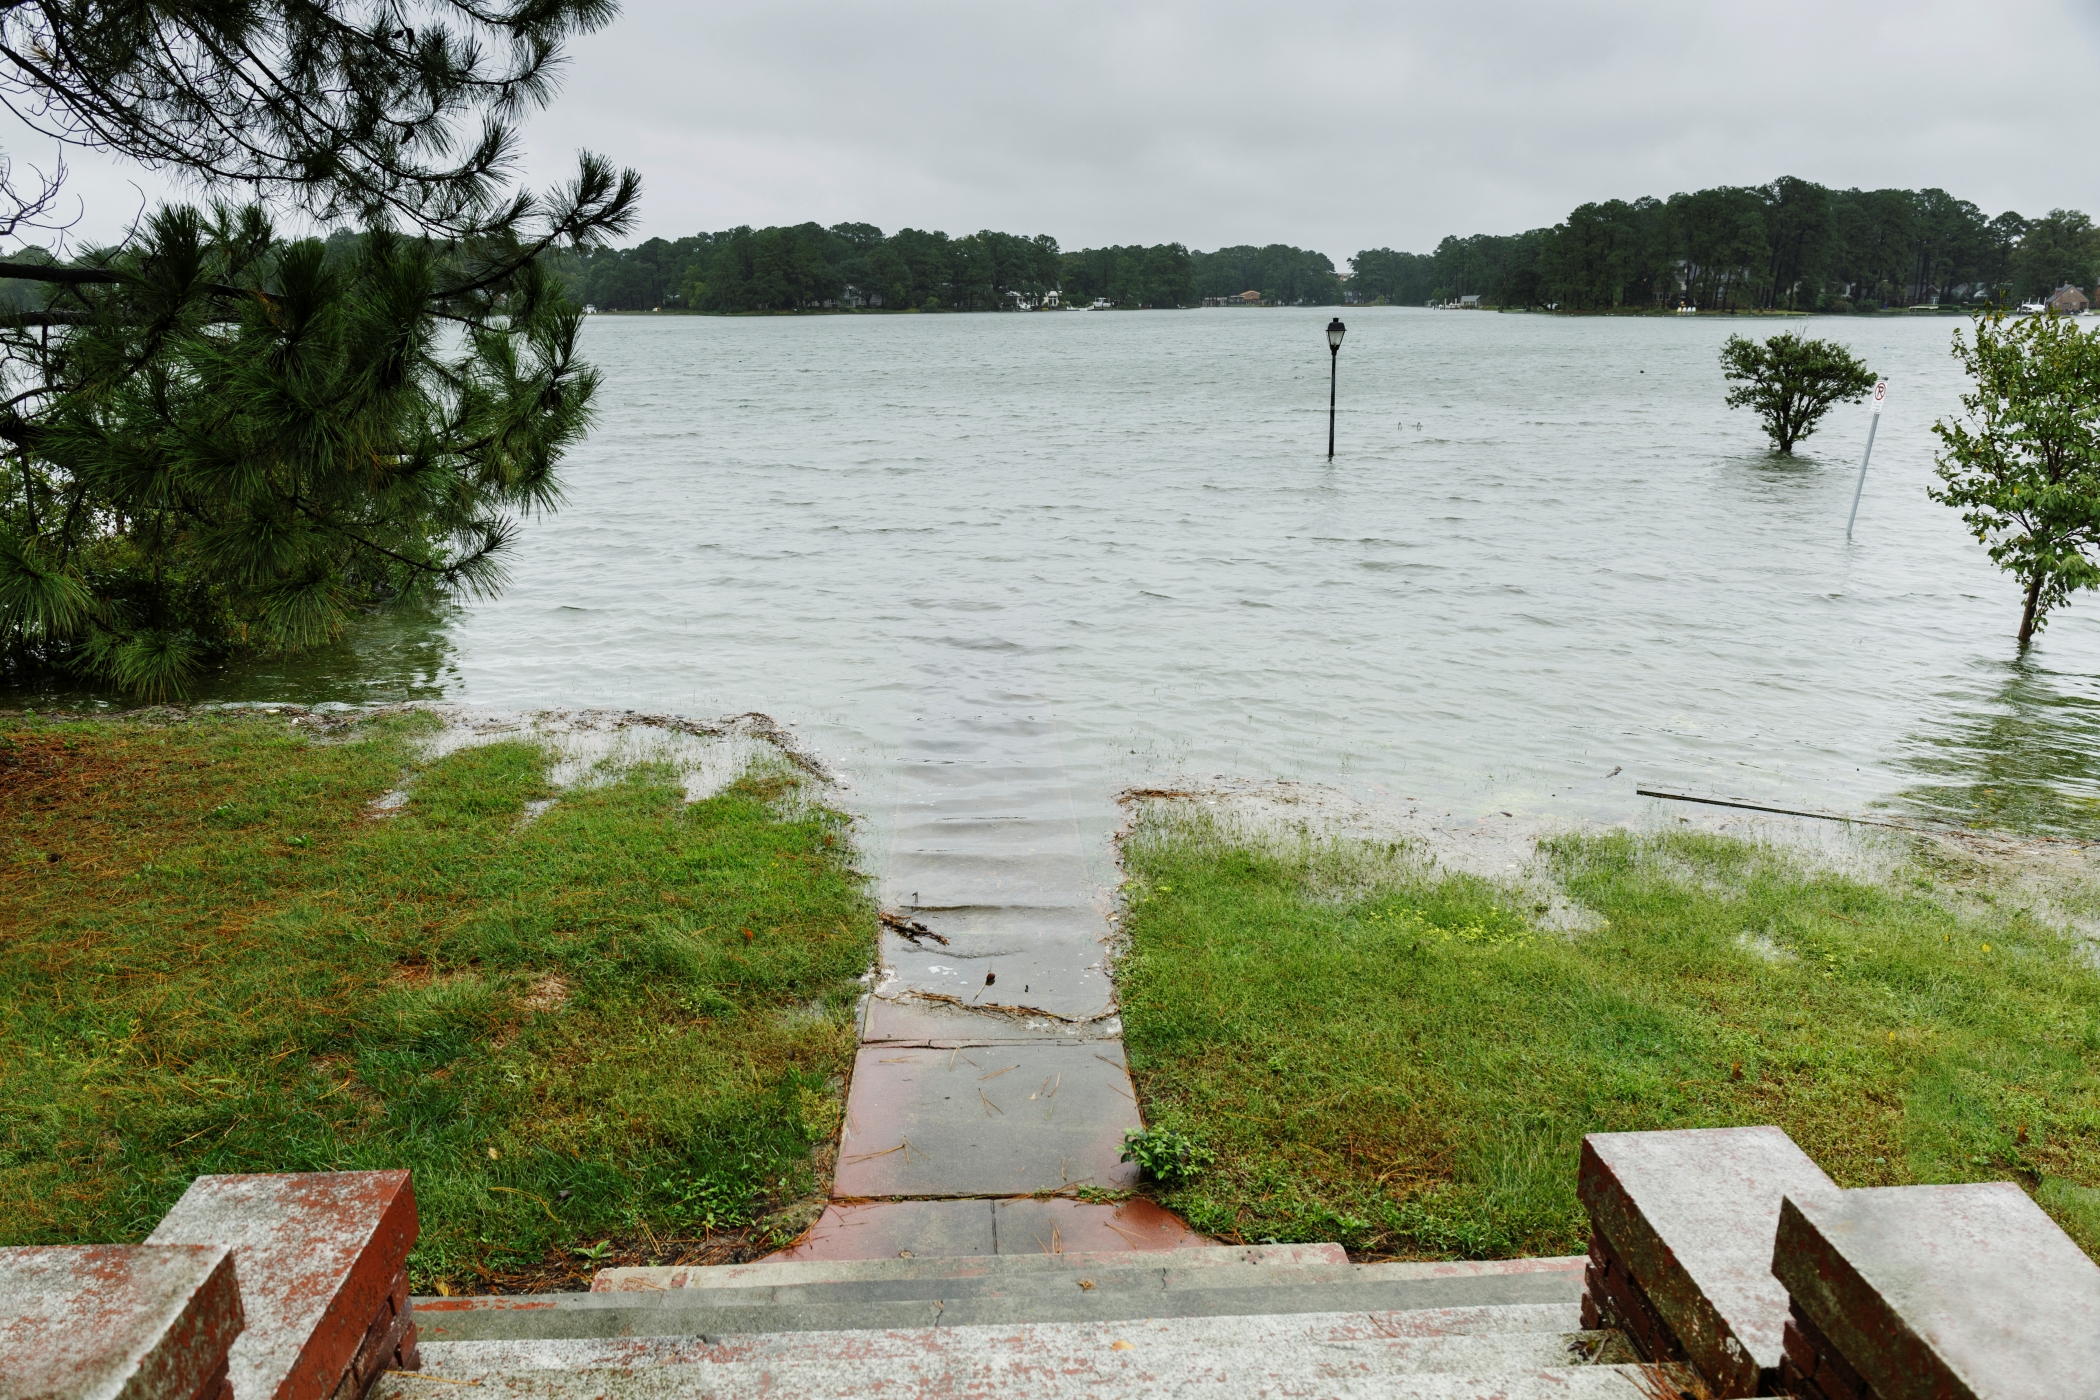
SD: A couple of centimeters of sea level rise doesn't sound like a whole lot in theory, but if you live along the coast, it hits you much harder than you might think. Just an example: I used to live along the U.S. East Coast in Norfolk, Virginia. The community was built along the water, and they used to be fine in the 1950s and 1960s; they wouldn't see flooding at all, or maybe just once every five or six years. But due to sea level rise, what happens now is that high tide leads to flooding. You see flooded streets, and that affects your commute, so people increasingly cannot make it to work.
It affects your daily life suddenly. And then it makes it very hard for you and your coastal community because you have increasing insurance costs — the accumulated costs of these events can easily be as much as a major hurricane making landfall. So, this is a daily experience that many people already have, and it's a direct impact of sea level rise.
With respect to what we assessed in these more extreme events, people may absorb a once-in-a-100-year event once in their lifetime. They may experience something like a Storm Sandy, and they may be able to recover from that, but if you think about recovering from that basically every eight years — the frequency of these events nowadays compared to 1900 — that's of course way more difficult and not feasible for many people.
PP: What can we do?
SD: We can adapt. The silver lining here is that we have shown humans are the dominant forcing factor behind these changes. That's the silver lining because it means if we react, we can do something about it.
The reaction to changes in climate is often delayed, so we have sea level rise that we are already committed to. For instance, if you look into projections, they all agree with respect to what happens until around 2060, independently of how much greenhouse gases are emitted. There's no way around that. We could stop emitting greenhouse gases today, and we would still experience it. So, we need to adapt to that sea level rise, but if we mitigate climate change, if we stop emitting greenhouse gases, then we can avoid dangerous sea level rise, and that's very important.
Flooding is becoming more severe and disruptive as our planet warms. (Image credit: Roberto Westbrook via Getty Images)
PP: What will the world look like in 2060 with the committed sea level rise?
SD: According to the last IPCC [Intergovernmental Panel on Climate Change] report, what used to be a once-in-a-100-year event in the present day will occur annually at 19% to 31% of tide gauge locations by 2050. So, at about a quarter of the locations, you will experience these once-in-a-100-year events annually, and that is something that is just mind-blowing.
The changes are happening much quicker in low-latitude locations. The reason is that in the tropics you typically have a less variable climate. You don't have these massive swings all the time. For instance, in the North Sea, we have a storm season, and we have huge tide ranges. We are already adapted to pretty massive changes of multiple meters, so a couple of centimeters of sea level rise do not play out that hard, but in the tropics, where it's more calm, it makes a huge difference.
As an analogy, think about two hurdle runners. You have one hurdle runner that's compared to the tropics; he jumps very consistently but always below the hurdle, so he never makes it over. Then you have another hurdle runner that's the North Sea type of guy. His jumps are very variable. Sometimes he's very high and makes it over that hurdle, but very often he also jumps very low. Now think about lowering that hurdle, which is comparable to increasing sea levels. Suddenly, that hurdle runner who is very consistent makes it over all of the time, while the guy from the North Sea may jump over the hurdle a couple more times, but he also still has the very extreme lows. So, the constant jumper is way more sensitive to these changes.
Editor's note: This interview has been edited and condensed for clarity.
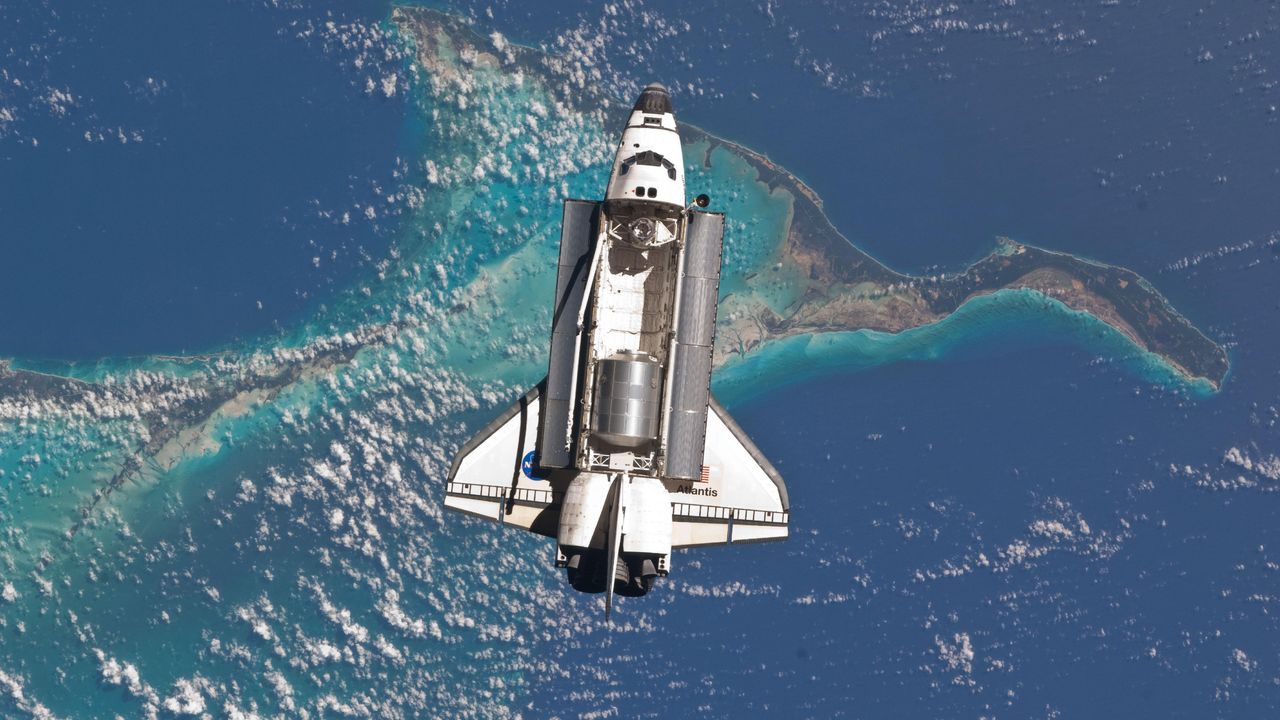
What's in the photo? Thespace shuttle Atlantis, preparing to dock with the International Space Station (ISS)
Who took the photo? An unnamed astronaut on board the ISS
When was it taken? July 10, 2011
This stunning astronaut photo shows the last time one of NASA's iconic space shuttles photobombed astronauts' view of Earth as the spacecraft docked with the ISS.
NASA's Space Shuttle Program included five plane-like spacecraft — Columbia, Challenger, Discovery, Atlantis and Endeavour — which collectively completed 135 missions between 1981 and 2011, racking up more than 32,000 hours in space. During that time, they helped to construct the ISS and, later, ferry astronauts to and from the station. The space shuttles also helped to deploy and maintain several other important spacecraft, including the Hubble Space Telescope.
This photo shows Atlantis approaching the ISS for the last time as it passed over the distinctive turquoise waters of the Bahamas. The space shuttle's bay doors are open, exposing its cargo area. This was standard procedure for all space shuttles once they reached low Earth orbit because it prevented the spacecraft's radiators from overheating.
The open doors also enabled the shuttle's docking mechanism, located within its cargo bay, to attach to the ISS, thus creating a pressurized seal so that astronauts could move between the two spacecraft.
Atlantis' final flight began on July 8, 2011, when it launched from the Kennedy Space Center in Florida vertically strapped to a massive fuel tank and a pair of rocket boosters. It returned to Earth on July 21, gliding down to land onto a runway at the launch site. (The spacecraft is now on display at the Kennedy Space Center Visitor Complex.)
In addition to helping construct the ISS, NASA's space shuttles visited Russia's Mir space station, serviced Hubble, and deployed both the Magellan probe to Venus and the Galileo probe to Jupiter. In total, the space shuttle orbited Earth 4,848 times, traveling nearly 126 million miles (203 million kilometers) — more than 525 times the distance between Earth and the moon.
Astronaut photos of the space shuttles were popular because they offered "punctuated snapshots of distinct places on Earth" that were "framed by a human eye," NASA representatives wrote in 2011. "These images speak to people."
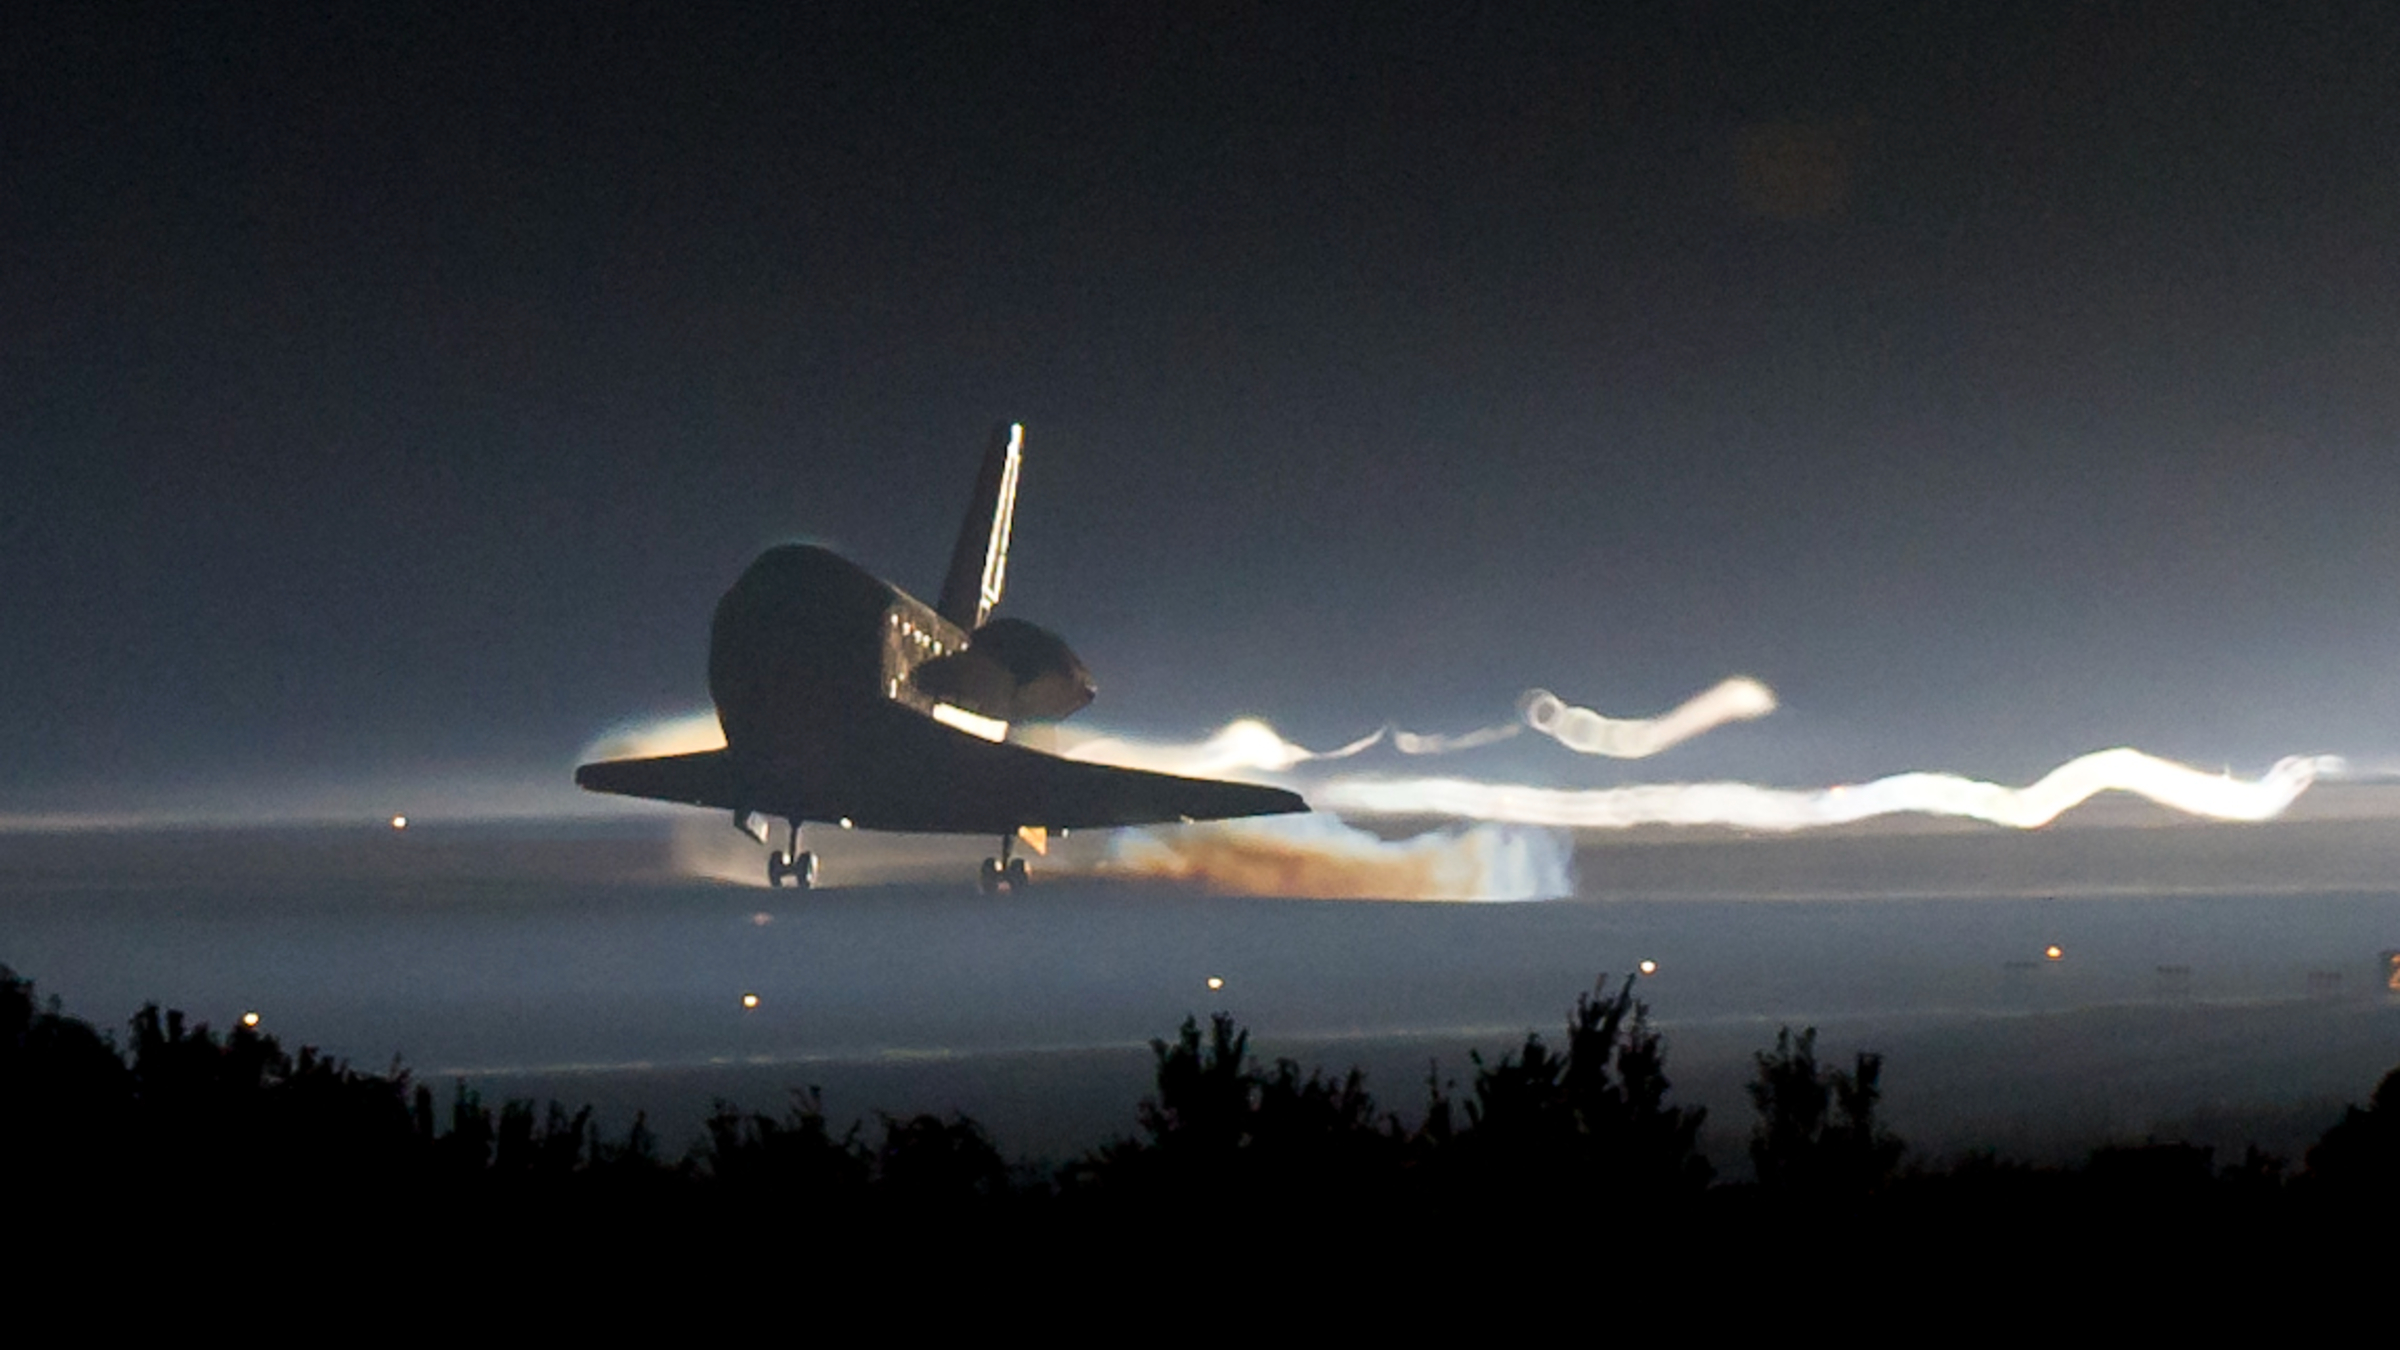
Atlantis touched down at the Kennedy Space Center on July 21, 2011, brining the 30-year Space Shuttle program to an end. (Image credit: NASA/Bill Ingalls)
While the Space Shuttle Program achieved a lot during its 30-year history, it famously suffered two tragedies: the 1986 Challenger and 2003 Columbia disasters, which killed all crewmembers on board.
NASA eventually canceled the program in 2011, citing the high cost of maintaining the aging spacecraft and a reduced need for the vehicles after the completion of the ISS the same year. To this day, the space shuttles remain the only winged spacecraft to carry humans into space.
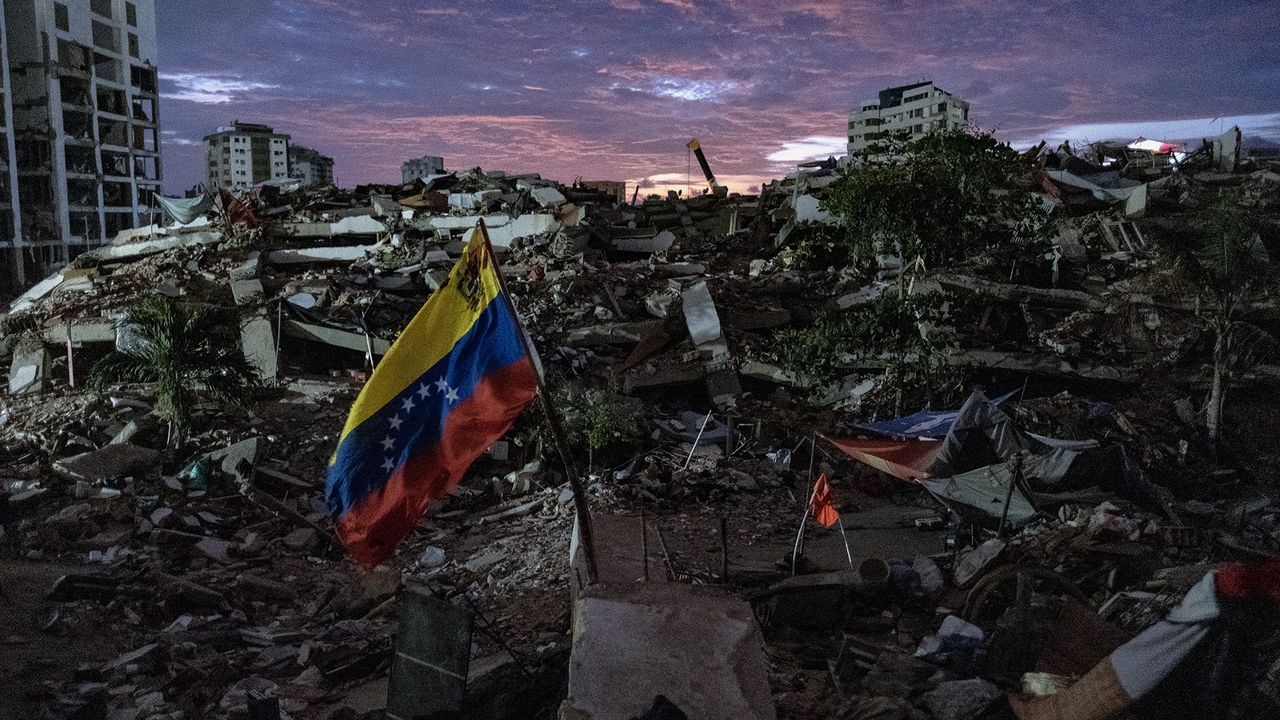
The two major earthquakes that struck Venezuela just 39 seconds apart on June 24 had slightly different epicenters in north-central Venezuela. The first (M7.2) struck near San Felipe, and the second (M7.5) near Yumare, leaving thousands dead and thousands more injured, according to government officials. But beyond the devastation, the sequence opened a rare scientific opportunity: Researchers think the unusual "earthquake doublet" could offer new insight into how large fault systems interact and how some of the most destructive earthquakes grow.
Large earthquakes are typically followed by smaller aftershocks. But particularly intense events can also alter stress on nearby faults or along the same fault, triggering another major earthquake.
The Venezuelan sequence also reinforces an emerging consensus among seismologists: that treating faults as isolated structures may underestimate the destructive power of quakes in regions where multiple tectonic faults meet, as they do both in Venezuela and around California's San Andreas Fault system. That's a problem, because many of the seismic hazard models in California do not account for those multi-fault interactions.
A natural laboratory for understanding major earthquakes
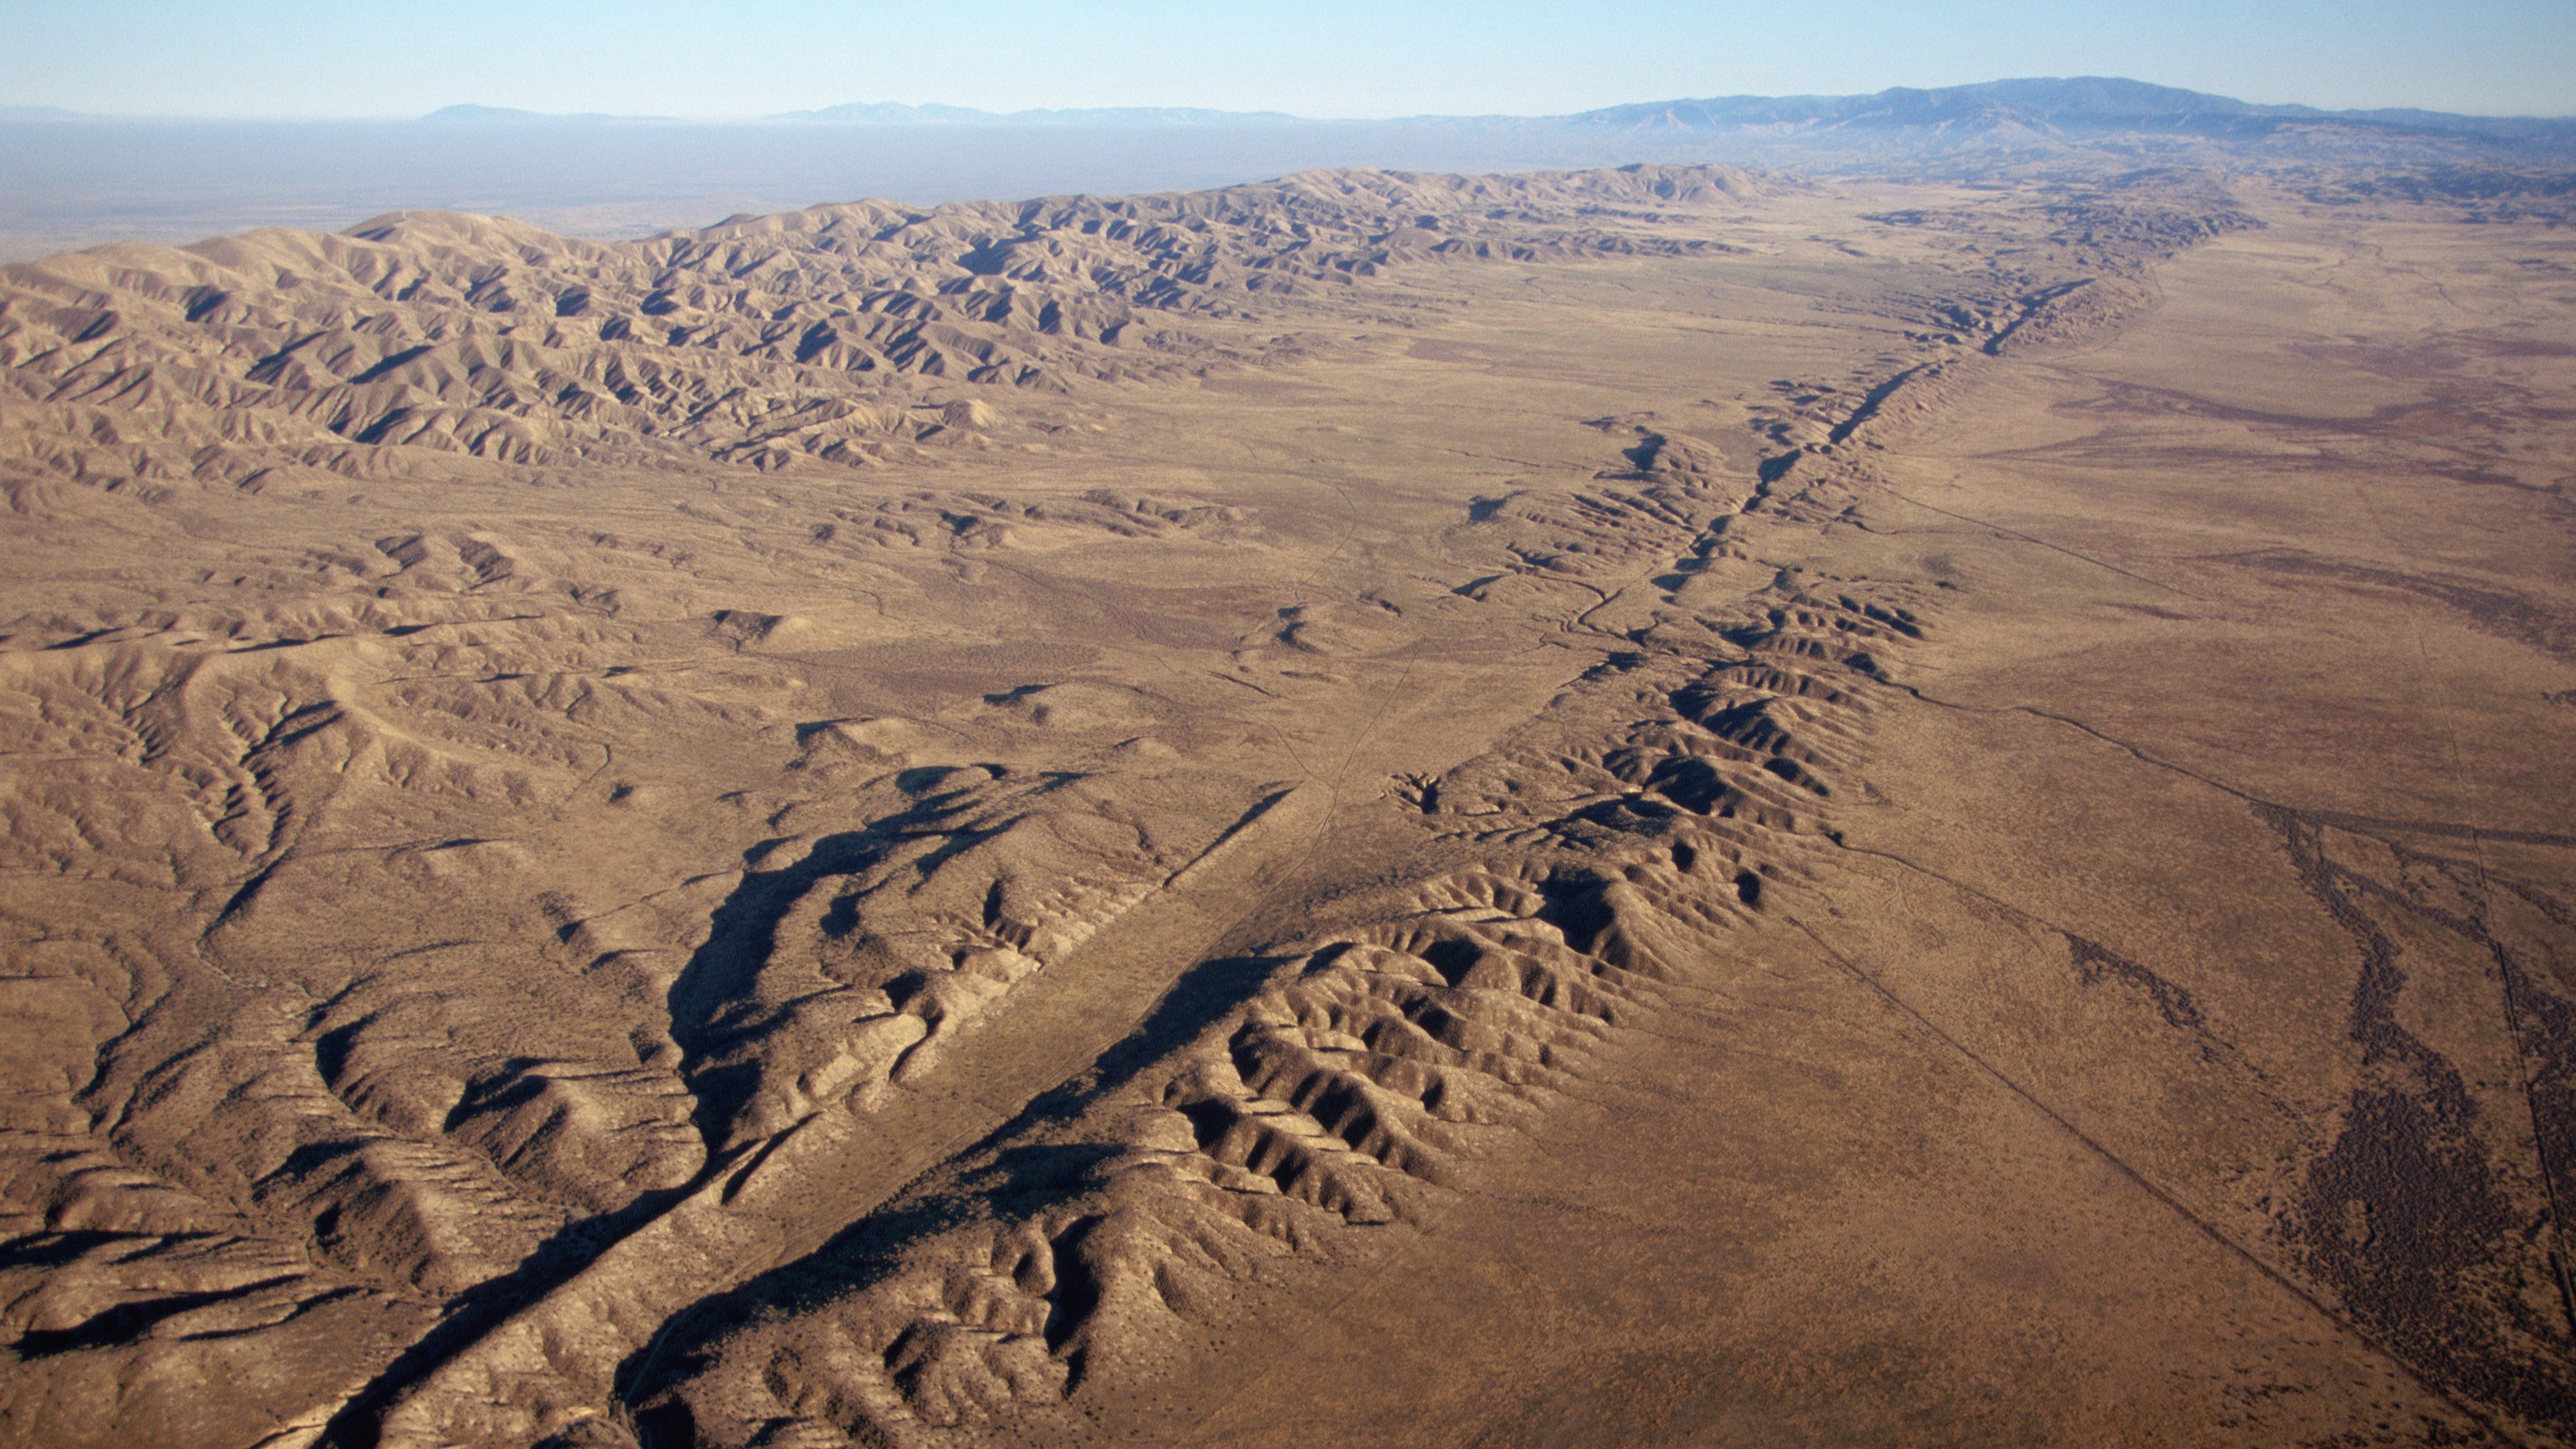
The fault system involved in the Venezuelan earthquake — which includes the Boconó, Morón, San Sebastián and El Pilar faults — shares several key characteristics with the San Andreas Fault. Both are right-lateral strike-slip fault systems — in which the crustal blocks slide horizontally past each other — located along the boundary between two tectonic plates: the South American and Caribbean plates in Venezuela, and the Pacific and North American plates in California.
Despite these similarities, researchers caution that the two systems differ in important ways.
"The main difference is that the Venezuelan plate boundary has a much more complex fault architecture," Julián García Mayordomo, a senior scientist in the Geological Hazards and Climate Change Department at the Geological and Mining Institute of Spain, told Live Science.
The difference stems largely from the Maracaibo block, whose interaction with surrounding faults creates a much more intricate plate boundary than California's.
"The other difference is the speed at which the plates move," García Mayordomo pointed out.
In Venezuela, the tectonic plates move past each other at about 0.8 inches (20 millimeters) per year, compared with roughly 1.2 inches (30 millimeters) along the San Andreas Fault. Faster plate motion allows tectonic stress to accumulate more quickly, which influences how often large earthquakes occur over long timescales, but not when the next one will strike.
An aerial view of the San Andreas Fault in California. (Image credit: Kevin Schafer/Getty Images)
Along the San Andreas Fault, magnitude 7 or larger earthquakes occur, on average every 100 to 200 years, although the frequency of recurrence varies along the fault. The last major rupture in Southern California was the magnitude 7.9 Fort Tejon earthquake in 1857. In Venezuela, estimated slip rates suggest recurrence intervals of one to two centuries. The region experienced two devastating earthquakes in 1812, part of a multiple-rupture sequence that included events of magnitude 7.5, 7.2 and 6.5, and a 2018 study concluded that the Boconó Fault had already accumulated enough strain to generate another major earthquake.
However, these are statistical averages. The recurrence of large earthquakes is highly irregular and depends on a multitude of factors, many of which we still don't fully understand. So a major event could occur in 100 years — or even tomorrow.
Looking beyond individual faults
This uncertainty is precisely one of the reasons the Venezuelan seismic doublet is generating so much interest among seismologists.
"It is the kind of natural event that can sharpen and test the rupture-interaction concepts that paleoseismic models like ours can only infer indirectly," said Liliane Burkhard, a geologist and geophysicist at the University of Bern and first author of a recent study suggesting that the junction between the San Andreas and San Jacinto faults in Southern California is experiencing some of its highest tectonic stress levels in the past 1,000 years, told Live Science.
"Our Cajon Pass work relied on centuries of paleoseismic reconstructions to infer how stress evolves and whether ruptures can cross between fault systems," Burkhard told Live Science. But that doesn't give geologists real-time data, captured by seismic instruments, showing how different faults interact during quakes, she added.
The Venezuela doublet offers exactly that opportunity. The main lesson for California, Burkhard said, is that interactions between neighboring faults can play an important role in the evolution of large earthquakes.
"Whether it is Cajon Pass where the San Andreas and San Jacinto systems meet or the Boconó-San Sebastián in Venezuela, these are precisely the locations where single-fault hazard models break down because the real behavior depends on how stress is shared and transferred between adjacent structures," she said.
Many times the winner isn't the boxer who lands the hardest punch but the one who keeps punching for longer.
Julián García Mayordomo, senior scientist at the Geological and Mining Institute
Still, the two systems are quite different. The Venezuelan sequence represents a different type of cascading rupture than the one described in Burkhard's research. At Cajon Pass, the "earthquake gate" concept explores whether a single rupture can jump from one fault system to another during the same earthquake, over tens of seconds of rupture propagation along a continuous fault trace. The Venezuelan doublet, by contrast, "looks like two distinct ruptures on what may be two separate fault structures, triggered in close succession," Burkhard said.
For Burkhard, the Venezuelan earthquake reinforces the need for seismic hazard models to move beyond treating faults as isolated structures and instead represent them as interconnected networks. The challenge is particularly relevant in California, where roughly 300 active faults may interact in ways that traditional hazard models do not capture.
New Zealand has already incorporated this lesson. After the 2016 Kaikōura earthquake ruptured at least 12 faults in a single event, New Zealand revised its National Seismic Hazard Model to include complex multifault ruptures.
García Mayordomo argues that both Venezuela and the United States should incorporate these complex rupture scenarios into seismic hazard assessments and building codes. Earthquakes involving multiple faults can produce longer-lasting shaking that increases structural fatigue and, ultimately, the risk of collapse.
"It's like a boxing match," García Mayordomo said. "Many times the winner isn't the boxer who lands the hardest punch but the one who keeps punching for longer."
Even so, researchers cautioned against drawing sweeping conclusions from a single earthquake.
"Each earthquake gives us one possible scenario," Judith Hubbard, an earthquake scientist and structural geologist at Cornell University told Live Science. "The range of earthquake behaviors is wide."
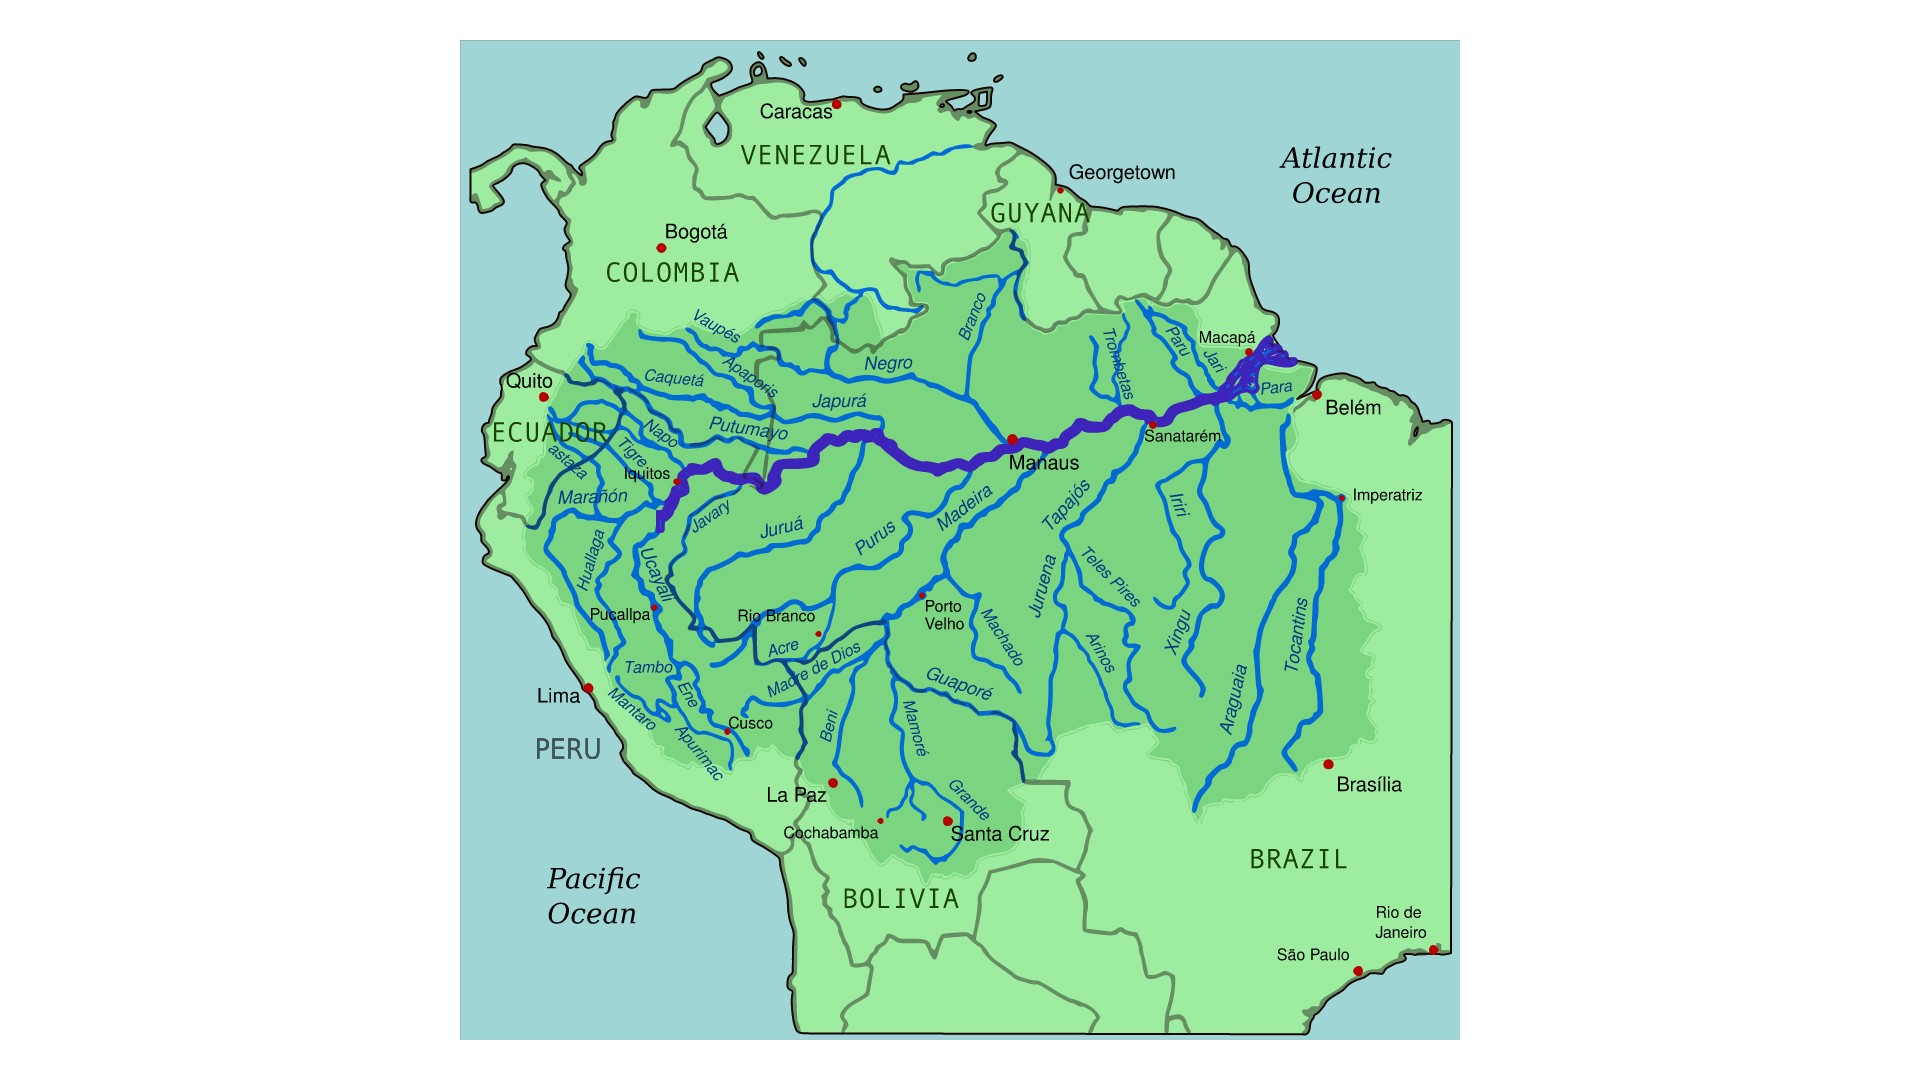
Tropical forests draw down and store large quantities of CO₂ from the atmosphere. The Amazon rainforest in South America, for example, stores approximately 123 billion tonnes of carbon — more than is stored in any other terrestrial ecosystem in the world. But these forests are facing a critical challenge.
Research from 2023, which was carried out by me and more than 100 colleagues, found that tropical forests in South America are vulnerable to climate extremes. We determined that during an El Niño event, the warm phase of a natural fluctuation in the Earth's climate system, South American tropical forests may fail to act as a carbon sink.
This finding becomes even more alarming when we consider the increasing frequency and intensity of El Niño events. There have been twice as many "very strong" El Niños in the last 60 years as there were in the 60 years before that. And the US National Oceanic and Atmospheric Administration has recently confirmed that such an El Niño is currently underway.
Tropical forests absorb CO₂ through the process of photosynthesis and convert it into biomass. However, the balance between photosynthesis and respiration is delicate and depends on two factors: temperature and water availability.
In hotter and drier conditions, plants close the pores of their leaves to avoid water loss. But closing them effectively cuts off a plant's fuel supply because it is through these pores they absorb CO₂. This starves plants of the carbon needed for photosynthesis and to grow.
During El Niño years, which are characterized by high temperature anomalies, prolonged climate stress leads to reduced forest growth and increased tree mortality. The effects of this are felt for decades as carbon is released back into the atmosphere when the dead trees decompose.
Our findings revealed that during the 2015-2016 El Niño, when temperatures on land were at least a degree higher on average than usual conditions, some of South America's tropical forests effectively stopped absorbing carbon. This raises concerns about the possible impact of the current El Niño on the Amazon and global climate.
A map of the Amazon River drainage basin in the middle of the Amazon rainforest. (Image credit: By Kmusser from Wikimedia Commons with elements from this file, CC-BY-SA-3.0)
In our research, we measured over half a million trees across six South American countries over a period of more than 30 years, using tape measures to track their growth. These trees belonged to over 4,000 different species. We used this data to calculate precise estimates of the amount of carbon stored as a forest's aboveground biomass.
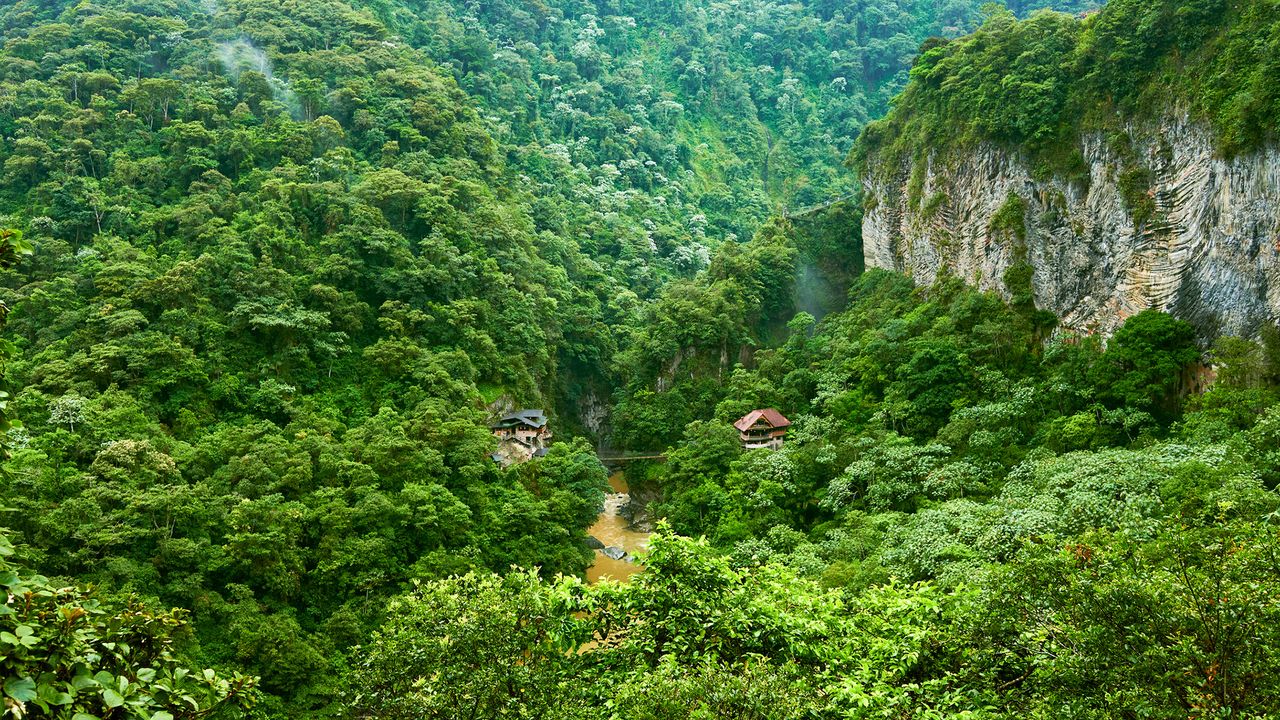
We found that the vulnerability of these forests to El Niño conditions was closely linked to their baseline climate. While we tend to assume that rainforests are all hot, wet and biodiverse ecosystems, seasonal drought is a reality for many tropical forests. Conditions in regions at the edge of the Amazon rainforest, for example, tend to be particularly hot and dry.
Our findings revealed that drier forests at the edge of the Amazon, where trees regularly endure periods of limited water availability, were especially susceptible to extreme El Niño conditions. On average, a 0.5°C increase in temperature caused these forests to lose 0.5% of their aboveground carbon.
Larger trees suffered the most. While tree mortality rates increased from 1.8% to 3% per year during the El Niño in South American tropical forests as a whole, mortality rates effectively doubled for medium (classified as over 20cm in diameter) and large trees.
The fact that larger trees with less dense wood died at much higher rates compared to small trees and those with high wood density points strongly to hydraulic failure, when intense atmospheric moisture demand snaps the tension in the tree's internal water column rather than slow carbon starvation.
These results suggest that adaption to seasonal drought may not be sufficient to protect tropical forests from extreme events. Climate extremes are possibly already pushing forests at the edges of the Amazon beyond their capacity to adapt, causing catastrophic carbon losses.
A looming threat
Scientists have warned that 2026 may again be the warmest year on record. Heightening the alarm further is the severity of the current El Niño. Never before has an an El Niño begun when oceans are already so warm and air temperatures so high.
On top of this is the fact that, over the past three decades, the edges of the Amazon have experienced some of the highest temperatures and most rapid warming the tropics have ever seen. The structural integrity of a forest is compromised when a major climate anomaly occurs before it has recovered from recent, multi-year stress.
These compounding factors mean that we risk witnessing tree and carbon losses on scales not yet seen.
Tropical forests are invaluable assets in the fight against climate change. But South American tropical forests, a once-reliable carbon sink, are vulnerable to intensifying heat and drought. There is a risk these essential ecological allies stop acting as a carbon sink as extreme climate conditions become the norm.
Preserving tropical forests is thus essential. Their ability to continue acting as carbon sinks hinges on efforts to protect them and a collective commitment to limit global temperature rise. The Amazon's future depends on this, and so does ours.
For decades, cities have been designed around "gray infrastructure." Roads move people. Bridges connect communities. Water systems protect public health. These systems are governed by engineering standards because society recognizes that safety cannot depend on good intentions alone.
Urban nature deserves the same recognition.
In June, a heat wave gripped Europe, breaking temperature records across the continent. In France, officials reported over 2,000 excess deaths. In the U.K., hospitals declared critical incidents and machinery and IT systems failed. In the U.S., a heat dome over the Midwest and East Coast disrupted Fourth of July celebrations, with at least 25 heat-related deaths over Independence Day weekend.
Cities are being tested by a warming climate. Yet one of our most effective forms of climate infrastructure is being lost — not because it does not work but because we still do not treat it as infrastructure.
My view is simple: Urban nature — including street trees, parks, wetlands and other urban green spaces — should be categorized and managed as essential infrastructure, with minimum standards for its protection, quality and long-term maintenance. Just as we regulate roads, bridges and drinking water, we need standards that ensure all urban residents benefit from healthy and thriving urban nature. Without such standards, cities will become hotter, less resilient and increasingly unequal as climate change accelerates.
A cafe in the city of Nice during the heat wave that saw temperatures in France reach a record-breaking average of 98.4 degrees Fahrenheit (36.9 degrees Celsius). (Image credit: Valery Hache/Getty Images)
Scientific research shows that urban trees and green spacescool cities during heat waves, reduce flooding by absorbing stormwater, improve air quality, store carbon, support biodiversity, and improve both physical and mental health. During extreme heat, neighborhoods with mature tree canopies can be several degrees cooler than nearby streets dominated by concrete and asphalt. Those few degrees can mean the difference between manageable discomfort and dangerous heat exposure, particularly for older adults, children and people with existing health conditions.
But while the science is strong, our governance is not.
Cities enthusiastically announce ambitious tree-planting campaigns, biodiversity strategies and new greening targets. These initiatives are valuable, but they often focus on what is easy to count rather than what truly matters. Planting a tree is not the same as growing a healthy urban forest. Creating a park does not guarantee biodiversity. A green roof delivers little value if it fails during drought.
The real measure of success is whether urban nature continues providing benefits decades after trees are planted and established.
This is where cities are still falling short.
That is not simply an environmental issue. It is a public health issue, a climate adaptation issue, and an issue of social equity.
Unlike buildings or transport systems, urban nature rarely operates under consistent minimum standards. Many cities have no requirements for minimum tree canopy cover, adequate rooting space, soil quality, biodiversity targets, long-term maintenance or even whether newly planted trees survive. As a result, access to nature depends heavily on where people live. Wealthier neighborhoods often enjoy mature tree canopy and high-quality parks, while disadvantaged communities experience hotter streets, fewer green spaces and greater exposure to climate risks.
That is not simply an environmental issue. It is a public health issue, a climate adaptation issue, and an issue of social equity.
The solution is not simply to plant more trees. It is to establish urban nature standards that recognize nature as essential infrastructure.
These standards would not prescribe the same solution for every city. Instead, they would establish minimum expectations based on scientific evidence. They could include targets for accessible green space, minimum tree canopy cover, sufficient soil volume for healthy tree growth, biodiversity outcomes, long-term maintenance funding and routine monitoring to ensure that urban nature continues delivering benefits to communities.
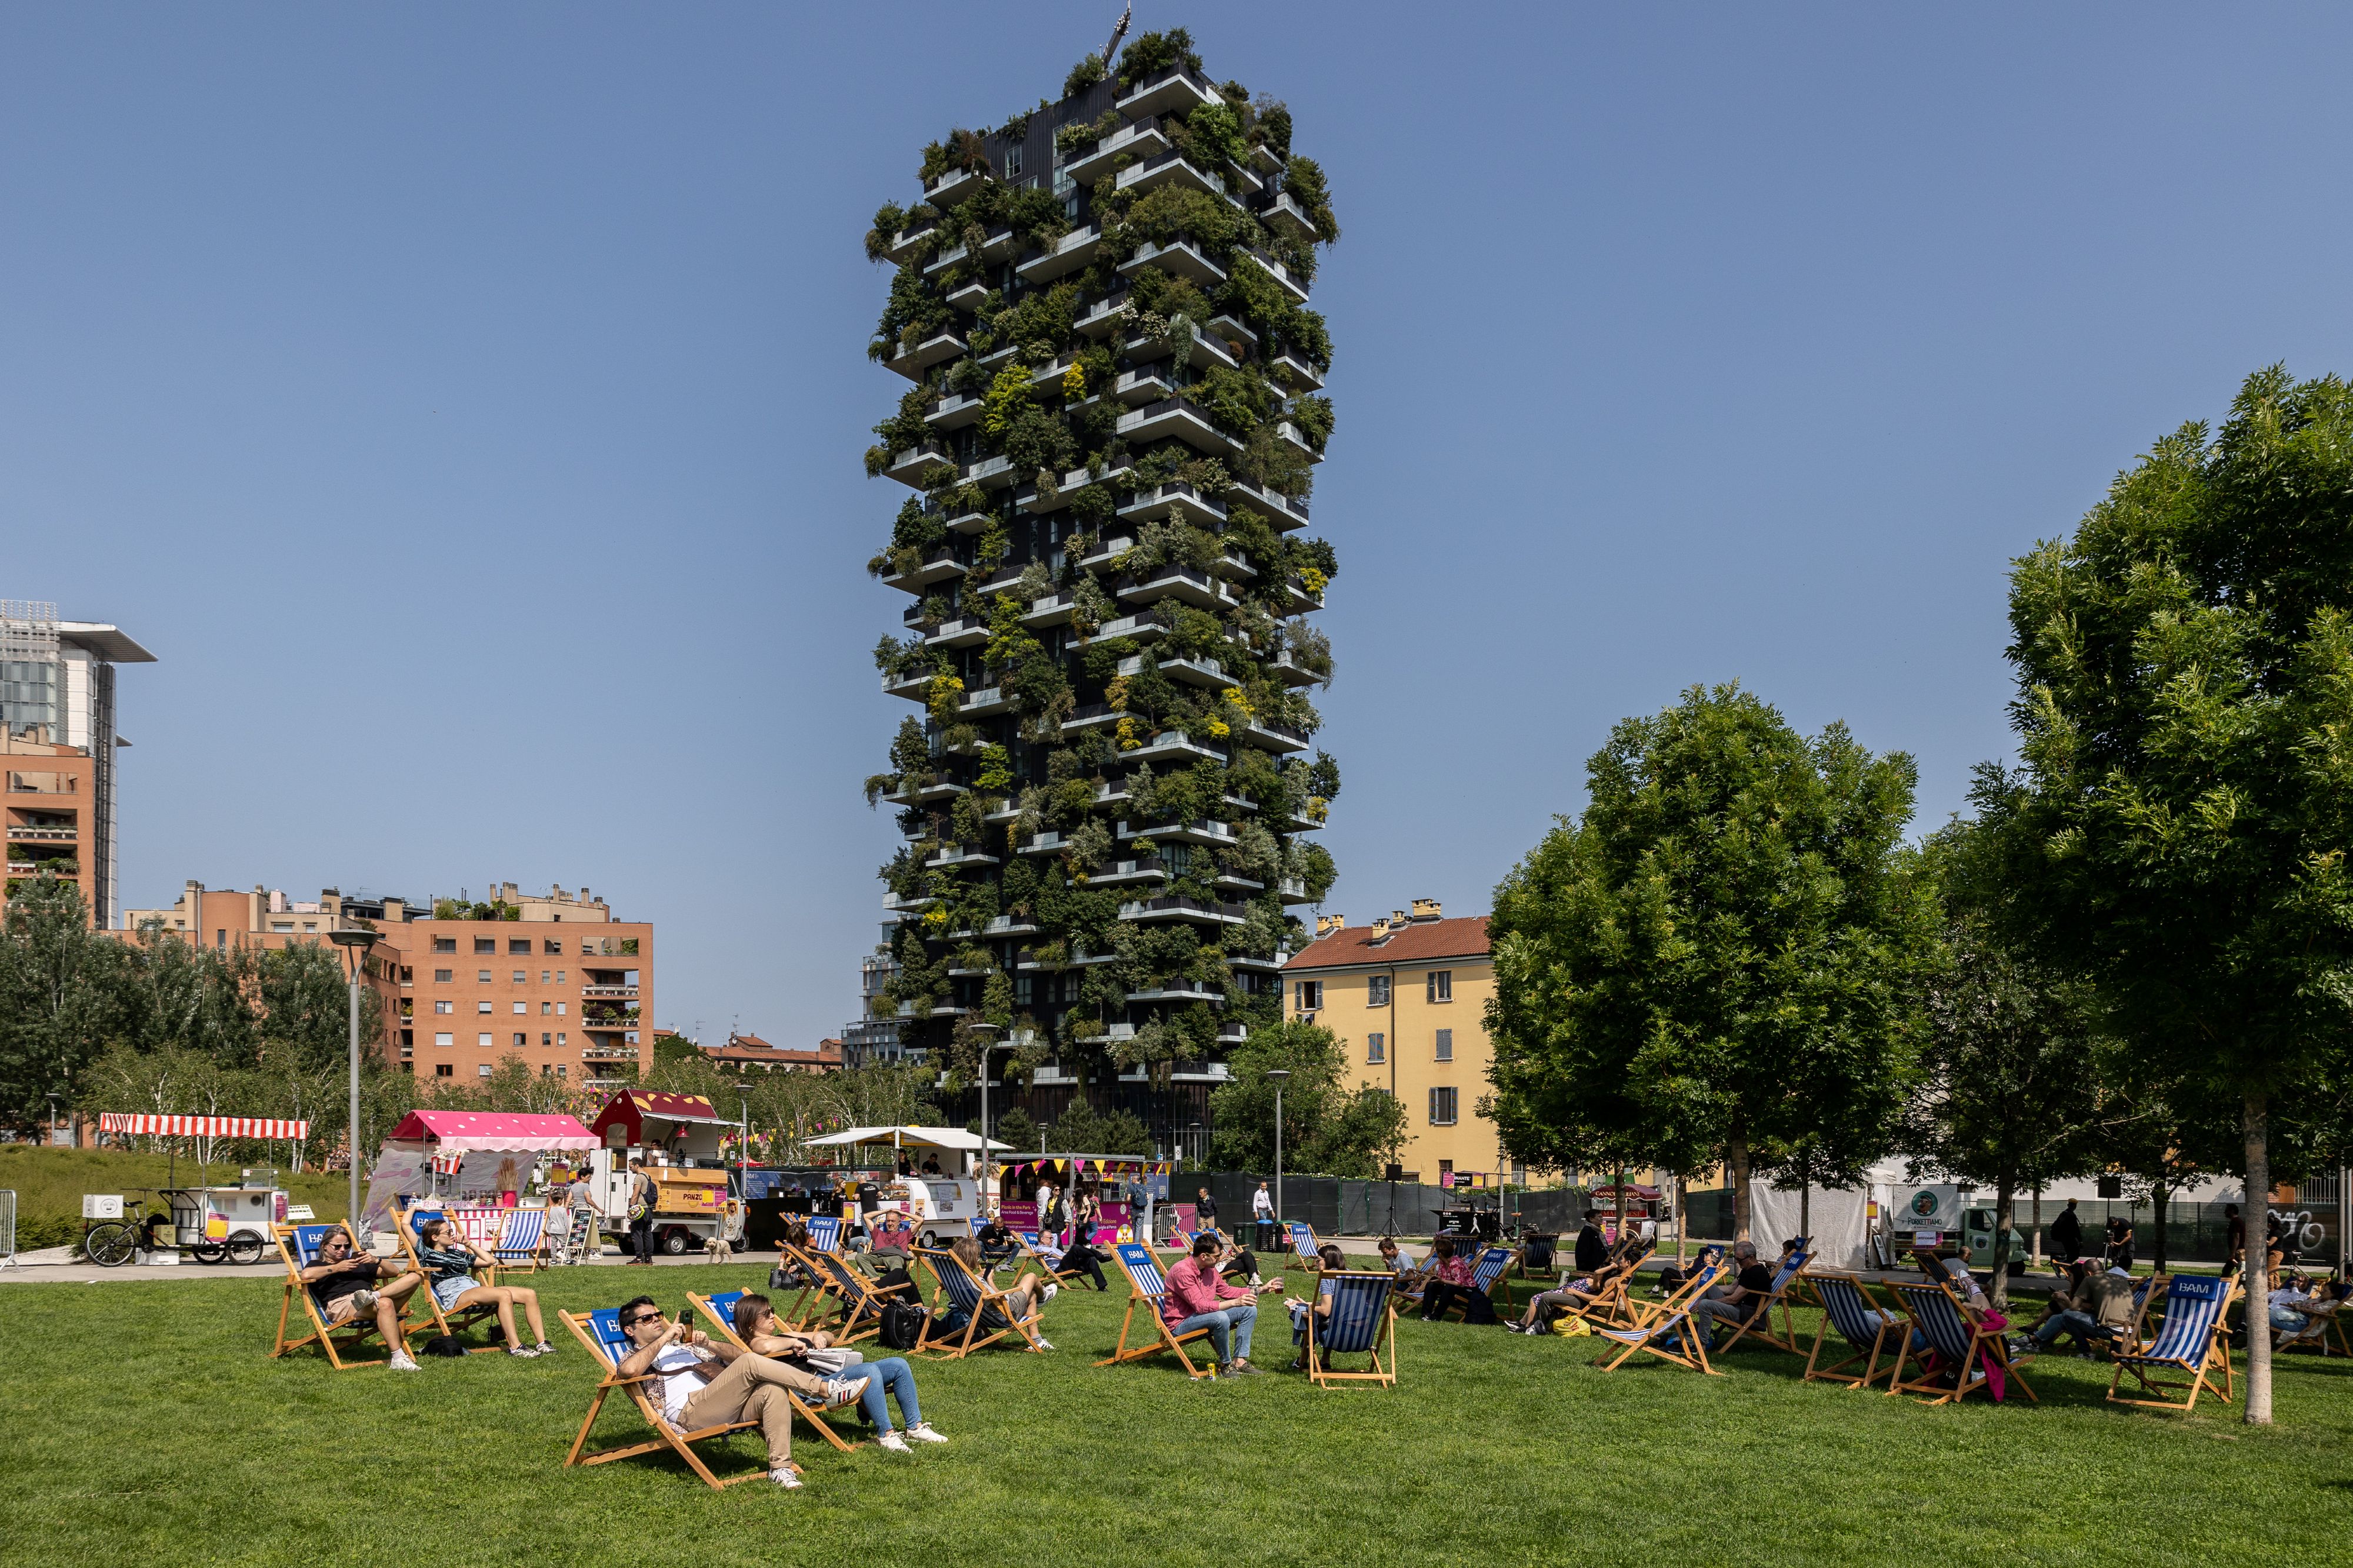
The Bosco Verticale in Milan house around 800 trees and 20,000 plants. City officials have been expanding the green infrastructure with multiple high impact projects to address climate change. (Image credit: Emanuele Cremaschi/Getty Images)
Importantly, these standards should focus on outcomes rather than simple planting targets. Counting how many trees are planted tells us little about whether cities are becoming more resilient. Measuring survival, canopy development, ecosystem health and equitable access provides a much better picture of whether investments in urban nature are actually returning dividends.
Some critics argue that cities cannot afford stronger standards for urban nature. Municipal budgets are already stretched by housing, transport and aging infrastructure. But this argument overlooks a fundamental reality: We already spend enormous sums responding to the consequences of extreme heat, flooding, poor air quality and declining public health. Healthy urban ecosystems help reduce these costs while delivering multiple benefits simultaneously.
As climate change accelerates, the distinction between gray and green infrastructure becomes increasingly blurred. Trees cool buildings and reduce energy demand. Wetlands decrease flood damage. Parks improve public health and strengthen communities. These are not optional amenities. They are functioning components of urban infrastructure that deserve the same level of planning, investment and accountability as any engineered system.
Building codes transformed the safety of our cities because they established minimum standards that every development had to meet. Climate resilience now demands a similar transformation for urban nature.
The next generation of resilient cities will not be defined simply by how many trees they plant but by the standards they adopt to protect, restore and sustain the living infrastructure urban life depends on.
The real question is not whether cities can afford to invest in urban nature; it is whether they can afford not to.
Opinion on Live Science gives you insight on the most important issues in science that affect you and the world around you today, written by experts and leading scientists in their field.
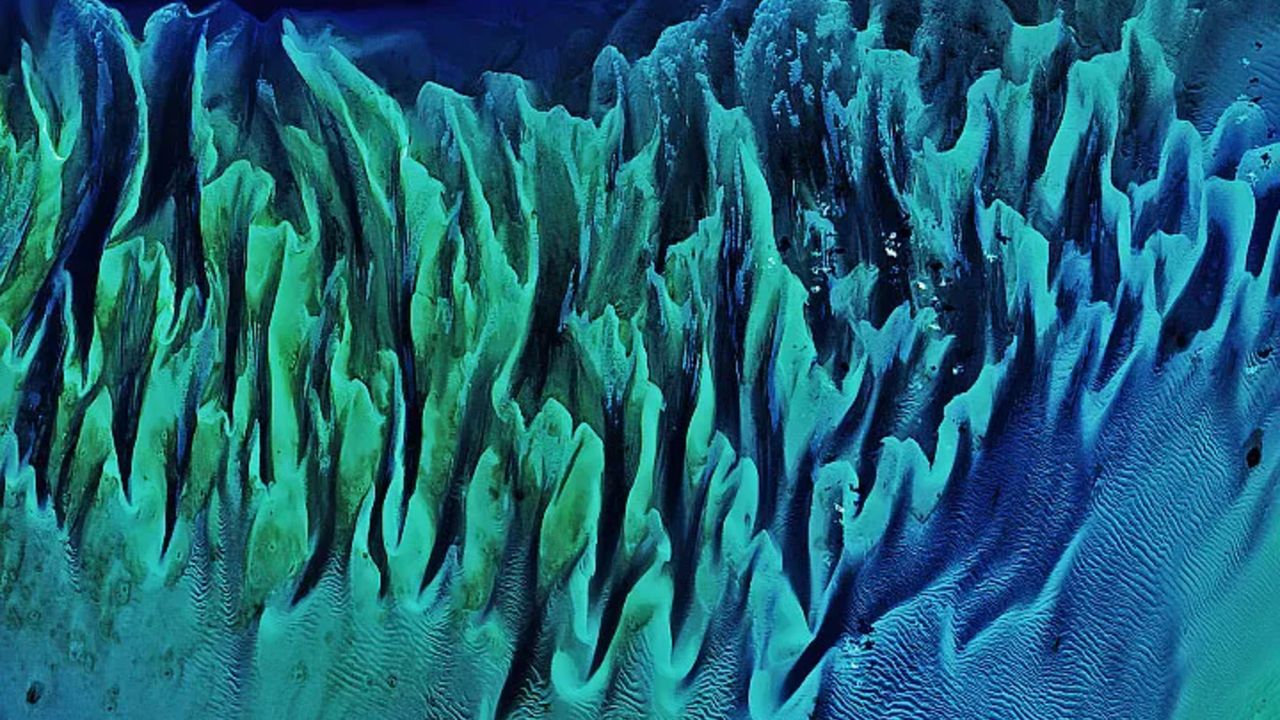
What's in the photo? Submerged sandbanks and seagrass beds in shallow water
Which satellite took the photo? Landsat 8
When was it taken? Feb. 15, 2020
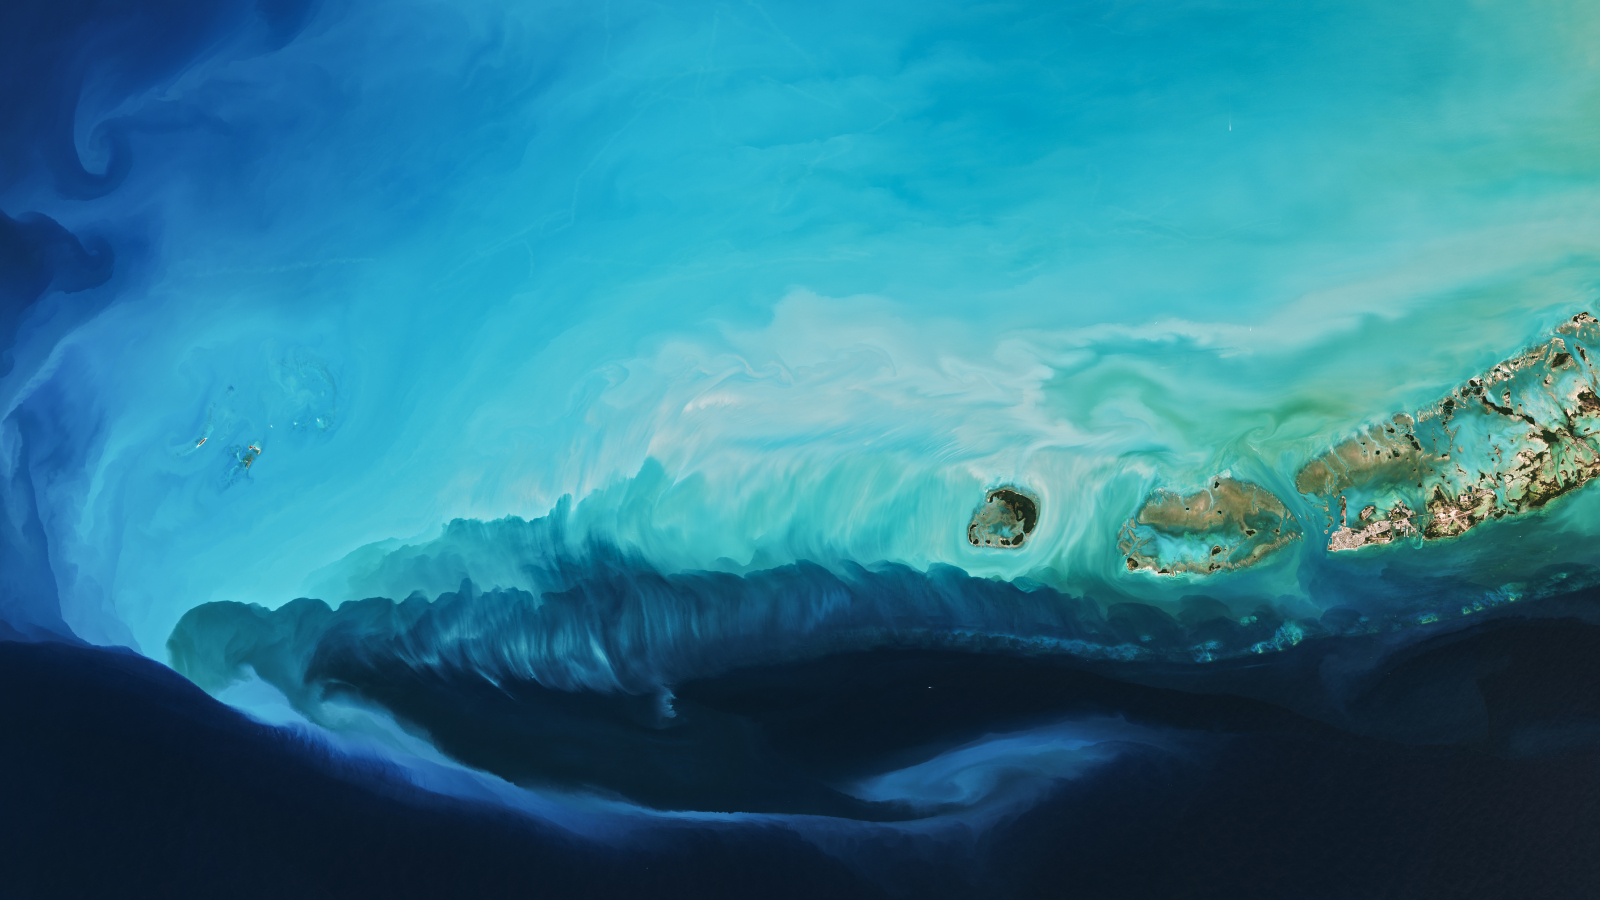
This ethereal satellite snap shows beautiful, "painting-like" folds within an ancient underwater structure in the Bahamas.
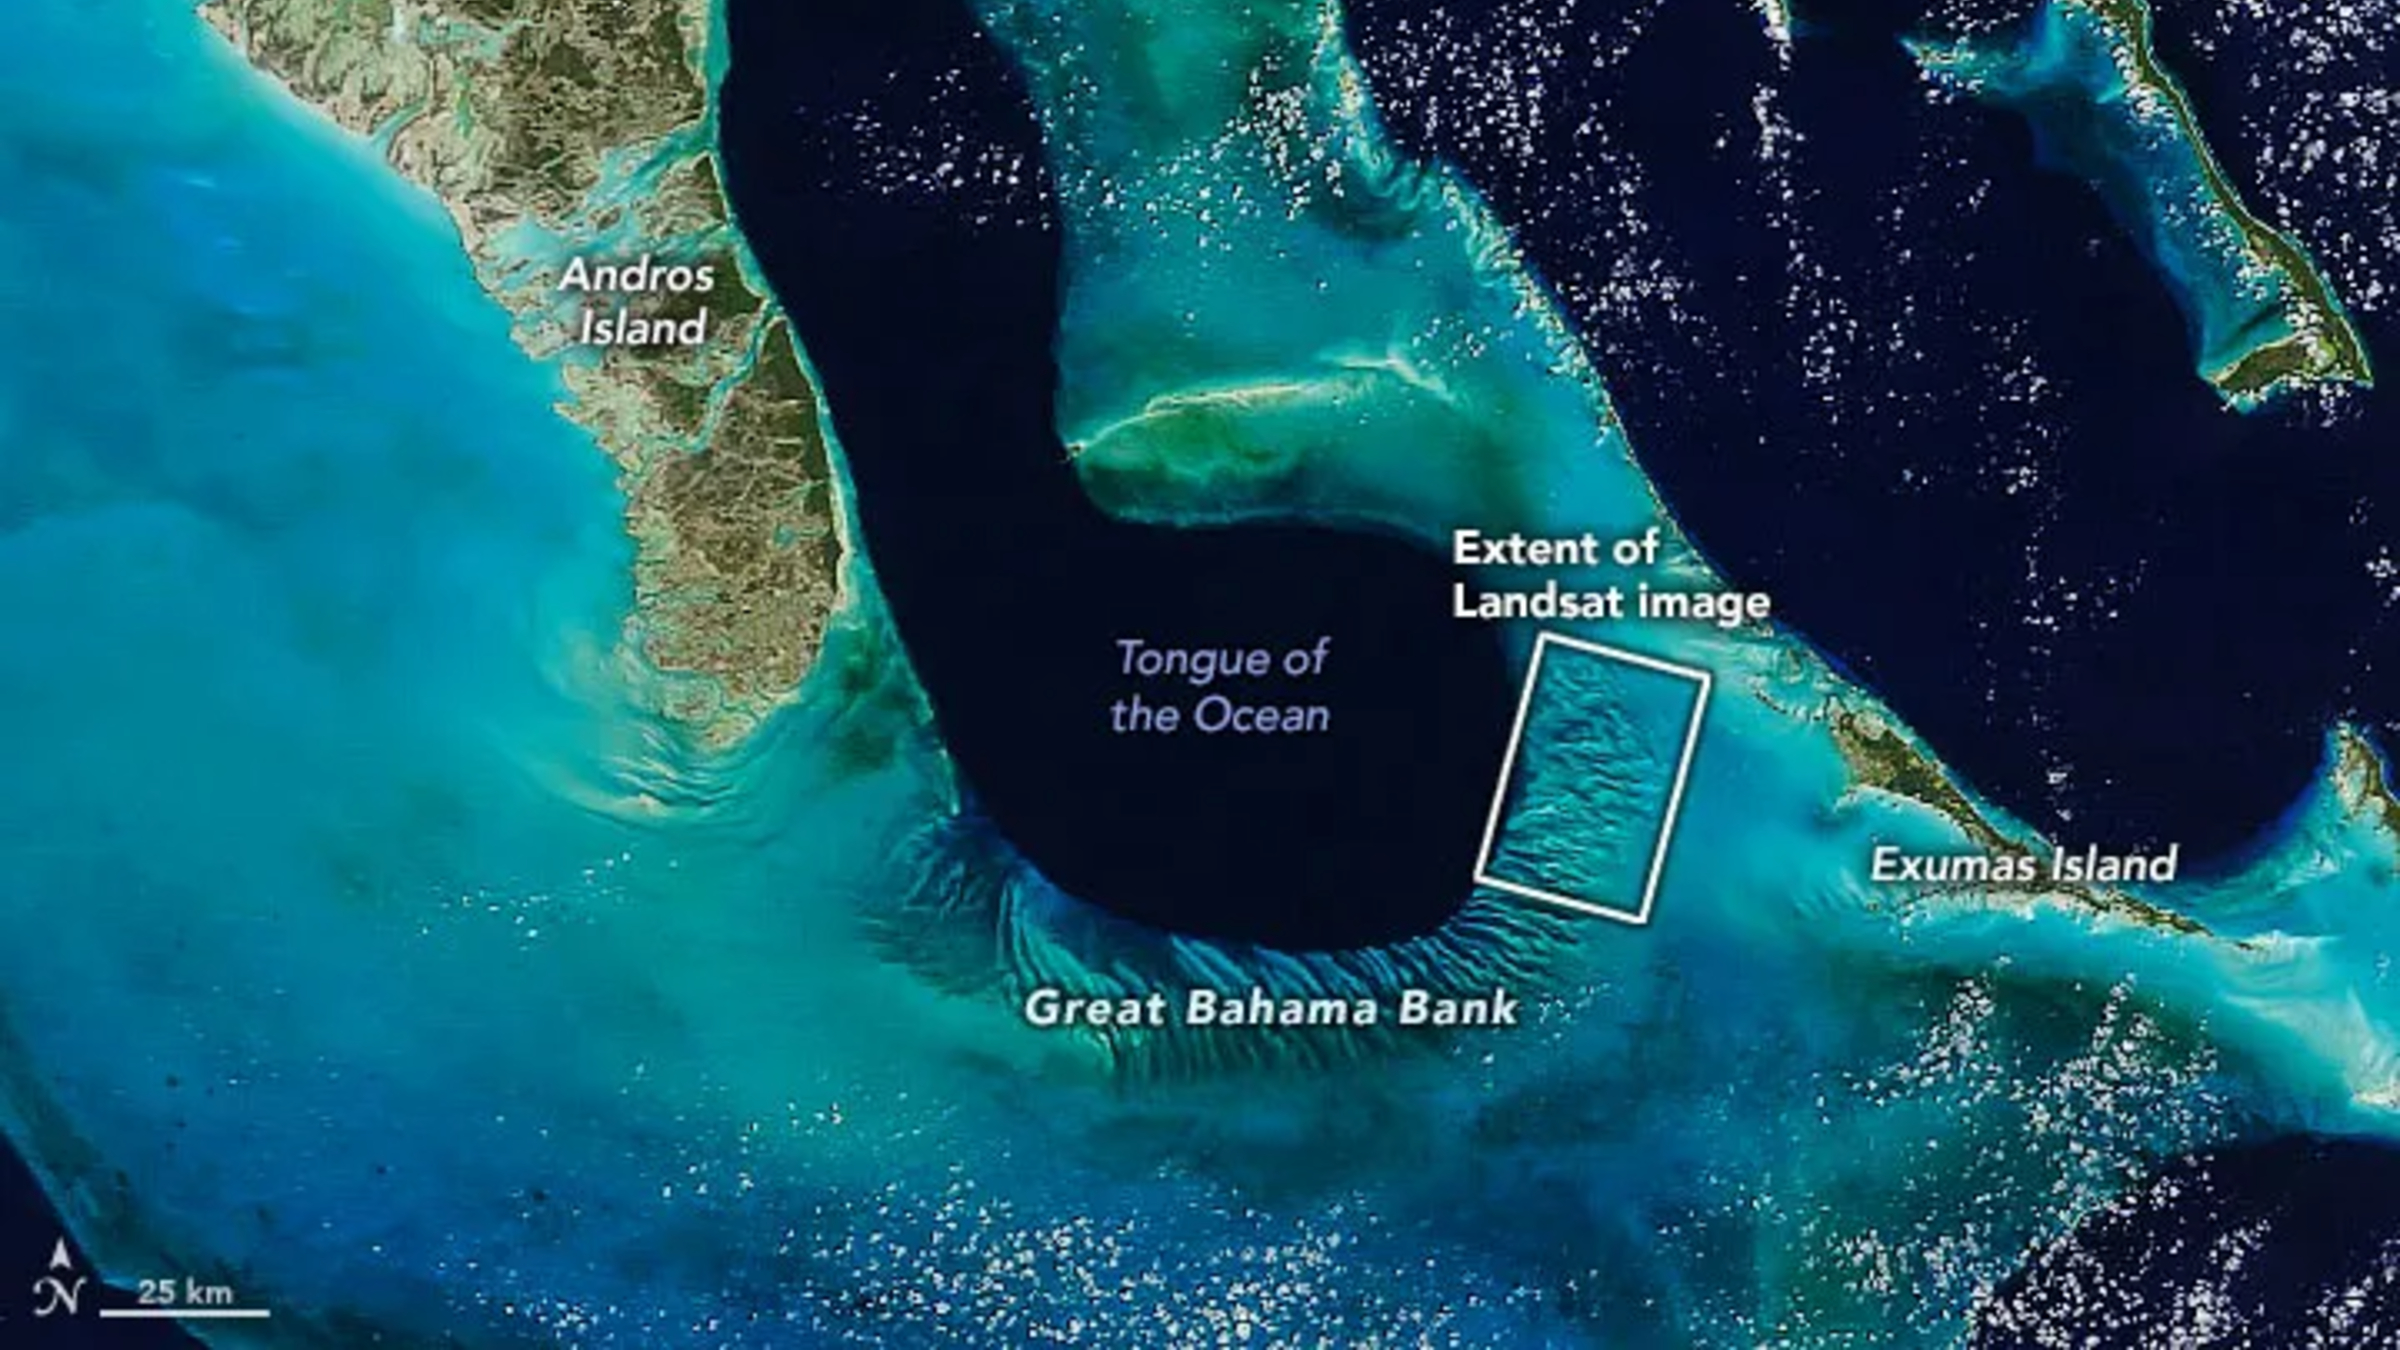
The Great Bahama Bank (GBB) is a massive submerged platform stretching around 330 miles (530 kilometers) across a shallow ocean channel between Andros Island and the Exuma islands, according to Britannica. The crescent-shaped bank surrounds a darkly colored ocean drop-off known as "The Tongue of the Ocean," which plunges to depths of 6,500 feet (2,000 meters), according to NASA's Earth Observatory.
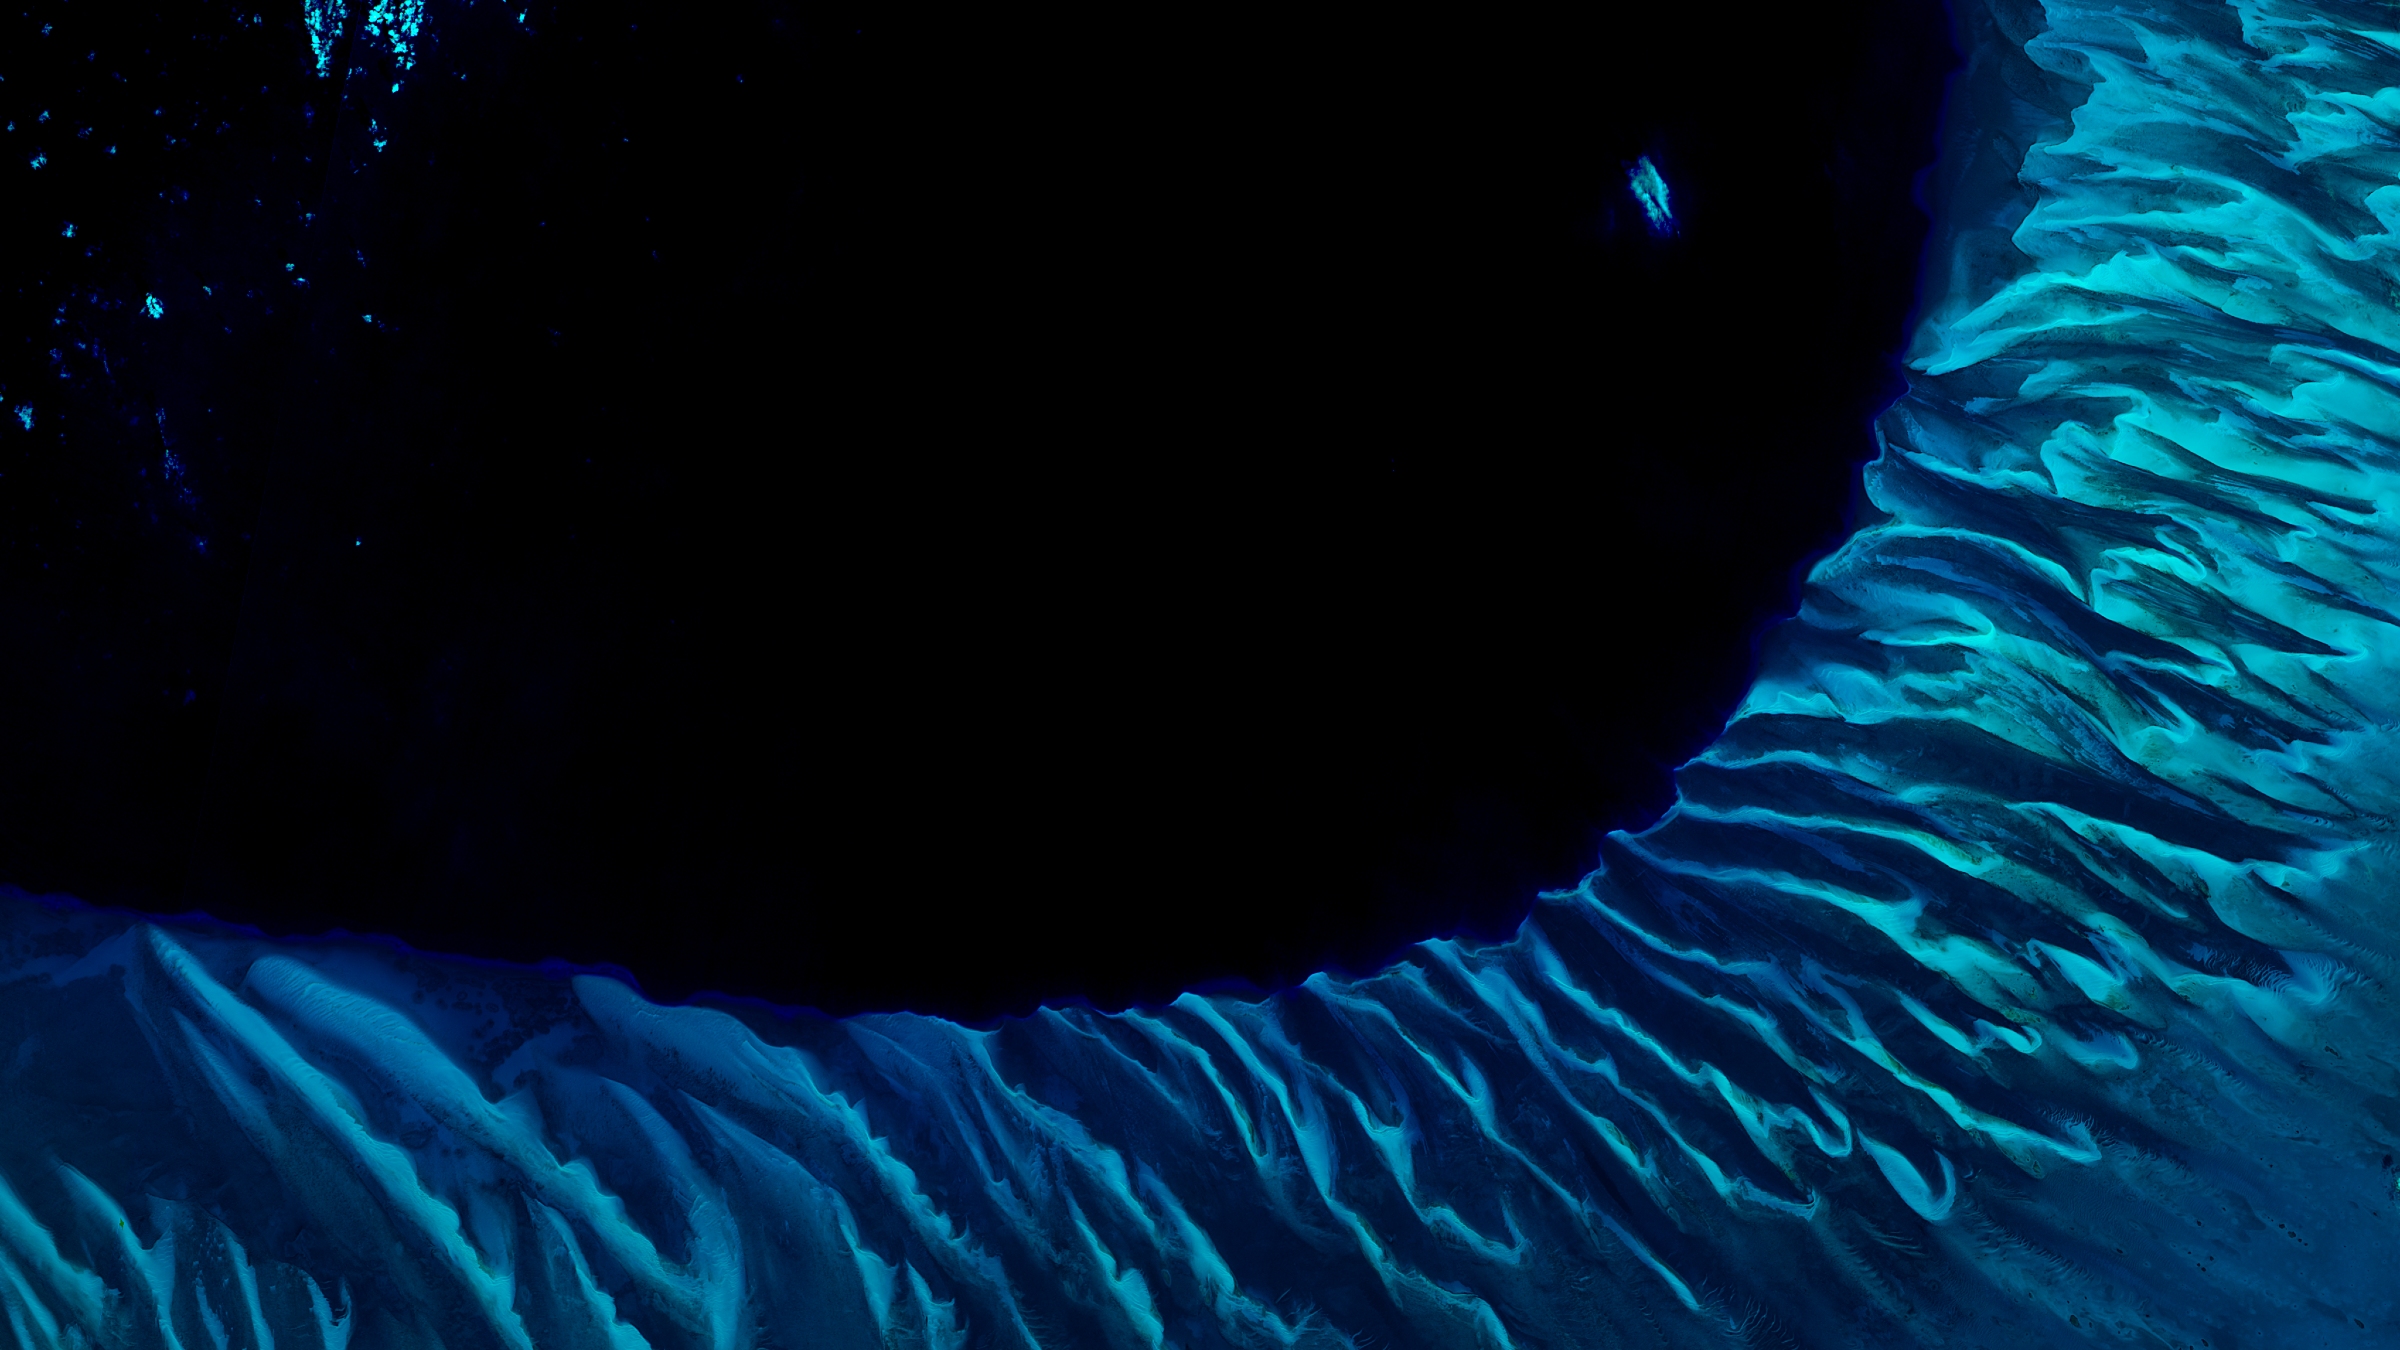
The photographed section of the GBB is around 23 miles (37 km) across and features a series of submerged sandbanks — most of which are covered with dense seagrass beds — that lie between 7 and 40 feet (2 to 12 m) below the ocean's surface.
The varying water depth and seagrass concentration cause multiple hues of green and blue to shine across the sandbanks, which have been carved into smooth, folding ribbons by ocean currents over thousands of years.
"The varying colors and curves remind us of graceful strokes on a painting," Earth Observatory representatives wrote.
The Great Bahama Bank is a crescent-shaped structure spanning around 330 miles (530 kilometers) between Andros Island and the Exuma islands. (Image credit: NASA/Landsat)
"There are many nice seagrass and sand patterns worldwide, but none like this anywhere on Earth," Serge Andréfouet, an oceanographer at the French National Research Institute for Sustainable Development who first shared the 2001 image, told the Earth Observatory. "I am not surprised it is still a favorite, especially for people who see it for the first time."
The sandbanks are like giant underwater dunes carved out by ocean currents.
"Tides and ocean currents in the Bahamas sculpted the sand and seaweed beds into these multicolored, fluted patterns in much the same way that winds sculpted the vast sand dunes in the Sahara Desert," Earth Observatory representatives wrote in 2001.
The GBB lies atop a roughly 3-mile-thick (5 km) bed of limestone dating to the age of the dinosaurs, more than 65 million years ago. This hefty mass, made up of the remains of long-dead coral reefs, is so large that Earth's crust directly below the GBB has "sagged under the weight," according to the University of Texas at Austin's Marine Science Institute.
The Great Bahama Bank surrounds the edge of a deep sea drop-off known as the "Tongue of the Ocean," creating a striking contrast when viewed from above. (Image credit: USGS/ESA)
Before the end of the last ice age, around 12,000 years ago, this limestone slab had risen to more than 400 feet (120 m) above sea level and only resubmerged as global sea levels rose due to the melting of glaciers, according to the Marine Science Institute.
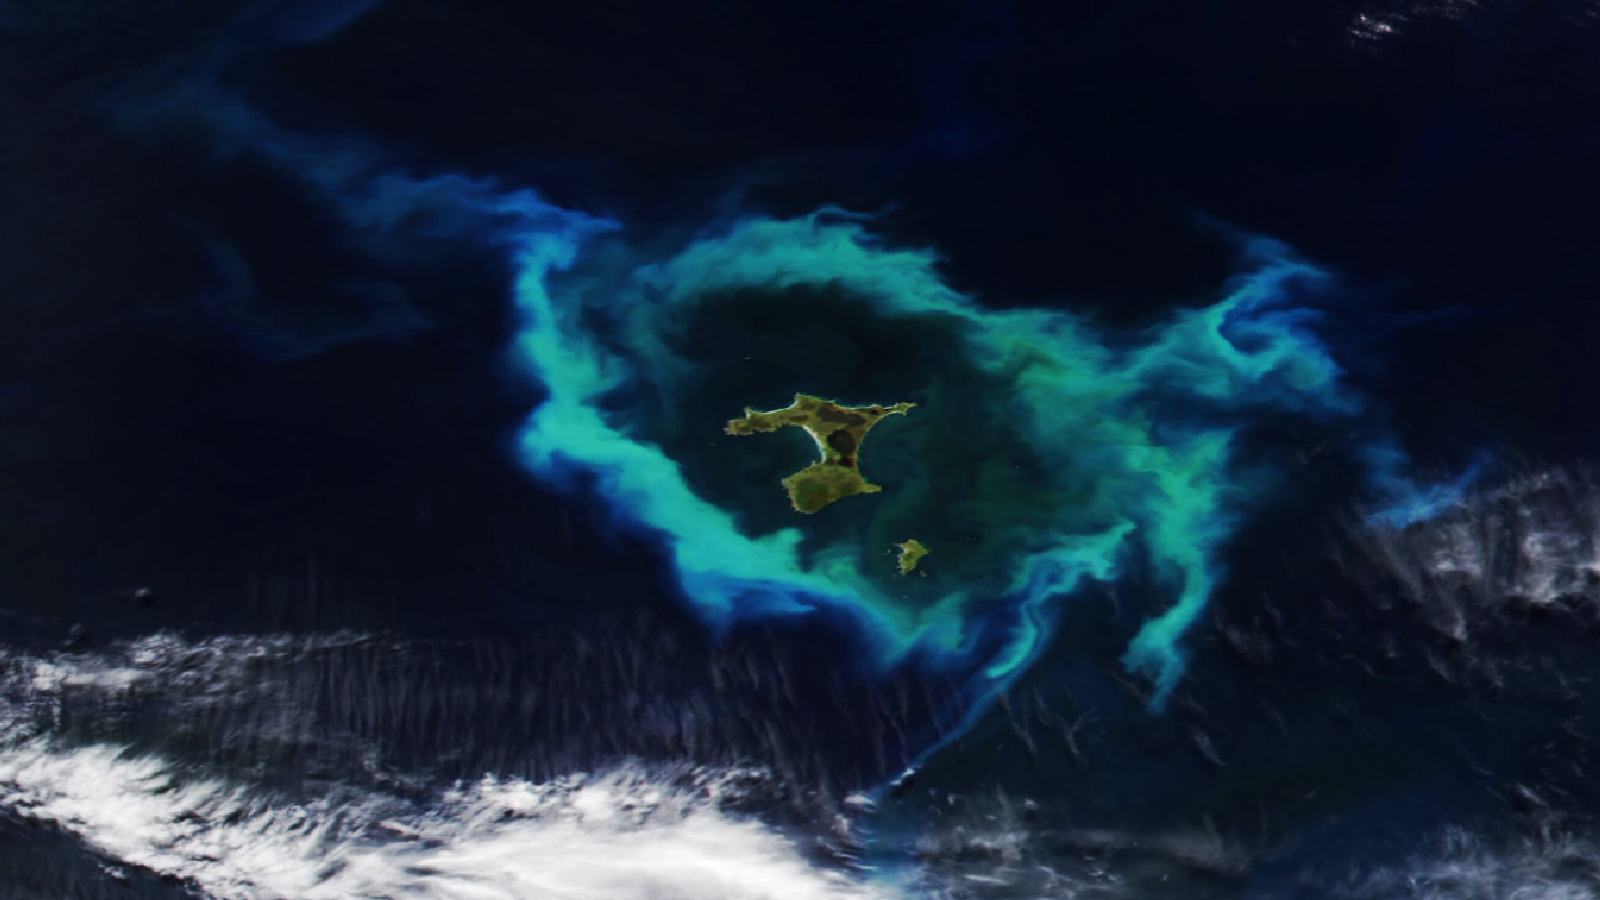
A 2026 satellite photo captured a gleaming halo of phytoplankton encircling the remote Chatham Islands. The stunning sight is the result of a hidden underwater structure, which has also helped kill hundreds of cetaceans.
A 2026 satellite photo captured a stunning scene of sediment swirling across the West Florida Shelf after an extreme cold snap that covered large parts of the eastern U.S. in snow.
A 2020 astronaut photo shows the unusual cetacean-like shape of Belize's Lighthouse Reef. It's home to the famous Great Blue Hole, which doubles as the island's "blowhole" when viewed from space.
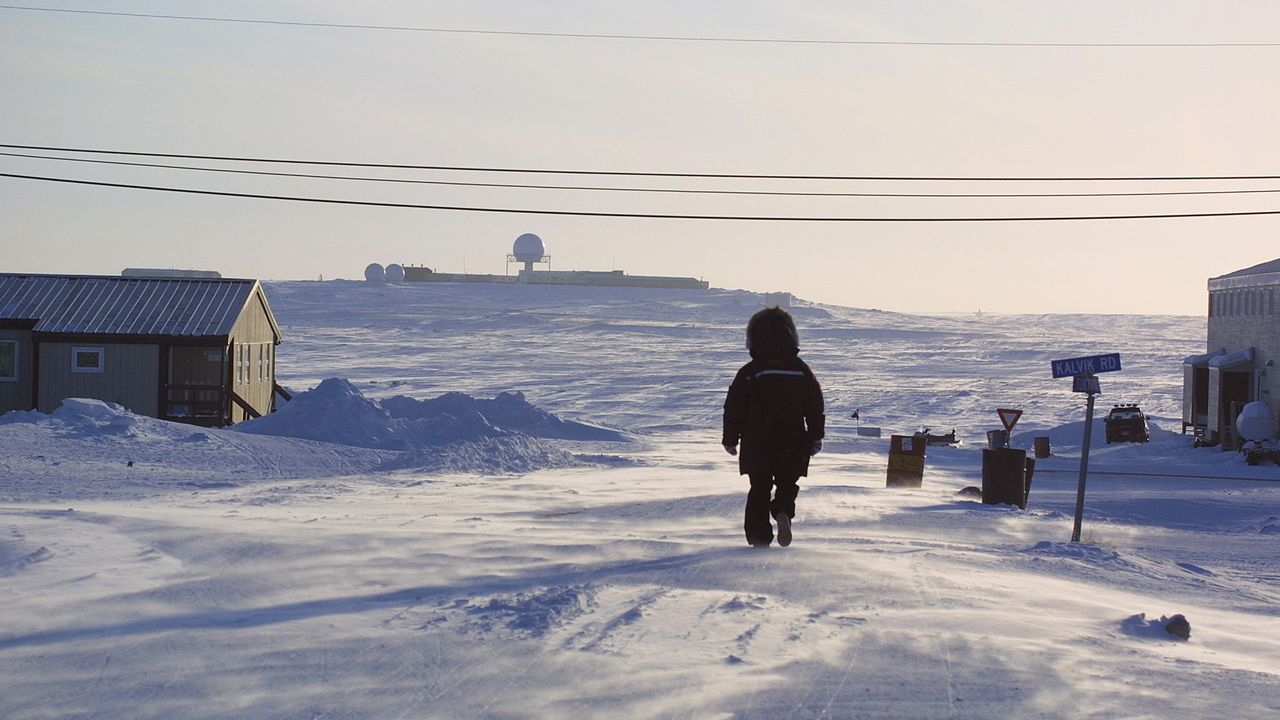
A simple method to thicken Arctic sea ice has shown promising results in its very first field experiment, performed in Cambridge Bay, Nunavut, Canada.
Researchers are considering several controversial geoengineering techniques to slow the catastrophic melt of Arctic sea ice, including stratospheric aerosol injection, which involves shooting tiny sulfur particles into the sky to blot out the sun. But in a new study, scientists evaluated the merits of a much safer and more straightforward approach: pumping seawater onto existing sea ice in winter and letting it freeze into a reinforcing layer.
Known as sea ice thickening, this method has been used by Nordic and Arctic communities for decades, and ice hockey rinks employ a similar technique to keep their ice sturdy, two of the study's authors told Live Science in an email.
"Practical applications [that already exist] include building ice roads and creating platforms for offshore oil exploration," said Edward Blanchard-Wrigglesworth, a research associate professor in the University of Washington's Department of Atmospheric Sciences, and Andrea Ceccolini, an honorary professor at University College London and the CEO of the startup Real Ice, which studies artificial sea ice thickening methods and receives funding from the U.K. government.
Modeling work hints that sea ice thickening could become a climate adaptation tool for Arctic communities by limiting coastal erosion near towns, facilitating travel and supporting animal migrations and hunting.
Now, researchers have assessed the method's efficacy in the field for the first time. Their results, published May 22 in the journal Earth's Future, indicate that both the thickness and brightness of sea ice can be enhanced significantly on small scales — making the ice more reflective, and therefore more resilient to melting.
In the experiment, the team set up eight test areas and three control sites in Cambridge Bay during the winter of 2024 to 2025. Using submersible pumps that each consume less power than a toaster, they flooded the test areas either once or twice with up to 8 inches (20 centimeters) of seawater, while the control sites were never flooded. In spring, one control site was used for a melt pond drainage experiment, which involved drilling small holes in the ice to remove meltwater and expose the brighter ice underneath.
Overall, the test areas grew up to 12.6 inches (32 cm) thicker than the control sites by the end of winter, which is roughly equivalent to the ice thinning that has happened in the Arctic over the past 50 years, according to the study. Test areas that were flooded twice showed greater thickening than those flooded once. And in the melt period from late May to September, sea ice in the test areas appeared brighter and had slower melt rates, remaining thicker than the ice in the control sites. The melt pond drainage experiment also resulted in brighter sea ice than the other control sites.
When water is pumped onto sea ice, it saturates the snow that sits on top of the ice. "The snow-water mixture freezes into a new layer of ice, while the reduction in snow insulation allows colder atmospheric temperatures to accelerate natural ice growth from below," Blanchard-Wrigglesworth and Ceccolini explained.
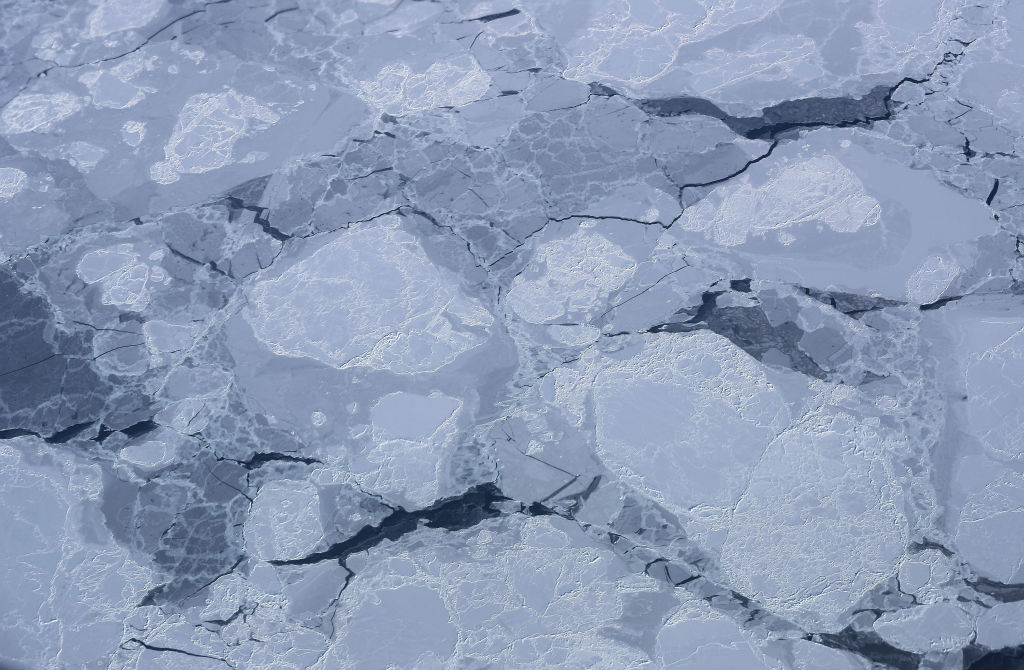
Sea ice thickening could boost the amount of sunlight that is reflected back to space in the Arctic, thus cooling the region. (Image credit: Mario Tama/Getty Images)
Thicker sea ice is usually brighter than thin sea ice, which boosts the amount of sunlight that is reflected back into space. "The broader implication is that these effects could enhance the Arctic's reflectivity through both increased surface brightness and longer-lasting sea ice," the researchers said. "If similar results could eventually be achieved at larger scales, increased Arctic albedo could contribute to regional cooling, with potential knock-on benefits such as slowing permafrost thaw and reducing ice loss from Greenland."
However, there is still a big question mark over how scalable and economically viable sea ice thickening is, given that it requires people and machines working in the field. According to a 2016 study, 10 million wind-powered pumps would be needed to cover just 10% of the Arctic Ocean, and 100 million to cover the entire Arctic. "It is reasonable to ask whether such an endeavor is financially feasible or even logistically possible," the authors of that study wrote.
Yearly sea ice extent in the Arctic has shrunk by 20% since 1979, and this loss is accelerating with global warming. Therefore, if we want Arctic sea ice thickening to work at a large scale, "the pumps must be deployed almost immediately, while there is still a sufficient area of sea ice over which to flood," researchers wrote in a 2021 study.
The ecological and social impacts of Arctic sea ice thickening are not well understood, and further research will delay deployment, meaning it might be too late to roll out sea ice thickening by the time scientists have the data they need to ensure its safety and feasibility.
For these reasons and others, including governance issues and high maintenance needs, "sea-ice thickening is simply not feasible for use at a scale and at a rate that would be meaningful for sea ice protection," researchers wrote in a review published last year.
Deployment on anything but local scales would be challenging, Blanchard-Wrigglesworth and Ceccolini agreed. Nevertheless, the researchers said their most recent winter trials, which have yet to be published, showed encouraging results. In those trials, the sea ice in test areas grew 20 inches (50 cm) thicker than in control sites, The Guardian reported.
"We expect to have a clearer picture once the current melt season is complete," the researchers told Live Science. "In parallel, we are developing underwater robotic technology that could support autonomous deployments. Earlier this year, we conducted the first Arctic field tests of a prototype re-icing drone in Finland."
The drone is currently being refined in collaboration with the BioRobotics Institute in Pisa, Italy, according to The Guardian.
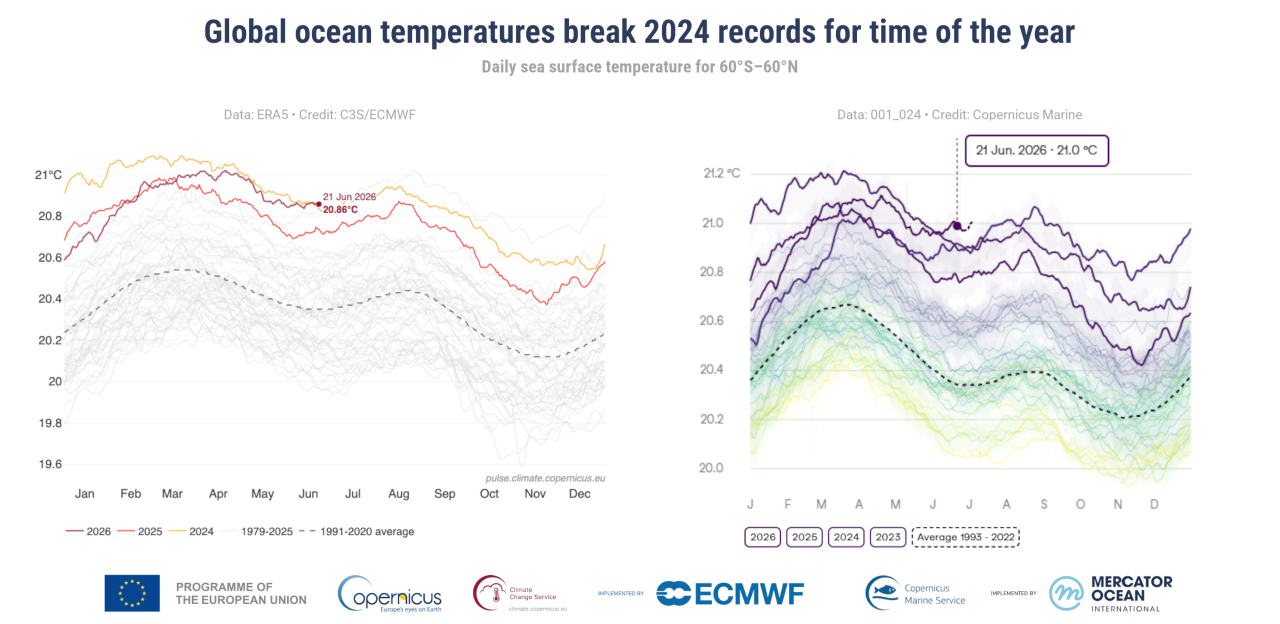
June global sea surface temperatures have climbed to record highs, prompting concerns over extreme weather, flooding, sea level rise and stress to global ocean ecosystems.
The record, announced by the European Union's Copernicus Earth observation program on July 1, surpassed the previous record set in June 2024, with experts warning that more temperature records will likely be set over the coming months.
"Current conditions could indicate the beginning of a new phase, leading, once more, to uncharted territory," Carlo Buontempo, director of the Copernicus Climate Change Service at the European Centre for Medium-Range Weather Forecasts (ECMWF), said in a statement. "With ocean temperatures at these levels and El Niño on the horizon, we are likely to see more temperature records fall in the coming months.”
The record temperature was set on June 21, when the Copernicus Climate Change Service recorded global ocean surface temperatures of 20.86 degrees Celsius (69.55 degrees Fahrenheit), beating the record temperature of 20.83 C (69.49 F) set in 2023 and 2024. This measurement was corroborated by the Copernicus Marine Service, an independent dataset that reported temperatures of 21.0 C (69.8 F).
Graphs to show increasing global sea surface temperatures from two independent data sources (Image credit: Copernicus)
The recent sea surface heating did not occur evenly across the globe. In some areas, such as the Mediterranean, temperatures in June were up to 8 C (14.4 F) higher than average for the period from 1990 to 2020, as per data recorded on June 29, according to the European Space Agency.
The most significant rises in temperature were set in the Mediterranean, the Baltic Sea, bands across the Pacific and off the coasts of Northern Canada.
Warmer ocean temperatures have wide-ranging impacts. "Higher ocean temperatures keep the atmosphere warm for longer, provide extra energy to storms and increase evaporation, thus enhancing the potential for extreme precipitation and flooding," Copernicus Climate Change Service representatives said in the statement. "Ocean warming also contributes to sea level rise and ice melt, and stresses marine ecosystems."
According to data from the Copernicus Climate Change Service, the newly declared El Niño in the Pacific Ocean — the warm phase of a natural climate cycle. This El Niño is likely to reach levels that have not been seen in decades, with more temperature records expected to be set over the coming months as this Pacific heat is injected into an already warming world.
The service added that it remains to be seen whether these temperature spikes are temporary or indicative of longer term trends.
Life on Earth could continue for another 1.8 billion years, according to new research. This figure, which is based on complex climate models, is far longer than many previous studies indicated.
In the new study, published May 28 in the journal JGR Atmospheres, researchers suggest that plant life could continue about 1.8 billion years into the future. That nears the time when Earth would lose its oceans to space, either through radiation splitting water atoms or runaway evaporation, in about 2 billion years.
"We were trying to show that life on Earth — complex vegetation — could survive longer into the future than previous studies had shown," study co-author Jacob Haqq-Misra, an astrobiologist at space exploration charity Blue Marble Space, told Live Science.
The boundaries of life
Life on Earth relies on photosynthesis, the process used by plants, algae and some bacteria to turn sunlight into energy. The mechanism chemically converts carbon dioxide and water into sugars and oxygen. It requires both CO2 and sunlight.
But at certain temperatures, plants' photosynthetic machinery shuts down. Eventually, the sun will warm Earth to the point that plants are no longer able to photosynthesize, which would in turn cause entire food webs to collapse and all life to perish.
Another issue is that as the sun dies and it gets brighter, there will be less carbon dioxide in the atmosphere, effectively starving plants.
Plants turn sunlight into energy, but at certain temperatures this ability shuts down. (Image credit: lamyai via Getty Images)
"The Earth has stayed pretty hospitable in terms of surface temperature for most of the last 4 billion years because it has a built-in thermostat" by storing CO2 in rocks and releasing it during volcanic eruptions, Robert Graham, a planetary science researcher at the University of Chicago, who was not involved in the research, told Live science.
When it is hotter, the planet pulls more carbon dioxide out of the atmosphere and stores it in rocks underground, Graham said. This offsets the warming to keep the temperature stable but means that the carbon dioxide isn't accessible to plants.
Climate models and extreme plants
In the new study, Haqq-Misra and colleague Eric Wolf, a research scientist at Blue Marble Space, used 29 climate models to estimate what would happen to Earth's vegetative biosphere under different scenarios. They used the two extreme cases as limits — when Earth is too hot for life but the CO2 was stable; and when there is not enough CO2, but the temperature was stable. They then looked at the range of CO2 and sunlight conditions in between those extremes. This enabled them to include situations in which Earth was very efficient at pulling carbon from the atmosphere when temperatures started rising.
They also included information about a variety of plants. Some plants can survive on a much lower ratio of atmospheric CO2 than others. The study included plants that have a special photosynthetic process (known as crassulacean acid metabolism), such as succulents and orchids. These plants can sustain themselves on relatively tiny amounts of CO2. The same is true of some marine plants, which can dissolve and access carbon in the ocean system.
Other experts were impressed by the findings.
"Haqq-Misra and Wolf have used a sophisticated 3D climate model to show that Earth's climate may remain hospitable to plant life significantly longer into the future than predicted" by simpler models, said Graham, who authored one of those earlier studies. "It's an advance over previous work and suggests that complex biospheres like that of Earth are more resilient to environmental change from stellar brightening than previously suggested."
Looking to the future
Andrew Rushby, an astrobiologist at Birkbeck University of London who was not involved in the research, told Live Science that the paper updated the concept of the lifetime of the biosphere. However, he cautioned that the results remained "broad estimates."
"It is not possible for us to predict or know the possible evolutionary adaptations that the photosynthetic biosphere may undergo in response to increasing solar output and lower [atmospheric CO2], especially over billions of years," he said.
In their paper, the authors wrote that "limits posed by thermal stress or starvation may only reflect our observations of the biosphere today rather than hard limits on how the biosphere may evolve." There is also no way of knowing how life might adapt to new circumstances.
Haqq-Misra said that he found the results comforting. "Earth's system is resilient, and we are part of something that could have a much, much longer future," he said.
The results could also help scientists figure out what the thresholds could be on other planets. "Part of the challenge is starting with these Earth-based models, and then generalizing the physics as much as possible to be able to simulate a wider range of atmospheres," he said.
How much do you know about our blue planet? Test your terran knowledge with our Earth quiz!
Trees in China that were planted as part of huge reforestation projects appear to grow faster than those in natural forests, a new study finds. This is possibly because the reforestation trees are responding more strongly to the rising atmospheric carbon dioxide, scientists say.
China is quickly turning green. The country has planted 66 billion trees since 1978, with plans for 34 billion more by the middle of this century, as part of its "Great Green Wall" to slow the spread of the Gobi and Taklamakan deserts.
These new forests absorb large amounts of CO2, but it is unclear exactly how they differ from natural ones, study first author Yuhang Luo, a landscape ecologist at Peking University in Shenzhen, China, told Live Science.
Luo and his colleagues set out to study how differences between natural and planted forests, including species diversity, tree density and age, might affect how the forests respond to rising CO2 and climate change.
"Planted forests are widely used in climate mitigation strategies, but most global ecosystem models do not distinguish between forest types or represent age-related dynamics adequately," Luo said. "So we felt it was important to clarify how these factors interact — not just for scientific understanding, but also for improving the models and assumptions that underpin real-world forest policy and carbon accounting."
Planted forests are those purposefully created by humans, such as those in the Great Green Wall. Natural forests, on the other hand, grow without human intervention.
The researchers used satellite data to track leaf area index, a measure of canopy density and a key driver of carbon uptake, to determine how fast the different forest types grew, and found a striking difference: Planted forests increased their leaf area 66% faster than natural ones.
Most of that difference was due to planted forests being, on average, much younger than the natural ones — and young trees grow faster than old ones. But even when comparing forests of similar age and growing conditions, the planted ones still grew 4.6% faster, and the difference was even more pronounced in mixed and evergreen forests.
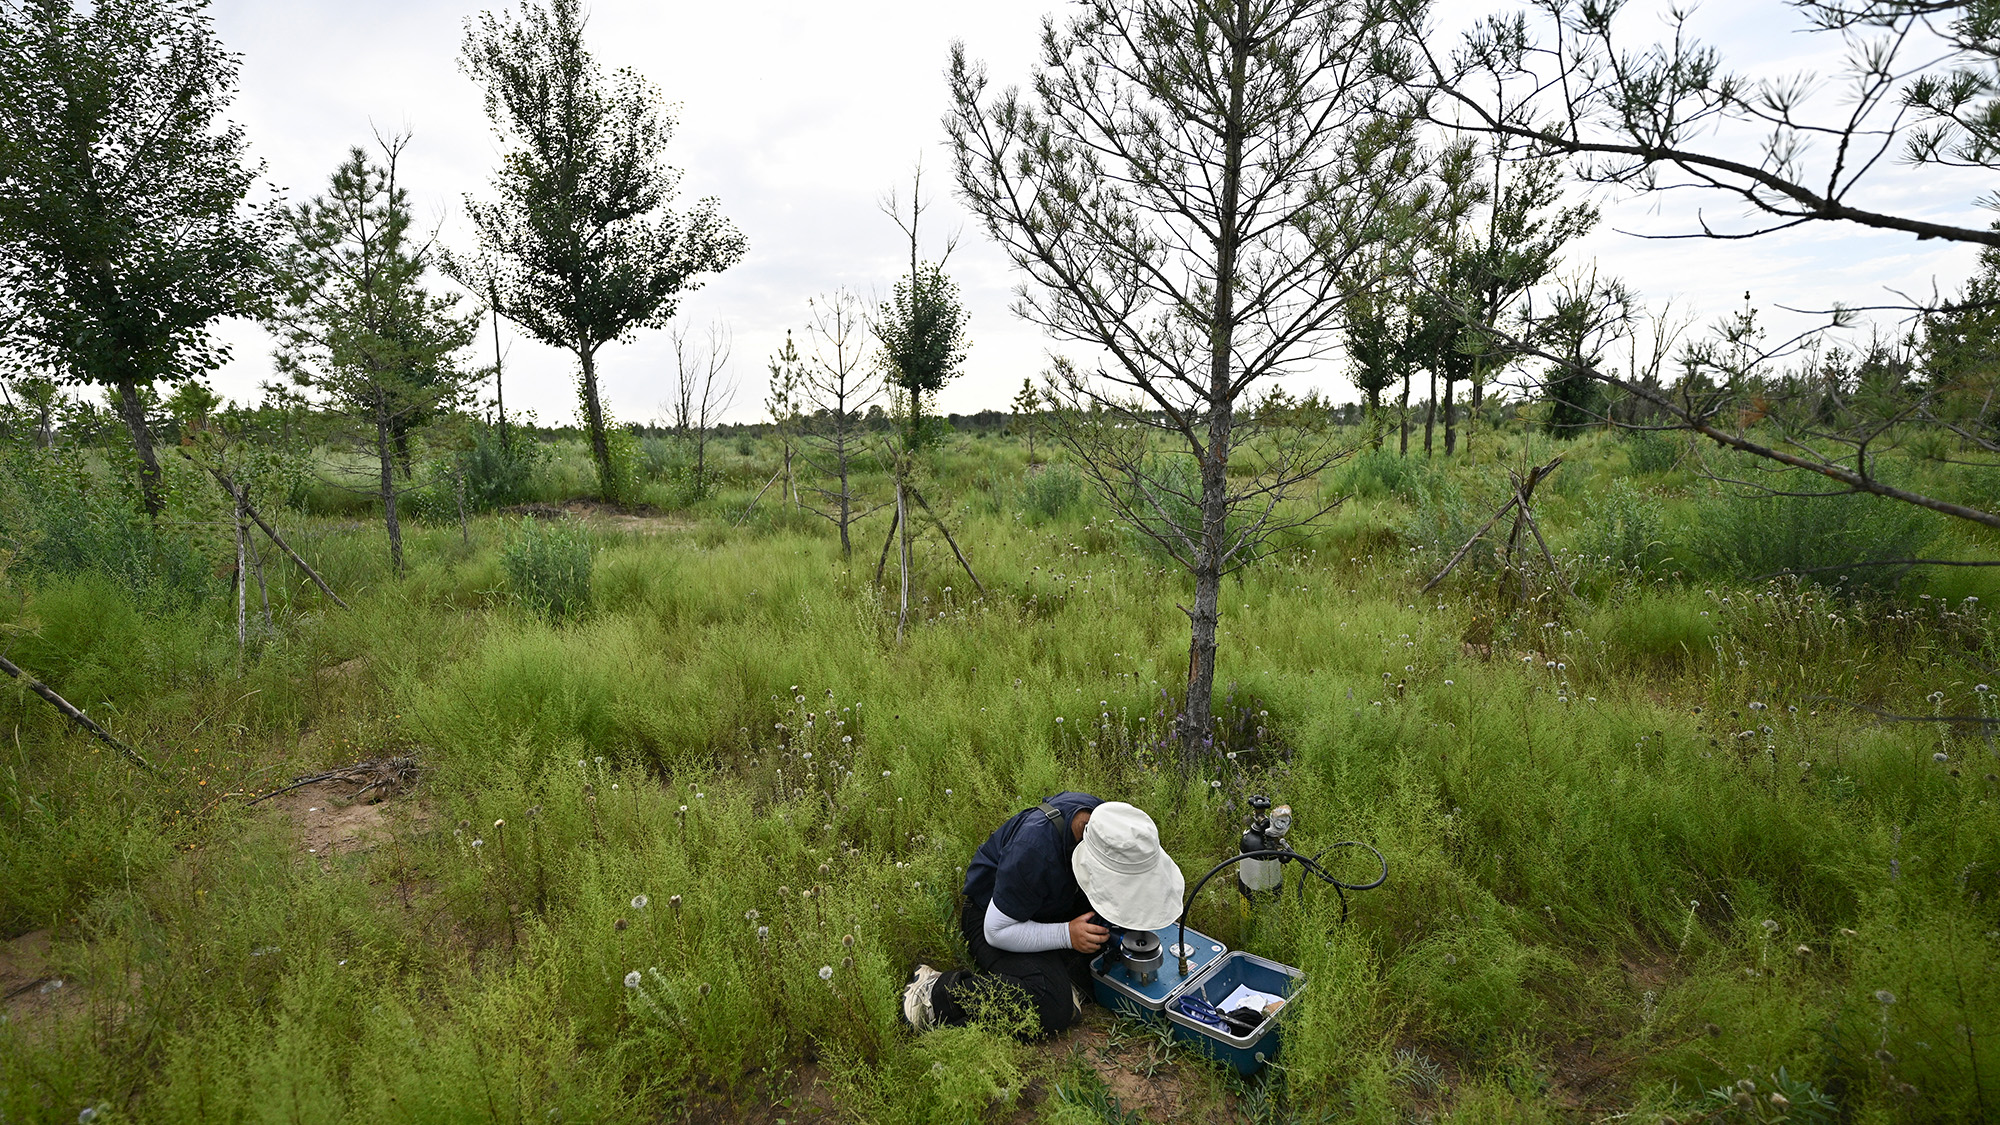
A researcher working in the Great Green Wall in August 2025. So far, 66 million trees have been planted as part of the project. (Image credit: PEDRO PARDO via Getty Images)
This is largely due to how planted forests are managed. They tend to feature fast-growing species like eucalyptus and poplar and are often actively managed, with people removing competing vegetation and even fertilizing them. These interventions reduce competition for light, water, and nutrients, amplifying the fertilization effect of rising atmospheric CO2.
This discrepancy peaks in planted forests when trees are around 30 to 40 years old and then declines noticeably after age 40. In contrast, natural forests grow more slowly but steadily, so have an advantage over the long term.
"Planted forests can be a powerful short-term tool for carbon uptake, but this advantage is temporary," Luo said. "For long-term carbon storage and resilience, natural forests remain irreplaceable."
Kevin Dsouza, who worked on reforestation models during his postdoctoral research at the University of Waterloo and was not involved in the new study, said the results make intuitive sense, as the sprawling leaves of young, fast-growing trees could lead to increased carbon take-up. But he is not sure that leaf area is the best measurement for tracking growth and carbon sequestration.
"It's not a bad proxy, but it doesn't give you the full picture," he said. "The canopy is just the top of the tree and the carbon is stored in all sorts of different places like wood, bark, roots and soil."
Another study of Chinese forests found that natural forests actually accumulate more carbon above ground than planted ones in their early years, Dsouza pointed out, so these results should be considered carefully alongside other factors.
Luo said the findings show that most global climate models are missing something when it comes to understanding how various forest types play a role in carbon sequestration and climate change.
"Land use management works in more subtle and specific ways than we had assumed," he said. "It is not just about planting more trees. It is also about when you plant them, what species you choose, and how you manage them over time."
Luo hopes these findings will help guide reforestation efforts, to ensure we get the most benefit from planting new forests to help mitigate the effects of climate change.
"Our work offers a more practical guide for forest-based climate action: when to plant, what to plant, how long the benefits last, and what current models are getting wrong. We hope that helps people make better decisions," he said.
Editor's note: A picture caption in this article was corrected at 5:16 ET on July 1 to say 66 billion trees had been planted.
What's in the photo? The petrified remains of ancient lava and a skull-like caldera
Who took the photo? An unnamed astronaut on board the International Space Station
When was it taken? Sept. 23, 2019
This eye-catching satellite snap shows off a sprawling mass of petrified lava surrounding the jet-black slopes of a potentially dangerous volcano in the heart of the Sahara. A smaller volcanic "skull" lurks near the shadowy peak's base.
Toussidé (also known as Tarso Toussidé) is a "potentially active" stratovolcano located within the Tibesti Mountains, which cover around 40,000 square miles (100,000 square kilometers) of northern Chad and southern Libya. The dark peak stands 10,712 feet (3,265 meters) above sea level, making it the second-tallest mountain in the Tibesti region.
The name Toussidé roughly translates to "which killed the local people with fire" in the language of the nearby Indigenous people, hinting at a destructive and deadly history. However, according to the Smithsonian Institution's Global Volcanism Program, there is no evidence that the volcano has erupted during the Holocene — the current geological epoch, which began around 12,000 years ago. It is unclear if it has actually killed anyone.
The dark blob surrounding the volcano is known as a massif. It is made up of layers of overlapping magmatic rock left by multiple ancient lava flows that effusively erupted, or slowly poured from, the volcano's summit.
The shadowy structure, which is up to 20 miles (32 kilometers) across at its widest point, stands out against the surrounding sand-covered plateau, which has been carved into a network of crisscrossing canyons by eons of wind blasting, according to NASA's Earth Observatory.
The massif surrounding Toussidé is made of overlapping lava flows. If you look closely at this image, you can see how they criss-cross over one another. The Trou au Natron caldera is also more clearly visible in this photo, which was captured by the European Space Agency's Copernicus satellite in September 2021. (Image credit: ESA/Copernicus)
Just southeast of the massif (in the upper right of the photo), there is a small, white circle containing several dark patches. This is Trou au Natron — a roughly 3,300-foot-deep (1,000 m) volcanic crater, or caldera, which looks eerily like a giant skull when viewed directly from above.
The cranium-like caldera likely formed during an explosive eruption more than 120,000 years ago. It was once filled with a giant salt lake that was home to ancient algae and other microorganisms. When the lake dried out, around the start of the Holocene, the receding water left behind a thick layer of white salt surrounding a pair of eyelike volcanic cones.
Toussidé is one of the youngest mountains in the Tibesti range, which formed by similar effusive eruptions long before the stratovolcano was born. The entire region likely once matched the massif's dark hue before being relentlessly bombarded by sand and wind. In another 100,000 years or so, the massif may blend in with the surrounding plateau, according to the Earth Observatory.
Trou au Natron's salty white floor and volcanic cones make it look eerily like a skull when viewed from above. The dark slopes of Toussidé can also be seen in the background of this image. (Image credit: Gerhard Holub/Wikimedia)
While the shadowy volcano has remained dormant for several millennia, it occasionally puffs out steam from small vents, or fumaroles, near its summit, suggesting that it is still technically active, according to the European Space Agency. However, geologists have not properly assessed its eruptive potential.
A 2014 astronaut photo shows a pair of volcanic lakes appearing to stare up into space from the Chiltepe Peninsula of Nicaragua's Lake Managua. These "eyes" and "skull" were created by violent eruptions thousands of years ago.
This false-color satellite photo from 2014 shows the immense heat emanating from lava lakes at the summits of a pair of simultaneously erupting volcanoes in Congo.
Earth's oldest known impact crater formed when a meteorite slammed into what is now Australia about 3 billion years ago — 470 million years later than scientists previously claimed, a new study suggests.
The impact crater, known as the North Pole Dome crater, is located in Western Australia's Pilbara region, which is home to some of the planet's oldest rocks. It remains a record-breaking structure, beating the world's next-oldest known meteorite impact crater — the Yarrabubba impact structure, also in Western Australia — by roughly 800 million years.
"While the site had previously been identified as an ancient impact structure, its exact age remained uncertain," study first author Chris Kirkland, a professor in the School of Earth and Planetary Sciences at Curtin University in Australia, said in a statement. "The impact left a 'mineral clock' behind. By dating minerals that were remade or newly grown in the damaged rocks, we can now pin down when this extraordinary event happened."
For the new study, Kirkland and his colleagues used advanced mineral dating techniques to estimate the ages of zircon, apatite, calcite and muscovite in shatter cones from the North Pole Dome crater. The researchers analyzed two samples of shatter-cone-bearing rocks, as well as a shocked quartz vein — a sheet-like deposit that typically forms when superhot, mineral-rich water circulates in the cracks between shocked rocks.
Researchers analyzed zircon and other minerals in North Pole Dome rocks. (Image credit: Curtin University)
"The key evidence comes from zircon, a tiny but extraordinarily resilient mineral that can keep geological time for billions of years," Kirkland said. "Some zircons at North Pole Dome have unusual branching, skeletal shapes. We interpret these as impact-modified crystals, formed when older zircon was disrupted, partly recrystallised, and in places regrown during the intense heating caused by the impact."
The age recorded in zircon was the same as that locked inside apatite minerals, giving the researchers confidence that the impact occurred a little more than 3 billion years ago. The younger shatter cones in the Science Advances study may have formed subsequently due to tectonic and thermal activity, the team wrote in the new paper, which was published Tuesday (June 23) in the journal Geology.
"Ancient impact craters are incredibly difficult to date because over billions of years, rocks are altered by heat, pressure and fluids, which can obscure or reset the original impact signals," Kirkland said. "The new age places the North Pole Dome structure as Earth's oldest known impact crater and the only recognised example from the Archean eon [4 billion to 2.5 billion years ago], a time when the planet's earliest continents were forming."
Planet Earth quiz: What do you know about our planet's most amazing features?

 Login