As a new, potentially record-breaking El Niño begins, researchers are vigorously debating whether climate change is driving the phenomenon’s intensity.
As a new, potentially record-breaking El Niño begins, researchers are vigorously debating whether climate change is driving the phenomenon’s intensity.
As a new, potentially record-breaking El Niño begins, researchers are vigorously debating whether climate change is driving the phenomenon’s intensity.
As a new, potentially record-breaking El Niño begins, researchers are vigorously debating whether climate change is driving the phenomenon’s intensity.
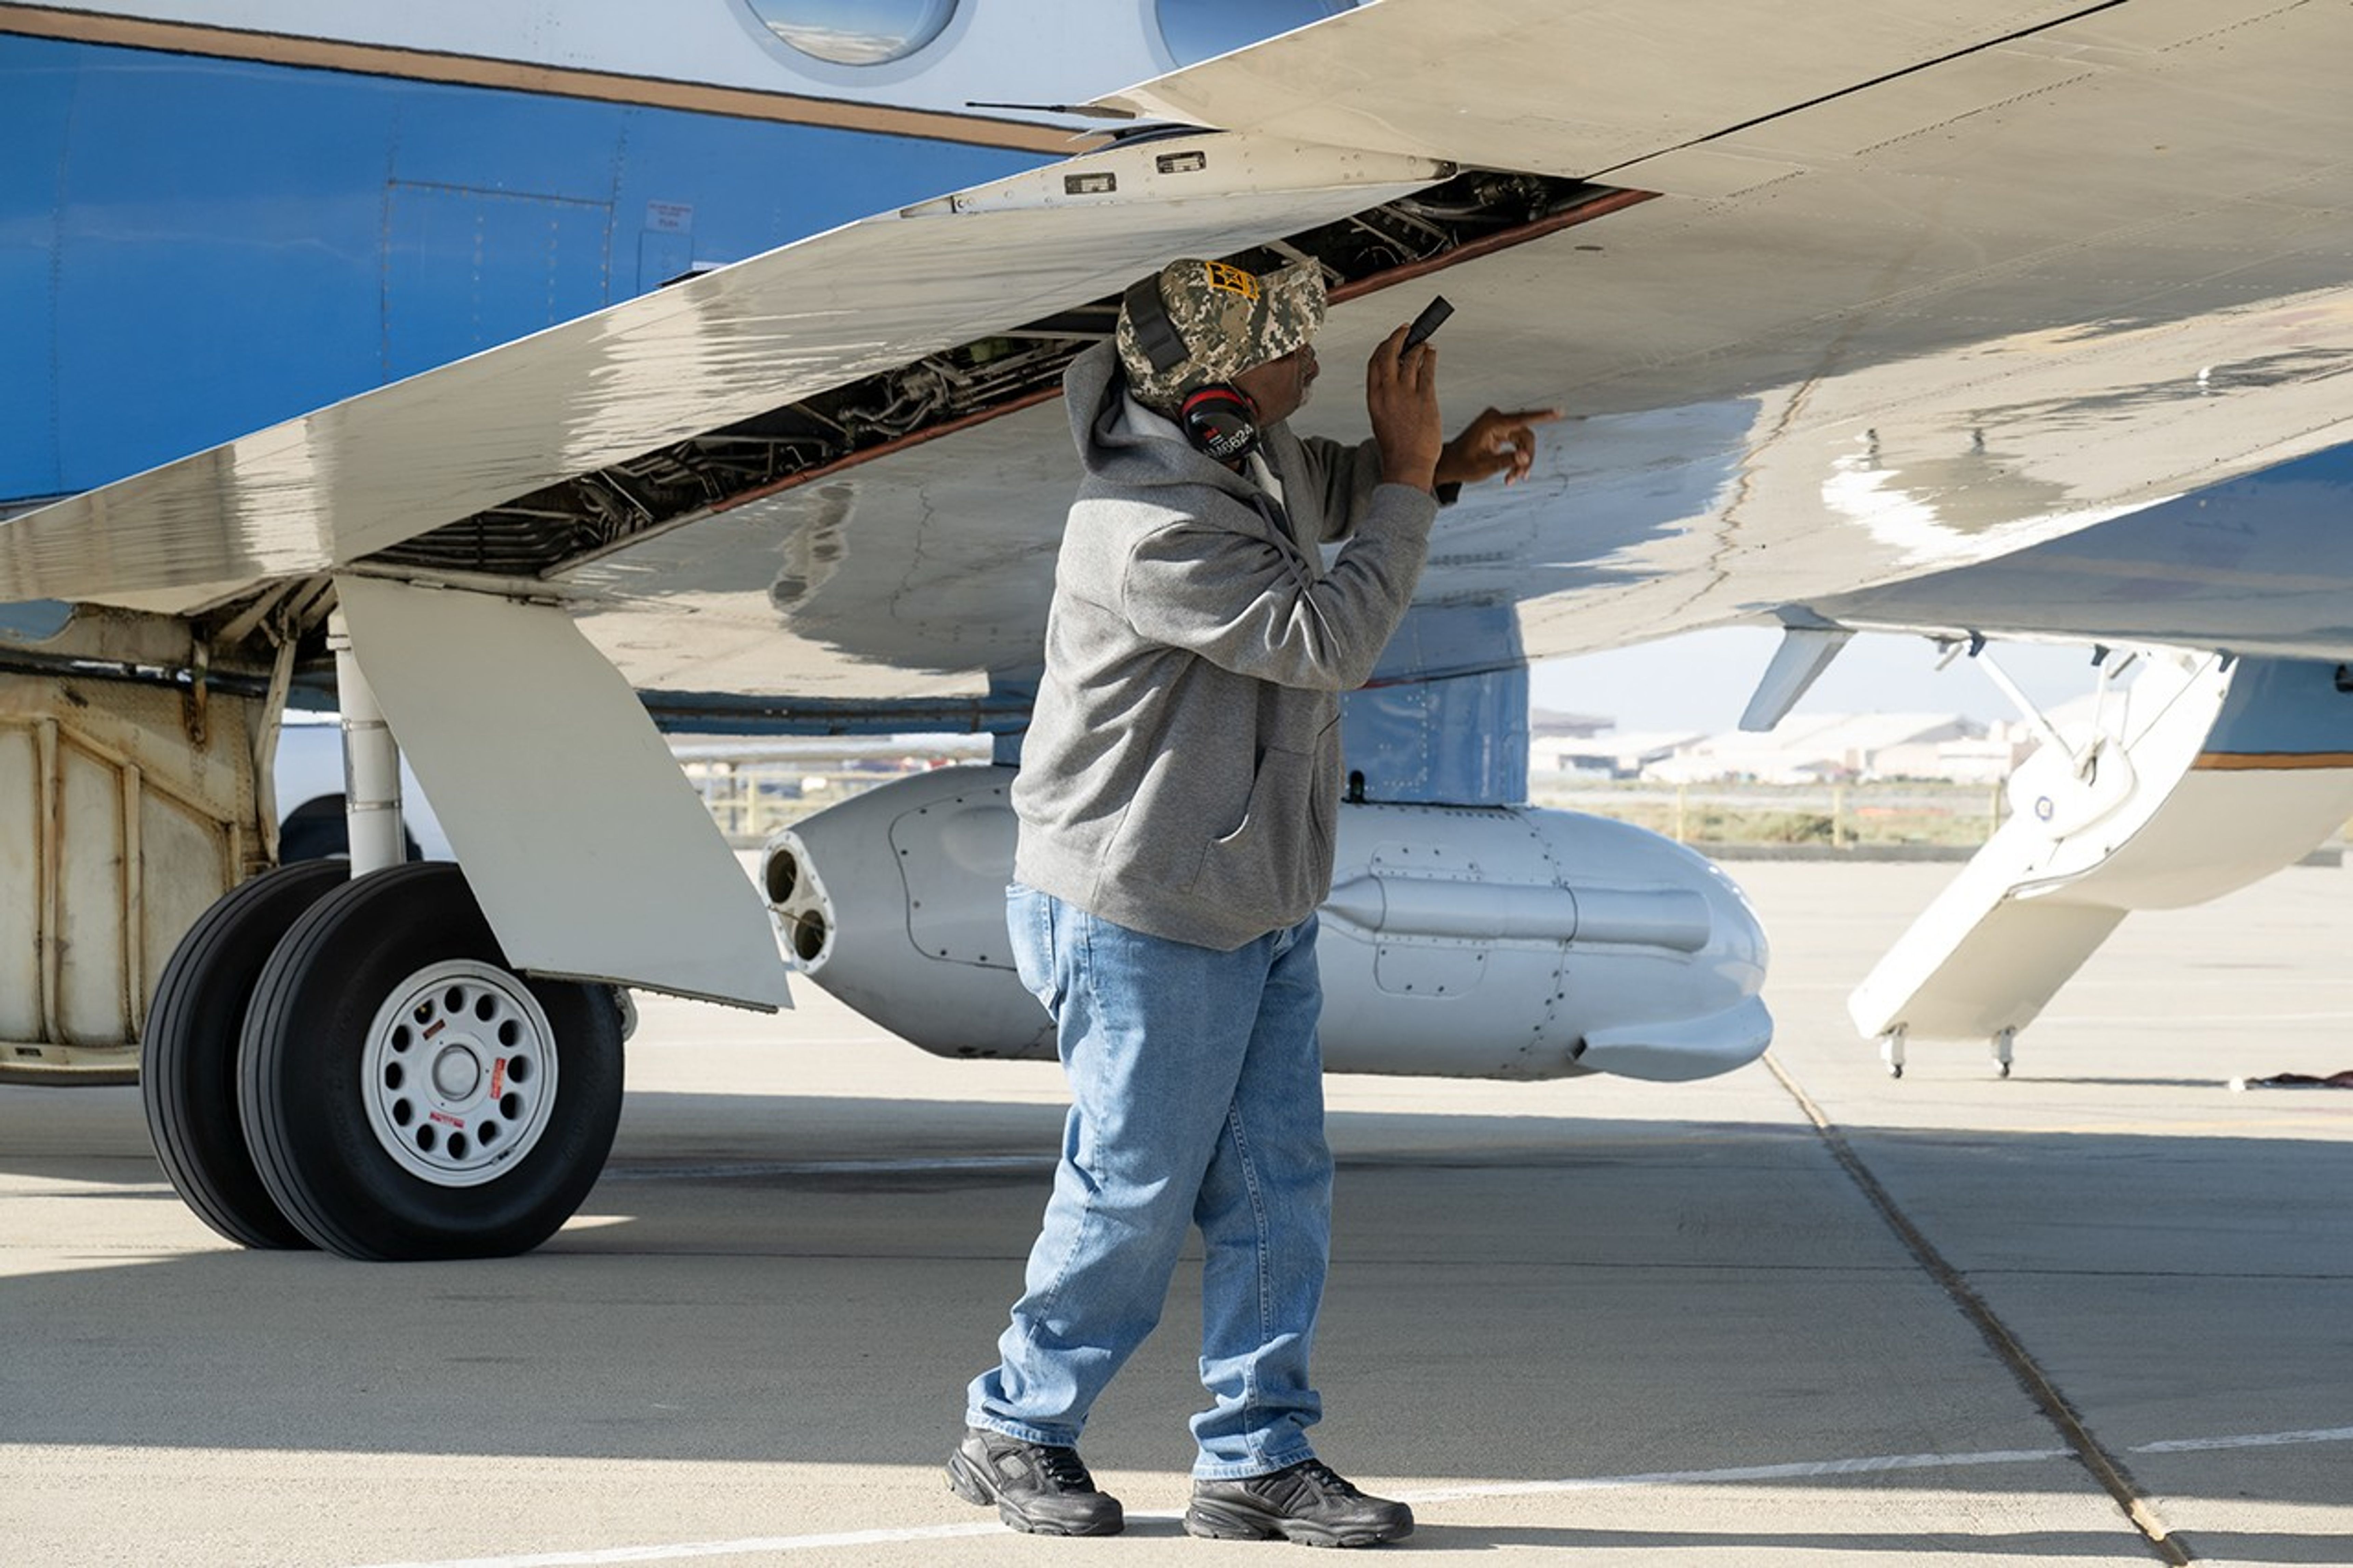
Alvin Mitchell, a NASA C-20A aircraft quality assurance inspector, completes preflight checks at NASA’s Armstrong Flight Research Center in Edwards, California, on April 29 for a mission over Central California. On May 2, the aircraft departed for the Tropical Synthetic Aperture Radar campaign carrying NASA’s Uninhabited Aerial Vehicle Synthetic Aperture Radar.
NASA/Ryan Kline
Data from a NASA campaign in Panama and Peru will help communities prepare for tropical floods in cloud-covered areas, improve scientific understanding of forest health, and support planning for spaceborne missions.
NASA’s C-20A aircraft from Armstrong Flight Research Center in Edwards, California, flew the Uninhabited Aerial Vehicle Synthetic Aperture Radar (UAVSAR) instrument, developed at NASA’s Jet Propulsion Laboratory in Southern California, to gather mission data. While flying repeat paths, the instrument collected high-resolution radar data from a pod mounted beneath the aircraft. The monthlong campaign, known as Tropical Synthetic Aperture Radar, or TropiSAR, concluded on June 4 after 17 flights totaling 75 hours.
Airborne data were captured over Peru in the same times and locations as data captured by the NISAR (NASA-ISRO Synthetic Aperture Radar) satellite to validate key NISAR capabilities and support calibration of the satellite’s L-band radar system. The science validation targeted two measurements: tropical rainforest flood extent within the Pacaya-Samiria National Reserve in Peru, one of the world’s largest protected flooded forests, and glacier movement in the Huascarán National Park in the Peruvian Andes, which is home to the largest concentration of tropical glaciers. The mission also gathered detailed 3D views of tree height and density to estimate biomass, assess forest health, and better understand how forest ecosystems store and release carbon.
In Panama, TropiSAR also supported NASA’s Airborne Validation Unified Experiment: Land and Ocean (AVUELO) campaign in collaboration with the Smithsonian Tropical Research Institute. Airborne radar data were collected from dry forests and coastal wetlands with the goal of better understanding Panama’s rich biodiversity. By linking field measurements with airborne and satellite observations, AVUELO may advance new methods for studying the tropics.

 Login