❌

Reading view

Scientists say the West Antarctic Ice Sheet could collapse with very little additional warming and the four metres of sea level rise that would follow cannot be stopped once it begins
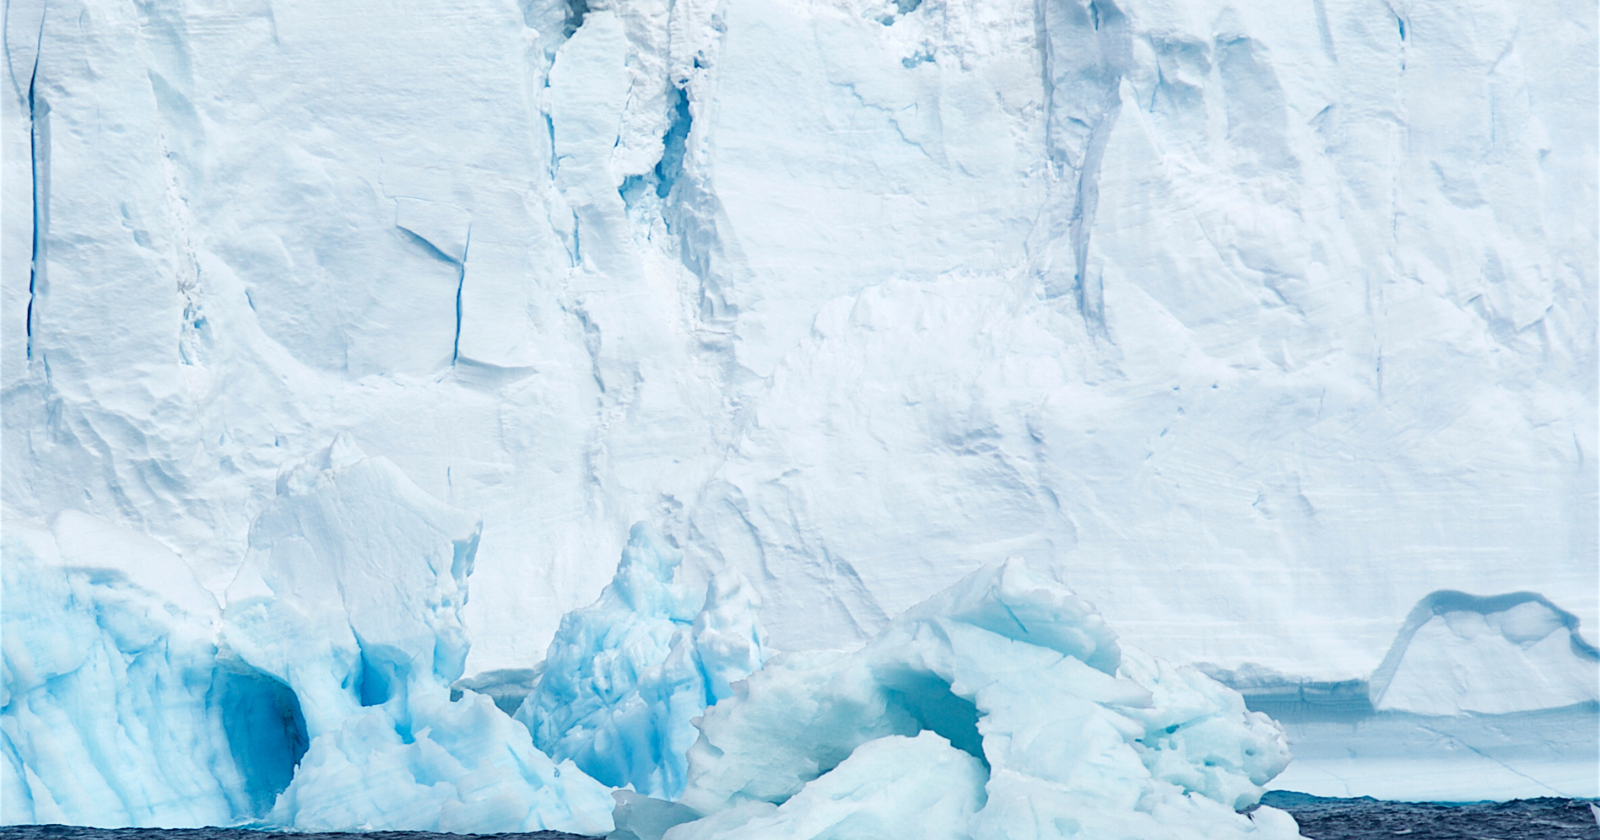
A modelling study published in Communications Earth & Environment in June 2025 found that the West Antarctic Ice Sheet could begin an irreversible collapse at ocean temperatures between zero and 0.25°C above current levels — meaning the threshold may have already been reached

Once the collapse begins, the authors argue, it would be self-sustaining: not a process that could be halted by subsequent emissions reductions, but one that would continue until the ice sheet had contributed roughly four metres to global sea levels. That contribution would unfold over centuries to millennia. The study is one modelling paper, not a settled consensus, but the threshold it identifies is lower than many prior estimates, and the mechanism it describes is worth examining closely.

The authors are David Chandler, Petra Langebroek, Ronja Reese, Torsten Albrecht, Julius Garbe, and Ricarda Winkelmann, working across the Potsdam Institute for Climate Impact Research, the Norwegian research centre NORCE, and Northumbria University. To examine how the ice sheet has responded to past conditions, they ran model simulations extending back 800,000 years, giving the analysis a long baseline of Antarctic ice sheet behaviour against which to calibrate the projections.

What the threshold means

The 0.25°C figure refers to ocean warming at depth around West Antarctica, not to global average surface temperature. The distinction matters. Ocean temperatures in the Amundsen Sea, which washes against the base of the West Antarctic glaciers, have already been rising as warmer Circumpolar Deep Water intrudes further onto the continental shelf. The study does not claim that threshold has been crossed; it identifies where, in the model, collapse becomes self-sustaining.

The mechanism at the centre of the analysis is marine ice sheet instability. The West Antarctic Ice Sheet sits largely on bedrock below sea level. Its glaciers are held in place partly by ice shelves, floating extensions of the sheet that buttress the flow of ice toward the ocean. As warm water undercuts those shelves, they thin. As the grounding line, where the glacier meets the ocean floor, retreats into deeper water, the geometry of the ice sheet becomes less stable. In this configuration, retreat can accelerate under its own weight without requiring additional external warming to continue.

This is the self-sustaining character the paper describes. Beyond the 0.25°C threshold in the model, the process continues even if ocean temperatures were to stop rising. The four metres of sea-level rise is not a peak that would be reached and then reversed; it is the new equilibrium state the ice sheet would settle toward over the following centuries and millennia.

What the paper does not show

This is one modelling study, not settled consensus. The result should be taken seriously, but it should not be read as the final word on the timeline, the precise threshold, or the certainty of collapse.

Modelling the West Antarctic Ice Sheet involves choices about ice physics, ocean forcing, and bedrock properties that different research groups represent differently. Other recent work has reached varying conclusions about how close the system currently sits to a tipping point, and the question of whether the ice sheet has already been destabilised is actively debated in the literature. A 2023 paper from a separate group concluded the sheet had not yet been pushed past tipping, while noting the path toward it was concerning.

The 800,000-year baseline the team used is a strength of the analysis, providing a longer view of how the ice sheet has behaved under past climate states than most studies can offer. But extrapolating from past behaviour to future response under conditions that may be outside the range of the historical record carries its own limitations, and the authors acknowledge these.

The asymmetry of the timescales

One detail in the paper that the coverage has noted is the asymmetry between the timescale of destabilisation and the timescale of ice sheet growth. It takes tens of thousands of years for a large ice sheet to accumulate. The conditions that could initiate collapse can be reached in decades. The four metres of sea-level rise would then play out over centuries. That sequence has a particular character: a fast trigger, a slow-moving consequence, and a very long tail.

Four metres of sea-level rise distributed over centuries is not an outcome that falls within ordinary planning horizons. It is an outcome that would affect coastlines and populations far beyond any current infrastructure’s design life. The paper frames the next few years as a period in which the trajectory of deep ocean warming around Antarctica will become clearer, and in which emissions choices will continue to influence where the system ends up relative to the threshold the model identifies.

What to watch

The Amundsen Sea embayment, where Thwaites and Pine Island glaciers are already showing significant grounding-line retreat, is the region the paper’s concerns centre on most directly. Ongoing observational work on those glaciers, including the International Thwaites Glacier Collaboration’s field campaigns, will provide ground-truth data against which modelling results like these can be tested.

Whether observed ocean temperatures at depth around West Antarctica are approaching the 0.25°C increment the study identifies, and how quickly, is a question the oceanographic record will continue to answer over the next several years.

The post Scientists say the West Antarctic Ice Sheet could collapse with very little additional warming and the four metres of sea level rise that would follow cannot be stopped once it begins appeared first on Space Daily.
  •  

PCA-Based Climate Index Boosts Tropical Daylight Modeling

In a groundbreaking advancement for climate-based daylight modeling, researchers Aw, Leng, and Lim have developed an innovative Principal Component Analysis (PCA)-based climatic similarity index designed specifically to enhance weather file selection criteria in tropical climates. This pioneering study, published in Scientific Reports in 2026, not only addresses the critical challenge of accurately simulating daylight conditions in regions characterized by complex tropical weather patterns but also marks a significant leap forward in climate-driven architectural and environmental modeling.

Tropical climates are notoriously difficult to model due to their inherent variability and a rich tapestry of meteorological phenomena, including high humidity, fluctuating cloud cover, intense rainfall, and dynamic solar radiation patterns. Traditional weather file selection methods often fall short in capturing this complexity, which can lead to inaccuracies when used as inputs for climate-based daylight simulations. It is precisely this gap that the PCA-based climatic similarity index aims to bridge, by offering a sophisticated, data-driven method to select representative weather files that better mirror the actual climatic nuances of tropical regions.

At the core of this new method lies Principal Component Analysis, a powerful statistical tool that reduces the dimensionality of large, multivariate datasets while preserving the most critical variances within the data. By applying PCA to a wide array of climatic variables—such as temperature, humidity, solar radiation, wind speed, and cloud cover—the researchers extracted patterns that effectively distill the complexity of tropical weather into manageable, representative components. This dimensionality reduction facilitates the identification of weather days or periods that are climatically similar, which can then be selectively employed in daylight modeling simulations to enhance their fidelity.

One of the most striking aspects of this research is its focus on tailoring the index specifically for tropical environments. Unlike temperate or arid regions, tropical climates present a unique set of challenges due to their lack of distinct seasons, diverse microclimates, and frequent convective weather events. The PCA-based similarity index developed in this study accommodates these factors by incorporating variables sensitive to the high variability and transient nature of tropical weather, thereby offering a bespoke solution rather than a one-size-fits-all approach.

Implementing this index drastically improves the selection of weather files for daylight modeling. Instead of relying on standardized Typical Meteorological Year (TMY) datasets, which might not sufficiently capture the local climatic variability, the index enables the identification of the most climatologically representative data points. Consequently, simulations built on these carefully curated datasets demonstrate markedly improved accuracy in predicting daylight performance, solar heat gains, and glare potential—parameters crucial for the optimization of building energy efficiency, occupant comfort, and environmental impact in tropical architecture.

The implications of this development extend beyond just daylight modeling. Because accurate weather file selection is foundational for a host of building performance simulations, the PCA-based climatic similarity index holds promise for applications in thermal comfort analyses, energy consumption forecasting, and even in the design of adaptive building envelopes that respond dynamically to changing climatic conditions. By improving the input data quality, the model ensures that downstream simulation outputs are more reliable and relevant to real-world scenarios.

Technically, the process begins by assembling an extensive local weather dataset comprising high-resolution meteorological measurements collected over multiple years. The researchers then preprocess the data to address missing values and normalize the variables, ensuring that the subsequent PCA accurately reflects genuine climatic patterns rather than artifacts or biases. The PCA is executed to derive principal components that quantify the dominant modes of variability in the dataset. Each weather day is then scored based on these components, facilitating clustering or similarity assessments.

The novel similarity index is computed by measuring the Euclidean distance between weather days in the principal component space, enabling the quantification of climatic resemblance. Days with the smallest distances are deemed most similar, allowing researchers and practitioners to construct weather file subsets that authentically capture the spectrum of climatic conditions typical for the region. This approach reveals weather analogues that traditional chronological or statistical selection methods might overlook.

To validate the performance of their index, the authors integrated it within a daylighting simulation framework and compared simulation outcomes using weather files selected via their method against those obtained from standard TMY and random selections. The results showed improved correlation with observed daylighting metrics, reduced simulation uncertainty, and an enhanced capacity to capture extreme weather events that significantly influence daylight availability and building performance in the tropics.

This methodological innovation also paves the way for more robust scenario-based simulations in the context of climate change. As tropical regions face increasing variability due to global warming, having a dynamic, adaptable index that can recalibrate weather file selection in response to shifting climatic baselines becomes essential. The PCA-based similarity measure offers a flexible tool to explore the impacts of future climate scenarios on daylight and building performance, supporting resilience and adaptation strategies.

Moreover, this approach is transferable to other climate-based modeling domains. While the current work focuses on daylighting, the underlying mathematical framework could be repurposed for selecting representative weather data in hydrological models, urban microclimate assessments, and even in renewable energy generation forecasting where tropical climate variability plays a critical role.

The researchers emphasize the importance of open data and algorithm transparency, ensuring that the index can be implemented in open-source simulation tools frequently used by the building performance community. This accessibility enhances the potential for widespread adoption, community-driven refinement, and integration into international building standards addressing tropical architecture.

In conclusion, Aw, Leng, and Lim’s development of a PCA-based climatic similarity index represents a vital advancement for climate-sensitive modeling in tropical regions. By refining the selection of weather files, their work promises to improve the accuracy and reliability of daylight simulations, contributing to more sustainable, comfortable, and energy-efficient building designs. As tropical cities grow rapidly and strive to meet sustainability goals, such innovative tools become invaluable for architects, engineers, and policymakers navigating the complexities of climate-responsive design.


Subject of Research: Development of a Principal Component Analysis-based climatic similarity index for enhanced weather file selection in climate-based daylight modeling in tropical climates.

Article Title: Development of a PCA-based climatic similarity index to enhance weather file selection criteria for climate-based daylight modelling simulations in tropical climates.

Article References:
Aw, S.B., Leng, P.C. & Lim, Y.W. Development of a PCA-based climatic similarity index to enhance weather file selection criteria for climate-based daylight modelling simulations in tropical climates. Sci Rep (2026). https://doi.org/10.1038/s41598-026-58112-x

Image Credits: AI Generated

  •  

An exoplanet with a daytime temperature hot enough to vaporize iron has methane on its nightside because of an atmospheric circulation that should not be able to exist at that heat

A team led by Thomas Evans-Soma of the Max Planck Institute for Astronomy in Heidelberg has published observations of the exoplanet WASP-121b that complicate the existing picture of how chemistry moves through an ultra-hot atmosphere. Using the James Webb Space Telescope’s Near-Infrared Spectrograph to watch the planet through a complete orbit of its host star, the team detected methane in abundance on the planet’s nightside. On the dayside, temperatures reach approximately 3,000°C, well above the point at which iron vaporises. Methane, a molecule that decomposes far below that threshold, should not survive the heat. The paper was published in Nature Astronomy in June 2025.

The detection itself is the straightforward part. The explanation is not.

What the JWST data showed

WASP-121b is a tidally locked gas giant orbiting its star in about 30 hours, close enough that one face is always turned toward the heat. The dayside atmosphere, at roughly 3,000°C, is hot enough to break apart most molecules and sustain metals in vapour form. Water, carbon monoxide, and silicon monoxide were all detected there, the last of these making WASP-121b the first planet in which silicon monoxide has been identified in any atmosphere.

The nightside, while still extreme by any ordinary measure, sits at considerably lower temperatures. It was there that the team found methane in concentrations high enough to register clearly in the spectroscopic data. Methane typically breaks apart under heat well below what the dayside experiences. Even on the nightside, the temperatures are sufficiently elevated that methane’s persistence requires an active replenishment mechanism. Without one, the molecule would deplete faster than the atmosphere could sustain it.

The circulation the models did not predict

The explanation Evans-Soma’s team proposes is vertical atmospheric circulation: strong upward winds lifting methane-rich gas from deeper, cooler layers of the nightside atmosphere to replace what is continuously being destroyed at higher altitudes. Deeper in the nightside atmosphere, where temperatures are lower and the planet’s carbon-to-oxygen ratio works in methane’s favour, the molecule forms readily. The proposed circulation carries it upward fast enough to maintain the observed concentration.

The problem is that this kind of vigorous vertical mixing was not predicted by existing atmospheric models for planets in this temperature range. The standard picture of ultra-hot Jupiter dynamics has tended to emphasise horizontal circulation, with hot gas flowing from the dayside to the nightside at high altitudes and cooler gas returning at lower levels. Strong vertical mixing on top of that, specifically on the nightside, was not part of the expected behaviour.

The authors are careful to frame this as a proposal. The methane detection is robust; the vertical circulation as its cause is the team’s interpretation, and the models will need to be tested against the new data before the picture can be called settled. In the authors’ framing, the finding indicates that existing dynamical models will likely need to be adapted to account for the degree of vertical mixing the nightside data appears to require.

What the silicon monoxide finding adds

The detection of silicon monoxide on the dayside is a separate result worth noting in its own right. Silicon monoxide has not previously been identified in any planetary atmosphere, exoplanet or otherwise. Its presence at the temperatures and pressures of WASP-121b’s dayside is consistent with the conditions that would vaporise silicate minerals from deeper layers and carry the products to detectable altitudes.

This is the kind of detail that matters when building out a coherent picture of how ultra-hot gas giants differ chemically from anything in our solar system. The JWST’s NIRSpec instrument has now made it possible to run a reasonably complete inventory of the major carbon, oxygen, and silicon compounds across a planet’s full orbital phase, which is what Evans-Soma and Gapp did here. The dayside and nightside of WASP-121b turn out to carry chemistries that are not just different in degree but qualitatively distinct from each other.

What this means for the models

Ultra-hot Jupiter dynamics are a young field, and the models built so far have been calibrated against a limited set of observations. WASP-121b is one of the most intensively studied exoplanets in this class, partly because its tight orbit and high temperature make its atmosphere accessible to spectroscopic observation from a range of instruments over many years.

The challenge the new paper poses is specific: how does an atmosphere this hot maintain the chemical gradients the data shows, and what is driving the vertical circulation that appears necessary to explain the nightside methane? Those questions will determine what adjustments atmospheric modellers need to make, and whether the circulation observed here is particular to WASP-121b’s conditions or something common across the ultra-hot Jupiter population. The paper does not resolve that question. It opens it.

The post An exoplanet with a daytime temperature hot enough to vaporize iron has methane on its nightside because of an atmospheric circulation that should not be able to exist at that heat appeared first on Space Daily.

  •  

Most people alive today will live to see the Arctic Ocean lose its summer ice — for the first time since before our species left Africa, 115,000 years ago

The Arctic Ocean has had ice on it, in some form, for essentially the entire span of recognisably modern human existence. The most recent interglacial period warm enough to have melted the summer ice cap was the Eemian, approximately 130,000 to 115,000 years ago, during which paleoclimate evidence suggests the Arctic was seasonally ice-free at its summer minimum — most clearly during the warmest phase around 130,000 years ago, with conditions gradually cooling toward the end of the period around 115,000 years ago, when the Arctic returned to continuous year-round ice cover. The Eemian ended before any sustained migration of anatomically modern humans out of Africa, before the development of agriculture, before recognisable language families had differentiated, before the construction of the first permanent settlements, and before essentially every aspect of human society that the present civilisation rests on. For approximately the past 115,000 years — through the entire emergence of modern civilisation — the Arctic has carried summer ice. That period is now ending. By the most recent peer-reviewed projections, the first single year in which the Arctic Ocean drops below the technical threshold for “ice-free” status — defined as less than 1 million square kilometres of sea ice, compared to the historical summer minimum of approximately 5 to 7 million square kilometres — is likely to occur sometime in the 2030s.

According to a 2023 study in Nature Communications by Seung-Ki Min and colleagues at Pohang University and the University of Hamburg, the projected date of the first ice-free Arctic September is now substantially earlier than the IPCC’s 2021 Sixth Assessment Report had concluded. The 2021 IPCC report had projected ice-free conditions “near mid-century” under intermediate and high emissions scenarios, with substantial uncertainty under low-emissions scenarios. Min and colleagues reanalysed the underlying climate models using observational constraints — adjusting the model projections to match the actual rate of Arctic sea ice decline measured by satellites over the past four decades — and concluded that the first ice-free September will likely occur in the 2030s under all emissions scenarios, including the most ambitious low-emissions trajectory. In the words of Dirk Notz, one of the study’s authors and a contributor to the IPCC reports: “We basically are saying that it has become too late to save the Arctic summer sea ice.”

What “ice-free” actually means

The technical definition of “ice-free” in this context is not the literal absence of all sea ice. As reported by a 2024 synthesis review of ice-free Arctic projections in Nature Reviews Earth & Environment, the threshold researchers use is sea ice area below 1 million square kilometres — substantially less than the approximately 4 to 7 million square kilometres that has been the typical late-summer minimum over the past several decades, but not literally zero. Some ice will continue to form along the northern coast of Greenland and within the Canadian Arctic Archipelago even after the central Arctic Ocean has lost its summer cover. The threshold is set at the level below which the central Arctic basin would be effectively open ocean during the September minimum — navigable, exposed to sunlight rather than reflecting it back, and fundamentally different in its physical, ecological, and atmospheric behaviour than the ice-covered Arctic that has characterised the Earth for approximately the last 115,000 years.

The first ice-free year is unlikely to be permanent. Winter ice will continue to form for some additional decades after the first ice-free summer, and there will be year-to-year variability in summer ice extent. But once the threshold has been crossed, it will be crossed with increasing frequency, and the long-term direction of travel is clear: the Arctic is heading toward a configuration in which late summer is reliably open water, with all of the consequences that flow from that change. A more recent 2024 paper in *Nature Communications* by Heuzé and colleagues projects that the first single ice-free day in the Arctic could occur even earlier than the first ice-free month — potentially before 2030, depending on whether an extreme weather year produces a sufficiently sharp summer melt.

Why the loss matters beyond the Arctic itself

The Arctic Ocean is not a self-contained system. The presence of summer ice across its surface is one of the major regulators of the global climate, and its loss will produce consequences across the planet. The most direct mechanism is the albedo effect: sea ice reflects approximately 80 percent of incoming sunlight back to space, while open ocean absorbs approximately 90 percent of it. Replacing ice with water at the top of the planet means substantially more solar energy is being absorbed into the Arctic Ocean, which then transfers that heat to the surrounding atmosphere, accelerates the warming of the broader Arctic region (which is already warming approximately four times faster than the global average), and propagates the change southward through atmospheric and oceanic circulation patterns.

Per a 2023 analysis in The Conversation of the implications of an ice-free Arctic, the downstream effects include disruption of mid-latitude weather patterns through changes to the polar jet stream (which is increasingly destabilised by the diminishing temperature gradient between the Arctic and lower latitudes); accelerated melting of the Greenland ice sheet (which contributes directly to sea-level rise, unlike sea ice itself); progressive thaw of Arctic permafrost (which releases methane and carbon dioxide stored in frozen organic matter, creating a self-reinforcing warming loop); collapse of Arctic ecosystems built around the seasonal sea ice cycle (including polar bears, ringed seals, walruses, ivory gulls, and the entire food web that depends on ice algae); and substantial disruption to the lives of the approximately 4 million people who live in the Arctic regions of the eight Arctic Council countries — including roughly 400,000 Indigenous people from more than 40 distinct ethnic groups, whose traditional food, transport, and cultural systems are particularly closely tied to a reliably frozen sea.

The geopolitical and economic dimensions

An ice-free Arctic will, simultaneously, open commercial shipping routes that have been closed for the entirety of recorded history. The Northern Sea Route along the Russian Arctic coast, the Northwest Passage through Canadian waters, and a potential central Transpolar route across the open polar ocean will all become reliably navigable during summer months. Container ships travelling from Northeast Asia to Northern Europe will be able to save approximately 40 percent of the distance compared to the traditional Suez Canal route. Energy resources currently inaccessible beneath the Arctic seafloor — estimated at approximately 13 percent of the world’s undiscovered oil and 30 percent of its undiscovered natural gas — will become commercially extractable. Russia, the United States, Canada, Norway, Denmark (via Greenland), and increasingly China (which has declared itself a “near-Arctic state”) are now actively positioning themselves for the strategic competition that an open Arctic Ocean will produce.

The threshold itself, when it is crossed sometime in the next 15 years, will not look dramatic from any vantage point available to most people. It will appear as a satellite image showing slightly less ice than the previous year. It will be reported as a single statistical metric falling below a defined value. The lived experience of most humans alive on the planet at the time will be substantially unchanged on the day of the threshold crossing. But the underlying transition is one of the larger physical changes to the planet that any modern human society has lived through — a return, after approximately 115,000 years, to a configuration of the polar regions that predates the entire arc of recognisably modern human civilisation. The species will, within the lifetimes of most people reading this, become the first generation to witness an Arctic Ocean without its summer ice. The change will not be reversible on any timescale relevant to human institutions. The question is no longer whether it happens but precisely when, and how rapidly the societies that depend on the old configuration adapt to the new one.

The post Most people alive today will live to see the Arctic Ocean lose its summer ice — for the first time since before our species left Africa, 115,000 years ago appeared first on Space Daily.

  •  

Rising Seas Could Turn Mangroves From Climate Heroes Into Carbon Sources

Underwater Mangrove ForestRising seas could turn mangroves from carbon-storing climate allies into unexpected carbon emitters. Mangroves are among the most effective natural systems for capturing and storing carbon, but new research suggests that rising sea levels could significantly reduce that benefit and may even cause these coastal forests to release carbon in the future. Made up of [...]
  •  

The weather and climate science AI revolution isn’t revolutionary

It feels like there's no escaping AI right now, whether you’re trying to type a sentence without being interrupted by a digital “assistant” or struggling to find a new refrigerator that doesn’t require a Wi-Fi connection for some reason. You’d be forgiven for wondering if we’re in the midst of a quantum leap in tech or whether people are just hyping up a heap of slop.

So what should we make of the growing use of AI in weather and climate modeling?

The conversation didn't get off to a great start earlier this year when a National Weather Service office posted a forecast map featuring nonexistent cities in Idaho with names like “Whata Bod” and “Orangeotild.” Thankfully, that was just an AI-generated image produced for social media, not the actual forecast model. Meteorologists and climate scientists are not yet being replaced by large language model prompt engineers.

Read full article

Comments

© Aurich Lawson | Getty Images

  •  

Super El Niño: How Accurate Are These Predictions?

According to predictions from weather organizations across the planet, a super El Niño weather event is likely to begin over the next few weeks. It’s predicted to drive up temperatures across the globe, bringing increased chances of heatwaves, drought, wildfires, and even famines – plus, this year’s El Niño is likely to be stronger than usual, making those effects worse. Let’s take a look.

  •  

A Hidden Arctic Ocean Crisis Is Unfolding Beneath the Melting Ice

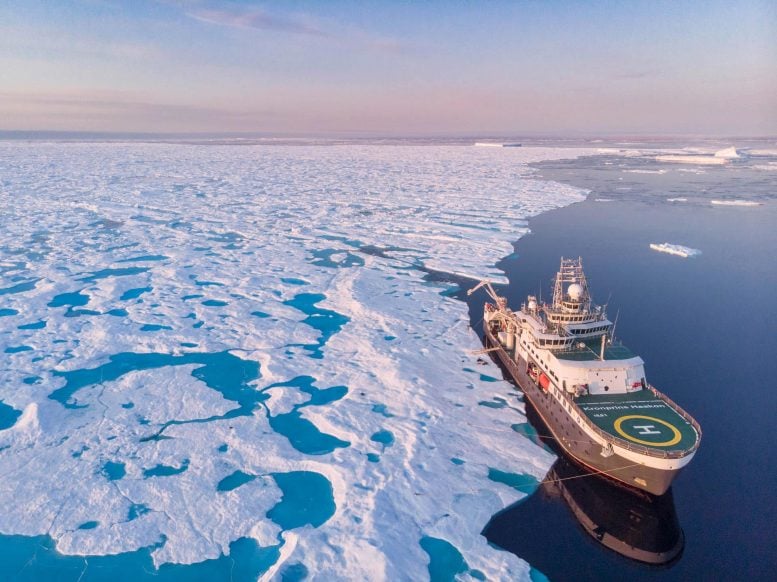
Polar Research Vessel RV Kronprins Haakon Fram Strait Arctic OceanScientists say melting sea ice may have pushed the Arctic Ocean past a tipping point, triggering changes that could reshape marine life for decades. Scientists have identified what appears to be a major and potentially irreversible change in the Arctic Ocean. According to a new study, climate-driven sea ice loss has altered the region’s chemistry [...]
  •  

Why the 2023 El Niño broke records

The years 2023 and 2024 were the warmest on record, coinciding with a powerful Pacific climate event known as El Niño. El Niño is the warm phase of a natural climate cycle in which surface waters in the eastern Pacific are unusually warm, bringing record-breaking heatwaves in the Amazon and heavy rainfall in the southern USA. Its counterpart, La Niña, is the cool phase that brings wetter conditions to the Northern USA. 

In a typical El Niño, warm water in the eastern Pacific weakens the winds blowing westward across the tropical Pacific, known as trade winds, allowing more warm water to flow eastward – a self-reinforcing cycle that amplifies the event. However, the 2023 El Niño differed because the ocean warmed intensely, but the trade winds remained strong. Researchers from the Scripps Institution of Oceanography, led by Qihua Peng and Shang-Ping Xie, recently investigated how and why this unusual event occurred.

First, the researchers tracked how air pressures changed across the Pacific during the event using a metric calculated by NOAA, known as the Southern Oscillation Index. When the eastern Pacific warms during an El Niño, the difference in air pressure across the Pacific typically decreases. In 2023, they found that temperatures in the eastern Pacific rose to more than 3°F (2°C) above normal, yet the drop in air pressure was only about 31% as strong as they expected. They also calculated that changes in wind speed and direction could only account for about 30% of the warming. So why was the 2023 El Niño so strong?

To answer this question, the research team then looked beyond the Pacific, analyzing sea surface temperatures from NOAA satellite data. They found that the North Atlantic and Indian Oceans also experienced record-breaking heat in 2023, with temperatures in the North Atlantic exceeding 2°F (1°C) above normal – the warmest in recent history. This suggested that El Niño events can develop in response to ocean conditions worldwide, not just those in the Pacific.

Next, the team used a computer program that simulates how the atmosphere responds to ocean temperatures, called the Community Atmosphere Model, to examine how heat from other oceans affects the Pacific. They found that heat in the North Atlantic and Indian Oceans generated large columns of hot air rising over those regions. This air cooled at high altitudes and then sank over the central Pacific, strengthening a large-scale loop of rising and sinking air that drives trade winds westward. Strengthening this circulation worked against El Niño by keeping trade winds blowing westward about 30% more strongly than Pacific warming alone would have. If the trade winds remained strong, why was the eastern Pacific so warm in 2023?  

To answer this question, the researchers studied 3 consecutive La Niña years between 2020 and 2023, analyzing ocean temperature and sea level data from NOAA’s Global Ocean Data System. During those years, strengthened trade winds transported heat into the western Pacific. As the seawater got warmer, it expanded, a process known as thermal expansion. Over those 3 years, thermal expansion and constant wind created a “pile” of warm water in the western Pacific, which reached its highest level of stored heat since 1982. When the trade winds eventually relaxed as La Niña faded, this piled-up warm water surged eastward, setting the stage for the El Niño event.

To test whether this stored heat alone could drive an El Niño, the team used a computer program that models oceanic and atmospheric interactions, called a coupled general circulation model. They input observed ocean temperatures from April 1, 2023, when La Niña ended, but removed all wind changes after that date. Their model successfully reproduced 87% of the warming observed between June and December 2023, which suggested that trade winds contributed just 13%. Stored heat was carried eastward by massive underwater waves traveling along the equator. As these waves reached the Eastern Pacific, they pushed cold water deeper, allowing surface water to warm. The researchers concluded that this oceanic process drove the 2023 El Niño to develop without the usual wind-driven feedback.

The team suggested that in a warming world, large heat reservoirs in the western Pacific will likely become more common, leading to more frequent strong El Niños. However, because their analysis focused on a single event, it remains unclear how often El Niños develop through oceanic processes alone. Ultimately, their study showed that the ocean can be more than a passive partner in El Niño – it can be the driving force.

The post Why the 2023 El Niño broke records appeared first on Sciworthy.

  •  
❌