❌

Reading view

Charles Darwin argued that the roots of human morality were not separate from animal life, and the surprise is what that does to civilization — manners, conscience, and restraint become not the opposite of instinct, but instinct complicated by memory, language, and the judgment of others
The objection Darwin knew would be hardest to answer was not about bones or fossils. It was about conscience. As long as the moral sense could be held apart from animal life, the distance between human beings and other creatures remained intact. Rev. Leonard Jenyns made exactly this argument in a letter to Darwin in January 1860, writing that he could not bring himself to accept that “man’s reasoning faculties and above all his moral sense could ever have been obtained from irrational progenitors, by mere natural selection.” Take the moral sense out of nature and you preserve, as Jenyns put it, “the Divine Image that forms the insurmountable distinction between man and brutes.”

Darwin’s response, worked out across Chapters 3 and 5 of The Descent of Man (1871), was not to deny that the moral sense was special. It was to explain where it came from without appealing to anything outside the natural world. The argument is more specific, and stranger, than it is usually remembered.

The hypothesis Darwin actually made

Darwin’s central claim was a conjecture he stated plainly near the opening of Chapter 4: “any animal whatever, endowed with well-marked social instincts, the parental and filial affections being here included, would inevitably acquire a moral sense or conscience, as soon as its intellectual powers had become as well, or nearly as well developed, as in man.”

This is worth reading carefully. Darwin was not saying that morality evolved because it was useful to individuals. He was not saying that conscience is simply clever self-interest. He was saying that if you take social instincts, which already exist in many species, and combine them with sufficient intelligence, memory, and language, something like a conscience is the outcome. Not a chosen outcome. An inevitable one.

The social instincts Darwin had in mind were real biological tendencies: propensities to take pleasure in the company of others, to feel something like sympathy with them, and to perform services for them. These tendencies, he argued, are persistent. They do not disappear when they are overridden. Other impulses, hunger, desire, self-preservation, can suppress social instincts in a given moment, but the social instincts persist as a background disposition, always present, always able to reassert themselves once the pressing impulse has passed.

Where memory enters the argument

The mechanism Darwin proposed for the emergence of conscience depends on memory. An animal with strong social instincts but no memory of its past actions cannot experience the conflict between what it did and what its social nature would have preferred. It acts, it satisfies an appetite, and it moves on. The social instinct, frustrated but not forgotten, leaves no trace.

Add memory, and the calculation changes entirely. After an act that violated social instinct, that persistent social feeling reasserts itself in memory and produces a disagreeable feeling that Darwin described with precision: “He will then feel remorse, repentance, regret, or shame.” This is conscience, in his account. Not a divine faculty. Not a special human endowment. It is the collision, remembered, between what was done and what the social nature would have preferred. “Conscience looks backwards,” he wrote, “and serves as a guide for the future.”

Memory alone is not enough. Darwin added language as the mechanism by which communities build explicit shared norms, what he called “public opinion” as to how members should act for the common benefit. These norms are conventional, not instinctive. Their content varies across cultures and times. But their binding force, Darwin argued, depends on something that is instinctive: sympathy. “Our regard for the approbation and disapprobation of our fellows depends on sympathy, which forms an essential part of the social instinct, and is indeed its foundation-stone.”

The consequence of how we understand civilisation

If this argument is substantially right, a particular way of thinking about manners, conscience, and moral restraint becomes harder to hold. The traditional view treats these things as the victory of something higher over something lower: reason over appetite, culture over nature, the civilised over the animal. Darwin’s account does not work that way. Manners are not the suppression of instinct. They are one set of instincts, the social ones, as they have been elaborated and made explicit through memory, language, and the accumulated judgments of people living together.

Restraint is not the opposite of instinct. It is what instinct looks like after it has been complicated by the awareness that others are watching and will remember.

This is unsettling in a specific way. It means that the moral progress of a society cannot be understood as a movement away from biology toward something purely rational or conventional. It means that the social instincts, those old biological tendencies toward sympathy and mutual regard, are doing continuous work underneath the surface of any functioning moral culture. When those instincts weaken, when the conditions that maintain sympathy erode, there is no backup system of pure reason to fill the gap.

What Darwin acknowledged the argument could not do

Darwin was a careful enough thinker to register the difficulty his own account ran into. He wanted to say that the social instincts, including sympathy, were themselves products of natural selection. But natural selection works on individuals, and sympathy is a propensity that benefits others, sometimes at the individual’s expense. He gestures toward what would later be called group selection, the idea that tribes with more cooperative members outcompete those without, and toward something close to kin selection. He did not resolve it. The mechanisms that actually account for the evolution of altruistic behaviour were worked out in the twentieth century by W. D. Hamilton and Robert Trivers, building on foundations Darwin laid.

There is a further limitation worth naming. Darwin’s account of conscience as social-instinct-plus-memory is a psychological and evolutionary account. It describes how the moral sense likely arose and what it is composed of. It does not, by itself, tell us what we ought to do. Darwin was explicit about this. He was more cautious than Herbert Spencer and others who tried to derive ethical prescriptions directly from evolutionary facts. What evolution explains is the origin of our moral faculties, including their biases, their reach, their limitations. It is not a replacement for moral reasoning.

The reading that travels farthest

What we keep coming back to in Darwin’s account is how little of it requires the human animal to be exceptional in the ways that traditional moral philosophy assumed. The components he identifies, social instinct, memory, language, the sensitivity to others’ approval and disapproval, are not inventions unique to our species. They are elaborations, remarkable ones, of tendencies that appear in recognisable forms across many social animals.

This does not diminish the moral achievements of human cultures. It relocates them. What seems to belong to a separate, higher domain turns out to be built from materials that were already present, already working, long before anything we would call civilisation. The notebooks Darwin kept in 1838, more than thirty years before The Descent of Man was published, already contain the essential idea, written in his characteristic shorthand: “Society could not go on except for the moral sense, any more as a hive of Bees without their instincts.”

The comparison to bees was not meant as a reduction. It was meant as an observation about what holds any social life together. The moral sense, in Darwin’s reading, is not a ceiling above our animal nature. It is something that grew from within it, shaped by the fact that we live together, remember our actions, care what others think of us, and inherit the social tendencies of creatures far older than ourselves.

The post Charles Darwin argued that the roots of human morality were not separate from animal life, and the surprise is what that does to civilization — manners, conscience, and restraint become not the opposite of instinct, but instinct complicated by memory, language, and the judgment of others appeared first on Space Daily.
  •  

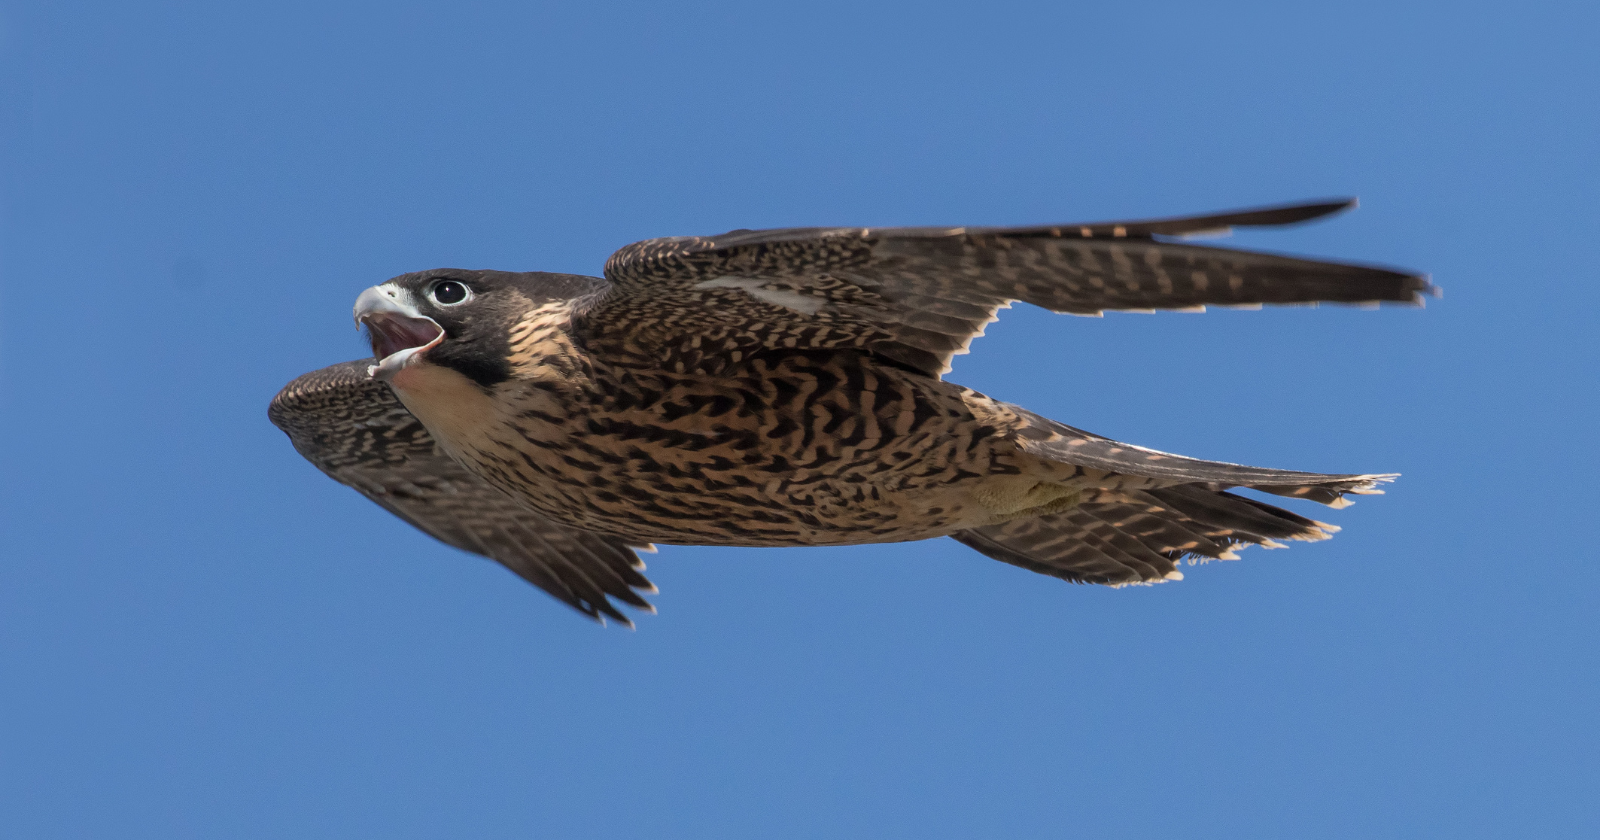
In a hunting dive, the peregrine falcon becomes the fastest animal alive, plunging at speeds of more than 320 km/h — before striking its prey in mid-air, a blow that can kill on impact

A peregrine falcon in a hunting dive reaches a terminal velocity of about 320 km/h (200 mph), which makes it the fastest animal alive.

That figure is not a guess from a single enthusiast with a stopwatch. A peer-reviewed aerodynamics study notes that peregrines exceed 320 km/h in a full stoop, though its own filmed dives took place past a 60 m dam — short enough that the falcons never reached terminal velocity, but long enough to capture the changing wing shape on high-speed cameras. The record claim sits higher still: a captive falcon named Frightful was reportedly clocked at 389 km/h (242 mph) in 1999 after release from a light aircraft.

For comparison, the Guinness World for the fastest speed in an Formula 1 car is 372.56 km/h (231.51mph). These cars need a long straight and lots of horsepower. The falcon gets there with body mass, gravity, and a folded silhouette, then has to land a precise strike at the end of it. The car only has to keep going straight.

The dive has a name: the stoop. The record speed belongs only to the dive, and the dive depends on shape. Robin Mills, a biologist who has modelled the manoeuvre, describes it this way: “Within the blink of an eye, it dives down – first flapping forcefully and then folding its wings to decrease drag. It basically appears to drop out of the sky.” All of this is in service of the strike at the bottom — the stoop is how the falcon turns altitude into a killing blow.

The peregrine delivers the blow with its feet, used as a blunt weapon rather than as the gripping talons most people picture. The popular image of a clenched fist is roughly right but not exact. The Birds of Stanford essays note that “High-speed cinematographic studies, however, have shown that they strike their prey from above with all four toes fully extended.” The foot may be open at the instant of contact, not closed, though the strike itself remains a percussive hit rather than a grab.

The impact does much of the killing. Peregrines and their close relatives carry only modest talons, so they cannot rely on the crushing grip that some larger raptors use. Instead, as Fowler and colleagues describe in their study of raptor anatomy, “For immobilisation, Falconini rely more strongly on strike impact and breaking the necks of their prey, having evolved a ‘tooth’ on the beak to aid in doing so.” The dive does the work, and the notched beak finishes what the blow starts.

The speed record hides something. A car at 320 km/h is being asked to follow a known line on a known surface. The falcon is being asked to intercept a small, frightened, swerving target in open air, and to do it while its own anatomy works against it. The peregrine’s sharpest vision sits off to the side of its eye, not straight ahead. Tucker and colleagues put the problem plainly: “When diving at prey straight ahead from great distances at high speeds, a peregrine has a conflict between vision and aerodynamics.”

To see the prey clearly, the bird “must turn its head approximately 40 ° to one side” to fix the target on the most acute part of its eye, but a turned head adds drag and slows the dive. Wild peregrines solve this not by turning the head but by curving the whole approach. Tucker’s team observed birds tracking distant prey along a curved path resembling a logarithmic spiral, which keeps the target pinned on that sideways high-acuity vision while the head stays streamlined. It is the aerial equivalent of taking the racing line rather than the shortest one.

The precision goes deeper than the path. A 2018 simulation by Mills and colleagues at Groningen and Oxford modelled the attack and found the diving falcon steers using the same proportional-navigation logic that guides missiles. The same work is careful about what high speed actually buys. The simulations suggest that when prey moves erratically, high-altitude stoops raise catch success compared with low-altitude attacks, but only if the falcon’s guidance law is finely tuned and its vision and control are precise. Speed without that control is just a fast miss. This is a modelling result rather than a field measurement, so it is best read as a clue to how the real birds manage it, not the last word.

The body comes equipped for the rest. Bony tubercles inside the nostrils are thought to limit the air rushing in at speed, and a translucent third eyelid sweeps across the eye to protect it while still letting the falcon see, a built-in visor for a pilot who cannot afford to blink at the wrong moment.

The post In a hunting dive, the peregrine falcon becomes the fastest animal alive, plunging at speeds of more than 320 km/h — before striking its prey in mid-air, a blow that can kill on impact appeared first on Space Daily.

  •  

Whoever finds the Voyager Golden Record will know exactly how long it has been drifting, because the scientists who built it pressed a small sample of uranium into the cover — a built-in clock that keeps time for roughly a billion years.

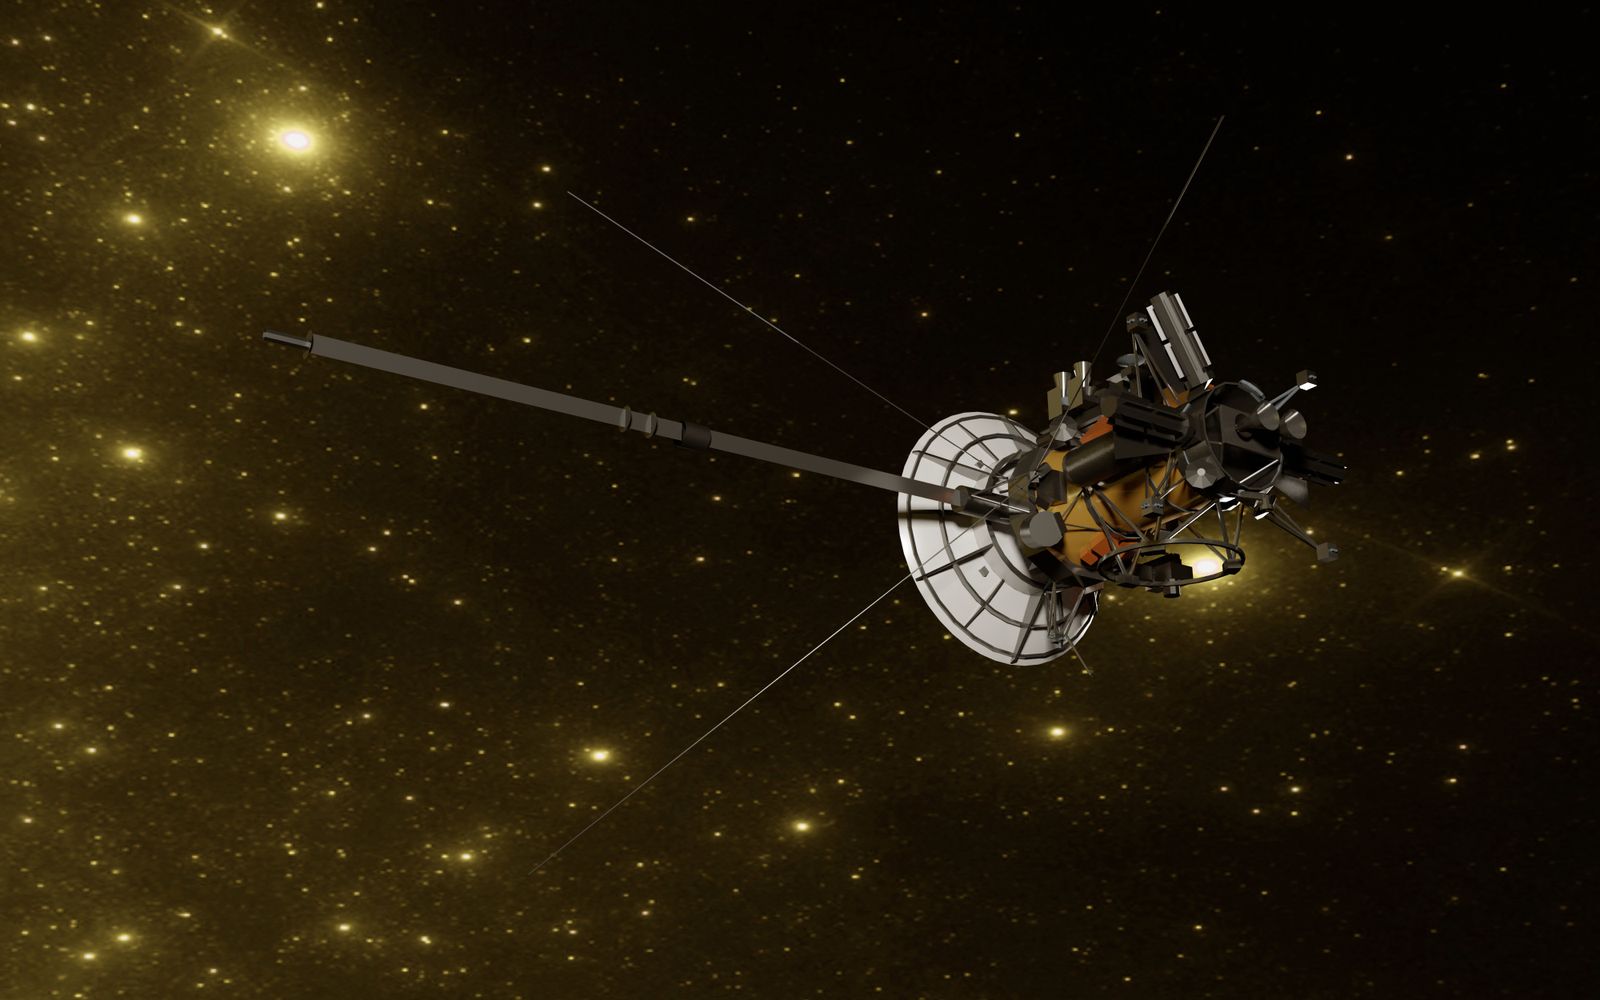
A space probe drifting through a field of stars.

The two Voyager spacecraft, launched in 1977, each carry a gold-plated copper phonograph record holding sounds and images of Earth. On the aluminium cover of each record is a detail that gets less attention than the music: a small sample of uranium, put there so that whoever finds it can work out how long it has been travelling.

The claim that it functions as a built-in clock is true.

What needs correcting is the timescale, which is far longer than the figure usually attached to it.

How the clock works

The cover carries an ultra-pure source of uranium-238, electroplated onto a patch of the surface about two centimetres across rather than pressed in, with a radioactivity NASA puts at about 0.00026 microcuries. Uranium-238 is radioactive, and it decays at a fixed, well-measured rate. Half of any quantity of it turns into other elements over about 4.51 billion years, a span known as its half-life.

That steady decay is what makes it a clock. A finder who measures how much uranium-238 is left, against how much of the decay product has built up beside it, can calculate how long the process has been running. That figure is the time since the sample was placed on the spacecraft, which is to say the age of the record.

It is an elegant choice, because it needs no shared language and no working knowledge of human history. Any civilisation that understands radioactive decay arrives at the same number.

Why “a billion years” undersells it

The figure commonly quoted for the record is roughly a billion years, and it is worth being clear about what that number actually describes.

A billion years is the rough estimate for how long the physical disc should survive in the near-vacuum of interstellar space, where there is little to erode it. The uranium clock is a separate matter. With a half-life of about 4.51 billion years, the sample remains readable as a clock for far longer than the disc is expected to last, and in principle for several billion years. The limit on dating the record is not the uranium running out. It is the disc itself wearing away.

So the clock does not keep time for “roughly a billion years”. It keeps time for as long as there is measurable uranium left, which is a much longer window than the object it is attached to will physically endure.

It is not the only clock on the cover

The uranium was never meant to be trusted on its own. The same cover carries a second, independent way of fixing the date, in the form of the pulsar map.

That diagram, the starburst of lines also etched on the earlier Pioneer plaques, shows the position of the Sun relative to 14 pulsars, rapidly spinning stars that flash with very regular periods. Those periods are encoded on the cover in binary. Because pulsars slow down slightly and predictably over time, a finder could compare the periods as recorded against the periods as measured, and read the gap as elapsed time.

Two clocks, built to check each other rather than to be taken on faith. If the uranium and the pulsars disagreed, that disagreement would itself be informative.

The catch is being found at all

For all the care in the dating, the harder problem is the one the record cannot solve, which is reaching anyone.

The Voyagers are not aimed at any particular star, and they are in no hurry. Voyager 1 will not pass within a couple of light-years of another star for roughly 40,000 years, and even then “pass” means an enormous distance rather than an encounter. The odds that either record is ever recovered and read are, on any honest accounting, very small.

That is the part the uranium clock quietly acknowledges. The people who built it were not betting on a finder. They engineered a way to answer a question that may never be asked, and built it to stay accurate long after the civilisation that made it is gone. The clock will keep good time whether or not anyone is ever there to read it.

The post Whoever finds the Voyager Golden Record will know exactly how long it has been drifting, because the scientists who built it pressed a small sample of uranium into the cover — a built-in clock that keeps time for roughly a billion years. appeared first on Space Daily.

  •  

New HIV infections fell by 40 percent between 2010 and 2024 and the number of people requiring treatment for neglected tropical diseases dropped by 36 percent in the same period, according to the World Health Statistics 2026 report — gains now at risk as the funding that built them comes under pressure

The World Health Statistics 2026 report, published by the World Health Organization on 13 May, carries a paradox on almost every page. The gains it documents are genuine. A 40 percent reduction in new HIV infections between 2010 and 2024. A 36 percent drop in the number of people requiring interventions for neglected tropical diseases over the same period. The WHO’s African Region achieved faster reductions in new HIV infections than the global average — down 70 percent since 2010 compared with 40 percent globally — and also outpaced the global rate on tuberculosis. These are not small movements. They represent millions of lives in different conditions than they would otherwise have been.

The report also states that the world is “off track to achieve any of the health-related Sustainable Development Goals by 2030,” that progress in many areas has slowed, and that in some it has reversed. The HIV and NTD figures are cited as among the bright points. But the infrastructure that produced them, the funding systems, the programmes, and the health systems they flow through, is now under significant and specific pressure.

What the HIV figure represents

A 40 percent reduction in new infections across fourteen years is a result of sustained investment in prevention, testing, antiretroviral treatment access, and targeted behavioural programmes. No single intervention produced it. The figure reflects the cumulative effect of programmes that operated at scale, consistently, over a long period.

The United States has historically been the largest single contributor to international HIV funding, providing around 73 percent of all donor funding for HIV programmes in low- and middle-income countries in 2023, primarily through the President’s Emergency Plan for AIDS Relief, known as PEPFAR. Early in 2025, USAID grant holders were instructed to stop work. Testing counsellors and clinic staff were laid off in the same period. Studies from Mozambique and South Africa documented immediate drops in HIV testing and new treatment initiations in the first quarter of 2025. Modelling work published by UNAIDS in 2025 projected that if US-supported programmes were halted without equivalent replacement, there could be more than 6 million additional new HIV infections by 2030 — potentially returning infection levels to those not seen since the early 2000s.

Neglected tropical diseases and what the 36% figure includes

Neglected tropical diseases, or NTDs, are a group of conditions, including lymphatic filariasis, trachoma, schistosomiasis, and several others, that predominantly affect people living in poverty in tropical and subtropical regions. The 36 percent reduction in the number of people requiring interventions between 2010 and 2024 reflects a combination of mass drug administration programmes, improved sanitation, and sustained public health campaigns that, like the HIV work, required consistent funding and logistical infrastructure over many years.

The gains in this area are concentrated in specific regions and specific diseases. They are not uniformly distributed. And because NTD programmes depend on donated medicines, coordinated delivery, and community health infrastructure that is itself dependent on external funding, they are vulnerable to the same financing pressures that now affect HIV programmes.

Where the broader picture is worse

The HIV and NTD improvements are among the few areas where the World Health Statistics 2026 report can present an unambiguously positive trajectory. Much of the rest of the data is more difficult.

Progress toward universal health coverage has slowed sharply. The WHO’s service coverage index rose only from 68 to 71 between 2015 and 2023. One quarter of the global population faced financial hardship from health costs. Around 1.6 billion people were living in or pushed into poverty from out-of-pocket health spending in 2022. Malaria incidence increased by 8.5 percent since 2015. Anaemia affects 30.7 percent of women of reproductive age, with no improvement over the past decade. Childhood vaccination coverage remains below target.

The COVID-19 pandemic’s shadow runs through the report. Between 2020 and 2023, it is linked to an estimated 22.1 million excess deaths, including indirect deaths. That figure is more than three times the number of officially reported COVID-19 deaths. The WHO states that this reversed a decade of gains in life expectancy, and that recovery remains incomplete and uneven.

The data gap underneath all of this

There is a further problem the report names directly. As of the end of 2025, only 18 percent of countries were reporting mortality data to WHO within one year. Nearly one third have never reported cause-of-death data. Of the estimated 61 million deaths globally in 2023, only around one third were reported with cause-of-death information, and roughly one fifth had usable coded data.

This matters for how to read all the figures above, including the gains. The 40 percent reduction in HIV infections and the 36 percent drop in NTD burden are derived from the best available data. Where data collection is poor, those estimates carry more uncertainty. The WHO notes this not to undercut its own figures but because the data gap affects the ability to monitor whether progress is holding, slipping, or reversing in real time. Progress built on incomplete reporting is harder to protect.

What the WHO is asking for

Dr Tedros Adhanom Ghebreyesus, the WHO Director-General, said in the report’s accompanying statement that “investing in stronger, more equitable health systems, including resilient health data systems is essential to target action, close gaps and ensure accountability.” Dr Yukiko Nakatani, the WHO Assistant Director-General for Health Systems, named “a worsening health financing crisis” as one of the conditions requiring urgent response, alongside rising environmental risks and ongoing health emergencies.

The language is institutional and measured. The situation it describes is not. A decade of measurable progress in two of the most intractable areas of global health is now contingent on decisions about funding that are being made in contexts entirely external to the public health systems that produced the gains. The WHO’s report is, among other things, a record of what was built and a description of how fragile the conditions for maintaining it have become.

The post New HIV infections fell by 40 percent between 2010 and 2024 and the number of people requiring treatment for neglected tropical diseases dropped by 36 percent in the same period, according to the World Health Statistics 2026 report — gains now at risk as the funding that built them comes under pressure appeared first on Space Daily.

  •  

By 2035, the global space economy is predicted to reach roughly $1.8 trillion in annual value — up from approximately $630 billion in 2024 — driven by satellite mega-constellations, Earth observation services, commercial space stations, and the early stages of lunar resource extraction, in a quiet industrial revolution that many economists believe will exceed the speed of every previous economic transition in modern history

SpaceX Starship launch

The thing that has happened to the global space economy over the past 25 years is the kind of phenomenon that is easier to see in retrospect than to recognise while it is occurring. In 2000, the entire global space industry generated approximately $130 billion in annual revenue, almost all of it from government programmes and satellite communications. By 2023, the figure had reached approximately $630 billion. By 2035, on the most widely-cited forecast available, it is projected to reach $1.8 trillion — making space comparable in economic scale to the current global semiconductor industry, and substantially larger than the global pharmaceutical industry. The growth is occurring above the cloud line, mostly out of sight of the populations whose lives are being increasingly shaped by it, and at a pace that exceeds essentially any other major economic sector currently being tracked by long-range forecasters.

According to the World Economic Forum’s April 2024 announcement of the $1.8 Trillion Opportunity report developed with McKinsey & Company, the central finding of the analysis is that the bulk of the space economy’s growth between now and 2035 will not come from rockets, exploration missions, or moonwalks. It will come from terrestrial industries that have begun to depend, in fundamental but mostly invisible ways, on satellite-enabled services. Earth observation. Satellite communications. Positioning, navigation, and timing services. Weather forecasting. Supply-chain tracking. These are the categories projected to drive the substantial majority of the new value, and the industries most affected are not aerospace companies but supply-chain and transportation firms, food and beverage producers, retail chains, insurance companies, and the digital communications sector — none of which traditionally classified themselves as space companies, and most of which will not be aware of how dependent their operations have become on orbital infrastructure until something disrupts it.

The two halves of the space economy

Per McKinsey’s overview of the space economy structure, the field can be usefully divided into two distinct halves. The first is what McKinsey calls “the backbone” — the satellites, launchers, ground stations, and physical infrastructure that constitute the traditional space industry. This category includes SpaceX, Blue Origin, Rocket Lab, the various government space agencies, satellite manufacturers, and the companies that build and operate the orbital and ground hardware. The second half is “the reach” — the much larger ecosystem of applications, services, and businesses that depend on the backbone to deliver value to end users on Earth. Ride-hailing apps that rely on GPS satellites. Agricultural operations that use Earth-observation imagery for crop management. Logistics companies that track shipments via satellite. Climate monitoring services. Financial-services firms that use satellite-derived timing signals for high-frequency trading.

The growth projection puts most of the new value in the reach rather than the backbone. The McKinsey-WEF analysis specifies that traditional hardware and service providers will see their share of the total space economy slowly decrease over the next decade, while the reach grows substantially faster than the backbone. The implication is that the space industry of 2035 will look substantially different from the space industry of today — not because the rockets and satellites will be radically different, but because the population of companies and customers depending on them will have expanded across nearly every major sector of the global economy.

What is real versus what is aspirational

The drivers that have attracted the most popular attention — asteroid mining, lunar resource extraction, helium-3 fusion fuel, space-based manufacturing, orbital tourism — are largely not the drivers of the $1.8 trillion projection. They are aspirational additions to the space economy that may or may not materialise in the projected timeframe. Asteroid mining, in particular, has been promoted by various ventures over the past decade — Planetary Resources, Deep Space Industries, AstroForge — but no commercial asteroid-derived material has yet been brought to market, and the engineering and financial obstacles remain substantial. Lunar resource extraction is closer to operational reality, with NASA’s Artemis programme planning to demonstrate water-ice extraction from permanently shadowed polar craters in the 2030s, but commercial-scale lunar mining is unlikely to contribute meaningfully to the global economy before 2040 at the earliest.

What is real and immediately driving the growth is mostly less glamorous. Satellite mega-constellations are real — SpaceX’s Starlink alone has launched approximately 7,000 satellites and is on track for tens of thousands more. Amazon’s Project Kuiper, OneWeb, and several Chinese constellations are also deploying at scale. The total number of operational satellites in orbit has grown from approximately 2,000 in 2018 to more than 10,000 currently, and is projected to exceed 100,000 by 2030. Earth-observation services have matured to the point where commercial satellite imagery is now used routinely by agricultural insurance providers, commodity traders, climate scientists, and intelligence agencies. Commercial space stations, designed to replace the International Space Station when it retires in 2030, are under active development by Axiom Space, Voyager Space (Starlab), and the Blue Origin / Sierra Space joint venture (Orbital Reef). These are not science fiction. They are construction projects with timelines and financing.

What this means for the next decade

As reported by a December 2025 World Economic Forum analysis of developing economies in the space sector, the geographic distribution of space-economy growth is also shifting substantially. For most of the post-Apollo era, the global space sector was dominated by the United States and Russia, with significant activity in Europe and Japan. The picture in 2025 is more diverse. India successfully landed Chandrayaan-3 on the Moon’s south pole in 2023 — the first country to reach the south pole — and operates a substantial domestic launch industry. China’s space programme has approximate parity with NASA on several metrics and is targeting a crewed lunar landing by 2030. The United Arab Emirates has a Mars orbiter and is participating in lunar missions. Brazil, Nigeria, Mexico, and several Southeast Asian countries are building domestic satellite capabilities. The space economy is becoming, for the first time, a multipolar industry in which substantial value is generated outside the historical aerospace powers.

The structural risks to the projection are real and worth noting. The continued accumulation of orbital debris raises the long-term possibility of the Kessler syndrome — a cascading collision sequence that could render certain orbital altitudes unusable. The regulatory framework for space activity remains fragmented and inadequate to the scale of commercial activity now underway. Geopolitical tensions between the major space powers could produce export controls, technology restrictions, or worse. As covered in a 2024 Innovator analysis of the WEF/McKinsey findings, the $1.8 trillion figure is itself a base-case projection; the report’s upside scenario reaches $2.3 trillion, and the downside scenarios — in which orbital congestion, regulatory failure, or geopolitical disruption substantially slow the growth trajectory — produce significantly lower numbers. The most likely outcome is that the actual 2035 space economy lands somewhere in the broad range between these scenarios. The basic direction, however, is no longer seriously contested. Space is now an industrial sector at the scale of pharmaceuticals or semiconductors, growing faster than either, and is no longer adequately described as a frontier.

The post By 2035, the global space economy is predicted to reach roughly $1.8 trillion in annual value — up from approximately $630 billion in 2024 — driven by satellite mega-constellations, Earth observation services, commercial space stations, and the early stages of lunar resource extraction, in a quiet industrial revolution that many economists believe will exceed the speed of every previous economic transition in modern history appeared first on Space Daily.

  •  

The blue color of the sky is not a property of the air itself — air is colorless, and a glass of it would look exactly like a glass of nothing — and the blue you see overhead is sunlight being scattered by molecules of nitrogen and oxygen, which deflect short blue wavelengths much more strongly than long red ones, in the same physics that makes the Sun appear yellow and a sunset appear red

The question of why the sky is blue is one of the older questions in the history of human curiosity. Aristotle attempted an answer in the fourth century BCE. Newton, in the seventeenth century, suggested it had something to do with the reflection of light from the ocean. Ancient civilisations across multiple cultures proposed mystical, religious, and aesthetic explanations of varying poetic merit and zero physical accuracy. The actual answer turned out to be substantially weirder than any of these traditional accounts, and was not fully worked out until the late nineteenth and early twentieth centuries — when the British physicist John William Strutt, the third Baron Rayleigh, derived the mathematical formula that bears his name, and Albert Einstein, in 1911, supplied the final theoretical underpinning. The blue of the sky, it turns out, is not the colour of air. Air, in any small quantity, has no colour. The blue is the colour of light being bent by the molecules of air, in a particular pattern that depends on wavelength, and that produces the specific shade of blue that humans see overhead on any clear day.

According to a reference summary of the physics maintained by the mathematician John Baez at UC Riverside, the first crucial step toward the modern understanding was taken by John Tyndall in 1859. Tyndall demonstrated, experimentally, that when light passes through a clear liquid containing small particles in suspension — a tank of water with a little milk mixed in, for example — the shorter blue wavelengths are scattered more strongly than the longer red ones. From the side of the tank, the beam appears bluish. Looking through the long axis of the tank, the transmitted light appears reddish. The geometry, Tyndall recognised, was identical to the geometry of the daytime sky versus the sunset. Lord Rayleigh derived the precise mathematical relationship governing the scattering in 1871, showing that the intensity of scattered light is inversely proportional to the fourth power of the wavelength. Both Tyndall and Rayleigh, however, initially attributed the sky’s blue to small particles of dust and droplets of water vapour suspended in the atmosphere, rather than to the gas molecules themselves. Subsequent scientists realised that this dust-and-water-vapour framework predicted more variation of sky colour with humidity and haze conditions than was actually observed, and that the molecules of nitrogen and oxygen in the air must be sufficient scatterers on their own. The case was definitively settled by Albert Einstein in 1911, who calculated the detailed formula for the scattering of light by individual molecules and showed that it agreed precisely with observation.

What Rayleigh scattering actually does

The Rayleigh scattering formula, which has been a fixture of undergraduate physics curricula for more than a century, states that the intensity of scattered light is inversely proportional to the fourth power of the wavelength. The practical implication is straightforward but striking. Blue light, with a wavelength of approximately 450 nanometres, is scattered roughly 5.5 times more strongly than red light, with a wavelength of approximately 700 nanometres. As sunlight enters the upper atmosphere and travels downward toward an observer on the ground, every gas molecule it encounters scatters a small fraction of the incoming light in random directions — but the fraction is heavily weighted toward the blue end of the spectrum. By the time the light reaches the observer, the direct beam from the Sun has been depleted of some of its blue content, and the indirect light arriving from all other directions in the sky is dominated by the scattered blue.

Per the UK Met Office’s reference explanation of the phenomenon, the human eye perceives this combination as a uniformly blue sky overhead, even though the underlying sunlight is white and the underlying air is colourless. The blue is, in a literal sense, a property of the geometry — of the angle between the observer, the Sun, and the column of atmosphere through which the light has travelled. Looking straight up on a clear day, the observer sees blue because they are looking through a column of atmosphere whose molecules have been preferentially scattering blue light toward them all day. Looking directly at the Sun (which one should not do), the observer sees the residual yellowish-white of sunlight that has been partially depleted of its blue. Looking at the Sun near the horizon at sunset, the observer sees red — because at that geometry, the sunlight has had to travel through approximately 38 times more atmosphere than it would at noon, and almost all of the blue has been scattered out before the light reaches the eye.

Why the sky is not violet

A logical question, given the wavelength dependence, is why the sky is not violet rather than blue — since violet light, with an even shorter wavelength than blue, should be scattered even more strongly. As reported by a physics-questions page maintained by Christopher Baird at West Texas A&M University, three factors combine to produce the observed blue rather than violet. First, the Sun emits less violet light than blue light to begin with — solar emission peaks closer to the green-yellow part of the spectrum and tapers off toward both red and violet. Second, the human eye is substantially less sensitive to violet than to blue; the retina’s cone cells are tuned to a colour space in which blue is more salient than violet. Third, some violet light is absorbed by molecules in the upper atmosphere before it can be scattered downward. The combined effect is that the sky appears blue rather than violet, even though violet is being scattered slightly more strongly than blue.

The same physics also explains a related puzzle: the actual colour of the Sun itself. From space, the Sun is essentially white — its emission spectrum, integrated across all visible wavelengths, produces a colour that the human visual system reads as white with a very slight bluish tint. From the surface of Earth, the Sun appears yellowish-white because some of the blue light has been scattered out of the direct beam during its passage through the atmosphere. The yellow colour of the Sun, in other words, is not a property of the Sun. It is a property of looking at the Sun through a Rayleigh-scattering medium. From space, astronauts see a white Sun.

The clouds and the other planets

As discussed in a 2024 explainer at When Notes Fly on the history and physics of sky colour, the absence of Rayleigh-style colour selectivity also explains why clouds appear white. Clouds are made of water droplets and ice crystals that are substantially larger than the wavelength of visible light — typically tens to hundreds of micrometres across, compared to the ~0.3-nanometre size of an air molecule and the ~500-nanometre wavelength of visible light. At those sizes, the scattering is governed by a different formula, called Mie scattering, which does not strongly favour any particular wavelength. The result is that clouds scatter all wavelengths of light roughly equally, which the eye perceives as white.

The Rayleigh-scattering explanation also predicts that the sky on other planets will have different colours, depending on what their atmospheres are made of and how thick they are. Mars, with its thin carbon-dioxide atmosphere and substantial dust load, has a brownish-red sky during the day and a blue tint near the Sun at sunset — essentially the reverse of Earth, where the everyday sky is blue and the sunset is red. Titan, Saturn’s largest moon, has a thick orange haze of hydrocarbons that produces an orange-yellow sky. Venus, with its dense and chemically complex atmosphere, has a yellowish-orange sky. The blue overhead on Earth is, in cosmic terms, a specific property of a specific combination of atmospheric chemistry, atmospheric depth, and human visual physiology — produced by the interaction of light with molecules so small that, taken individually, they are invisible, and that collectively produce the colour everyone above the cloud line has been looking at for the entire history of the species.

The post The blue color of the sky is not a property of the air itself — air is colorless, and a glass of it would look exactly like a glass of nothing — and the blue you see overhead is sunlight being scattered by molecules of nitrogen and oxygen, which deflect short blue wavelengths much more strongly than long red ones, in the same physics that makes the Sun appear yellow and a sunset appear red appeared first on Space Daily.

  •  

In December 1938 a museum curator sifting through a fisherman’s catch in a South African port lifted out a heavy blue fish that science had known only from fossils and presumed extinct since the age of the dinosaurs

Freshly caught fish entangled in a fishing net on a boat.

On 22 December 1938, Marjorie Courtenay-Latimer took a taxi to the docks at East London, a port on South Africa’s east coast, to look through a trawler’s discarded catch. In the pile she found a heavy, steel-blue fish about 1.5 metres long, with thick fins that moved more like limbs than fins. She did not know what it was. She was certain it mattered, and she was right: the fish belonged to a group science had known only from fossils and had assumed died out around the time of the dinosaurs.

The fish was a coelacanth. Its discovery is one of the most quoted moments in twentieth-century natural history, and like most quoted moments, the popular version has picked up some embellishments worth stripping back.

The fish in the taxi

Courtenay-Latimer was the curator of the East London Museum, a job she had taken in 1931 with no formal training in zoology. She had asked local fishermen to tell her when something unusual turned up in their nets. On that December morning a trawler operator phoned to say he had a deck full of rubbish fish, and she went down to look.

The blue specimen stood out at once. By the standard account it was about five feet long, with four limb-like fins and a strange, stubby extra lobe on its tail. She had it taken back to the museum and tried to reach the one person she thought could identify it, the ichthyologist J.L.B. Smith, in Grahamstown.

She could not get hold of him. Smith was away over the holidays, and as the days passed the fish began to spoil. With no cold storage able to take something that size, she was forced to have it mounted by a taxidermist, and its internal organs were thrown out. That detail matters, because it meant the first coelacanth known to science was reduced to a skin and a skeleton before anyone could study its anatomy.

What Smith recognised

When Smith finally saw Courtenay-Latimer’s drawing in early January, he suspected what it was almost immediately, and the suspicion alarmed him. Coelacanths were supposed to be extinct. They appear in the fossil record going back hundreds of millions of years and then vanish from it around 66 million years ago, at the end of the Cretaceous, in the same broad window that closed the age of the non-bird dinosaurs.

Smith confirmed the identification and published it in the journal Nature in 1939, under the plain title “A living fish of Mesozoic type”. He named the animal Latimeria chalumnae, the genus after Courtenay-Latimer and the species after the Chalumna River, near where the trawler had been working.

A lineage assumed gone for tens of millions of years had turned up in a fishing net.

That is the part of the story that survives intact.

The “living fossil” that keeps being oversold

The phrase that attached itself to the coelacanth, “living fossil”, is where the retellings tend to overreach.

The animal Courtenay-Latimer found is not the fish in the Cretaceous rocks. Coelacanths are an old group, with a fossil history stretching back roughly 400 million years, but the living genus is its own thing, and fossil coelacanths were far more varied in shape and habitat than the two surviving species. The body plan has been conservative, which is not the same as frozen.

More recent work makes the point sharper. When researchers sequenced the coelacanth genome, reported in Nature in 2013, they found a genome that has kept changing rather than one stalled since the Mesozoic. The fish looks ancient. It has not stopped evolving.

And not the fish that walked onto land

A second common claim is that the coelacanth is the creature that crawled out of the water, a snapshot of our own first step onto land.

It is not.

Coelacanths are lobe-finned fish, and that group is related to the ancestors of four-limbed land animals, which is interesting in itself. But the living coelacanth is a cousin on that family tree, not a direct ancestor, and divers who have watched them in deep water have never seen them walk on those leg-like fins. The fins are used for fine, controlled movement through the water, not for clambering.

What the discovery actually showed

Strip away the embellishments and the 1938 find still carries a real lesson, and it is a lesson about evidence rather than about wonder.

“Extinct” had been read straight off the fossil record. The coelacanth’s absence from rocks younger than the Cretaceous was taken to mean the group was gone, when it meant only that none had been found and preserved. A deep-water animal living off remote coastlines can leave almost no trace and still be there. Absence of evidence had been mistaken for evidence of absence.

It took until 1952, and a second specimen from the Comoro Islands, before anyone could examine a coelacanth’s soft anatomy, the organs that had been thrown out in East London fourteen years earlier. Courtenay-Latimer never made another discovery on that scale, and did not need to. She had looked at a pile of rubbish fish and recognised that one of them did not belong, which is the part of the work no amount of expertise can do for you.

The post In December 1938 a museum curator sifting through a fisherman’s catch in a South African port lifted out a heavy blue fish that science had known only from fossils and presumed extinct since the age of the dinosaurs appeared first on Space Daily.

  •  

The environmental impact of watching one hour of video on Netflix is approximately 36 grams of carbon dioxide, roughly equivalent to driving a car for 150 metres, in a figure substantially smaller than the popular framing has claimed and one that demonstrates that the actual environmental burden of streaming comes not from the data centres people imagine but from the screens they watch on

The popular framing of streaming’s environmental cost has, for much of the past five years, treated digital entertainment as a quiet ecological catastrophe. Articles in the New York Post, the CBC, Yahoo, Deutsche Welle, Gizmodo, the BBC, and dozens of other outlets have repeated a version of the same claim, that watching 30 minutes of Netflix is the carbon equivalent of driving four miles, or that the global streaming industry produces emissions comparable to the entire country of France. The framing is intuitive. It maps onto a wider cultural sense that all internet activity has some hidden but enormous environmental cost, and that the cloud is, in fact, a coal-fired power station with a friendlier name.

The framing is also, on the strongest current reading of the peer-reviewed evidence, wrong by approximately a factor of 90.

The actual peer-reviewed figure for the carbon footprint of one hour of streaming video, in 2019 conditions on the global average electricity mix, is approximately 36 grams of carbon dioxide equivalent. The figure is approximately the same as the emissions from boiling a kettle for six minutes, or driving an average passenger car for approximately 150 metres, or running an older incandescent light bulb for approximately two hours. The cumulative impact of streaming at global scale is genuinely significant, but the per-hour impact is modest, and the actual environmental cost falls in a very different place from where the popular framing has located it.

How the popular framing got so wrong

The widely repeated claim that streaming half an hour of Netflix produces 1.6 kilograms of carbon dioxide originated in a July 2019 report by the Shift Project, a French climate think tank. The report estimated that streaming video produced approximately 300 million tonnes of CO2 in 2018, equivalent to the annual emissions of France, and that streaming one hour produced approximately 3.2 kilograms of carbon dioxide. The figure was picked up across global media and became the foundation of the popular framing.

The figure was also based on a bit-to-byte conversion error. In June 2020, the Shift Project published a follow-up article acknowledging that the original 2019 estimate had overstated streaming’s bandwidth requirements by a factor of eight, and revised the 3.2 kg per hour figure downward to approximately 0.4 kg per hour. The correction received substantially less media coverage than the original error, and the 3.2 kg figure has continued to circulate in popular reporting on streaming’s environmental impact for years after its retraction.

The Shift Project’s corrected 0.4 kg per hour estimate is itself approximately ten times higher than the central peer-reviewed estimate from independent researchers. George Kamiya, a digital energy analyst at the International Energy Agency, published a detailed methodological analysis in December 2020 that identified the remaining assumptions in the Shift Project estimate that produced the residual overestimate. The Shift Project had assumed substantially higher data transmission energy intensity than the available evidence supported, had double-counted certain infrastructure costs, and had used outdated electricity grid carbon intensity figures that did not reflect the rapid decarbonisation of major streaming markets since 2015.

The IEA central estimate, drawing on the peer-reviewed literature and updated infrastructure efficiency data, places the actual figure at approximately 36 grams of carbon dioxide per hour of streaming.

The Shehabi peer-reviewed analysis

The foundational peer-reviewed study of streaming’s environmental cost was published in 2014 by Arman Shehabi of Lawrence Berkeley National Laboratory, with Ben Walker and Eric Masanet of Northwestern University, in Environmental Research Letters. The team applied a full life-cycle assessment methodology to streaming video viewing in the United States in 2011, accounting for energy use and greenhouse gas emissions across data centres, network infrastructure, end-user devices, and the embodied emissions of manufacturing and disposing of all of the above.

The Shehabi team’s central estimate was that one hour of US streaming in 2011 produced approximately 420 grams of carbon dioxide equivalent on a full lifecycle basis, and approximately 360 grams when only operational emissions were counted. The figure was substantially higher than the more recent IEA estimate of 36 grams, but the difference reflects both the dramatic improvement in data centre and network efficiency over the past decade and the substantially different electricity grid mix in 2011 compared with 2019.

The Shehabi team’s most important finding, on the peer-reviewed evidence, was not the headline carbon figure but the breakdown of where the emissions actually came from. Their analysis showed that more than half of streaming’s energy use, in 2011 US conditions, came from network data transmission rather than from data centres, and that end-user device energy was the second-largest contributor. The data centres that store and transmit the content, which the popular framing has consistently treated as the central environmental cost of streaming, were actually a relatively modest contributor to the total footprint.

The Shehabi team also noted that streaming video was already more energy-efficient than the alternative the popular framing was implicitly comparing it against, which was the manufacture, transportation, and physical viewing of DVDs. Streaming used less primary energy than DVD viewing in nearly every realistic comparison. The exception was the case in which the consumer walked or biked to a video rental store, which the team acknowledged was the most environmentally favourable form of DVD viewing but also the rarest in practice.

Where the emissions actually come from

The most striking finding in the recent peer-reviewed evidence on streaming’s environmental cost concerns the distribution of the footprint across the system. Netflix’s own ESG reporting, drawing on detailed lifecycle analyses commissioned from the Carbon Trust and independent auditors, has consistently found that approximately 89 per cent of the carbon footprint of watching Netflix comes from end-user devices, not from data centres or network infrastructure.

The breakdown is substantial. Television screens and other viewing devices account for approximately 46 per cent of total streaming emissions. Home networking equipment, including modems, routers, and Wi-Fi devices, accounts for approximately 38 per cent. Data centres, the part of the system that the popular framing has treated as the central environmental cost of streaming, account for approximately 4 per cent. Network infrastructure between the data centre and the viewer accounts for approximately 7 per cent.

The implication is that the environmental cost of streaming is concentrated in objects the viewer already owns, that the viewer would own and operate regardless of whether they streamed video or not, and that the marginal environmental cost of an additional hour of streaming, given that the screen and the router are already on, is genuinely small. The viewer who replaces a 65-inch plasma television with a modern LED screen of the same size reduces the per-hour environmental cost of their streaming by more than the data centres at Netflix could reduce it through any infrastructure upgrade.

The popular framing has been arguing about the wrong part of the system.

The cumulative scale

The per-hour figures, while modest, accumulate at global scale into something substantial. Streaming video now accounts for approximately 80 per cent of all internet traffic. Netflix’s total annual emissions reached approximately 5.17 million tonnes of carbon dioxide equivalent in 2024, according to the company’s published ESG reporting. The global streaming industry, including YouTube, Amazon Prime Video, Disney Plus, and Spotify, produces emissions comparable to the annual output of a mid-sized industrialised country.

The information and communication technology sector as a whole, including streaming, social media, cloud computing, cryptocurrency, and the energy used by devices to access all of the above, now accounts for approximately 1.9 per cent of global greenhouse gas emissions. The IEA projects that global data centre electricity consumption will reach approximately 945 terawatt-hours by 2030, which would be approximately 3 per cent of global electricity consumption.

The 1.9 per cent figure is substantial but is also, on the available comparison data, smaller than several other categories of activity that the popular framing has generally treated as more virtuous. Aviation accounts for approximately 2.5 per cent of global emissions. The fashion industry accounts for approximately 4 to 8 per cent depending on the methodology. Food waste accounts for approximately 8 per cent. The streaming industry’s environmental cost is real but is not, on any defensible reading of the peer-reviewed evidence, larger than the environmental cost of many activities that produce considerably less public concern.

The honest limitations

Several methodological caveats apply to the literature described above.

The first is that the 36 grams per hour figure is a central estimate based on global average electricity mix in 2019. The actual figure for any specific viewer depends substantially on where they live, how their electricity is generated, what device they use to watch, and what video resolution they choose. A viewer in Iceland streaming standard-definition video on a modern laptop produces approximately one tenth the per-hour emissions of a viewer in West Virginia streaming 4K video on an old plasma television. The popular framing’s tendency to quote a single number obscures genuine variation that depends on choices the viewer can actually influence.

The second is that the 89 per cent figure for end-user device contribution reflects current grid mixes and device efficiencies. As data centres expand to meet rapidly growing artificial intelligence workloads, the balance is shifting. Recent IEA projections suggest that data centre electricity demand may rise faster than the corresponding efficiency gains, and the share of streaming’s footprint attributable to data centres may grow over the next decade even as the absolute per-hour figure continues to fall.

The third is that the lifecycle assessment methodology used by the Shehabi team and others depends on assumptions about device lifetimes, replacement rates, and recycling patterns that are difficult to verify and that vary substantially across populations. The peer-reviewed figures are best treated as informed estimates with substantial uncertainty rather than as precise measurements.

The fourth is that several of the most widely cited sources for streaming’s environmental cost, including the Carbon Trust 2021 analysis that produced the 55 grams per hour Europe figure, were commissioned or co-funded by streaming companies themselves. The findings have been broadly consistent with independent peer-reviewed estimates, but the funding source is worth noting.

What it means

Several things follow from the differentiated picture of streaming’s environmental cost that are worth saying clearly.

The first is that the popular framing of streaming as an environmental catastrophe is, on the strongest peer-reviewed evidence, substantially overstated. The 3.2 kilograms per hour figure that has circulated in major media outlets for years is approximately 90 times higher than the actual peer-reviewed estimate. The framing has produced years of guilt-laden coverage of digital entertainment that the underlying science does not support.

The second is that the actual environmental burden of streaming falls on a different part of the system than the popular framing has located it. Data centres, despite their size, dramatic energy consumption, and visible cooling infrastructure, contribute approximately 4 per cent of streaming’s carbon footprint. The screens that viewers watch on contribute approximately 46 per cent. The home networking equipment that connects those screens to the internet contributes approximately 38 per cent. The popular conversation about how to reduce streaming’s environmental impact has consistently focused on the wrong part of the system.

The third is that the cumulative scale of streaming remains substantial. The 1.9 per cent of global emissions from the broader ICT sector is comparable to the airline industry. The 945 terawatt-hour projected data centre electricity consumption by 2030 is approximately 3 per cent of global electricity. Streaming is not an environmental free pass at scale, even though the per-hour cost is modest.

The fourth, on the strongest current reading of approximately ten years of peer-reviewed evidence and several methodological corrections to the popular framing, is that the most effective way for an individual viewer to reduce the environmental cost of their streaming is not to stream less, but to watch on a smaller and more efficient screen.

The popular framing has been telling people to stop watching Netflix.

The peer-reviewed evidence suggests they should instead buy a smaller television.

The post The environmental impact of watching one hour of video on Netflix is approximately 36 grams of carbon dioxide, roughly equivalent to driving a car for 150 metres, in a figure substantially smaller than the popular framing has claimed and one that demonstrates that the actual environmental burden of streaming comes not from the data centres people imagine but from the screens they watch on appeared first on Space Daily.

  •  

Humans are one of very few species whose females live for decades after they can no longer have children. One explanation is the ‘grandmother hypothesis’: long life may have evolved because grandmothers who helped gather food and raise grandchildren allowed more of those children to survive — quietly selecting, over generations, for longevity itself

A long stretch of life after the last possible child is, on the face of it, an evolutionary puzzle. Those decades cannot produce offspring directly, yet in humans they are routine. Women commonly live thirty or forty years past the point where childbearing ends, and this pattern is very unusual across the animal kingdom. 

Darren Croft, executive director of the Center for Whale Research, puts it simply: “For most species, females reproduce until the end of life.” There are exceptions but the general rule across animals is that fertility runs to the end.

The clearest exceptions sit in the ocean. A prolonged post-reproductive lifespan has been documented in five species of toothed whales: short-finned pilot whales, false killer whales, killer whales, narwhals and beluga whales. Female killer whales show the gap vividly. Males typically die in their thirties, while females can live into their eighties or beyond, long after they have stopped calving. 

Humans show a similar life-history pattern: births become rare by later midlife, while life often continues for decades afterward.

What the grandmother hypothesis proposes

One hypothesis for this,”the grandmother hypothesis”,  grew out of fieldwork rather than theory.

In the 1980s, University of Utah anthropologist Kristen Hawkes and her colleagues were studying the Hadza, a hunter-gatherer people in Tanzania, and noticed something they had not gone looking for. Older women were doing a great deal of the food gathering, specialising in digging large, deeply-rooted tubers out of hard ground that young children could not manage on their own. A child’s growth tracked the mother’s foraging until a new baby arrived, and after that it tracked the grandmother’s foraging instead.

That observation reframed the older women from dependents into providers. A grandmother who feeds an older child frees the mother to wean sooner and have her next baby earlier, lifting the family’s total surviving children.

It should be noted that this rests on a particular body of evidence and is not proof. The provisioning pattern comes from one foraging society. 

The evolutionary logic only works if grandmothering actually translates into more descendants but another line of evidence points that way. Using pre-industrial Finnish and Canadian parish records, a 2004 study found that women who lived longer past fifty ended up with more grandchildren. Longevity and grandchild numbers moved together.

Where it is contested

The hypothesis has real competitors, however. 

The older “mother hypothesis” and an “extended mothering” account both argue that long life was selected so a mother could finish raising her own late children, not her daughter’s, and a critical review by Jocelyn Peccei treats the grandmother account as one contested option among several. 

The demographic evidence also has edges. Working from pre-industrial Finnish parish registers, Simon Chapman and colleagues found that maternal grandmothers between fifty and seventy-five helped grandchild survival; very old grandmothers did not, and paternal grandmothers over seventy-five were actively linked to worse outcomes. That points to a ceiling on how far helping can push longevity.

What the grandmother hypothesis offers, if it holds, is a reading of what a long life is for. On this account, the decades after fertility are not a leftover but time that selection acted on, because of what one generation could do for the next. 

The post Humans are one of very few species whose females live for decades after they can no longer have children. One explanation is the ‘grandmother hypothesis’: long life may have evolved because grandmothers who helped gather food and raise grandchildren allowed more of those children to survive — quietly selecting, over generations, for longevity itself appeared first on Space Daily.

  •  

In 1971, a team of Soviet geologists in Turkmenistan’s Karakum Desert set a collapsed gas crater alight and assumed the flames would burn out within weeks, but more than five decades later the pit travelers now call the Door to Hell is still throwing orange light across the dunes every night

A vibrant and intense fire blazing against a dark backdrop, capturing the raw power of flames.

In the autumn of 1971, a team of Soviet geologists working near the village of Darvaza in Turkmenistan’s Karakum Desert watched the ground collapse beneath their drilling rig and decided the simplest fix was to set the escaping methane on fire. They expected the flames to burn off in a few weeks. The crater, now roughly 70 metres across and 20 metres deep, has been burning continuously ever since, throwing orange light across the dunes every night for more than five decades.

Today travelers call it the Gates of Hell, or the Door to Hell. The crater itself is a near-perfect circle of fire in the middle of one of the emptiest deserts on Earth, about 260 kilometres north of Ashgabat, and on a still night you can smell the gas before you can see the glow. The name Darvaza comes from a nearby settlement, from a Persian-rooted word meaning “gate”; the more lurid nickname came later, attached by visitors to the fiery pit rather than to anything the locals called it first.

Close-up of a fiery furnace in an industrial setting emitting intense flames and sparks.

A leaky basin under the sand

The Karakum is not a desert that gives up its secrets quickly. It covers roughly 70 percent of Turkmenistan, a slab of sand and clay the size of Germany, and the stretch of ground near Darvaza sits on top of one of the largest natural gas systems on the planet. Methane seeps up through fractures in the limestone cap rock and pools in low spots in the sand. The site overlies the Amu Darya Basin, and the basin is leaky. Long before any drilling rig arrived, the ground around these depressions hissed, the air smelled wrong, and the low spots were places herders learned to steer their animals away from.

The drilling rig that fell in

In 1971, Soviet geologists arrived at Darvaza with a Cold War mandate to find and quantify the gas reserves of the Turkmen SSR. They set up a drilling platform on what looked like solid ground. The ground was not solid. It was the thin roof of an underground cavern hollowed out by the same gas migration that had made the area unstable for generations.

The rig, the trucks, and a sizable bite of the desert dropped into the void. No one was killed, by most accounts, though the records from that era are thin and the Turkmen government has never released an official report. What the geologists were left with was a roughly circular pit venting methane fast enough to suffocate anything that came near it, including the camels and livestock that local herders relied on.

The decision to light it

Raw natural gas at a site like this is mostly methane, which is lighter than air, but it comes up mixed with heavier hydrocarbons and toxic traces, and in low-lying desert it can accumulate fast enough to be both an asphyxiation hazard and an explosion risk. The geologists knew venting it raw into a grazing area, even a sparsely populated one, was not a long-term plan. So they did what petroleum engineers had been doing at well sites for decades. They flared it. The reasoning, according to interviews Turkmen officials gave decades later, was that the gas pocket would burn itself out in a matter of weeks and the site could then be capped or abandoned.

That estimate turned out to be wrong by a factor of roughly 2,500 and counting. The flames are still there. The pocket, it turns out, is not a pocket at all but a connected piece of a much larger reservoir, and the methane keeps coming up through the sand and the broken rock as fast as the fire can consume it.

This kind of confident underestimation has a name in cognitive psychology. The planning fallacy describes a near-universal tendency to assume that the thing in front of you will resolve faster than comparable things have ever resolved before. Soviet field geology in the 1970s was not immune.

What is actually burning

The fuel is overwhelmingly methane, with smaller fractions of ethane, propane, and butane, and trace amounts of hydrogen sulfide that account for the rotten-egg note in the smell. The crater walls are a mix of limestone and compacted sand, and the floor is studded with smaller vents where flames lick up out of cracks in addition to the broader sheet of fire that covers most of the bottom.

The flames reach temperatures in excess of 1,000 degrees Celsius, hot enough that the few researchers who have approached the floor have done so in heat suits with breathing apparatus and steel cables. The Canadian explorer George Kourounis did exactly that in November 2013, becoming the first person known to have reached the bottom. Recording a ground temperature of around 400 degrees Celsius and working in a roughly 17-minute window, he collected soil samples that were later shown to contain extremophile bacteria living in the heated sediment, organisms that had apparently colonised an environment that did not exist before the fire began.

A beautiful close-up of sand dunes in a desert landscape, showcasing natural patterns.

Turkmenistan’s on-again, off-again plan to close it

The Turkmen government has announced plans to extinguish the crater more than once. In 2010, then-president Gurbanguly Berdymukhamedov ordered local officials to find a way to seal it, citing concerns about gas being lost from a reservoir the country could otherwise export. Nothing happened. In 2022, he ordered the closure again, this time framing it as an environmental and public-health measure. Again, nothing visible has happened on the ground.

Sealing the crater is harder than it sounds. The fire is fed by a diffuse network of fractures, not a single wellbore, and capping the visible opening would simply force the methane to vent somewhere else in the surrounding desert, possibly in places harder to monitor and just as dangerous to graze near. Drilling relief wells to capture the gas at depth is technically possible but expensive, and Turkmenistan’s gas industry is structured around exporting from established fields, not chasing a leak that has become, in a strange way, a national landmark.

The crater as a destination

Darvaza sits roughly four hours north of Ashgabat by road, much of that road unpaved, and visiting it requires a Turkmen tourist visa that is famously difficult to obtain. Those who make it generally arrive at dusk. The crater is unremarkable in daylight, a brown circle in a brown landscape with a faint shimmer of heat. After sunset it becomes one of the most photographed objects in Central Asia, a perfect ring of orange light visible from kilometres away across the dunes, throwing shadows from desert grasses long enough to reach the parking area where tour vehicles cluster.

The wind off the Karakum carries the heat in unpredictable gusts. Stand on the lip with the wind at your back and you feel a furnace. Stand on the opposite side and the air is cool enough to need a jacket. Camels graze nearby, having long since learned which slopes to avoid.

A clock with no hour hand

Estimates of how long the crater will burn vary wildly because no one has been able to map the connected reservoir precisely. Some Turkmen petroleum engineers have suggested the visible flames could persist for centuries at current vent rates. Others argue the rate has slowed measurably in recent years and that the fire may dim within a few decades on its own.

Whichever turns out to be right, the crater has now been burning for longer than the Soviet Union existed after lighting it. The geologists who made the original decision are mostly dead. Their drilling rig is somewhere under the sand at the bottom of the pit, slowly oxidising in the heat. The flames they expected to last a few weeks have outlived the country that dispatched them and every confident estimate anyone has made about when, exactly, the Door to Hell will close.

The post In 1971, a team of Soviet geologists in Turkmenistan’s Karakum Desert set a collapsed gas crater alight and assumed the flames would burn out within weeks, but more than five decades later the pit travelers now call the Door to Hell is still throwing orange light across the dunes every night appeared first on Space Daily.

  •  

The deepest point in the ocean, Challenger Deep in the Mariana Trench, sits nearly 11 kilometres below the surface — a depth so extreme that if Everest were dropped into it, the peak would still be covered by more than two kilometres of water

Deep blue underwater scene fading into darkness.

The claim holds. Challenger Deep, the lowest known point in the Mariana Trench and the deepest spot in any ocean, sits close to 11 kilometres below the surface. Drop Mount Everest into it, base on the seafloor, and the summit would still finish more than two kilometres underwater.

What makes this comparison unusual is that it survives a careful look. Many vivid scale facts fall apart once you check which numbers were used. This one does not.

The actual numbers

The most precise survey to date, published in 2020, puts the deepest point at 10,935 metres, give or take six metres. An earlier sonar mapping by the University of New Hampshire, reported by the United States National Oceanic and Atmospheric Administration in 2010, measured 10,994 metres, with a wider margin of about 40 metres.

Mount Everest stands 8,848.86 metres above sea level, the figure China and Nepal jointly settled on in 2020.

Put the mountain at the bottom of the trench and the arithmetic is not close. Using the 2020 depth, the peak ends up about 2,086 metres beneath the surface. Using the 2010 figure, about 2,145 metres. Either way, the tallest mountain on Earth disappears with more than two kilometres of water to spare. Everest accounts for only about four-fifths of the drop.

Why the depth is hard to pin down

The reason there is more than one number is that measuring the bottom of the sea is difficult. Depth at Challenger Deep is worked out from sound, timing how long a pulse takes to travel down through nearly 11 kilometres of seawater and back, then correcting for how temperature, salinity, and pressure bend the speed of sound along the way. Small errors in those corrections become metres at the bottom.

That is why each expedition tends to report a slightly different figure, and why the honest way to state the depth is with its error bar attached. The useful point is that the disagreement is small. Every credible measurement lands near 11 kilometres, and every one of them is deeper than Everest is tall.

What the comparison leaves out

The Everest image is a good way to grasp the vertical distance. It is a poor way to grasp what actually makes the place extreme.

Depth is not the danger. Pressure is. At the bottom of Challenger Deep the weight of all that water presses down at over a thousand times the pressure at the surface, the equivalent of several tonnes bearing on every square inch. A mountain sitting in the trench would feel that crush long before its peak neared the surface. The vertical-distance picture, dramatic as it is, quietly skips the part that has made the trench so hard to reach.

How rarely it has been reached

For all that the depth is now well surveyed by sonar, very few people have gone to the bottom in person.

The first descent was in 1960, when Jacques Piccard and Don Walsh rode the bathyscaphe Trieste down and back. It was more than half a century before anyone repeated it, when the filmmaker James Cameron made a solo dive in 2012. Fifty-two years separated the first descent from the second. Only with Victor Vescovo’s expeditions from 2019 onward did visits to the bottom start to become something other than a singular event.

The deepest point on the planet is barely 11 kilometres straight down, no farther than a short drive across a city. It remains one of the least visited places humans have ever managed to reach, and the reason is not the distance. It is the water pressing back.

The post The deepest point in the ocean, Challenger Deep in the Mariana Trench, sits nearly 11 kilometres below the surface — a depth so extreme that if Everest were dropped into it, the peak would still be covered by more than two kilometres of water appeared first on Space Daily.

  •  

In 1835 the New York Sun told readers the Moon was full of life, from winged man-bats to bison — and pinned the discovery on a real astronomer who never said any of it

Antique lithograph showing winged man-bats and animals in a fanciful lunar landscape.

On August 25, 1835, the New York Sun began telling its readers that life had been discovered on the Moon. Over the next six days the paper described lunar forests, inland seas, herds of bison, and beaches of white sand. Strangest of all were the creatures it called man-bats: people roughly four feet tall, covered in copper-colored hair, with thin membrane wings folded across their backs. The discoveries were credited to Sir John Herschel, one of the most respected astronomers alive, observing from an observatory at the Cape of Good Hope.

Herschel had said none of it. He was indeed at the Cape, mapping the southern sky with a real telescope, but he had not seen forests or man-bats or anything like them. The entire account was invented in a newspaper office in lower Manhattan. What makes the episode worth revisiting is not only how strange the claims were, but how plausibly they were staged, and how slowly the public could check them.

How the story was built

The Sun did not simply announce that there were people on the Moon. It claimed to be reprinting a scientific report from a supplement to the Edinburgh Journal of Science, lending the series the weight of a real research publication. The reporting was attributed to a Dr. Andrew Grant, described as a colleague of Herschel’s. Grant did not exist.

The narrative gave Herschel a telescope of fantastic power, built on what it called an entirely new principle, supposedly able to resolve objects on the lunar surface in fine detail. From that invented instrument the paper unspooled its discoveries one installment at a time: first geology and plants, then animals, then, at the climax, the man-bats, which the account named Vespertilio-homo in mock-Latin. There were bison-like quadrupeds, a bluish single-horned animal about the size of a goat, and beavers said to walk upright, carry their young, and live in huts warmed by fire.

The detail is what sold it. The Sun did not gush. It wrote in the flat, measured register of a scientific dispatch, piling up plausible-sounding specifics, which is exactly the texture readers expected from an account carrying Herschel’s name.

Why readers could not easily check

In 1835 there was no transatlantic telegraph cable. A New Yorker who wanted to know whether the Edinburgh Journal of Science had really published such a supplement faced a problem. Confirming it, or checking whether Herschel had said any of this, meant waiting weeks for ships to carry letters across the Atlantic and back. The hoax lived comfortably inside that gap.

It also helped that the named journal could not easily contradict the story, because it had stopped publishing two years earlier, in 1833. A rival editor, James Gordon Bennett of the New York Herald, seized on exactly this point, noting there was no such publication still in print. The defunct journal is one of the cleaner tells that the whole edifice was fiction.

The author is generally identified as Richard Adams Locke, a British-born editor working at the Sun. Years later, in an 1840 letter to another paper, Locke discussed the affair and framed it as satire, a send-up of the era’s overheated speculation about life on other worlds rather than a straight swindle. Whatever his intent, readers took it at face value first and learned the truth later.

What actually happened to belief

The popular memory of the hoax is that all of New York was fooled. Edgar Allan Poe had published his own lunar fantasy, “The Unparalleled Adventure of One Hans Pfaall,” in June of that year, and believed the Sun had borrowed his idea. He later wrote that not one person in ten discredited the story. That line is quoted constantly.

It is also probably too tidy. Historians who have gone back through the New York press of the period find that a good share of the city’s other papers met the Sun’s series with open skepticism. Some reprinted it as entertainment, others picked at its claims, rather than swallowing it whole. The honest version is that the hoax reached an enormous audience and genuinely took many readers in, while a meaningful part of the press was unconvinced from early on.

What is not in dispute is how far the story traveled. Within weeks the series was being reprinted in papers across Europe, and at least one Italian publisher issued a set of lithographs illustrating the supposed lunar discoveries, the man-bats, the temples and the horned beasts among them. By the time the account was widely understood to be fiction, it had already been read, copied and admired on two continents. The hoax outran its own correction, which is part of why it lodged so firmly in popular memory.

How sure are we about the famous circulation numbers

The story usually comes with a triumphant statistic: the hoax supposedly drove the Sun’s circulation to about 19,000 copies, making it, by the paper’s own claim, the most widely circulated daily in the world, ahead of the London Times. The Sun did print a boast to that effect at the height of the series, putting its daily figure at 19,360 and the Times at 17,000.

That number deserves a raised eyebrow. It came from the Sun itself, in the middle of promoting its own sensation, which is not a neutral source. Closer study of the paper’s circulation suggests it was already selling close to twenty thousand copies before the Moon series ran. The popular image of a paper that tripled its readership overnight, on the strength of the hoax, does not hold up well. The Sun’s reach helped the hoax travel; the hoax did not obviously transform the Sun’s reach.

There is a similar wrinkle in how the affair ended. The Sun never published a clean retraction. Around September 16, 1835, it acknowledged, in hedged language, that the account might not be genuine, while still declining to call its own series a fabrication outright. The myth of a bold confession is neater than the record.

Why it still matters

Strip away the man-bats and the Great Moon Hoax looks oddly modern. It worked by borrowing the voice and credentials of real science, attaching a trusted name, citing a source that was hard to check, and releasing the payload gradually so that each installment made the next easier to believe. The barrier to verification then was the width of an ocean and the speed of a sailing ship. The structure of the deception is not so different from things that circulate now.

It is tempting to read the episode as a story about gullible ancestors. It reads better as a story about the machinery of trust: how a claim borrows authority, how long it takes to test, and how a public slowly assembles the habit of asking where, exactly, a remarkable report came from. Herschel, for his part, was reportedly more annoyed than amused at being made the unwitting discoverer of a Moon full of creatures he never saw.

The post In 1835 the New York Sun told readers the Moon was full of life, from winged man-bats to bison — and pinned the discovery on a real astronomer who never said any of it appeared first on Space Daily.

  •  

A species of jellyfish called Turritopsis dohrnii can revert its adult cells back to a juvenile polyp stage when injured or starved, effectively rebooting its life cycle, and biologists have watched it perform this reversal indefinitely under laboratory conditions

Captivating close-up of a jellyfish showcasing its intricate details in an underwater setting.

In a seawater tank at an aquarium in Japan, a jellyfish smaller than a pencil eraser is doing something no other complex animal is known to do. Turritopsis dohrnii, a hydrozoan from the Mediterranean about four millimetres across, has been injured by a researcher, and instead of dying it is collapsing inward — its bell folding, its tentacles retracting, its swimming muscles dissolving into a small blob of cells that will sink to the bottom of the tank, fasten itself to the glass, and grow back into the polyp stage it left behind when it was effectively a child. The same individuals have been observed doing this over and over again for years. The animal does not appear to age out of the trick.

The process is called transdifferentiation, and it is the reason Turritopsis dohrnii has been nicknamed the immortal jellyfish. The name overstates the case — the animal can still be eaten, crushed, or infected — but it is not metaphor. Under laboratory conditions, the jellyfish has been observed to reverse its own life cycle indefinitely, which makes it the only known multicellular animal with a built-in escape hatch from old age.

A stunning jellyfish floating gracefully in a bright blue ocean scene.

What the jellyfish actually does

Most jellyfish go through two main life stages. They start as a fertilised egg that develops into a larva, the larva settles on a hard surface and grows into a polyp — a small stalk with a mouth and tentacles, attached to rock or shell — and the polyp eventually buds off free-swimming medusae, the pulsing umbrella-shaped form most people picture when they hear the word jellyfish. The medusa reproduces sexually, releases eggs, and then dies. The arrow points one way.

Turritopsis dohrnii can run the arrow backwards. When the adult medusa is wounded, starved, or exposed to sudden changes in temperature or salinity, it does not simply repair itself. It dismantles. Its cells lose their specialised identities — muscle cells stop being muscle cells, nerve cells stop being nerve cells — and reorganise into a cyst-like ball that attaches to a substrate and grows into a new polyp colony. From there it can bud off fresh medusae again. The animal that comes out is genetically identical to the one that went in. It is, in the most literal biological sense, its own younger self.

This is what makes the case strange. Plenty of animals regenerate lost parts — salamanders regrow limbs, starfish regrow arms, certain flatworms can be sliced apart and reconstitute themselves. But regeneration replaces tissue. Transdifferentiation rewrites identity. A muscle cell in a regrowing salamander leg stays a muscle cell. In Turritopsis dohrnii, the muscle cell becomes something else entirely.

How it was discovered

The reversal was first noticed almost by accident. Observations of Turritopsis medusae in laboratory conditions showed that instead of dying after spawning, they were sinking to the bottom of containers and turning back into polyps.

The finding sat quietly in the literature for years until specialists began examining strange life cycles in hydrozoans. Among the cases discussed was the unusual jellyfish, and in carefully controlled experiments, researchers confirmed that the reversal was real, repeatable, and not a fluke of stressed captive animals. The developmental sequence was documented in detail, giving the species its odd new claim to fame.

Shin Kubota and the indefinite reboot

The person who has spent more time watching Turritopsis dohrnii reverse itself than anyone alive is Shin Kubota, who keeps colonies in Japan. Kubota has kept individual jellyfish through the cycle dozens of times. In one stretch he documented a single specimen rejuvenating ten times in two years, and the broader pattern in his tanks is that the reversal does not appear to degrade with repetition. The polyp that emerges from the twelfth cycle looks like the polyp that emerged from the first.

That is the part that startles biologists. Most cells that divide many times eventually accumulate damage — telomeres shorten, mutations build up, mitochondria misfire. The reset in Turritopsis dohrnii appears to clear something. Whether it clears everything, indefinitely, is still an open question, but no one has yet caught the animal failing at the trick under good conditions.

A scientist adjusts a microscope in a laboratory setting, focusing on the sample.

What the genome shows

In 2022, a team led by Maria Pascual-Torner and Carlos López-Otín at the University of Oviedo in Spain published the first complete genome of Turritopsis dohrnii alongside its close relative Turritopsis rubra, which cannot reverse its life cycle. The comparison was the point. The Oviedo team found that the immortal jellyfish carried expanded or duplicated copies of genes involved in DNA repair, telomere maintenance, the stem-cell pool, and the protective handling of damaged proteins. The species also carried variants in genes that govern cellular senescence — the state in which damaged cells stop dividing and start leaking inflammatory signals — that appear to make it easier for its cells to escape that state.

The picture that emerged was not a single magic gene but a combination. Turritopsis dohrnii appears to have stacked several different anti-aging adaptations that, taken together, give its adult cells the option of reprogramming themselves back to an earlier developmental state. Some of those same pathways are well-studied in humans. The Oviedo group was explicit that the animal is being studied as a model for human ageing, not because anyone expects to bottle its trick, but because the genes it leans on are the same genes that go wrong in our own cells when they wear out.

Why this does not mean immortality is solved

The leap from a four-millimetre hydrozoan to a human being is enormous, and the people who study Turritopsis dohrnii are the first to say so. The jellyfish has no brain, no organs in the vertebrate sense, no skeleton. Its body plan is a handful of cell types arranged in two thin layers. The challenge of reorganising those cells is closer to rearranging the same Lego pieces than to rebuilding a cathedral from rubble. Human cells, organised into tissues with long developmental histories and complex epigenetic memories, cannot simply be told to forget what they are and start over without losing the information that makes a person a person.

There is also a measurement problem. A review published in December 2025 in Genomic Psychiatry argued that the field’s standard tools for measuring biological age in any organism are deeply flawed, which means that even calling the jellyfish ageless requires care about what ageing is being measured against. The animal certainly resets developmental stage. Whether it resets every clock biologists care about is a harder claim.

And in the wild, Turritopsis dohrnii almost certainly does not live forever. It gets eaten by larger jellyfish, fish, sea slugs and sea anemones. It gets pulped by storms. It gets dragged in ballast water across oceans — the species has now been found everywhere from the Mediterranean to Japan to Panama to the coast of Florida, and the global spread is thought to be partly the work of shipping. The immortality is conditional. It works in still water and gentle hands.

The thing that stays with you

Other animals are now being looked at with new interest because of what was found in the laboratory. Comb jellies have been observed reverting from their adult form back to a larval one, suggesting that the trick may not be unique to a single species but rather an old, deeply buried capacity in animals with simple body plans. The hydra, a freshwater cousin of the jellyfish, has long been known to renew its cells continuously and shows few signs of ageing in the lab. The immortal jellyfish may turn out to be the most extreme example of a more general pattern rather than a one-off miracle.

Shin Kubota is now in his late sixties. He has written karaoke songs about the jellyfish he studies, performed them on Japanese television, and described the animal in interviews as the most miraculous creature on Earth. The jellyfish in his tanks, having gone through their cycles many times, will outlast him. Some of them will be the same individuals — biologically continuous with the polyps he first collected — long after the man who watched them reset is gone.

The post A species of jellyfish called Turritopsis dohrnii can revert its adult cells back to a juvenile polyp stage when injured or starved, effectively rebooting its life cycle, and biologists have watched it perform this reversal indefinitely under laboratory conditions appeared first on Space Daily.

  •  

Research into the neuroscience of social rejection has shown that the brain regions that activate when a person is excluded, rejected, or grieving a lost relationship are the same regions that activate during physical injury, with the overlap being so substantial that a standard over-the-counter painkiller measurably reduces both kinds of pain, because the human brain has co-opted the physical pain system to register damage to social bonds

The popular framing of emotional pain treats it as something metaphorical. The broken heart of unrequited love, the sting of rejection, the ache of grief, the cutting remark, the wound that will not heal: the language of physical injury used to describe emotional injury is so widespread across cultures and languages that it has been treated, until quite recently, as a poetic convention rather than a scientific claim. People who use the language to describe their suffering are usually understood to be reaching for a metaphor that captures something about the intensity of what they feel.

The peer-reviewed neuroscience of the past two decades has substantially complicated this picture.

What the brain imaging evidence has shown, across multiple research teams, multiple methodologies, and multiple populations, is that emotional pain is not metaphorically similar to physical pain. The two states activate substantially overlapping neural systems, produce substantially similar behavioural and physiological responses, and respond to substantially the same pharmacological interventions. The language of broken hearts and stinging rejection is, on the strongest current reading of the evidence, more literally accurate than the popular framing has assumed.

The 2003 Cyberball study

The foundational peer-reviewed study of the neuroscience of social pain was published in October 2003 by Naomi Eisenberger, Matthew Lieberman, and Kipling Williams in the journal Science. The team designed an experiment to induce social rejection in a controlled laboratory setting while participants were inside a functional magnetic resonance imaging scanner. They used a computer game called Cyberball, in which the participant played a virtual ball-tossing game with what they believed were two other human players. After a brief inclusion phase in which all three players passed the ball to each other, the two other players began passing the ball only to each other, excluding the participant for the remainder of the game.

The two other players were not, in fact, human. They were computer-controlled. The exclusion was a designed feature of the experiment. From the participant’s subjective experience, however, they had just been deliberately excluded from a social activity by two people they had been interacting with moments earlier.

The brain activation pattern during the exclusion phase was the most significant finding of the study. The dorsal anterior cingulate cortex, a region of the brain that processes the affective component of physical pain, was significantly more active during exclusion than during inclusion. The level of activation correlated positively with the participant’s self-reported distress at being excluded. The same region of the brain that becomes active when a person is burned, cut, or struck became active when the same person was ignored in a virtual ball-tossing game.

The Eisenberger team’s interpretation, supported by the subsequent literature, was that the human brain treats social exclusion as a form of injury. The neural alarm system that evolved to alert humans to physical damage to their bodies is, on the available evidence, the same alarm system that alerts humans to damage to their social bonds.

The 2010 Tylenol study

The strongest follow-up evidence for the Eisenberger thesis came from a different direction. In 2010, a team led by Nathan DeWall at the University of Kentucky, with colleagues at Toronto, Florida, UCLA, Florida State, and Georgia College, published a study in Psychological Science that asked a simple question. If social pain and physical pain activate the same neural systems, then a pharmacological intervention that reduces physical pain should also reduce social pain. The team tested this prediction directly.

Participants in the first experiment took either 1,000 milligrams of acetaminophen, the active ingredient in Tylenol and Panadol, or a placebo, every day for three weeks. They reported their daily experience of social pain (feelings of rejection, exclusion, hurt feelings) on a standardised scale throughout the study period. The participants who took acetaminophen reported significantly lower social pain than those who took placebo, with the difference emerging gradually over the three weeks and becoming statistically significant by the end of the study.

The second experiment, also with three weeks of acetaminophen or placebo, used functional magnetic resonance imaging at the conclusion of the dosing period. Participants played the same Cyberball exclusion game while being scanned. The acetaminophen group showed significantly reduced neural activation in the dorsal anterior cingulate cortex and the anterior insula during the exclusion condition, compared with the placebo group. The pharmacological intervention designed to reduce physical pain had reduced both the felt experience and the brain activation associated with social pain.

The finding was substantial. Acetaminophen is one of the most widely used pain relievers in the world, taken by hundreds of millions of people for headaches, muscle aches, fever, and other physical conditions. Its mechanism of action involves central nervous system effects rather than purely peripheral pain blocking, which is the reason it can affect the brain regions that process social pain in addition to the brain regions that process physical pain. The DeWall team noted that this finding has implications for the treatment of social rejection, chronic loneliness, and the social aspects of grief, although they emphasised that acetaminophen is not a recommended long-term treatment for any of these conditions.

The 2011 somatosensory finding

A third major piece of evidence came from a 2011 study by Ethan Kross, Marc Berman, Walter Mischel, Edward Smith, and Tor Wager, published in the Proceedings of the National Academy of Sciences. The Kross team designed the most powerful induction of social pain that had been attempted in a brain imaging study. They recruited 40 participants who had experienced an unwanted romantic break-up within the previous six months and who reported that thinking about their ex-partner still produced significant emotional distress. The participants were placed in an fMRI scanner and shown alternating photographs of their ex-partner and of a familiar but emotionally neutral acquaintance. In a separate task, the same participants experienced a moderate physical pain stimulus, applied as heat to the forearm.

The Kross team found that thinking about the rejecting ex-partner activated not only the affective regions of the brain associated with physical pain, as the Eisenberger team had shown, but also the somatosensory regions, including the secondary somatosensory cortex and the dorsal posterior insula. These are the brain regions that process the felt sensory quality of physical pain, not merely the emotional response to it. The activation pattern in these regions during the romantic rejection condition was 88 per cent predictive of physical pain when compared with a database of more than 500 published pain studies.

The finding moved the science forward in an important way. Until 2011, the strongest interpretation of the Eisenberger data was that social and physical pain shared the affective components but probably not the sensory components. The Kross data suggested that, at sufficient intensity, social pain activates the sensory components as well. The brain of a person looking at a photograph of an ex-partner who has recently rejected them is, on the available evidence, doing something substantially similar to the brain of a person who has been physically burned.

Our team came across an interesting short video that explains the psychology behind what happens when someone has been through too much in life. If this article resonates, it’s worth a watch – click here to view it. 

Why the brain works this way

The current best evolutionary explanation for these findings is that the social attachment system in the human brain piggybacked on the existing physical pain system rather than developing a separate alarm mechanism of its own. Mammalian young, including human infants, require an unusually long period of caregiving to survive. An infant separated from its caregivers will die. The evolutionary pressure to keep infants attached to caregivers, and caregivers attached to infants, has been one of the strongest selection pressures shaping the human brain over the past several hundred thousand years.

The existing physical pain system, which had evolved to register damage to body tissue and motivate behaviour that reduces such damage, was already capable of producing a sufficiently intense aversive signal. The most parsimonious evolutionary solution was to extend this signal to social loss, so that the threat of being separated from social bonds would feel as urgent and unbearable as the threat of physical injury. The result is that the human brain treats damage to relationships, exclusion from social groups, and the loss of attachment figures as variants of the same general category of threat that includes physical wounds.

This explanation, sometimes called the social attachment piggyback hypothesis, has been articulated in detail by Eisenberger in subsequent papers and is the standard evolutionary interpretation of the imaging findings. It is also consistent with the cross-cultural ubiquity of physical pain language in descriptions of social loss. Speakers of unrelated languages, in unrelated cultures, with no shared history of metaphor formation, describe rejection and grief in substantially the same terms. The convergence on physical pain vocabulary appears to be driven by the underlying neural reality rather than by any cultural transmission.

The honest limitations

The social-pain-physical-pain overlap thesis is not, despite the strength of the evidence above, fully settled in the peer-reviewed literature.

A 2014 study by Choong-Wan Woo, Tor Wager, and colleagues, published in Nature Communications, applied a more sophisticated form of brain imaging analysis called multivariate pattern analysis to data on both social rejection and physical pain. The Woo team found that while the same anatomical brain regions are activated by both kinds of pain, the precise neural patterns within those regions are distinct. The brain appears to be using the same general neighbourhood for both kinds of pain, but it is doing different things within that neighbourhood.

The Woo finding does not negate the Eisenberger and Kross results. It does mean that the strongest possible interpretation, in which social and physical pain are essentially the same experience differently triggered, is too strong. The current best reading is that the two kinds of pain share substantial neural infrastructure but are not identical. The overlap is genuine and substantial. The identity claim is too strong on the available evidence.

A separate methodological concern is that the laboratory inductions of social pain, including the Cyberball game and the ex-partner photograph paradigm, are short-duration acute experiences that may not perfectly model the chronic social pain of long-term loneliness, sustained grief, or persistent interpersonal trauma. The neural systems engaged by acute laboratory rejection may differ in important ways from those engaged by months or years of sustained social suffering. The peer-reviewed evidence on chronic social pain is thinner than the evidence on acute laboratory social pain, although the available work suggests broadly similar neural patterns.

What it means

Several things follow from the neuroscience of social pain that are worth saying clearly.

The first is that the popular framing in which emotional suffering is treated as fundamentally different from physical suffering, less real, less serious, less worthy of medical attention, is not supported by the available evidence. The brain treats damage to social bonds as a category of injury and produces a measurable distress signal that overlaps substantially with the distress signal produced by physical injury. The chronic loneliness that the World Health Organization now treats as a global public health concern, the grief that follows the death of a close attachment figure, and the social rejection that produces measurable mortality in long-term studies are all, on the available evidence, registering in the brain as forms of sustained low-grade pain.

The second is that the language people use to describe their emotional suffering is, on the strongest current reading, an accurate report of what is happening rather than a poetic exaggeration of it. A person who describes a breakup as feeling like being punched in the chest is not being dramatic. They are providing the most accurate available verbal description of a neural state that genuinely shares features with being punched in the chest.

The third is that the pharmacological evidence suggests interesting possibilities for the treatment of acute social pain, although the practical implications remain genuinely contested. The DeWall finding that acetaminophen reduces social pain has been replicated and extended in subsequent work, but the long-term implications for grief management, loneliness intervention, and the treatment of attachment-related disorders are not yet established.

The fourth, on the strongest current reading of approximately twenty years of peer-reviewed neuroscience, is that the human capacity for enduring pain extends to the capacity for enduring social pain, because the same neural systems are involved in both, and the same biological constraints determine what can be borne and for how long.

The popular framing has, in a sense, always known this.

The neuroscience is just confirming what every person who has ever lost someone has already been trying to say.

The post Research into the neuroscience of social rejection has shown that the brain regions that activate when a person is excluded, rejected, or grieving a lost relationship are the same regions that activate during physical injury, with the overlap being so substantial that a standard over-the-counter painkiller measurably reduces both kinds of pain, because the human brain has co-opted the physical pain system to register damage to social bonds appeared first on Space Daily.

  •  

In July 1969, Buzz Aldrin pulled a packet of bread and a vial of wine from his personal preference kit aboard the lunar module Eagle and took Communion on the surface of the Moon while Houston went radio-silent, because NASA was already fighting an atheist’s lawsuit over the Apollo 8 Genesis reading

On July 20, 1969, roughly 20 minutes after the lunar module Eagle settled into the dust of the Sea of Tranquility, Buzz Aldrin reached into a small pouch in his personal preference kit, pulled out a thumb-sized plastic vial of wine and a wafer of bread from Webster Presbyterian Church near Houston, and took Communion. And almost no one on Earth heard him do it.

Mission Control had asked him to stay quiet.

Buzz Aldrin lunar module

The chalice that fit in a glove pocket

The kit was tiny. A plastic film container of wine. A wafer wrapped in cellophane. A miniature silver chalice barely larger than a thimble. A handwritten index card with a verse from the Gospel of John. Aldrin had carried all of it from a small Presbyterian congregation in Webster, Texas, the spiritual home of many of the Apollo astronauts, where he served as an elder, and he described every piece of it afterward in a first-person account for Guideposts.

Neil Armstrong watched without comment. Michael Collins was overhead in Columbia, on the far side of the radio link. The cabin was cramped, the checklist was crowded, and the two men had been awake for the better part of a day.

Why Houston went quiet

The silence on the loop was not accidental. NASA was, at that moment, defending itself against a lawsuit.

On Christmas Eve 1968, the crew of Apollo 8 — Frank Borman, Jim Lovell and Bill Anders — had read the opening verses of Genesis to a live television audience as they orbited the Moon. The broadcast drew a lawsuit from Madalyn Murray O’Hair, the founder of American Atheists, who had already successfully challenged school-sponsored Bible reading and prayer in the United States. O’Hair argued that NASA, a federal agency, had violated the Establishment Clause by allowing its employees to read scripture while on duty. She asked the courts to bar astronauts from religious observance in space.

The reading had also produced the opposite reaction at enormous volume. NASA’s mail rooms filled with letters defending the Genesis broadcast, and the agency found itself caught between a vocal legal challenge on one side and an organized letter-writing campaign on the other. By the summer of 1969 its communications staff had every reason to keep the next mission’s most religiously charged moment off the air.

The suit was pending when Apollo 11 left the pad. Deke Slayton, who ran flight crew operations, pulled Aldrin aside before launch. Slayton’s instruction was practical, and later recounted in detail: go ahead and have your Communion, but keep the comments general. Don’t put us back in court.

So when Aldrin keyed his microphone, what the world heard was a measured, ecumenical request rather than the Christopher Columbus–style planting-of-the-faith ceremony he had originally drafted. He invited listeners to pause for a few moments of silence and to contemplate the events of the past few hours and give thanks in their own way.

Then the loop went quiet. He ate the bread. He drank the wine. He read the verse from John on his own.

O’Hair’s case against NASA was dismissed by a federal court in December 1969, and the Supreme Court later declined to take it up, but its chilling effect on the agency’s communications policy long outlived it. Apollo 11’s most religiously charged moment was therefore conducted in radio silence rather than broadcast — a striking inversion of the Apollo 8 reading that had triggered the whole legal headache.

lunar module interior

The wine that crept up the cup

The story of the lunar Communion only filtered into public awareness slowly. Aldrin himself first described it publicly in a 1970 essay for Guideposts magazine, and the details were later expanded in The Guardian’s reconstruction of the ceremony, which drew on Aldrin’s own writings and on the recollections of the Webster congregation. In Aldrin’s telling, the wine behaved strangely — in the one-sixth gravity of the Moon, it curled slowly up the inside of the cup rather than pouring. The Communion elements, he noted, were the first food and drink ever consumed on the lunar surface.

The verse on the card was John 15:5. “I am the vine, you are the branches,” it began, in Aldrin’s own handwriting, the rest of it pressed onto a three-by-five index card he had tucked into the kit on Earth. He read it silently, to himself, in a cabin no one outside could hear.

The chalice that came home

The silver chalice was returned to Webster Presbyterian Church, where it remains. Every July, on the Sunday closest to the anniversary of the landing, the congregation holds a service it calls Lunar Communion Sunday. They play a recording of Aldrin’s radio request. They use the same chalice.

The astronaut who was almost a missionary

Aldrin had originally envisioned something more theatrical. In drafts he later described, the lunar Communion was meant to be broadcast live, a moment of public witness in the tradition of explorers planting crosses on new shores. Slayton’s intervention turned it into something quieter and, in retrospect, stranger: a private sacrament conducted on a world where no sacrament had ever been performed, attended by exactly one celebrant and one silent observer, transmitted to Earth as dead air.

Aldrin himself has been ambivalent about the decision in the decades since. He has written that the Communion was deeply meaningful to him personally, his way of thanking God for the safe descent. He has also written that, looking back, he might not have chosen a Christian sacrament for a mission undertaken “in the name of all mankind.” The Catholic Register’s account of religious experiences among Apollo-era astronauts records that ambivalence at length — the recognition that the crew had been sent not just by the United States but by a planet, and that the planet contained more than one faith.

What survives

Listen to the Apollo 11 air-to-ground record from that part of the timeline and the gap is audible. Aldrin makes his general request. There is a pause. The flight director moves on. The world, leaning toward its televisions and radios, does not know that on the other end of the silence a man is eating a wafer and drinking a sip of wine that is rising slowly up the inside of a thimble-sized cup in a way no liquid had ever risen before.

It was never, strictly, a secret. The press had reported beforehand that Aldrin would carry Communion bread aboard; what NASA withheld was the live broadcast, not the fact. The core elements of the story — the bread, the wine, the chalice from Webster Presbyterian, the radio request, the silence — are confirmed across multiple independent accounts, including Aldrin’s own contemporaneous writings and the church records. The detail that catches people is almost always the wine. It did not pour. It crept.

Aldrin is 96 now. He watched the launch of Artemis II from his home in California on April 1, 2026, on television, with his daughter Jan beside him. Florida Today reported that the Aldrin Family Foundation shared two photographs of him in front of the TV screen as the Space Launch System rocket carried Reid Wiseman, Christina Koch, Victor Glover and Jeremy Hansen on a 10-day flight around the Moon — the first crewed lunar mission since 1972. He is the last surviving member of the Apollo 11 crew.

Aldrin took the sacrament before he stepped out, before Armstrong’s famous descent down the ladder, before the boot print and the flag and the phone call from Richard Nixon. The first human act on the surface of another world, after the engines shut down and the dust settled, was a man eating a wafer of bread that had ridden 240,000 miles in a plastic pouch.

The pouch survives. The chalice survives. The handwritten card survives. The recording of the silence survives. Webster Presbyterian Church will hold its Lunar Communion service again this July, with the same chalice on the same altar, replaying the same audio of a man on the Moon asking the world to give thanks in its own way while NASA — wary of a pending lawsuit — quietly closed the channel and let him eat his bread alone.

The post In July 1969, Buzz Aldrin pulled a packet of bread and a vial of wine from his personal preference kit aboard the lunar module Eagle and took Communion on the surface of the Moon while Houston went radio-silent, because NASA was already fighting an atheist’s lawsuit over the Apollo 8 Genesis reading appeared first on Space Daily.

  •  

Your own voice sounds different to other people than it sounds to you, because the version you hear is reaching your inner ear partly through the bones of your skull, which amplify lower frequencies that everyone else cannot hear — and the recorded version that strikes most people as alien when they first hear it is in fact the only version of their voice anyone else has ever known

There is a specific moment, usually in childhood or early adolescence, when most people first hear a recording of their own voice and discover, with mild horror, that it does not sound the way they expected. The voice on the recording is thinner. Higher. More nasal. Less authoritative. Less resonant. It does not seem to match the voice the person has been hearing inside their own head for their entire life. The instinctive reaction is that the recording must be defective somehow — that microphones distort, that playback equipment is poor, that something has gone wrong in the chain between vocal cords and loudspeaker. The recording, in nearly all cases, is fine. The misalignment is between two distinct ways of hearing the same sound, only one of which is available to the listener and only the other of which is available to everyone else who has ever listened to that voice. The recording is a reasonable approximation of the second one. The voice in the speaker’s head is, in important respects, an illusion produced by the speaker’s own skull.

According to a 2023 Mirage News explainer drawing on the underlying acoustics literature, the human auditory system actually has two distinct pathways by which sound reaches the inner ear. The first, called air conduction, is the pathway most people think of as “hearing”: sound waves travel through air, enter the ear canal, vibrate the eardrum, set off a chain of vibrations in the three small bones of the middle ear, and ultimately stimulate the cochlea — the fluid-filled, snail-shaped organ in the inner ear that converts mechanical vibration into the neural signals the brain interprets as sound. The second pathway, called bone conduction, bypasses the outer and middle ear entirely. Vibrations from a sound source travel directly through the bones of the skull — particularly the mastoid and temporal bones near the ear — and reach the cochlea by a structural route rather than an airborne one.

Why bone conduction makes the voice in your head deeper

When a person speaks, the vibration originates in the vocal cords, which sit deep inside the throat, surrounded by skull and jawbone. The sound produced travels outward into the air, where it can be heard by everyone else in the room via ordinary air conduction. But the sound also travels inward, through the bones surrounding the vocal cords, up through the skull, and into the speaker’s own inner ear via bone conduction. The speaker, accordingly, hears their own voice through both pathways simultaneously. Everyone else in the room hears it through only one.

The catch is that bone is not a neutral conductor of sound. As reported by Imperial College London’s coverage of Dr. Tobias Reichenbach’s 2014 research on the mechanics of bone conduction, the bones of the human skull are substantially more efficient at transmitting low-frequency vibrations than high-frequency ones. The bone-conducted version of a person’s voice is therefore weighted toward the lower end of the frequency spectrum — bassier, fuller, and more resonant than the air-conducted version. The voice the speaker hears in their own head is the sum of the air-conducted and bone-conducted versions, with the bone-conducted contribution adding low-frequency depth that no external listener has ever heard. Reichenbach summarised the implication directly in his 2014 paper: “Many of us cringe when we play back a recording of our own voice. This is because we perceive our voice differently to how others hear it. Interestingly, bone conduction plays a role in how we recognise our voice. This is because the process is more effective at transmitting lower-frequency sounds to the brain, which means that we perceive our voice as being deeper than what it is.”

What the recording actually captures

A microphone, sitting in air several feet from the speaker, picks up only the air-conducted version of the voice — the same version that reaches the ears of everyone else within hearing range. When that recording is played back, the listener hears their own voice as it actually sounds to others, without the low-frequency bone-conducted overlay that has, until that moment, been the only version of their voice they have ever known. The mismatch is real, well-characterised, and produces a specific psychological phenomenon that auditory researchers refer to as “voice confrontation” — the sense of cognitive dissonance that accompanies hearing one’s own recorded voice for the first time.

Per an explainer from ENT and Allergy Associates on the phenomenon, the voice-confrontation effect tends to be most pronounced in people who have rarely or never heard recordings of themselves. It also tends to diminish, somewhat, with repeated exposure — singers, podcasters, broadcasters, and others who routinely listen to their own recorded voices gradually adjust their internal voice-image to better match the external reality. But the underlying physical mismatch never goes away. As long as a person has a skull and intact bone conduction, they will hear their own voice with low-frequency emphasis that no one outside their body can detect. The mental image of one’s own voice, accumulated over a lifetime of speaking and listening simultaneously, is structurally different from the voice that anyone else has ever encountered.

The thing humans never heard until 1877

Per Today You Should Know’s overview of the air-conducted versus bone-conducted distinction, one of the historically interesting features of this whole phenomenon is that humans never actually heard the “external” version of their own voice until the late 19th century. Thomas Edison’s phonograph, invented in 1877, was the first technology that could capture sound and play it back — and was, accordingly, the first technology that could ever show a person what they actually sounded like to other people. For approximately 200,000 years before Edison, every member of the species had a mental image of their own voice that was systematically different from the voice that everyone they had ever spoken to had heard. The internal voice was the only voice anyone had ever experienced from inside their own head. The discrepancy was undetectable, and presumably did not exist as a recognisable phenomenon.

The first generation of phonograph users would, by all available historical accounts, have been the first humans in history to experience voice confrontation. The experience has since become a routine part of growing up in any technologically modern society — the moment when a child first hears themselves on a voicemail, or a recording from school, or a video clip, and registers, with confusion, that the voice on the playback does not match the voice they have been hearing inside their own head for as long as they have been speaking. The cognitive adjustment that follows is the small but real psychological work of integrating the external version of oneself into the internal model. For most people, the external version will always sound slightly off. The internal version — fuller, deeper, more resonant — is the version constructed by a brain that has spent its entire life listening to itself through the bones of its own head, with no one else ever in a position to compare notes.

The post Your own voice sounds different to other people than it sounds to you, because the version you hear is reaching your inner ear partly through the bones of your skull, which amplify lower frequencies that everyone else cannot hear — and the recorded version that strikes most people as alien when they first hear it is in fact the only version of their voice anyone else has ever known appeared first on Space Daily.

  •  

The interstellar comet 3I/ATLAS, discovered on July 1, 2025, by a survey telescope in Chile, is now believed by astronomers at Oxford to be roughly 7 billion years old — meaning it was already drifting through the Milky Way for nearly 3 billion years before our solar system even existed — having formed in a part of the galaxy called the thick disk, where the stars are older than almost everything else humanity has ever observed

On the morning of 1 July 2025, the ATLAS survey telescope at Río Hurtado in Chile detected an unusual moving point of light against the background stars. Within a few hours, follow-up observations from other telescopes had confirmed the object’s trajectory: this was not a solar-system comet on a long elliptical orbit, but a body moving through the inner solar system on a hyperbolic path, travelling too fast and at too steep an angle to have originated from any region gravitationally bound to the Sun. The object was, in other words, an interstellar visitor — only the third such object ever confirmed, after 1I/’Oumuamua in 2017 and 2I/Borisov in 2019. It was named 3I/ATLAS in honour of the survey that detected it. By the time the discovery announcement reached the broader astronomical community, a graduate student at the University of Oxford had already started running it through a predictive model he had spent the previous several years developing — and what the model returned was, by every available indication, the most remarkable interstellar visitor humanity has yet encountered.

According to the Royal Astronomical Society’s announcement of the Oxford analysis, the graduate student was Matthew Hopkins, who had defended his PhD thesis just one week before 3I/ATLAS was discovered. Hopkins had developed, with co-author Chris Lintott and colleagues at the University of Canterbury in New Zealand, what they call the Ōtautahi-Oxford Model — a statistical framework for inferring the origin and age of interstellar objects from their orbital trajectories. The discovery of 3I/ATLAS turned out to be the first real-time test of the model on a brand-new object. Hopkins ran the analysis. The result was striking enough that Hopkins, who had been planning to start a holiday, instead spent the following days comparing the data to his model’s predictions. The headline conclusion: 3I/ATLAS has approximately a two-thirds probability of being older than the solar system, with a statistical best estimate of approximately 7 billion years — making it, by the Oxford team’s analysis, the oldest comet humanity has ever observed.

What “the thick disk” actually means

As reported by Space.com’s coverage of the Hopkins-Lintott analysis, the key piece of evidence pointing toward the extreme age of 3I/ATLAS is its steep angle of approach. The Milky Way galaxy is not a uniform structure. Most of its stars, including the Sun, sit in a relatively thin disc that rotates around the galactic centre — a flat layer of younger, metal-rich stars approximately 1,000 light-years thick. Above and below this thin disc lies a substantially larger, more diffuse structure called the thick disc — a population of older stars, typically 10 to 12 billion years old, that orbit the galaxy on inclined paths and pass through the thin disc rather than residing within it. 3I/ATLAS arrived from a steep angle that traces directly back to the thick disc population. Its trajectory was the diagnostic signature that allowed Hopkins’s team to conclude, with statistical confidence, that the comet had formed around a star far older than the Sun.

The thick disc is older than the thin disc but is not the oldest component of the galaxy. The Milky Way’s stellar halo — a much more diffuse population of stars extending well above and below the disc — contains stars approximately 12 to 13 billion years old, dating to within a billion years of the Big Bang itself. Globular clusters, which orbit the galaxy in three dimensions rather than in the disc plane, contain some of the oldest known stars. But the thick disc is the oldest component dense enough to be a plausible source of interstellar comets reaching the inner solar system on observable trajectories. The previous two interstellar objects, 1I/’Oumuamua and 2I/Borisov, both originated in the thin disc and were therefore comparable in age to the Sun or younger. 3I/ATLAS is the first sample any human telescope has ever obtained from material formed in the much older star systems that populate the thick disc.

What 3I/ATLAS is made of

Per EarthSky’s coverage of the chemical composition of 3I/ATLAS, initial spectroscopic observations have identified the comet as water-ice-rich, with apparent enhancement in volatile compounds relative to comets formed within the solar system. The chemistry is consistent with formation around an older, lower-metallicity star — one whose protoplanetary disc would have contained different ratios of light elements, carbon compounds, and water than the disc that produced the Sun and its planets. Comets are, in cosmochemical terms, frozen samples of the protoplanetary disc material from which they formed. A comet from a 7-billion-year-old star system therefore preserves, in its volatile inventory and isotopic ratios, direct evidence of what the chemistry of the galaxy looked like at a substantially earlier point in its evolution than anything previously available to direct sampling.

This makes 3I/ATLAS scientifically valuable beyond its status as a single remarkable object. The comet is, in effect, a small frozen specimen of the early Milky Way, delivered to the inner solar system by approximately 7 billion years of interstellar drift. By the time it passed closest to the Sun on 29 October 2025 and closest to Earth on 19 December 2025 — at a safe distance of 168 million miles — astronomers had used Hubble, ground-based telescopes, and several space-based instruments to gather as much spectroscopic and imaging data as the brief window allowed. The comet has now passed its closest approach and is heading back out of the solar system, never to return. The data collected during its passage will be analysed for years.

What comes next

The discovery of 3I/ATLAS is, by every available indication, the leading edge of what is likely to become a substantially larger field of interstellar-object science over the next decade. The Vera C. Rubin Observatory, currently beginning operations in Chile, is expected to detect interstellar objects at a far higher rate than any previous survey — possibly several per year rather than one every few years. The statistical case for the existence of approximately one interstellar object per year passing through the solar system was already well-established from the ‘Oumuamua and Borisov detections; most have simply been too small, too dim, or too transient to be caught by existing surveys. The Rubin Observatory’s combination of wide field of view, deep sensitivity, and rapid cadence should change this. Each future interstellar visitor will be a new opportunity to test the Hopkins-Lintott statistical framework, to compare chemical compositions across objects of different ages and galactic origins, and to assemble a substantially more complete picture of what the rest of the Milky Way is made of.

3I/ATLAS itself will not be back. Its hyperbolic trajectory carries it out of the solar system and back into interstellar space on a path that will not bring it near the Sun again. Whatever further drift it makes through the Milky Way over the next several billion years — whether it eventually encounters another stellar system, drifts indefinitely between them, or is scattered into the galactic halo — is now no longer accessible to terrestrial observation. The Oxford team’s analysis, if their two-thirds statistical confidence holds up to further scrutiny, places the comet’s formation in a galactic environment approximately 2.4 billion years older than the Sun. That number alone makes 3I/ATLAS the oldest piece of material from outside the solar system that humans have ever knowingly sampled, by a margin of approximately the entire previous age range of observed comets combined.

The post The interstellar comet 3I/ATLAS, discovered on July 1, 2025, by a survey telescope in Chile, is now believed by astronomers at Oxford to be roughly 7 billion years old — meaning it was already drifting through the Milky Way for nearly 3 billion years before our solar system even existed — having formed in a part of the galaxy called the thick disk, where the stars are older than almost everything else humanity has ever observed appeared first on Space Daily.

  •  

Roughly 100 tons of dust and small particles from outer space fall onto the Earth every single day — most of it microscopic, some of it older than our solar system — meaning the dust you find on your bookshelves and windowsills almost certainly contains, mixed in with the ordinary terrestrial dirt, a small fraction of material formed in the deaths of stars that exploded before the Earth itself was even born

The Earth, in any given 24-hour period, is being slowly snowed on by the rest of the solar system. The snow is not visible. The flakes are smaller than the width of a human hair. They arrive at interplanetary speeds, decelerate through atmospheric friction high in the upper atmosphere, and then drift downward at the speed of ordinary dust — taking weeks or months to reach the ground. By the time they arrive, they look indistinguishable from terrestrial dust to the unaided eye. Most fall on the oceans. Some fall on remote ice fields. A small fraction fall on cities, on rooftops, into gutters, through open windows, and onto the surfaces inside ordinary buildings. The total mass involved is, by various estimates, somewhere between 5,000 and 40,000 metric tonnes per year — a figure that has been actively debated in the cosmochemistry literature for several decades, and that depends substantially on which particles are being counted.

According to Astronomy.com’s reference figure on cosmic dust accretion, the traditional estimate of approximately 100 metric tonnes per day of cosmic dust entering Earth’s atmosphere has been the standard reference figure since the late 20th century, based on spacecraft measurements of interplanetary dust density and atmospheric entry data. The 100-tonne figure includes everything that crosses the boundary into Earth’s atmosphere — but the great majority of that material burns up at altitudes between 75 and 110 kilometres, producing the meteor streaks visible to the naked eye and the much larger number of microscopic disintegrations that occur invisibly every night. Only a fraction of the entering material survives the atmospheric descent intact and reaches the ground as a recoverable particle.

The Antarctic measurement

The most rigorous attempt to measure the surface-reaching fraction was completed in 2021 by a team of cosmochemists led by Jean Duprat at the French National Centre for Scientific Research. As reported by Space.com’s coverage of the Duprat et al. study, the team conducted six expeditions over twenty years near the Franco-Italian Concordia Station at Dome C in central Antarctica — one of the cleanest places on Earth, with very little terrestrial dust to contaminate the samples and very slow snow accumulation to preserve a clear chronological record of what had fallen in any given year. The team eventually recovered 1,280 unmelted micrometeorites and 808 cosmic spherules ranging in size from 30 to 350 micrometres — particles small enough that several thousand could fit on a postage stamp.

Scaling the Antarctic deposition rate to the full surface area of the planet, the team calculated that approximately 5,200 metric tonnes of interplanetary dust reach Earth’s surface each year — equivalent to approximately 14 tonnes per day, substantially less than the older 100-tonne atmospheric-entry figure but consistent with it once atmospheric burnup is accounted for. Approximately 80 percent of the surface-reaching dust originates from Jupiter-family comets — periodic comets that shed dust during their passages through the inner solar system. The remaining 20 percent comes from collisions between asteroids in the asteroid belt, which produce dust that drifts inward toward the Sun on long, slow trajectories.

The stardust subset

The vast majority of the cosmic dust falling on Earth is, by mass, ordinary solar system material — formed from the same disc of gas and dust that produced the Sun and the planets approximately 4.6 billion years ago. But a small fraction, found principally inside larger meteorites rather than in the surface dust itself, consists of grains that genuinely predate the solar system. These are called presolar grains, and they are among the most remarkable objects available to terrestrial science. Per Wiley Analytical Science’s review of presolar grain research and Project Stardust, presolar grains are small particles — typically silicon carbide, graphite, oxides, or nanometre-sized diamond — that formed in the outflows of dying stars before the solar system existed, drifted through interstellar space for hundreds of millions or billions of years, and were then incorporated into the molecular cloud from which the Sun and planets eventually condensed. Some of them survived the heat of solar system formation intact, embedded within larger meteoritic bodies, and have now been recovered from carbonaceous chondrite meteorites that have fallen to Earth.

A 2020 analysis of silicon carbide grains recovered from the Murchison meteorite — which fell in Australia in 1969 — found that several of the grains were approximately 7 billion years old, predating the solar system by roughly 2.5 billion years. Their isotopic signatures, particularly in noble gases and carbon ratios, are inconsistent with anything that could have formed within the solar system, and consistent with formation in the slow stellar winds of asymptotic giant branch stars — red giants in their late evolutionary phases that shed their outer atmospheres into interstellar space over millions of years rather than in a single explosive event, though a smaller subset of presolar grains do appear to have formed in supernova explosions. These grains are, in the most literal sense, material from the deaths of stars that ended before the Earth began.

Whether your bookshelf actually contains stardust

The popular framing — that the dust on ordinary household surfaces contains a small fraction of material from outer space, including possibly some genuine presolar grains — is partially confirmed and partially complicated by the available research. The confirmed part comes from Jon Larsen’s Project Stardust, a programme begun in 2009 by a Norwegian musician who became interested in the question after a small black particle landed on his breakfast table. Larsen developed magnetic-separation and microscopy techniques for identifying micrometeorites in urban dust, and has subsequently recovered and verified approximately 500 large micrometeorites from rooftops in Paris, Oslo, and Berlin. As documented in EarthSky’s coverage of the broader micrometeorite-collection literature, the demonstrated presence of micrometeorites in urban environments establishes that cosmic dust does, in fact, accumulate in human-built spaces — though typically on roofs and in gutters rather than on indoor bookshelves.

The complicated part is the inference from “cosmic dust on rooftops” to “presolar grains in bedroom dust.” Most household dust by mass is terrestrial — skin cells, textile fibres, soil, pollen, and various pollutants. The fraction that is genuinely extraterrestrial is exceedingly small, and the further fraction within that fraction that consists of presolar grains formed in dying stars is smaller still. The combined claim that the dust on a typical bookshelf contains material formed in stars that died before the Earth was born is, in technical terms, defensible only as a statistical probability — extremely small but not zero. The dust on the bookshelf is overwhelmingly the residue of the person who lives there. The microscopic remainder, in trace amounts that would require careful laboratory technique to isolate, includes the slow rain of cometary debris that has been falling onto the planet for the entire 4.6-billion-year duration of its existence, with a vanishingly small fraction of that debris consisting of grains that are older than the planet onto which they have, after billions of years of interstellar drift, finally settled.

The post Roughly 100 tons of dust and small particles from outer space fall onto the Earth every single day — most of it microscopic, some of it older than our solar system — meaning the dust you find on your bookshelves and windowsills almost certainly contains, mixed in with the ordinary terrestrial dirt, a small fraction of material formed in the deaths of stars that exploded before the Earth itself was even born appeared first on Space Daily.
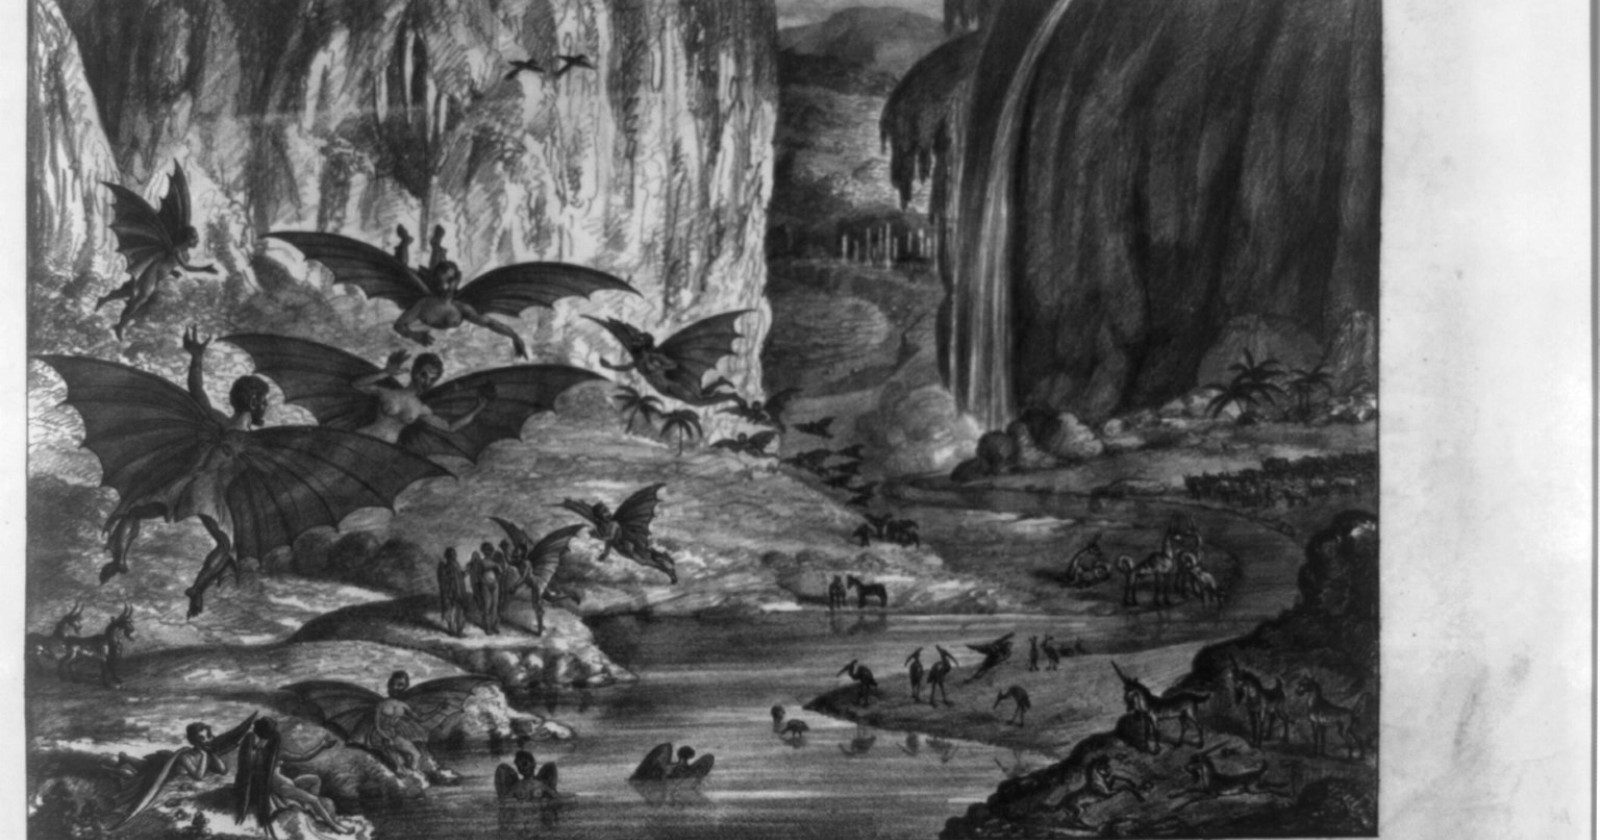
  •  

Six men spent 520 days sealed inside a fake spacecraft that never moved, and by the end some had drifted so far out of sync that they were sleeping while the others were awake — exactly the kind of breakdown mission scientists were watching for.

A lone figure in a spacesuit sitting in a dim spacecraft interior.

On 3 June 2010, six men climbed into a windowless mock spacecraft in a Moscow research institute, and the hatch was sealed behind them. They did not come out for 520 days. The craft never moved. The mission, called Mars-500, was a full-length simulation of a round trip to Mars, and the most telling thing it produced was not about engines or orbits. It was about sleep.

By the end, the crew’s daily rhythms had pulled apart. At least one man was settling into a day noticeably longer than 24 hours, so his waking and sleeping hours slid steadily out of step with everyone else’s. For stretches, some of the crew were asleep while the others were up. That drift is exactly the kind of problem the scientists were watching for.

This is one simulation with six participants, not settled consensus about what happens on a real flight. The finding is worth taking seriously, but it should be read as a result from this study, not a rule about every crew.

What the experiment was for

Mars-500 was run by the Institute for Bio-Medical Problems of the Russian Academy of Sciences in Moscow, with the European Space Agency taking part. The six volunteers, three Russians, a Frenchman, an Italian, and a crew member from China, lived in a sealed habitat for 17 months, the length of a conservative Mars mission with the planet at a workable distance.

The point was never the hardware. With no way to leave and little to break the monotony, the experiment was built to study the part of spaceflight that engineering cannot fix: how people hold up, psychologically and physically, when they are shut in together with the same faces for a year and a half.

A team from the University of Pennsylvania, led by David Dinges and Mathias Basner, tracked the crew the whole way. Using wristwatch-like devices that recorded movement and light exposure, they gathered about 4.396 million minutes of data, and ran twice-weekly tests of alertness and fatigue. The results were published in the Proceedings of the National Academy of Sciences.

What happened to their sleep

The headline number is small and stark.

Of the six, only two kept what the researchers would call normal sleep across the whole mission.

“Only two out of the six had fairly normal, stable, well-timed, high-quality, adequate duration sleep periods,” Dinges said, “and the other four had some sort of disturbance.” One man’s body settled onto a day of roughly 25 hours, which is enough to walk his clock right around until he was awake at the wrong times relative to the crew. Another broke his sleep into two separate stretches inside each day. A third was simply not getting enough.

The drift was not a late wobble. Most of the disturbances appeared inside the first 180 days and then stayed. As the months wore on, the crew also became less active when awake, resting and sleeping more, a slide the researchers called hypokinesis.

It helps to be precise about what was and was not happening here. The crew kept to a 24-hour clock with a scheduled nightly sleep period. What they did not have was the thing that normally holds a human clock to 24 hours, the natural cycle of daylight and dark. Inside a sealed box, with the lighting under their own control, the body’s own slightly-longer-than-a-day rhythm had room to assert itself.

Why being out of sync is the dangerous part

A tired crew is one problem. A crew that is no longer awake at the same time is a different and arguably worse one.

On a real mission, the hours when everyone is alert together are the hours when the crew can handle an emergency as a team. As individual rhythms drift apart, that shared window shrinks. The person who has wandered onto a 25-hour day might be at his lowest when an alarm sounds, and the colleague who could help is asleep. The sedentary slide compounds it, because a crew that moves less stays less fit for the moment when fitness suddenly matters.

Dinges put the underlying risk plainly. “Just being in a chamber for 17 months, you can easily begin to drift in terms of your self-discipline or what activities are fun,” he said. “That we can’t have, because a crew has got to stay mentally and physically fit and capable of dealing with any emergency or event that might occur.” The crew did sharpen up around the simulated Mars landing and again near the end. It was the long, featureless middle that did the damage.

What the simulation could not reproduce

The limits here are real and worth stating, because they are the difference between a suggestive result and a settled one.

Six people is a very small group, and they were all men. More importantly, this was a chamber in Moscow, not a spacecraft. The crew faced no microgravity, no radiation, no genuine danger, and, whatever their discipline, some part of them knew the door could open in a true emergency. A real crew, three years from home with none of those reassurances, might fare better under the pressure or considerably worse. The simulation isolated confinement and routine while leaving out most of what makes deep space frightening.

What it shows cleanly is narrower, and still useful: shut capable, screened, motivated people in a box on a fixed schedule for 17 months, take away the sky, and their sleep starts to come apart in ways that would matter on a real flight.

The habitat as a home

The constructive finding is about design. If the natural light cycle is what keeps the human clock honest, then a spacecraft has to supply a convincing substitute, lighting that brightens and dims like an Earth day, alongside a schedule people actually keep.

Dinges framed it as a shift in what a spacecraft is for. “The habitat is going to have to be more than just a nice engineering environment,” he said. “It’s actually going to have to be a psychological, physiological, and behavioral home, and be like Earth in order to ensure they stay capable all the way to Mars and back.”

That is the open question a real mission will have to answer. A ship can be built to survive the trip to Mars. Whether it can be built to keep six people awake at the same time for three years is a harder thing to know, and Mars-500 is the closest look we have had at how quickly that can slip.

The post Six men spent 520 days sealed inside a fake spacecraft that never moved, and by the end some had drifted so far out of sync that they were sleeping while the others were awake — exactly the kind of breakdown mission scientists were watching for. appeared first on Space Daily.
  •  

NASA is on track to put humans back on the lunar surface for the first time in roughly 56 years by 2028— followed by the establishment of a sustained human presence near the Moon’s south pole in the 2030s — in a civilizational shift that would mark the first time in human history that our species has lived continuously on another world, rather than briefly visiting and returning home

The last human being to walk on the Moon stepped off the lunar surface at 5:40 AM Coordinated Universal Time on 14 December 1972. His name was Eugene Cernan. He was the commander of Apollo 17. As he climbed the ladder back into the lunar module, he said, “We leave as we came and, God willing, as we shall return, with peace and hope for all mankind.” In the 53 years since that moment, no human being has set foot on the Moon. The Apollo programme produced six successful crewed landings between 1969 and 1972, deposited 12 American astronauts on the lunar surface, and accumulated a cumulative total of approximately 80 hours of human presence on the Moon before being terminated for budgetary and political reasons. The return that Cernan invoked turned out to take substantially longer than anyone in 1972 expected.

According to Aerospace Global News’s coverage of NASA’s revised Artemis programme in early 2026, the agency has restructured its lunar return strategy substantially over the past several years. The Artemis programme, originally announced in 2017 and formally launched in 2019, set out to return humans to the Moon by the mid-2020s. The schedule has slipped repeatedly. Artemis I, an uncrewed test flight around the Moon, succeeded in November 2022. Artemis II, the first crewed mission of the programme, successfully sent four astronauts on a 10-day flyby of the Moon in April 2026 — the first crewed lunar mission since Apollo 17 in 1972, with NASA astronauts Reid Wiseman, Victor Glover, and Christina Koch and Canadian Space Agency astronaut Jeremy Hansen launching from Kennedy Space Center on 1 April and splashing down in the Pacific Ocean off the coast of California on 10 April after travelling approximately 695,000 miles and breaking the human distance-from-Earth record set by Apollo 13 in 1970. Artemis III, which was originally planned to be the first crewed lunar landing since Apollo, has been restructured into a 2027 rendezvous and docking test in low-Earth orbit. The first actual crewed lunar landing of the Artemis era will now be Artemis IV, scheduled for 2028 — subject to further delays that have been a recurring feature of the programme since its inception.

Why Artemis is not just Apollo redux

The structural difference between Apollo and Artemis is that Apollo was designed to win a race. Artemis is designed to stay. Apollo’s six successful lunar landings deposited 12 American astronauts on the lunar surface, who collectively logged approximately 80 hours of moonwalks across roughly 300 hours of total surface presence, spread across six missions over three and a half years, with individual missions lasting between 21 hours and 75 hours on the surface. The Apollo astronauts collected rocks, deployed scientific instruments, drove a lunar rover on the later missions, and returned home. Once the Cold War political imperative had been satisfied and the immediate scientific goals had been met, the programme was cancelled, the Saturn V rockets stopped being built, and the institutional capacity to send humans to the Moon was allowed to atrophy.

The Artemis programme is structured around a different objective. NASA’s stated long-term goal is what the agency calls “sustained human presence” at the lunar south pole — meaning multiple missions per year, progressively longer surface stays, a lunar habitat module, infrastructure for refuelling and resupply, and eventually a permanent base from which scientific and exploration activities can be conducted on a continuous basis. The Artemis landing site is specifically the south polar region of the Moon, which is scientifically and strategically valuable because permanently shadowed craters in the area contain substantial deposits of water ice. Water ice can be split into hydrogen and oxygen, which can be used as breathable air, drinking water, and rocket propellant. A lunar base with access to water ice can, in principle, sustain itself far more cheaply than a base that must have all its supplies launched from Earth.

The new mission architecture

Per BBC Sky at Night Magazine’s analysis of the Artemis III restructuring, the central technical challenge that has driven the schedule changes is the development of the commercial lunar landers. NASA has contracted with SpaceX (which is developing a lunar variant of Starship) and Blue Origin (which is developing the Blue Moon lander) to provide the actual surface-landing capability. Both vehicles are still under active development. SpaceX’s Starship must demonstrate several critical technologies before it can be used for a crewed lunar landing — including cryogenic fuel transfer in orbit, autonomous docking with the Orion crew capsule, and at least one successful uncrewed landing on the lunar surface. The cumulative technical demands have pushed the realistic timeline for the first crewed Artemis landing well beyond the original 2024 target, and the restructured Artemis III rendezvous-and-docking test in 2027 is intended to demonstrate the orbital procedures that the eventual landing mission will require.

The geopolitical context has also shifted substantially since the Artemis programme began. China’s space programme has announced a target of landing its own astronauts on the Moon by 2030 — the first crewed lunar landing in Chinese history, and a milestone that would substantially close the gap with the United States in space capability. China is also developing the International Lunar Research Station (ILRS) in partnership with Russia and several other countries, with completion targeted for the 2030s. The lunar south pole, with its water ice and its strategic value as a base for further exploration, is the destination for both programmes. The competing timelines mean that the next decade of lunar activity will involve at least two distinct national efforts converging on the same small region of the Moon.

What “sustained presence” actually means

As reported by World Today News’s coverage of the Artemis timeline and goals, the path from a single Artemis IV landing in 2028 to genuine sustained human presence on the Moon involves a long sequence of additional missions, infrastructure deployments, and technological developments that NASA’s current programme has scheduled into the 2030s. The agency’s planning documents anticipate progressively longer crewed surface stays, the deployment of habitat modules that can support multi-month occupancy, lunar surface mobility systems for exploring beyond the immediate landing area, in-situ resource utilisation systems that can extract and process water ice into usable resources, and eventually a permanent lunar outpost from which continuous human occupation becomes possible.

Whether the species will actually achieve sustained lunar presence in the 2030s remains genuinely uncertain. The Artemis programme has slipped repeatedly. The development of the commercial landers continues to be technically demanding. The political and budgetary support for the programme has fluctuated across administrations. China’s competing programme adds geopolitical pressure that may accelerate or complicate the US timeline depending on how the relationship between the two space programmes develops. What is no longer uncertain is the basic strategic direction: the leading human space programmes are now committed, at least in principle, to making the Moon a place where humans live rather than a place where they briefly visit. If that commitment holds, the next decade will produce the first sustained off-world human presence in the history of the species — a transition that would be, in civilisational terms, at least as significant as the first lunar landing itself was in 1969. The first Moon landing required getting there. This one requires staying.

The post NASA is on track to put humans back on the lunar surface for the first time in roughly 56 years by 2028— followed by the establishment of a sustained human presence near the Moon’s south pole in the 2030s — in a civilizational shift that would mark the first time in human history that our species has lived continuously on another world, rather than briefly visiting and returning home appeared first on Space Daily.
  •  
❌